
Abstract
The primary aim of this study was to investigate the stability of the six-repetition maximum (6RM) deadlift over the length of a five-day microcycle and whether the fatigue induced by maximal effort testing detrimentally impacted preparedness. Twelve participants performed four testing sessions, comprising a one-repetition maximum test and three 6RM tests separated by 48 hours. Countermovement jumps were performed before each testing session, and barbell velocity was measured during each warm-up set to assess changes in preparedness. The 6RM deadlift was not statistically different between any of the testing sessions (p = .056; ηp2 = 0.251). Similarly, there were no significant differences in jump height or other CMJ variables between sessions (p > .05). There were small to moderate differences in mean barbell velocity between the first and second 6RM test (g = 0.24–0.88), while there were only small differences in mean velocity (MV) between the second and third 6RM test at some of the warm-up loads (40% 6RM: g = 0.20; 80% 6RM: g = −0.47). Taken collectively, these data indicate that 6RM deadlift strength is stable over five days and does not appear to induce sufficient fatigue to impact vertical jump performance or rating of perceived exertion despite some changes in barbell velocity.
Introduction
Resistance training is prescribed by strength and conditioning professionals when seeking to improve the physical qualities that underpin successful sports performance. To achieve this goal, resistance training loads have typically been prescribed as a function of a known maximum (i.e., the athlete's one repetition maximum (1RM)).1,2 Although this is the traditional method of prescribing resistance training loads, some researchers have suggested that 1RM testing is excessively dangerous for non-strength athletes and that relative intensities based upon the 1RM do not adequately account for day-to-day fluctuations in strength.3,4
When the literature is carefully examined, however, 1RM strength does not appear to be as highly variable as suggested by some authors.5–7 For example, Banyard et al. 5 reported that back squat 1RM did not differ meaningfully when assessed three times within the course of a five-day microcycle. Vernon et al. 6 reported that back squat 1RM was not meaningfully different from baseline at any point in the 96 hours after a resistance training bout consisting of five sets of five squats performed with 80% 1RM. Similarly, Ruf et al. 7 reported that the deadlift 1RM did not differ between days. Taken collectively, 1RM strength does not appear to vary day-to-day by a magnitude likely to affect the prescription of training loads when using traditional percentage-based methods.
It is, however, important to note that an athlete's 1RM is not the only test used by strength and conditioning professionals to prescribe training loads. Often, a percentage of the RM corresponding to the number of repetitions prescribed in a set is used (e.g., 4 × 6 at 80–85% 6RM).8–10 Moreover, given the absolute loads used as part of 1RM testing, strength and conditioning professionals often opt to use higher volume testing protocols such as a 5 or 6 RM test when assessing dynamic maximum strength. 1 Given the increase in volume this entails compared to 1RM testing and the performance of an increased volume of resistance exercise to volitional failure, it is plausible that there is an increase in accumulated fatigue associated with this form of strength testing. 11 An increase in fatigue induced by moderate volume strength testing may, in turn, impact both the athlete's day-to-day maximum strength but also their preparedness to train. 6 Preparedness is commonly assessed by monitoring whether changes in vertical jump performance, 12 changes in barbell velocity, 6 or changes in rating of perceived exertion (RPE) occur in response to training. 13 If moderate volume RM strength displays an increased level of variability in comparison to a 1RM because of any increase in fatigue, this would detrimentally impact the ability of strength and conditioning professionals to use the results from these tests to accurately prescribe training loads.
As such, the primary aim of this study was to determine whether 6RM deadlift strength varied over a five-day microcycle where repeated maximal strength tests occurred. We also aimed to assess the impact of moderate volume xRM testing (i.e., the 6RM) on common subjective and objective markers of preparedness such as vertical jump performance, 14 barbell velocity6,15 and perceived exertion. 16 We hypothesised that 6RM strength and CMJ jump height would not change meaningfully over the course of the microcycle, while phase-specific CMJ variables, along with barbell velocity and RPE during each warm-up set, would differ between sessions.
Methods
Experimental approach
A within-participant repeated measures design was used to determine whether 6RM deadlift strength changed over the course of a five-day microcycle. Participants volunteered to attend the laboratory on four occasions in this study. During the first session (T1), signed informed consent was obtained, anthropometric data (height, body mass, etc.) was recorded, and the participant's 1RM was assessed. The next three sessions (T2–T4) entailed the assessment of the participant's 6RM deadlift strength on each occasion, with barbell velocity captured during each warm-up and maximal effort repetition. Before commencing each of the 6RM deadlift tests, participants performed a series of maximal CMJs, which served as a measure of preparedness.6,17 Sessions T1 and T2 were separated by 72 hours, and sessions T2 to T4 were each separated by 48 hours. All sessions were performed at the same time of day (±1 hour) to account for any diurnal effects. Participants were instructed to maintain the same dietary intake on the day of each testing session and to not perform lower-body exercise for the 48 hours preceding each session.
Participants
Based on a detectable effect size (ES) of f = 0.2, an alpha level of α = 0.05, an expected strong correlation between repeated measures (r = 0.9), and an expected power of 0.8 (1 − β = 0.82), a minimum sample size of 10 participants was estimated using G*Power software (Version 3.1.9.4). 18 To account for a potential 20% drop-out rate, 12 male participants (age = 27 ± 5 years, body mass = 87.9 ± 13.8 kg; height = 1.76 ± 0.07 m, 1RM deadlift = 172.3 ± 26.3 kg, relative 1RM = 2.0 ± 0.2 kg kg−1) were recruited to take part in this study. Participants were included in the study if they were between the ages of 18 and 40, could deadlift >1.5 × body mass, and had been performing regular resistance training for more than 1 year. Before undertaking any experimental protocols, participants were provided information regarding the potential risks and benefits of participating in the study and voluntarily returned signed informed consent, according to the approval granted by the Edith Cowan University Human Research Ethics Committee (Project 2020-01193).
Countermovement jump testing and analysis
After a standardized dynamic warm-up containing bodyweight (BW) exercises, dynamic stretches, and submaximal vertical jumps, participants performed five maximal CMJs while standing on dual portable force plates (PS-2141, PASCO Scientific, CA, USA). 19 Participants were instructed to stand as still as possible with their hands on their hips for at least 1 second before a countdown of ‘3, 2, 1, Jump!’. 17 Upon receiving the ‘Jump!’ instruction, participants jumped ‘as high and as fast as possible’. Each trial was separated by one minute of rest. Trials were repeated if a stable pre-jump force trace was not maintained or the participant's hands left their hips during the movement. 17 Unfiltered vertical ground reaction force data were collected at 1000 Hz using PASCO Capstone software (Version 2.3; PASCO Scientific, CA, USA) and exported for offline analysis as a summated force-time curve in a custom Excel spreadsheet (Microsoft Corp, WA, USA). BW was calculated as the average force during a 1-second quiet standing period. 20 The first meaningful change in force was identified as BW ± 5 SDs. 17 A backward search of the force-time data was then performed to identify the last instance of BW, which indicated the start of the jump. 20 Impulse was calculated by integrating net force with respect to time using the trapezoid rule. 21 Centre of mass velocity was then calculated by dividing successive samples of impulse by body mass. 21 Centre of mass displacement was calculated by integrating the centre of mass velocity with respect to time using the trapezoid rule. 21 Take-off and landing were identified according to the methods outlined by Lake et al. 19 and subphases of the CMJ were identified based on previous recommendations. 22 Jump height (JH) was calculated from the vertical velocity at take-off plus the vertical displacement of the subject's centre of mass at take-off. 23 Mean force during each CMJ subphase, time-to-take-off, and eccentric displacement (i.e., lowest centre of mass position) were used to assess changes in jump strategy between each testing session.17,22 The average of the five trials was used for statistical analysis. 24
As the use of discrete variables may mask the presence of fatigue, 25 the CMJ force-time curves were trimmed in a custom R script (Version 4.2) 26 and exported as text files for statistical analysis as a continuous waveform. Specifically, trials were trimmed to between movement onset (first sample where force was <97.5% BW) and take-off (the first sample where force <20 N).22,25 The trimmed force-time curve data were smoothed using a fourth-order, zero-lag digital Butterworth filter with a 36 Hz cut-off frequency. 27 This cut-off frequency was determined via residual analysis.28,29 After net force was calculated by subtracting BW from the force-time curve and subsequently divided by individual body mass to account for differences in body mass between participants, the trials were then time-normalised to 101 nodes (0–100% of movement time) and exported as text files for statistical analysis.
Maximum strength testing
1RM deadlift testing during T1 was performed according to the methods outlined by Ruf et al. 7 Briefly, participants performed three repetitions with a standard Olympic barbell and plates (Eleiko, Halmstad, Sweden), at 20, 40, and 60% of their estimated 1RM. Single repetitions were then performed at 80 and 90% of their estimated 1RM. A maximum of five 1RM attempts were allowed, with 5 minutes of rest between each attempt. During the 6RM testing sessions, participants performed a modified version of the protocol outlined by Haff. 1 Participants performed five repetitions at 40% of their estimated 6RM, five repetitions at 60% of their estimated 6RM, three repetitions at 80% of their estimated 6RM, and three repetitions at 90% of their estimated 6RM. The first 6RM attempt in T2 was set at ∼83% of the participant's 1RM. 30 It took an average of 2.3 attempts to attain the participant's 6RM, with an average final load of 86% 1RM. During T3 and T4, the load for the first 6RM attempt was set at the last successfully performed attempt in the preceding session. During all repetitions, participants were instructed to perform the concentric phase as fast as possible while keeping their feet flat on the ground. 7 If a 1RM or 6RM attempt was successful, the load was increased by a minimum of 2.5 kg, with the exact magnitude determined through discussion between the participant and the investigator. If an attempt was unsuccessful, the participant was allowed one further attempt at the same load. The load of the last successful attempt was recorded and used for subsequent analysis. After each warm-up set and maximal attempt, RPE was recorded.31,32 Three minutes of rest was allotted between warm-up sets and 5 minutes of rest was allotted between maximal attempts.1,7 Further, ∼1.5 seconds separated each repetition during the 6RM test to ensure the participant did not ‘bounce’ the barbell. 33 Barbell velocity was recorded during all sets using a GymAware PowerTool (Kinetic Performance, Canberra, Australia) that was attached to the centre of the barbell and interfaced with a tablet device (iPad Mini; Apple Inc, CA, USA) via Bluetooth. 34 Mean velocity (MV) was automatically calculated as the average velocity over the concentric phase by the manufacturer's proprietary software.
Statistical analyses
After checking the normality of distribution via visual inspection of Q-Q plots and the Shapiro–Wilk test, differences in 6RM deadlift strength, JH, mean force during each CMJ subphase, eccentric displacement, and time-to-take-off between testing sessions were assessed using separate 1 × 3 (time) repeated measures analysis of variance (ANOVA). Where the assumption of sphericity was violated, the Greenhouse–Geisser correction was applied. Significance was set at p < .05. Where non-normal distributions occurred (eccentric displacement, concentric mean force), differences between sessions were assessed using a Friedman test. Differences between sessions in RPE during each warm-up set were also assessed using a Friedman's test. Differences between sessions in barbell MV were assessed by calculating Hedges g ESs,
35
with the magnitude of the difference interpreted as trivial (<0.2), small (0.2–0.6), moderate (>0.6–1.2), large (>1.2–2.0) and very large (>2.0).
36
ESs were also used to assess the magnitude of any difference found for the other dependent variables. Statistical analyses were performed in the R programming language (Version 4.2).
26
Repeated measures ANOVAs were performed using the afex package (Version 1.1–1),
37
Friedman's tests were performed using the PMCMRplus package (Version 1.9.4),
38
and ESs were calculated in a custom script.
35
Bias corrected and accelerated 95% CIs for the ESs were calculated via bootstrap resampling.
39
The smallest detectable difference was calculated as
Waveform analysis of the CMJ net force-time curve data was performed via statistical parametric mapping (SPM) using the open-source spm1d Python package (Version 0.4.8). 45 Differences in net force-time curve data between sessions were assessed using a 1 × 3 (session) repeated measures ANOVA, with significance set at p ≤ .05. The scalar output statistics (SPM[F]) were calculated to determine the magnitude of the difference between data. Where they crossed the critical threshold {F}, the null hypothesis was rejected.
Results
There were no significant differences in deadlift 6RM between sessions (p = .056; ηp2 = 0.251) (Figure 1). Further, CMJ jump height (p = .451; ηp2 = 0.07), time-to-take-off (p = .207; ηp2 = 0.134), eccentric displacement (χ2 = 2.167; p = .339), yielding mean force (p = .249; ηp2 = 0.12), braking mean force (p = .451; ηp2 = 0.065), and concentric mean force (χ2 = 2.167; p = .339) were not significantly different between testing sessions (Figure 2). There were also no significant between-session differences in RPE during any of the warm-up sets (Figure 4). There were no significant differences between sessions in the net force-time curve during the CMJ (Figure 5).
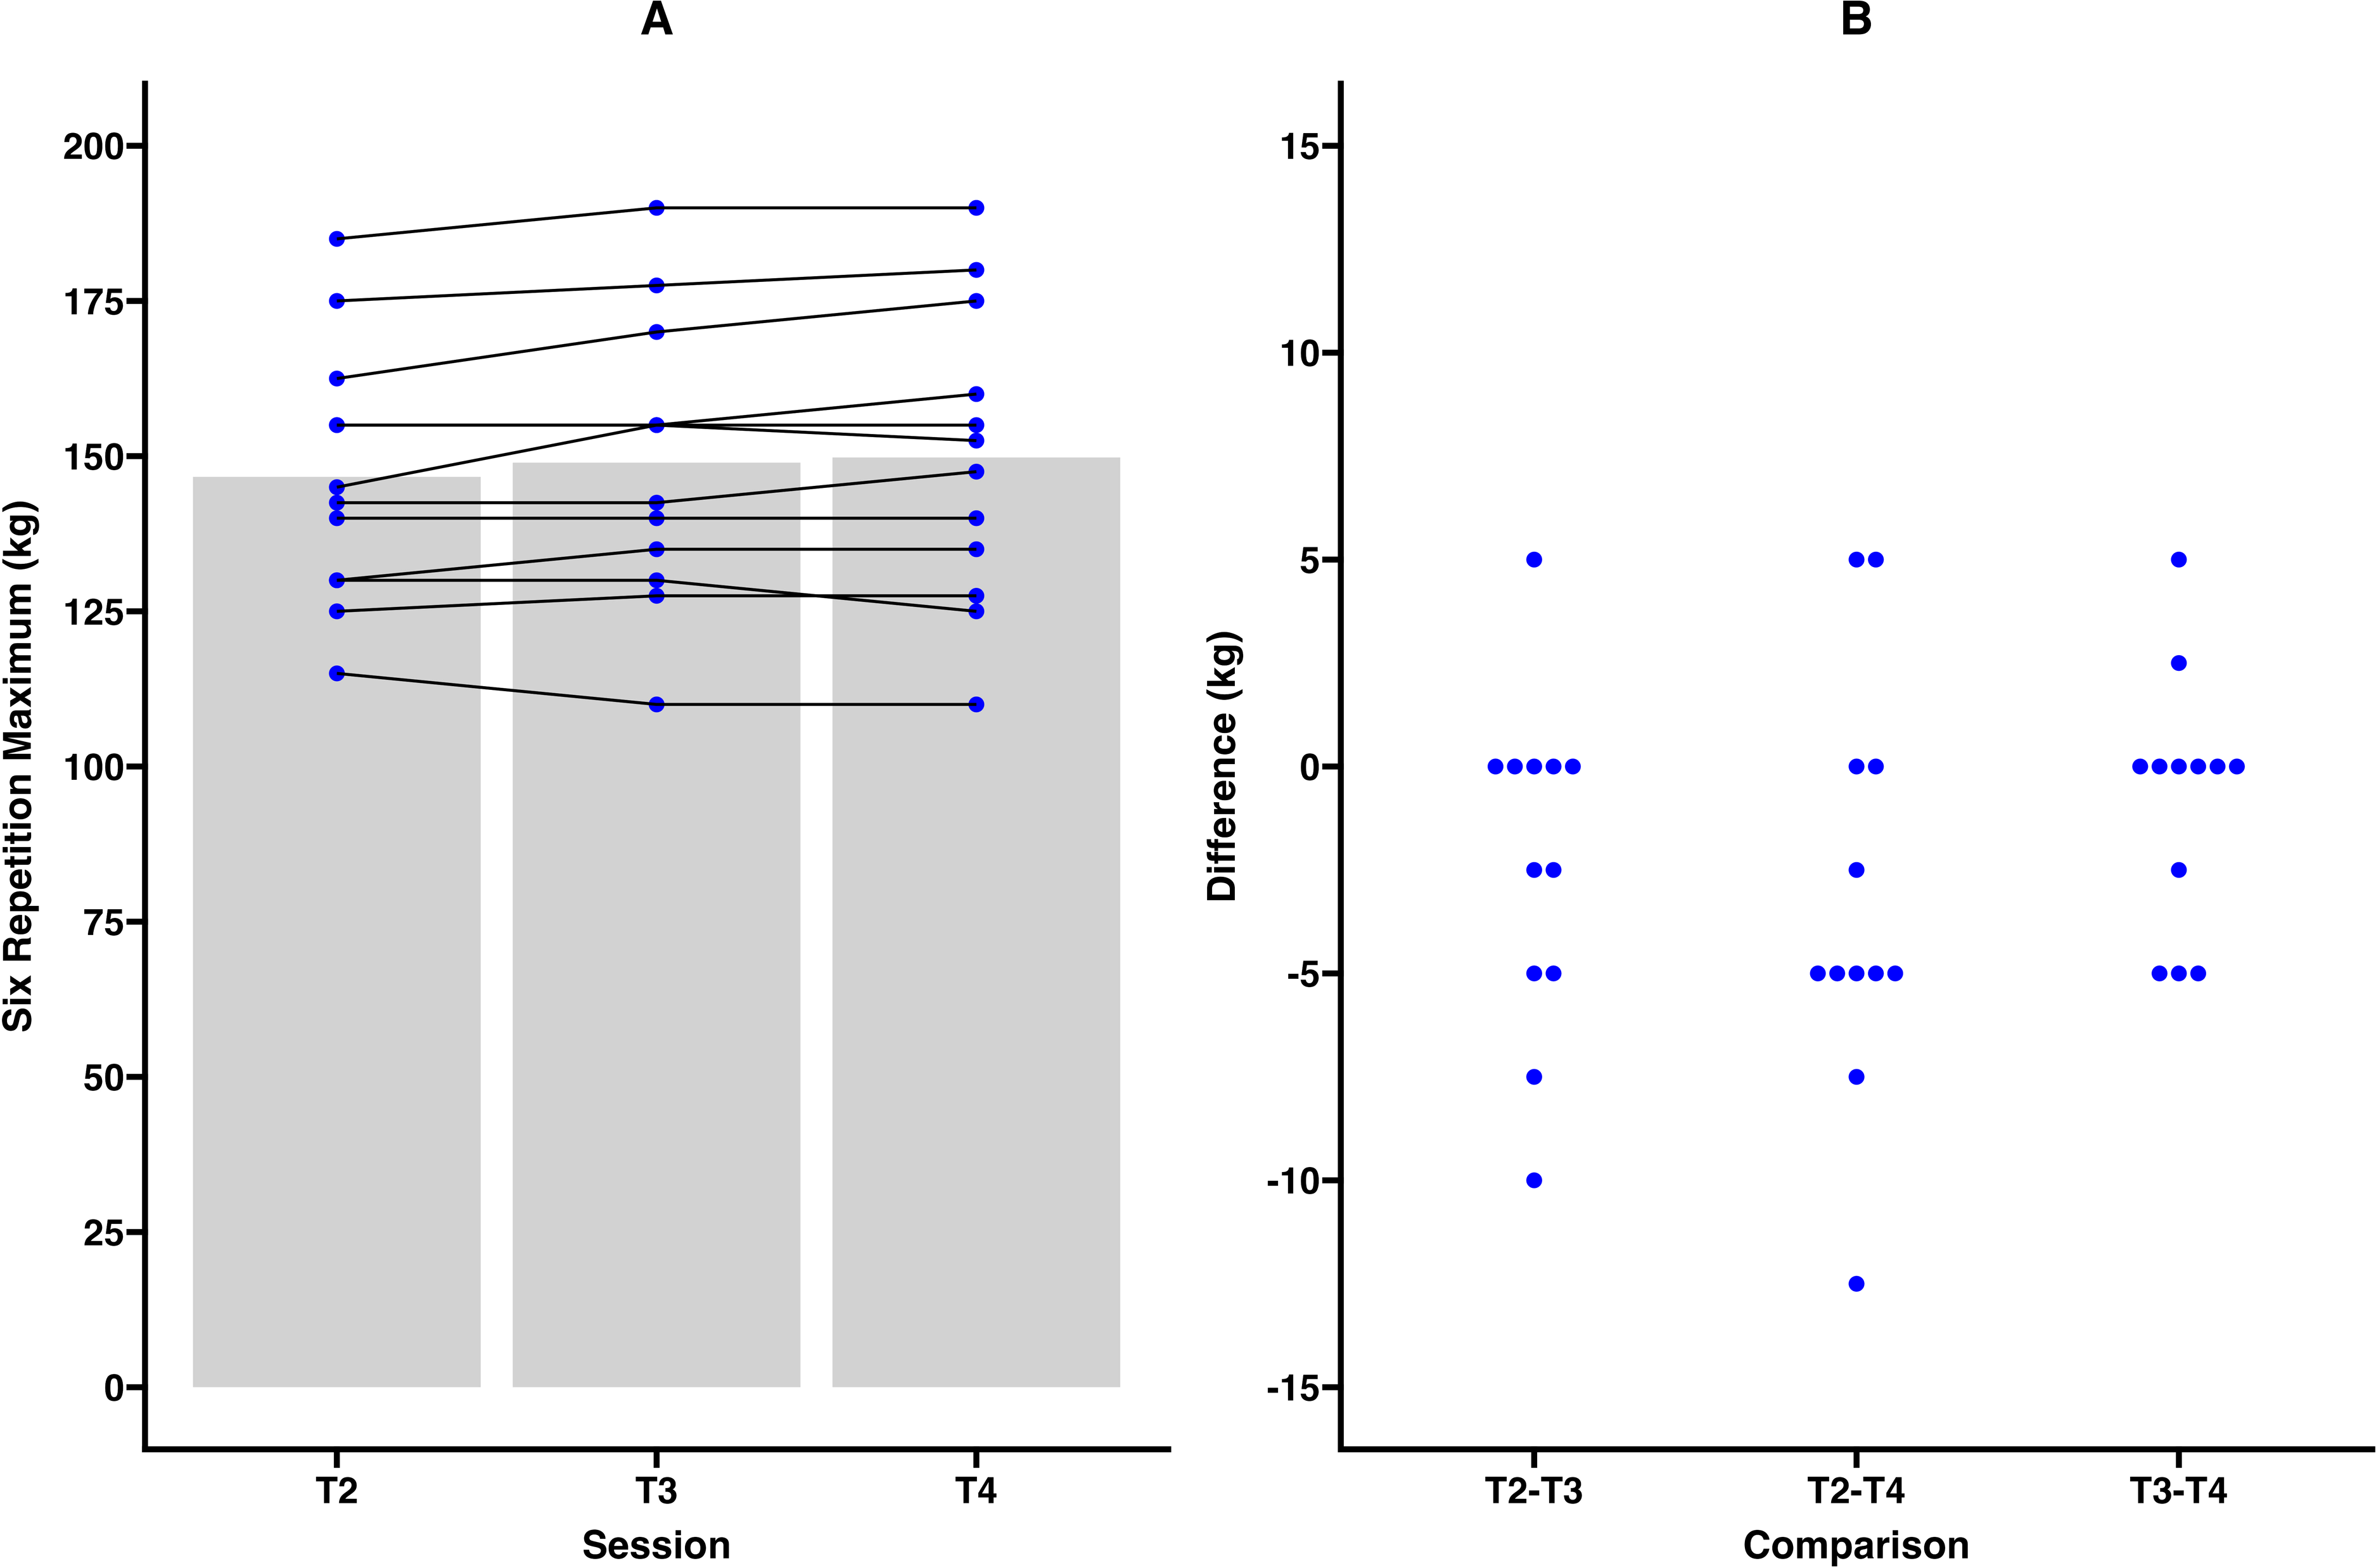
(A) Six repetition maximum (6RM) results from each session; (B) Differences between 6RM results between each session. The blue dots represent the results of individual participants, while the grey bars represent the mean 6RM for each session.
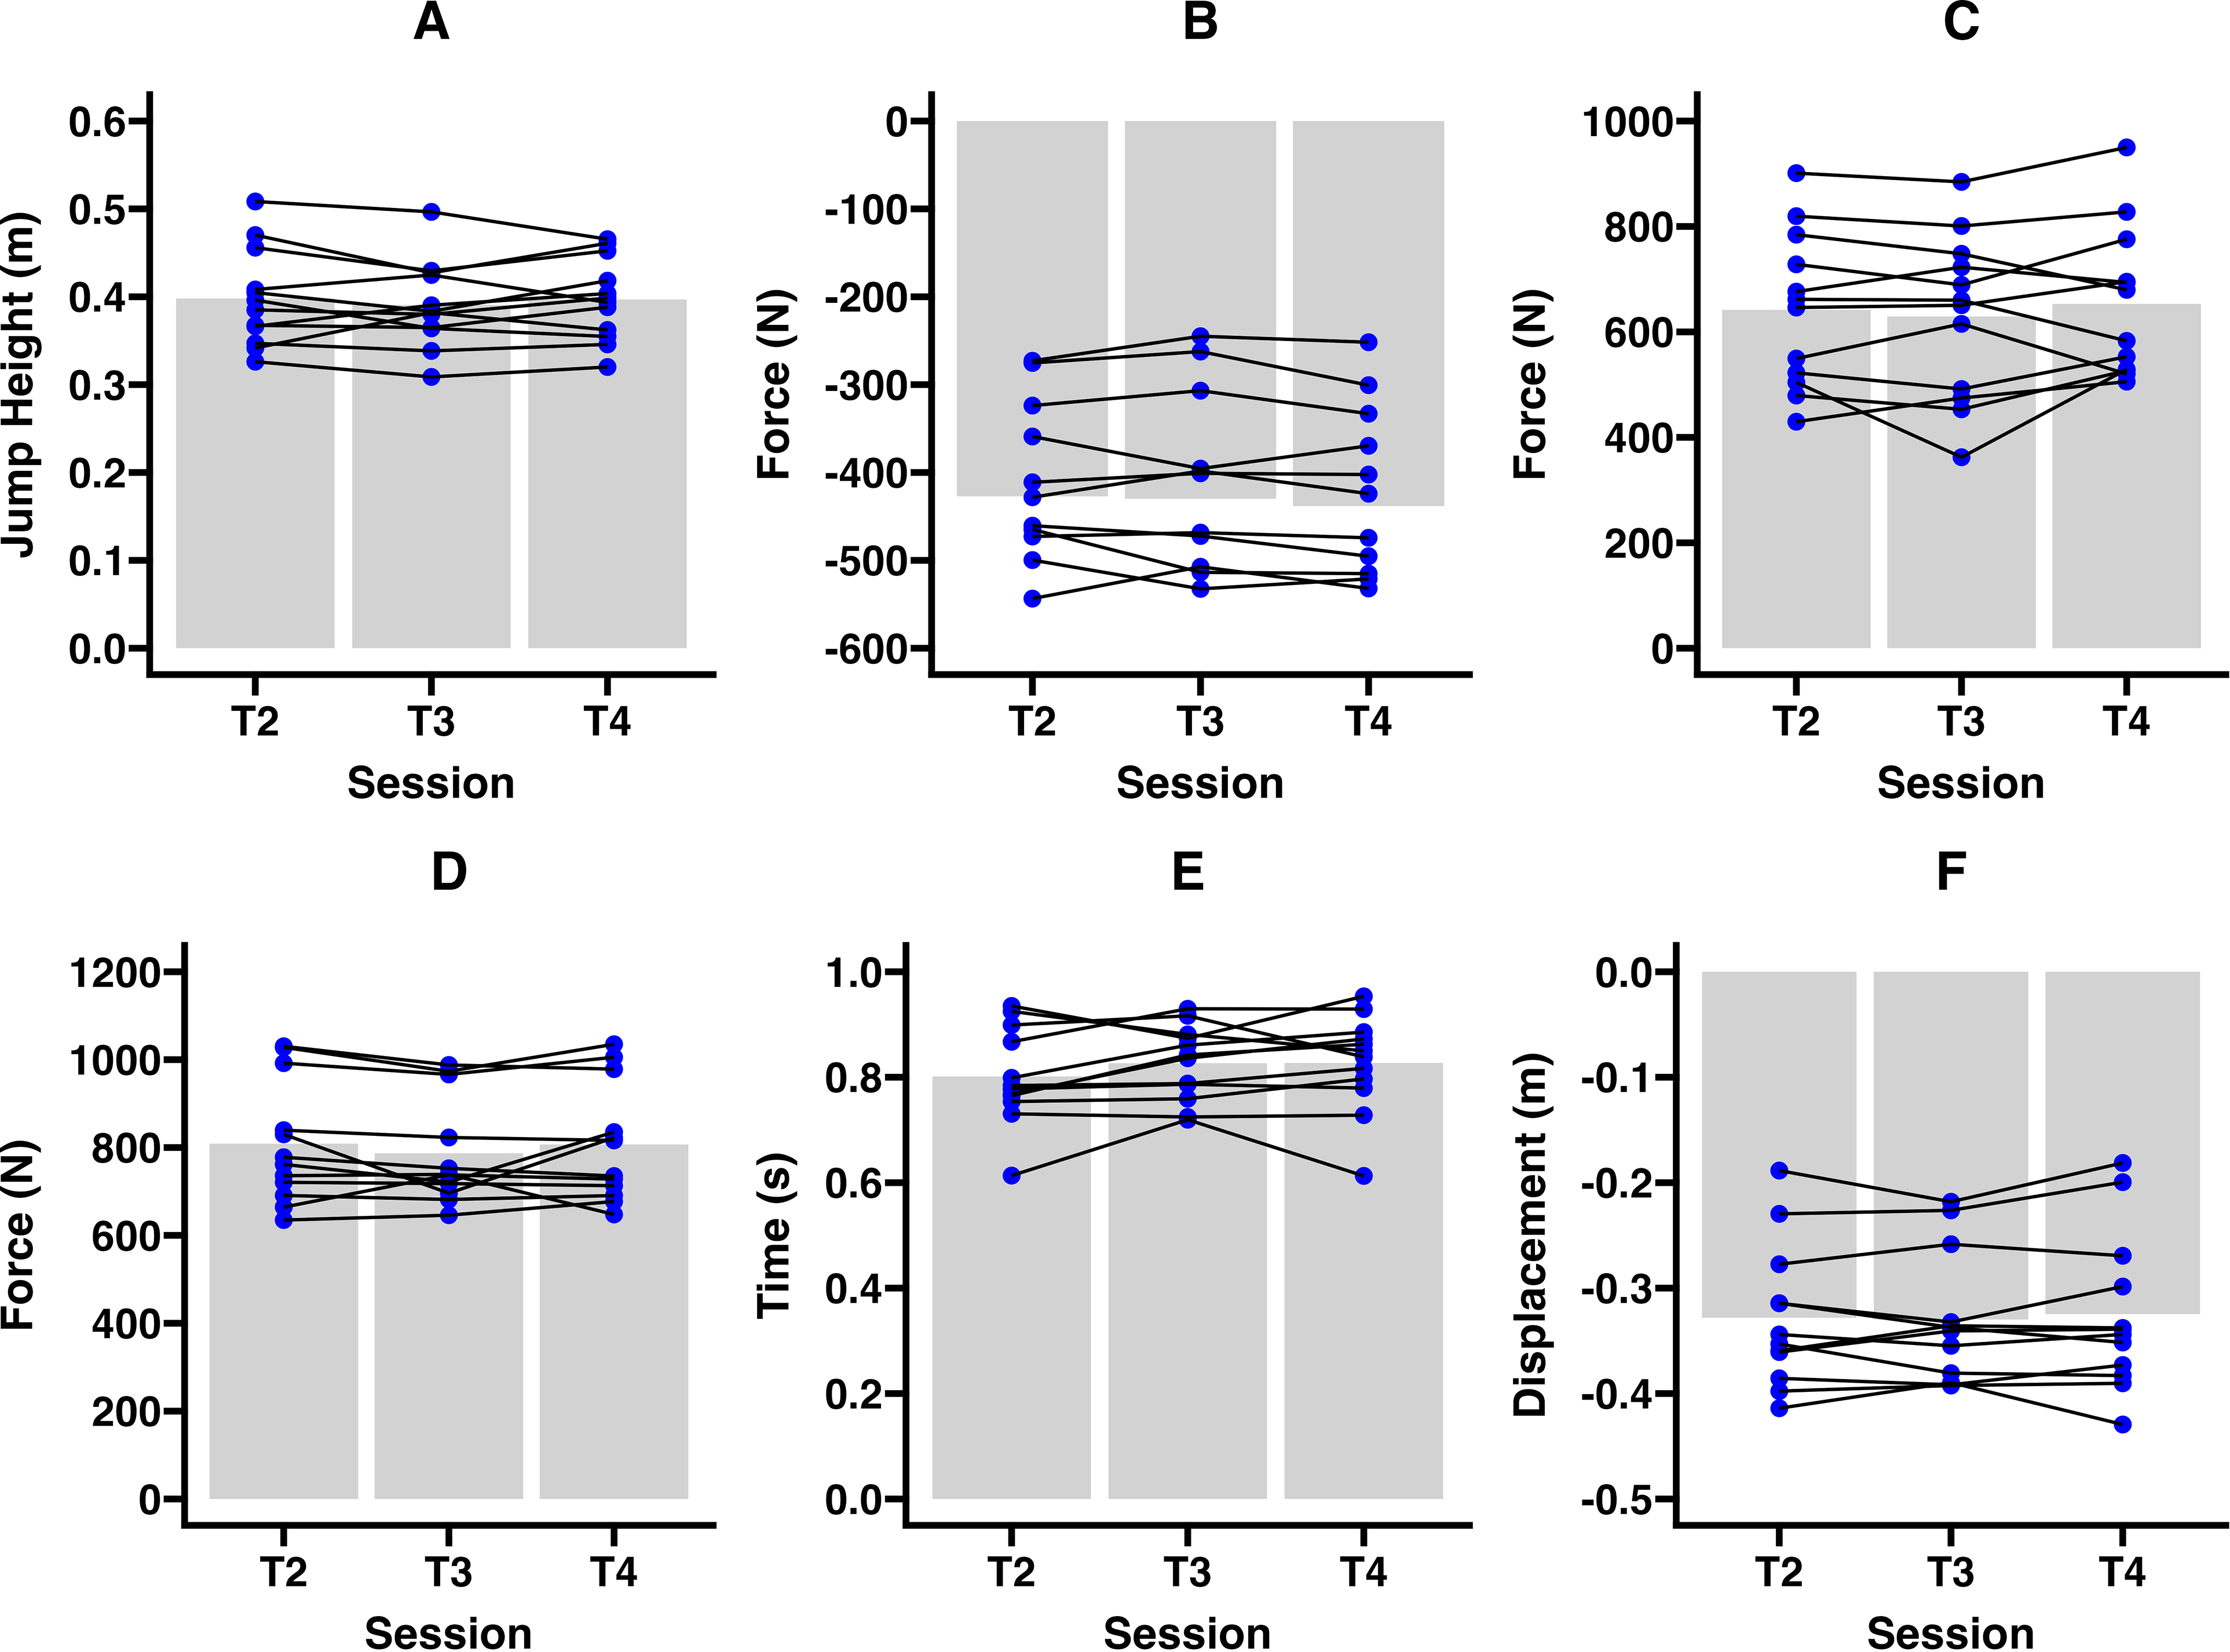
Countermovement jump variables in each session. (A) Jump height; (B) yielding mean force; (C) braking mean force; (D) concentric mean force; (E) time-to-take-off; and (F) eccentric displacement. The blue dots represent individual values for each participant, while the grey bars represent the mean value for each metric in that session.
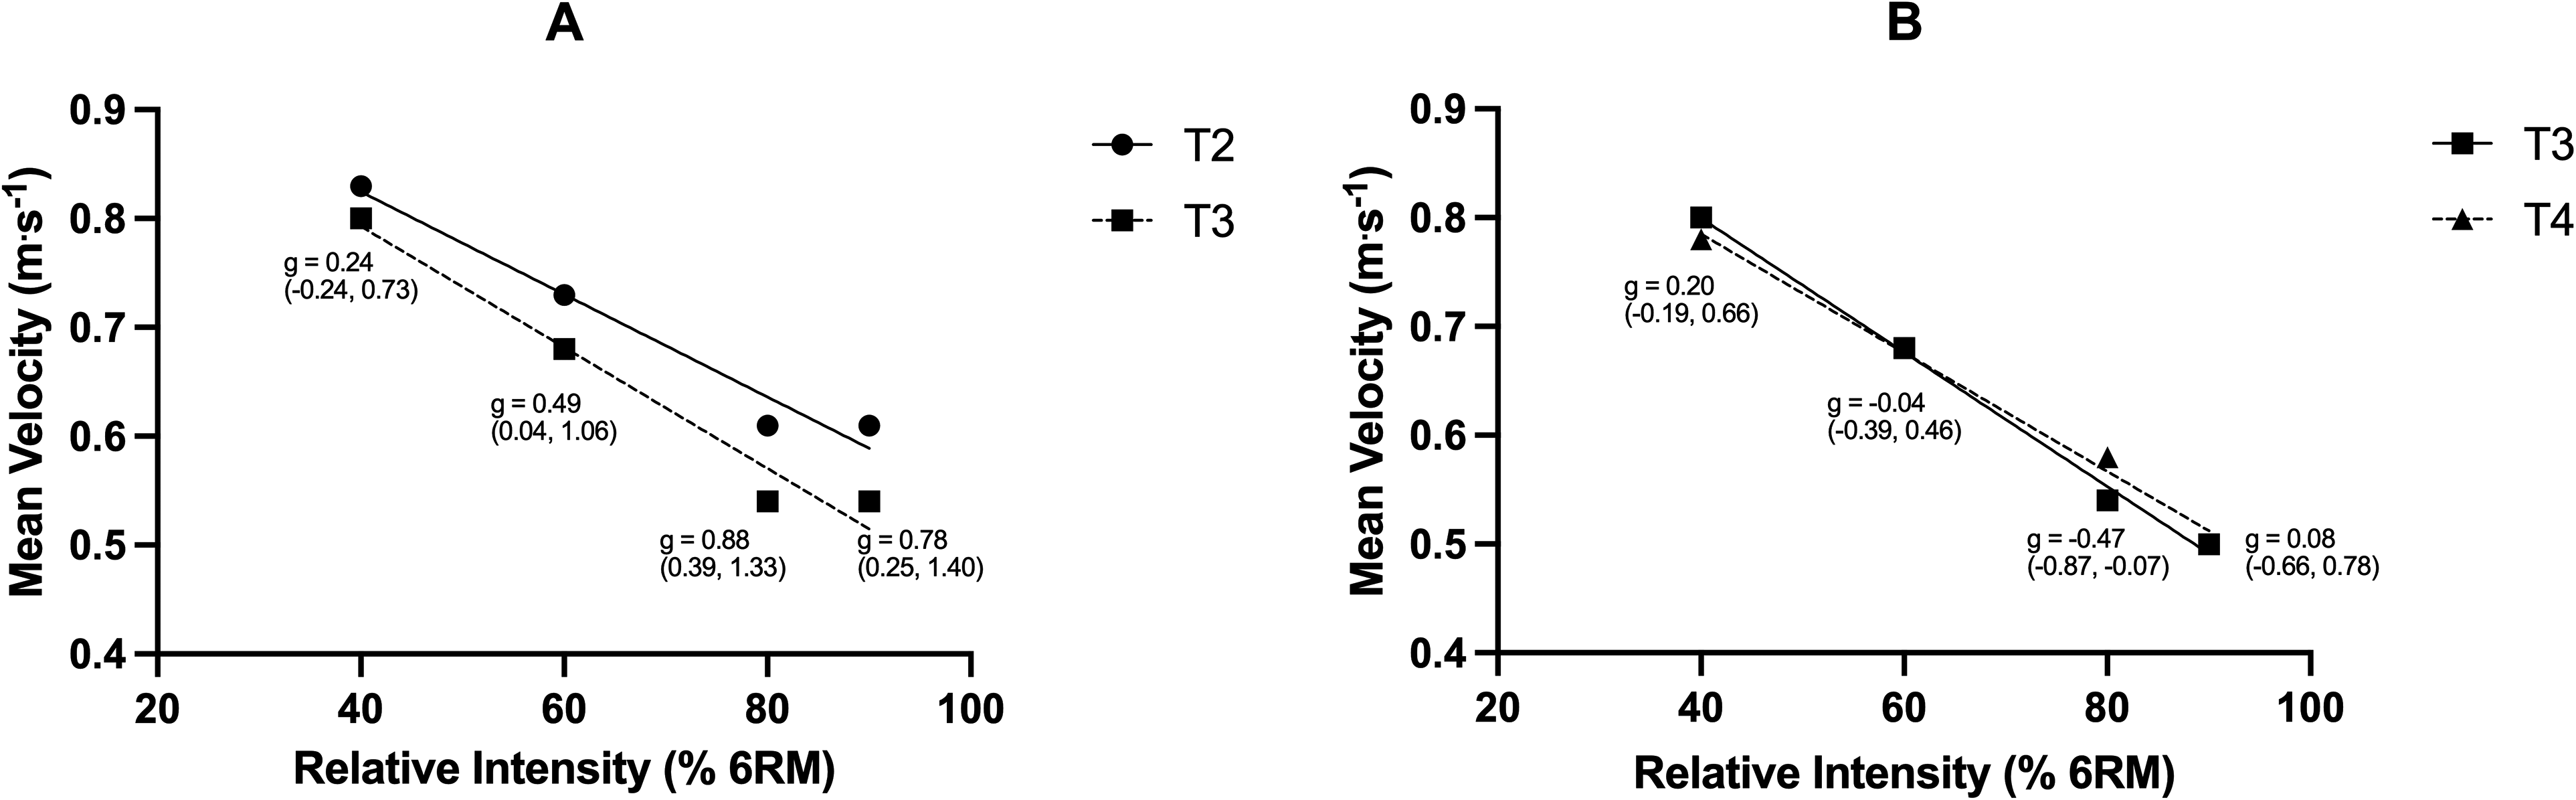
Effect size comparisons between mean velocity during each warm-up set. g = Hedges g effect size.
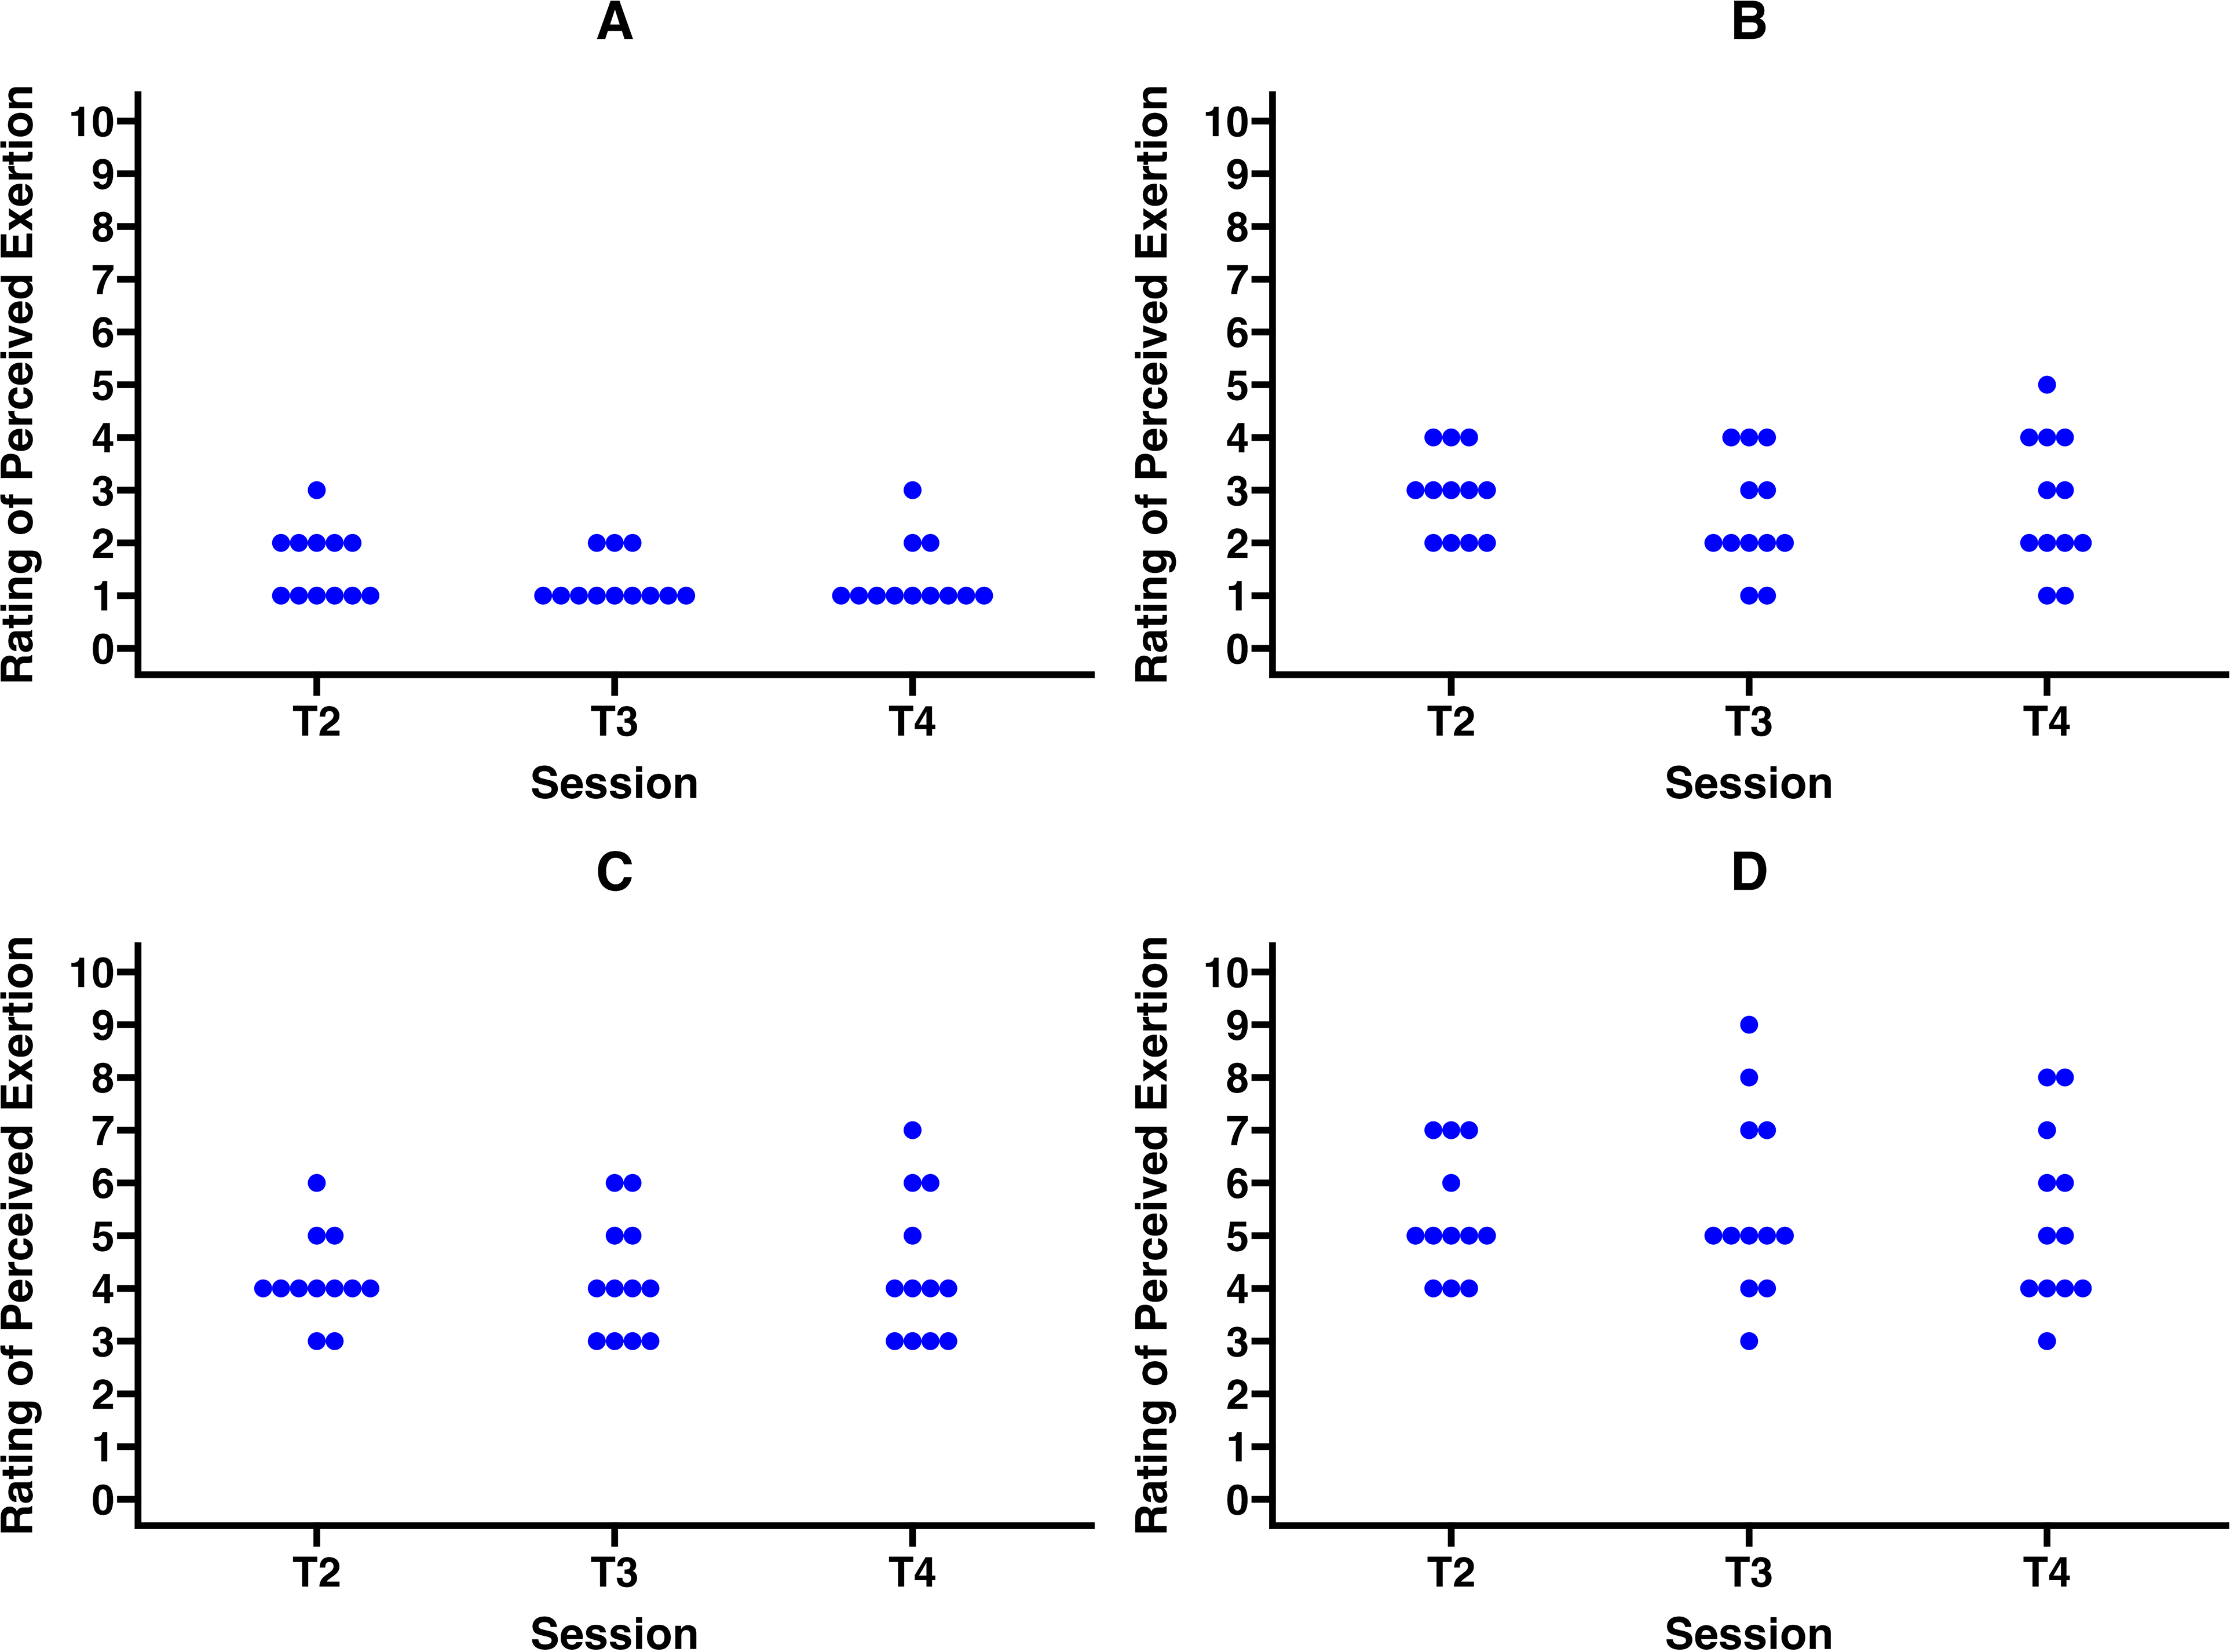
Rating of perceived exertion (RPE) responses during each warm-up set. (A) 40% 6RM; (B) 60% 6RM; (C) 80% 6RM; (D) 90% 6RM. The blue dots represent the individual RPE responses of each participant in the study.
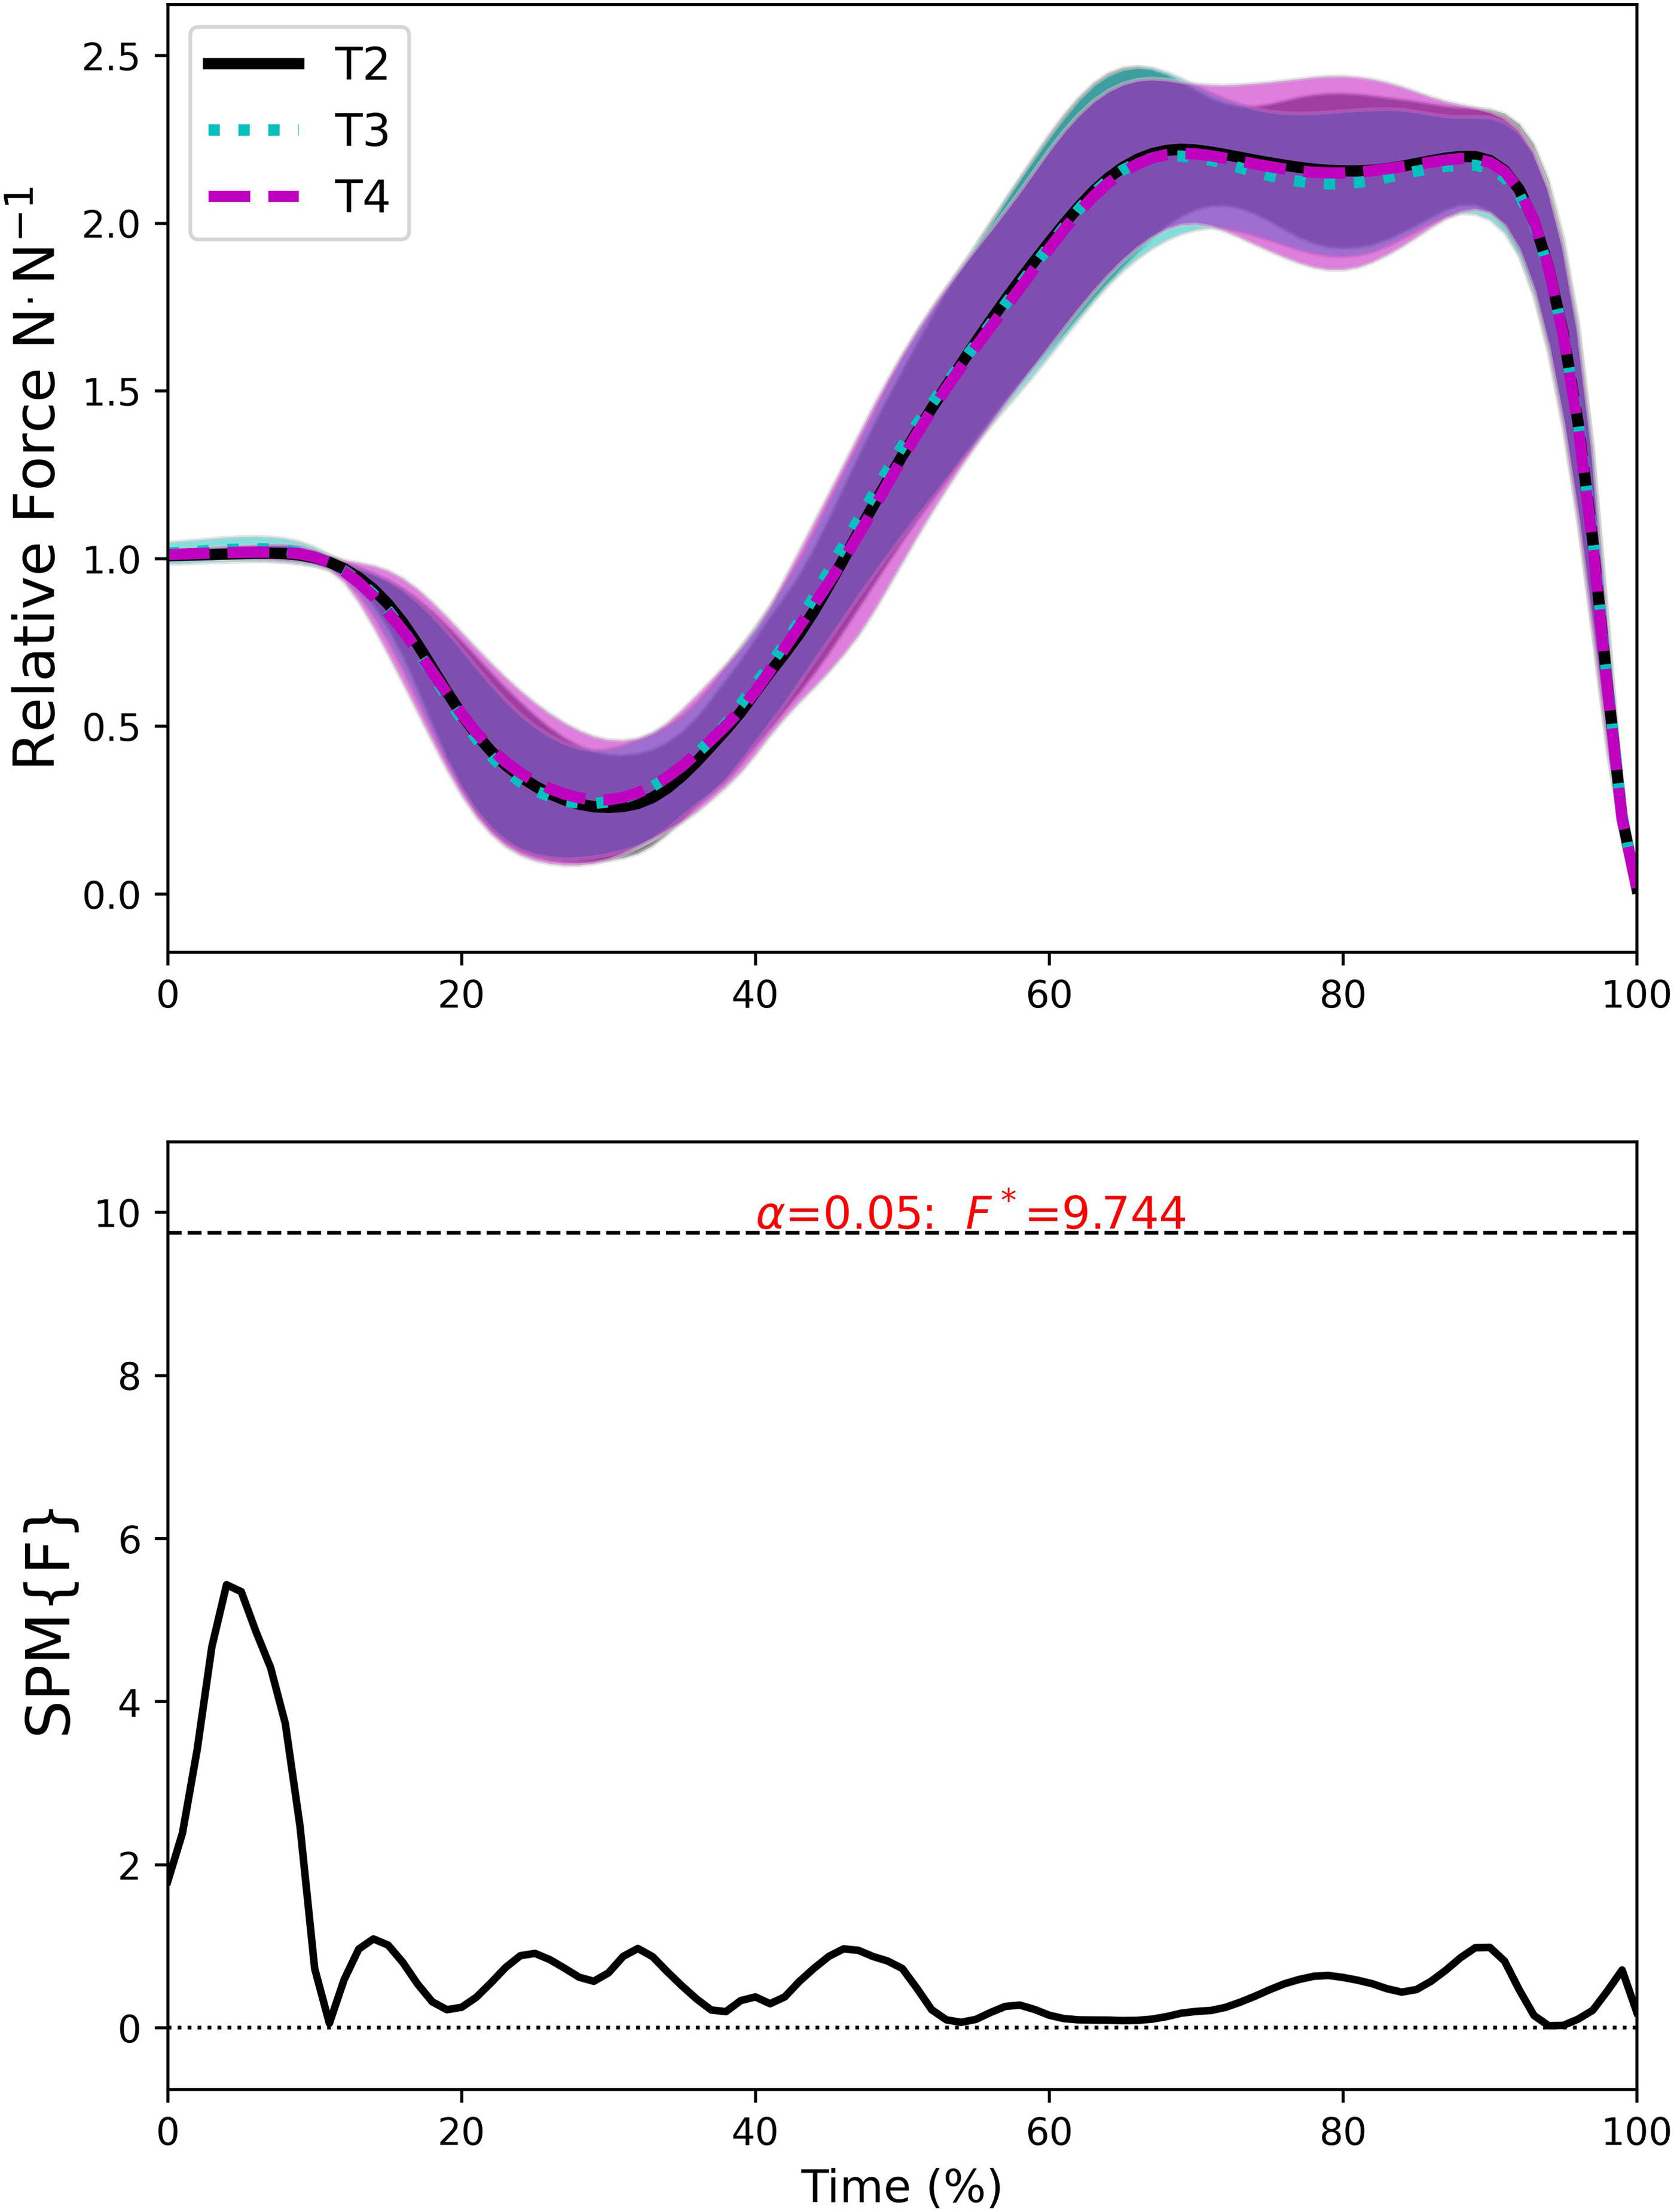
Time-normalised relative force-time curves during the countermovement jump from each 6RM testing session (upper panel) and the associated SPM repeated measures ANOVA F statistic {F} for differences between the curves (lower panel). SPM: statistical parametric mapping; ANOVA: analysis of variance.
There were small differences in MV at 40% 6RM and 60% 6RM and moderate differences in MV at 80% and 90% 6RM between T2 and T3 (Figure 3). At all relative intensities, MV was faster during T2 than T3. Small differences in MV at 40% 6RM were found between T3 and T4, with slower MV during T4. There was a small difference in MV at 80% 6RM, with a faster MV occurring in T4. There were trivial differences in MV at 60 and 90% 6RM between T3 and T4 (Figure 3). Excellent relative reliability and good CV values were found for the deadlift 6RM (Table 1). Moderate relative reliability was found for jump height, along with good CV values (Table 1). Moderate to good relative reliability and good to poor CVs were found for the mean force during each CMJ sub-phase (Table 1). MV during each warm-up set demonstrated poor to moderate relative reliability and moderate to poor CVs (Table 1).
Reliability statistics for all variables.
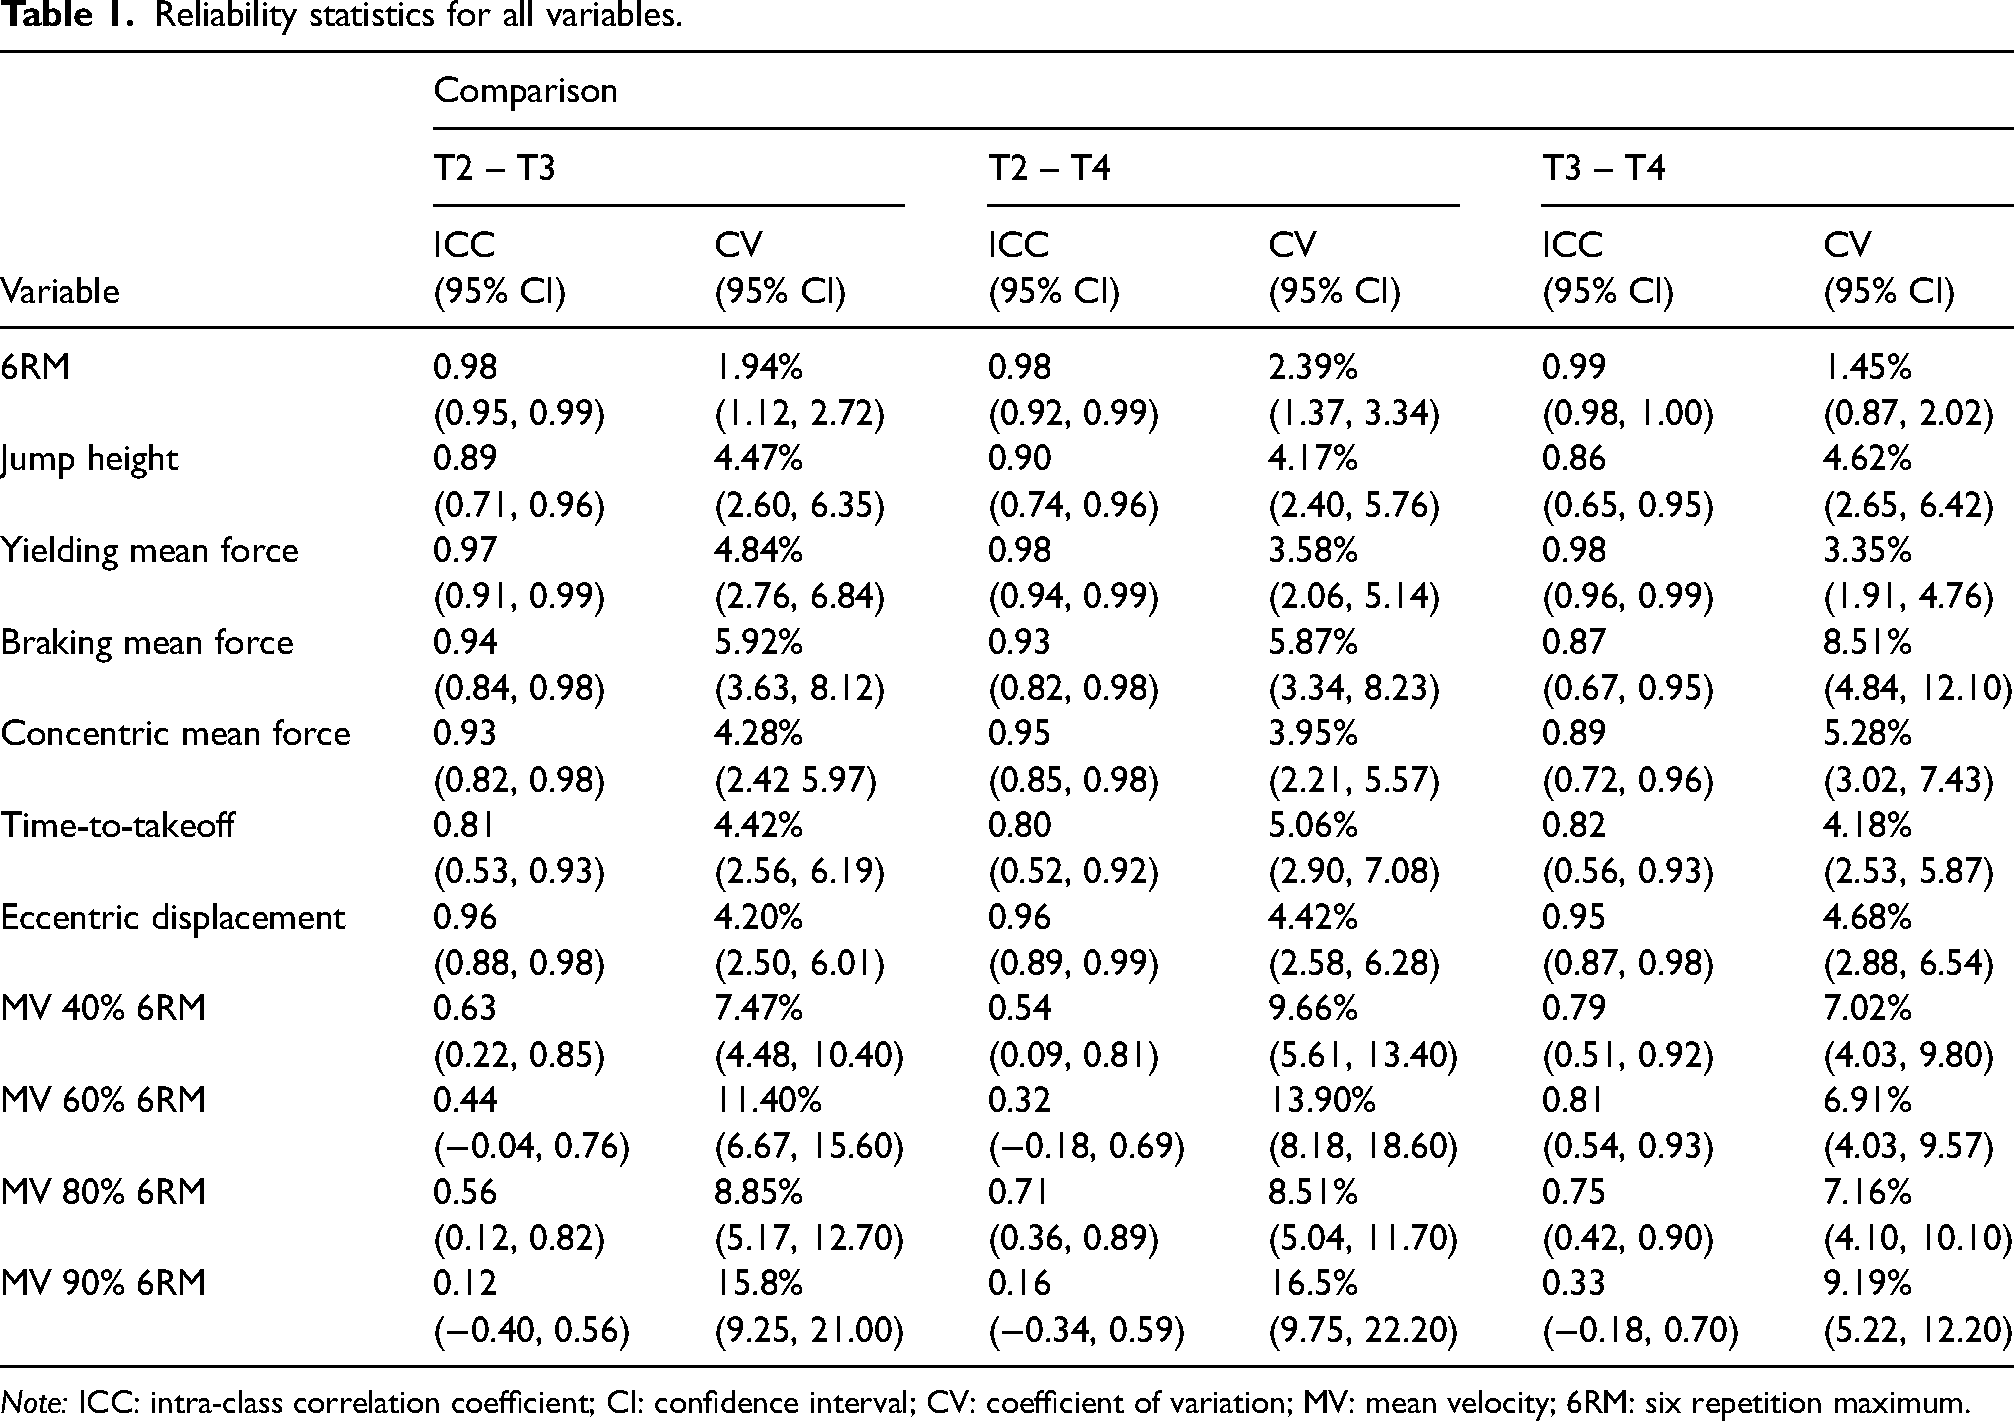
Note: ICC: intra-class correlation coefficient; CI: confidence interval; CV: coefficient of variation; MV: mean velocity; 6RM: six repetition maximum.
Discussion
We aimed to investigate whether 6RM deadlift strength varied over the duration of a five-day microcycle and whether repeated moderate volume strength testing resulted in meaningful changes in preparedness as indicated by changes in CMJ performance, barbell velocity, and perceived exertion during warm-up sets leading into a 6RM deadlift. The primary finding of the current study is that 6RM deadlift strength was not statistically different between testing sessions, and the fatigue induced by the repeated maximal effort strength tests did not detrimentally impact CMJ performance. Finally, RPE did not change between sessions on a group level, however, the spread of responses became observably larger at 60, 80, and 90% 6RM over the course of the study (Figure 4, Table 2).
Standard error of the measure and smallest detectable difference for each variable.
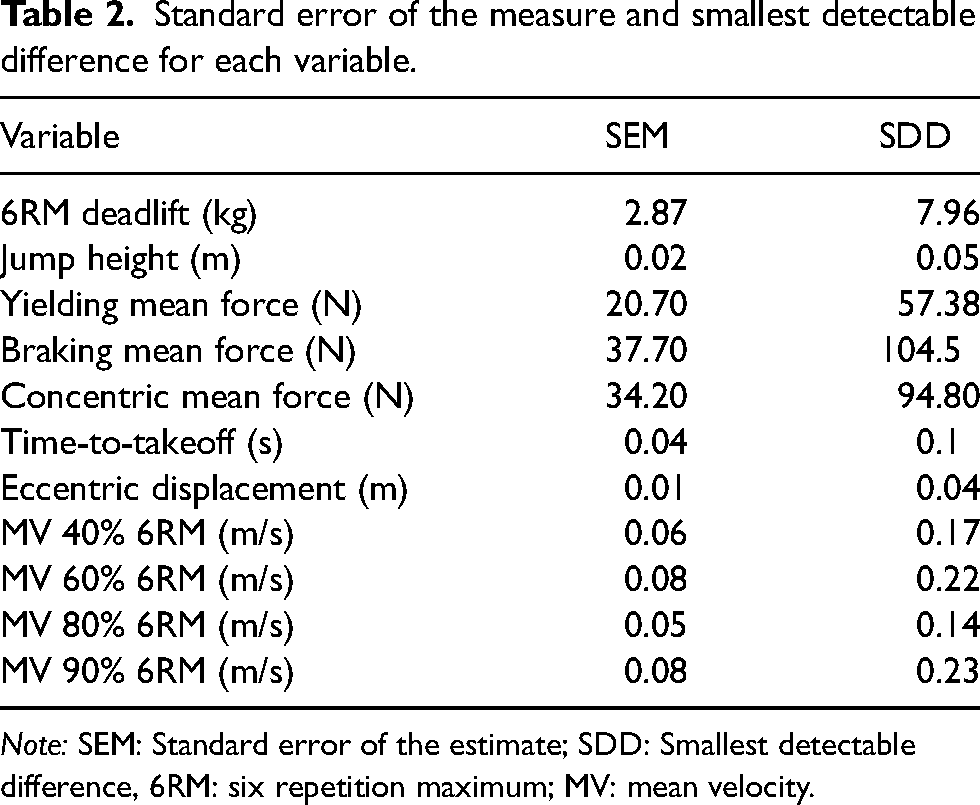
Note: SEM: Standard error of the estimate; SDD: Smallest detectable difference, 6RM: six repetition maximum; MV: mean velocity.
In alignment with previous research demonstrating the stability of lower-body 1RM strength when tested in a fresh state,5,7 after 24 hours of sleep loss, 46 or after a resistance training bout that is not performed to failure, 6 we determined that the deadlift 6RM did not differ between sessions. Furthermore, excellent relative reliability and good CVs, in alignment with previous research investigating the test–retest reliability of 1RM strength, 47 were found. Of interest in the present study is that even when more volume is performed during the maximal effort strength testing (i.e., six repetitions vs. one repetition), on average strength appears to be stable between testing sessions separated by 48 hours. However, there was a small amount of intraindividual variation (Figure 1), which highlights that when using percentage-based methods for controlling training intensity, some level of autoregulation on the part of the athlete may be required. For example, strength and conditioning professionals may prescribe a target relative intensity zone specific to the number of repetitions in each set (i.e., four sets of six repetitions at 80–85% 6RM), with the athlete then adjusting the barbell load depending on their training status on the given day provided they stay within the prescribed target zone.8,9 This classic approach to load prescription accounts for intraindividual variation and allows the athlete to autoregulate their training, while ensuring appropriate training loads are prescribed.
Although lower-body maximum strength did not change between sessions, MV during each warm-up set did vary between sessions (Figure 3). Specifically, MV declined between the first and second 6RM tests. This is in alignment with the results reported by Vernon et al., 6 who found that MV during free-weight back squats was lower at 24 and 48 hours after performing a training bout of five sets of five repetitions at 80% 1RM. In partial alignment with the results of Vernon et al., 6 we found that, in general, MV had returned to baseline levels at 60 and 80% 6RM by T4. Divergent changes in MV occurred at 40% 6RM and 80% 6RM. Specifically, a slower MV was found during T4 at 40%, while a faster MV was found at 80% 6RM. When this divergent change in velocity between relative intensities is examined collectively with the fact that 6RM strength was unchanged, we would suggest that it is questionable whether changes in velocity during submaximal warm-up sets truly represent changes in the athlete's maximal force-generating capacity. Further, whether daily changes in the load-velocity profile or perceived exertion (Figure 4) caused by small variations in preparedness are meaningful if the underlying physical quality does not change is also questionable outside of competitive periods where minimizing fatigue and optimising sports performance is the primary goal.
It is also of interest that lower-body dynamic performance as assessed using the CMJ was broadly unchanged in response to the repeated maximal strength testing over the duration of the five-day microcycle (Figure 2). Previous work investigating the impact of maximal intensity resistance training has demonstrated that CMJ performance (i.e., jump height) declines significantly both immediately post and 48 hours after a wave-loaded bout of back squats performed at 85% 1RM. 11 However, Held et al. 48 reported that CMJ height had returned to baseline levels 24 hours after a resistance training bout of squats and hip thrusts performed to volitional failure at 75% 1RM. In alignment with the results of Held et al., 48 no significant differences in jump height in response to the 6RM testing were found between sessions in the present study. Moreover, there were no significant differences in the alternative CMJ variables such as eccentric displacement or braking mean force (Figure 2), nor were there significant differences between sessions when the CMJ force-time curve itself was analysed as a continuous variable using SPM (Figure 5). The restoration of force-generating capacity after resistance exercise is in line with the results of Hughes et al., 25 who reported that although force during the middle portion of the concentric phase of the CMJ decreased immediately after a fatiguing exercise bout, it had largely returned to baseline after 24 hours and was not significantly different to baseline at 48 hours. Taken collectively, this indicates that although 6RM deadlift testing entails maximal effort on the part of the athlete, on average, it likely does not induce enough fatigue to detrimentally impact dynamic performance on subsequent days. However, strength and conditioning professionals should consider the individual response to strength testing as a degree of intra-individual variation in discrete CMJ variables was present between sessions (Figure 2).
When interpreting the results of this study, some limitations should be kept in mind. First, although a power analysis was performed to indicate the required sample size for this study, it was not done with SPM in mind. As such, the SPM repeated measures ANOVA may be underpowered and therefore requires replication with a larger sample. Second, only resistance-trained males volunteered to take part in this study. As such, although we do not expect resistance-trained females to exhibit different results, the results of our study should only be considered with confidence in this population. Finally, only one training exercise was performed in each session and therefore further work is required to determine whether maximum strength is similarly stable in response to a full training session and whether the inclusion of maximum strength testing in a normal training session has detrimental effects on preparedness during subsequent days.
Footnotes
Acknowledgements
The authors would like to thank the participants for volunteering their time to take part in this study. They would also like to thank Jordan Meester and Jiahao Yang for their assistance with data collection. This study was supported by an Australian Government Research Training Program Scholarship.
Declaration of conflicting interests
The authors declared no potential conflicts of interest with respect to the research, authorship, and/or publication of this article.
Funding
The authors received no financial support for the research, authorship, and/or publication of this article.