
Abstract
The purpose of this study was to describe the locomotor activity of men's hockey based on the phase of play and to identify if differences in locomotor activity exist between phases. Twenty-four players (age 26 ± 4) wore a 10 Hz Global Positioning System device to track locomotor activity during 10 international matches. The locomotor activity of players was allocated to five different phases: (1) established attack, (2) opposition counterattack, (3) established defence, (4) attacking counterattack and (5) offensive pressing, utilising a video analysis-based system. Linear mixed models and post-hoc pairwise comparisons, using estimated marginal means, were utilised to compare the locomotor activity in each phase of play within each position. Significant main effects were found for the phase of play on several locomotor activity metrics (p ≤ 0.05). With respect to max speed and relative total distance across positions, counterattacks present a unique challenge compared to other phases. Established attack phases evoke lower max speed values than offensive pressing phases for all playing positions as well as compared to opposition counterattacks for defenders, midfielders, and forwards. Positional differences existed during attacking counterattack phases, with defenders producing lower values than both midfielders and forwards for high-speed running, high-speed running efforts, max speed and relative total distance. Depending on the metric, this approach captured 22%–70% of a player's locomotor activity providing valuable insight into the current dynamics of international hockey. This investigation demonstrated positional differences based on the phase of play, which may explain previous research findings regarding positional differences.
Introduction
The general profile of locomotor activity of hockey players, during international match play, is well established. James et al. 1 recently reported that the men's game is played at intensities ranging between 115 and 134 m/min, depending on the position of the player. A player's position and time spent on the field are significant factors in determining the intensity of output. James et al. found that defenders cover fewer metres (998 ± 289 m) at high speed than midfielders (1299 ± 298 m) and forwards (1266 ± 310 m). This broad approach may be useful for understanding players’ typical output but is heavily reliant on the presentation of total match locomotor activity values without considering the influence of spatio-temporal or tactical variables such as phase of play, possession status or team shape. The pattern of accumulation of locomotor activity is unclear and the reasons for positional differences, beyond playing time, remain unexplored.
Previous research has shown that possession status can influence the locomotor activity of soccer players, teams who had high percentages of possession (55 ± 4%) produced 31% more high-intensity running when in possession but 22% less high-intensity running when not in possession. 2 Furthermore, each position displayed a unique relationship between locomotor activity and possession percentage. Central defenders of lower possession teams covered 33% less high-intensity running when in possession compared to the central defenders of high possession teams. Similarly, in hockey, it has been established that possession status has a large impact on a player’s locomotor activity, with not-in-possession phases demanding greater levels of locomotor activity for defenders, outside backs and midfielders for a broad range of locomotor activity metrics including relative total distance (+22, + 15 and +10 m/min) and high-speed running (HSR) (>5.5 m/s1) (+6, + 4 and +3 m/min, respectively). 3 In contrast, forwards only displayed differences between possession phases for high-speed running, low-intensity running and deceleration metrics, with the relative total distance remaining similar in each possession status during match-play.
To gain a more comprehensive representation of locomotor activity in hockey, there is a need to assess the phases of play within each possession category, as counterattacks or extended periods of established attack may present unique challenges to different physical qualities of the players. 4 This is warranted as the phase of play has been reported to have a large impact on the length, width and playing surface area of the team and therein the potential to alter the locomotor activity of players. 5 Additionally, the location of the ball on the pitch influences the location of the players. The phase of play can be utilised as a proxy for ball location in this study as the phases reflect particular patterns of play which have relatively predictable ball patterns of movement. Therefore, when analysing the locomotor activity of players, it is important to view it through the lens of the phase of play to provide situational context as this appears to have an impact on locomotor activity and the location of the players on the pitch.
Differences in locomotor activity, dependent on the phase of play, may explain why positional differences exist for locomotor activity within match play.1,3,6–8 Phases of play can be separated into several categories; Hewitt 9 suggests a framework of five phases in soccer. This framework consists of five key moments of play: (1) established attack, (2) transition from attack to defence, (3) established defence, (4) transition from defence to attack and (5) set pieces. These phases can be considered as interactive as they are able to influence other moments or elements of play. 10 For example, attacking patterns may influence defensive tactics simply because of where players are located on the field relative to opposition players during a transition. 9 However, similar to the approach of Hewitt et al. they will be analysed separately for simplicity, and to identify key differences between each phase to generate insight to inform training practices that encapsulate the intrinsic variability of the competitive match environment.11,12
Given the variance present in the locomotor activity of hockey players13–15 it is important to identify and describe the factors responsible to assist in the analysis and interpretation of match activity profiles. The authors hypothesise that counterattack phases, both attacking and opposition, will display greater values for max speed and relative total distance (RTD) compared to phases of established attack and defence.
The aim of this investigation is to outline differences in locomotor activity for each position within men's international hockey delineated by phase of play.
Materials and methods
Participants
Twenty-four international hockey players, from the Irish hockey National team (age = 26 ± 4, 78 ± 6 kg, max aerobic speed = 4.85 ± 0.23 m/s) participated in this study. All players participating in this investigation had >10 caps (range 12–290 caps). All players were available for selection, injury free and had completed a club season and an international hockey preparatory period which included three tournaments (11 matches) and several training camps. All participants provided informed consent and the data collected formed part of the national team's normal performance analysis process. The experimental protocol was in accordance with the Declaration of Helsinki for the study of human subjects. The institutional ethics board of the University College Dublin (LS-17–85) approved the experimental protocol.
Data collection and processing
Ten international-level matches were analysed, with each match split into four 15-min quarters. Match results consisted of four wins, four losses and two draws. Opposition teams were ranked between 1 and 18, with an average ranking of 5. Players were categorised into four positional groups namely central defenders (N = 3), outside backs (N = 3), midfielders (N = 5) and forwards (N = 5).
The matches were video recorded and ‘coded live’ by an experienced performance analyst using Sportscode Elite software (Sportstec Limited) to categorise in-match events. The analyst had four years’ of experience working in international hockey. Match coding was reviewed post-match by the same performance analyst and a second performance analyst using the multiple camera angles available to ensure accuracy. The accuracy of coding was also assessed versus coding received from the opposition in two of the matches investigated. An interclass correlation coefficient of 0.91 was found between operators. Possession was categorised when each team held possession for more than a three-second period. If a team lost possession when playing the ball over the side or end line, possession restarted when the opposition team moved the ball for the first time once play had restarted. Within these categorised periods of possession, the match is coded into phases of play (Table 1). These phases of play are related to those suggested by Hewitt et al. 8 with adaptations to ensure relatability to hockey. The Sportscode event codes with relevant information such as team in possession, phase of play and the relevant start and end time of possession and phase of play, were then exported in CSV format and imported directly into the STATSports Apex Pro Series (2.3.301) Global Positioning System (GPS) software as drills for each player. Drills within the STATSports Apex Pro Series (2.3.301) GPS software allow for the calculation of locomotor activity relative to the time period delineated as the start and end time of the phase. The event codes for each instance were based on the phase of play and the time stamp for the start and end of each phase of play was utilised as the start and end time for each drill. These drills were imported to players who were on the pitch for these periods and if a rotation occurred during these periods the drill was adjusted to match these periods. The locomotor activity data generated relative to each code was exported to a bespoke CSV file for data pre-processing and further analysis.
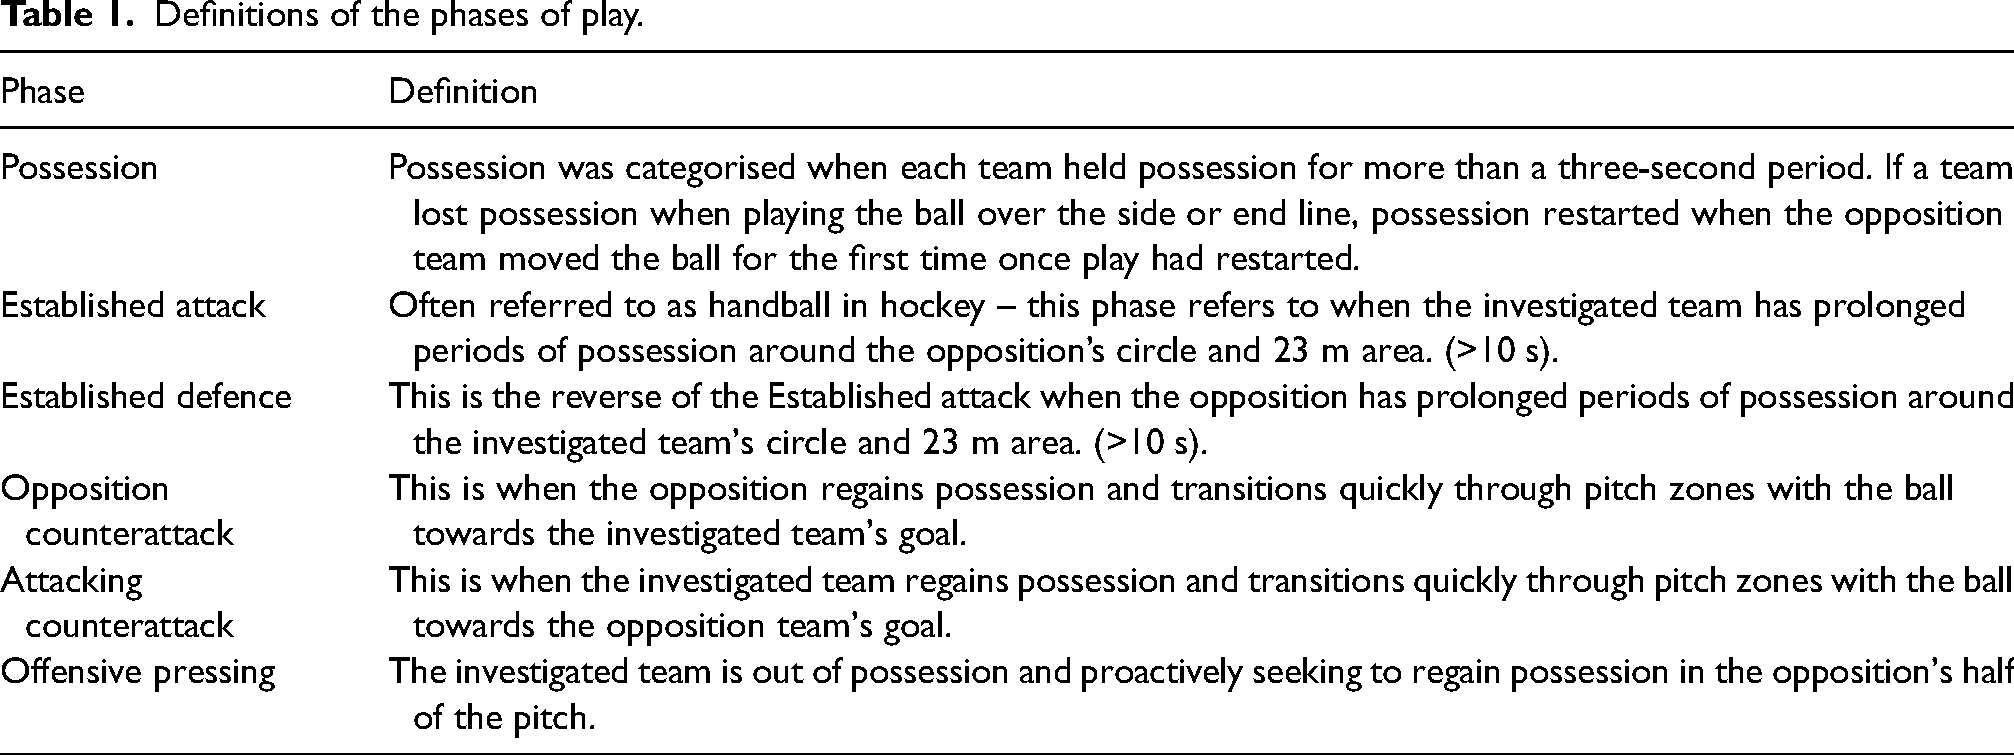
Definitions of the phases of play.
GPS metrics
All GPS units (STATSports Apex 10HZ GPS/GNSS, firmware 2.50) were turned on twenty minutes prior to each match to achieve satellite locking, with a horizontal dilution of precision noted as 0.69 ± 0.07 and a high number of satellites present 21.4 ± 0.9 which is considered as excellent by the manufacturer guidelines. 16
GPS units were placed in a bespoke neoprene vest, with the unit located in the mid-thoracic area between the scapulae. All players utilising the same unit throughout the tournament. Data from each GPS unit was downloaded post-match using the STATSports Apex Pro Series software (2.3.301), with the reliability and validity of this technology reported previously for total distance and peak velocity.17,18
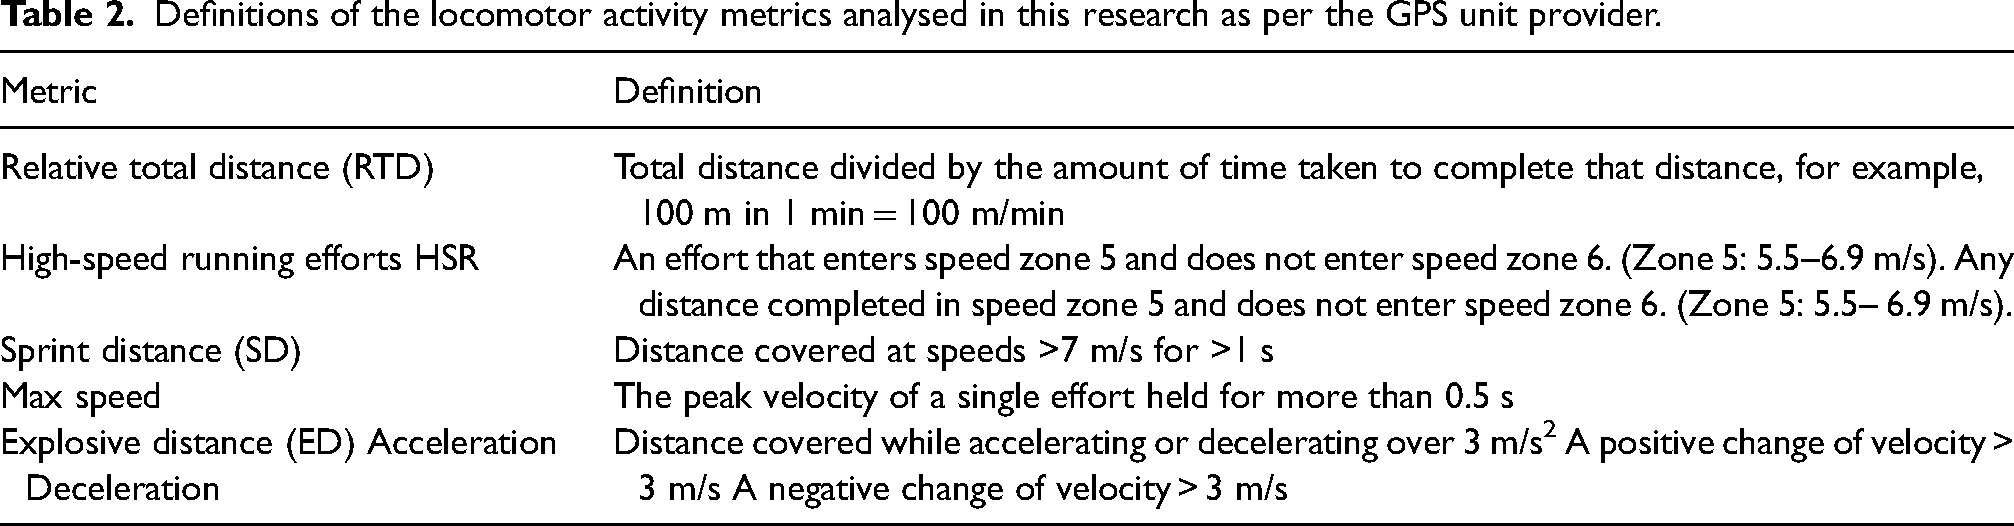
The movement patterns of players were recorded for total time on the pitch, total distance covered, max speed and distance relative to arbitrary speed zones. Total distance was split into six arbitrary, non-player dependent zones (<1.5, 1.5–2.99, 3.0–4.19, 4.2–5.49, 5.5–6.99 and >7.0 m/s). These zones represented 16 ± 1%, 32 ± 1%, 45 ± 2%, 59 ± 2% and 76 ± 3% of the player's max speeds (40 m sprint). As there is limited consensus on speed zones in research, 19 this approach was the suitable given its similarity to zones reported in research that has utilised male hockey players7,20 and team sport research in general, 21 providing an opportunity for comparison. Table 2 summarises the GPS metrics assessed in this research.
Definitions of the locomotor activity metrics analysed in this research as per the GPS unit provider.
Statistical analysis
Differences in locomotor activity between each phase of play were investigated utilising linear mixed models (LMMs). A LMM was utilized to overcome the correlation effects of repeated measures within each player and also due to the flexibility that this method has in accounting for the altering sample sizes between groups. 22
Several iterative models were constructed to identify the optimal model. Random effects included repeated measures of the player within tournaments. If the addition of a random effect did not improve Akaike's information criterion (AIC) it was removed from the analysis process. 23 The fixed effects and their interactions in each model included player position and phase of play.
Random intercepts for a player and tournament were generated to allow for the uniqueness of individuals, and the characteristics of each tournament. Attempts to model random slopes resulted in the overfitting of models and were therefore discarded from the analysis. The model estimated parameters using the restricted maximum likelihood method. 24 Potential fixed effects were added sequentially to the model with iterations of the model compared to one another and tested for best fit (R²). Likelihood ratio tests were completed on the iterative models utilising the ANOVA function in R statistical programming software to identify if models were statistically different from one another. Marginal and conditional R² were assessed 25 for each model with both AIC and R² informing model choice. LMM's were constructed for each of the dependent variables (Table 2).
The LMM's were computed in R statistical programming software, using the package lme4. 26 Model performance was tested utilising the ‘performance’ package with checks for collinearity, heteroscedasticity, overdispersion and zero-inflation completed. 27 Statistical significance was accepted where p < 0.05. Post-hoc pairwise comparisons were carried out where appropriate, using estimated marginal means, to compare locomotor activity between phases using Bonferroni adjustment. 28 Mean differences and the respective standard error (SE) of measurement were reported between groups. Effect sizes (ESs) were determined using Cohen’s D. Effect size values of ≥ 0.20, ≥ 0.60, ≥ 1.20 and > 2 were considered to represent small, moderate, large and very large effects, respectively. 29
Results
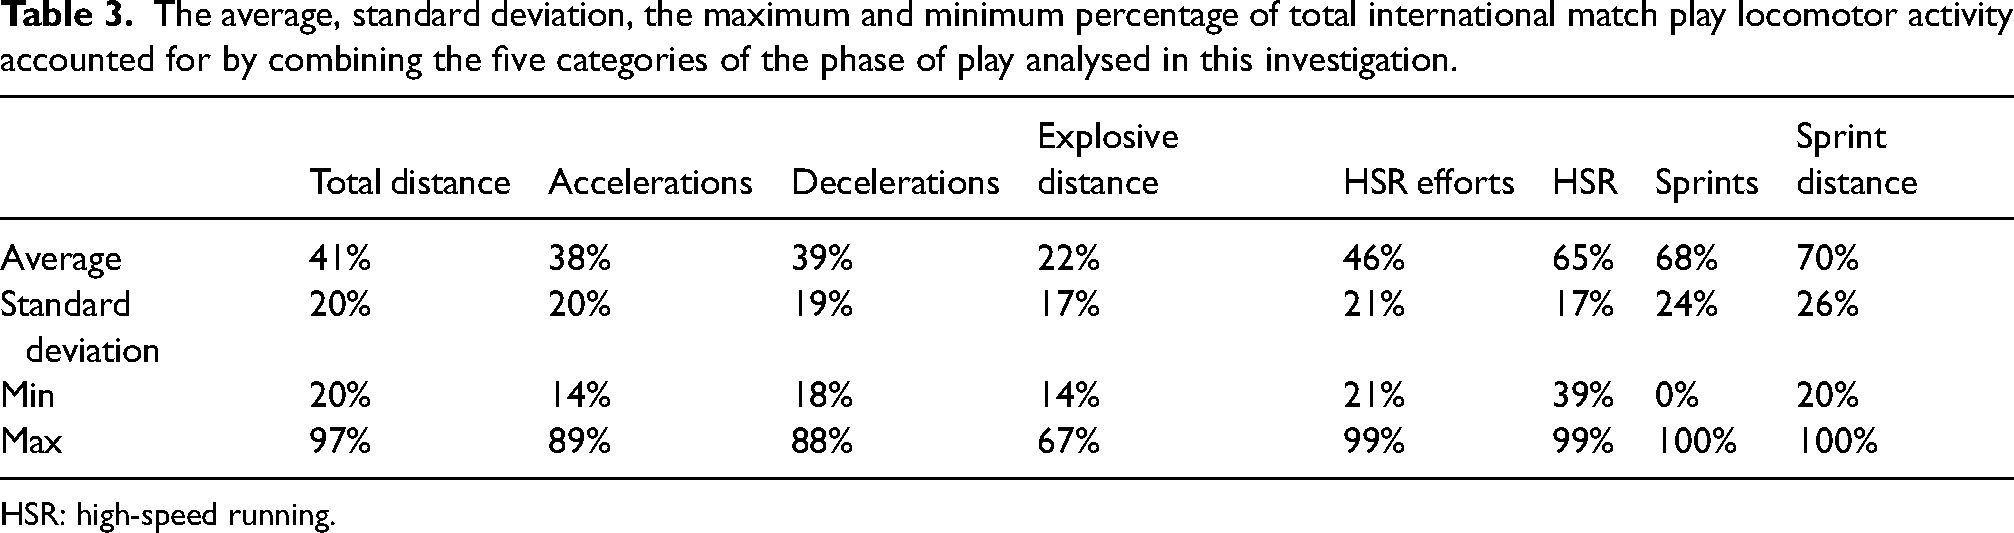
A total of 6195 individual samples were analysed. The samples ranged from, per position, 56–808 samples depending on the phase. Midfielders and forwards provided more samples given that there are always more of these players on the pitch given the formation of the team. In addition, the squad is composed of a greater number of midfielders (5) and forwards (5) compared to defenders (3) and outside backs (3). The five phases of play accounted for different percentages of a player’s overall locomotor activity within match play depending on the metric. Tables 3 and 4 display the percentages for each of the phases of play, by an individual player, in total and by phase. On average, attacking counterattacks lasted for 42 ± 4 s, offensive pressing lasted for 48 ± 6 s, established defence lasted for 45 ± 16 s, established attack lasted for 47 ± 15 s and opposition counterattacks lasted for 34 ± 2 s.
The average, standard deviation, the maximum and minimum percentage of total international match play locomotor activity accounted for by combining the five categories of the phase of play analysed in this investigation.
HSR: high-speed running.
The average and standard deviation of total locomotor activity accounted for by metric and phase of play.
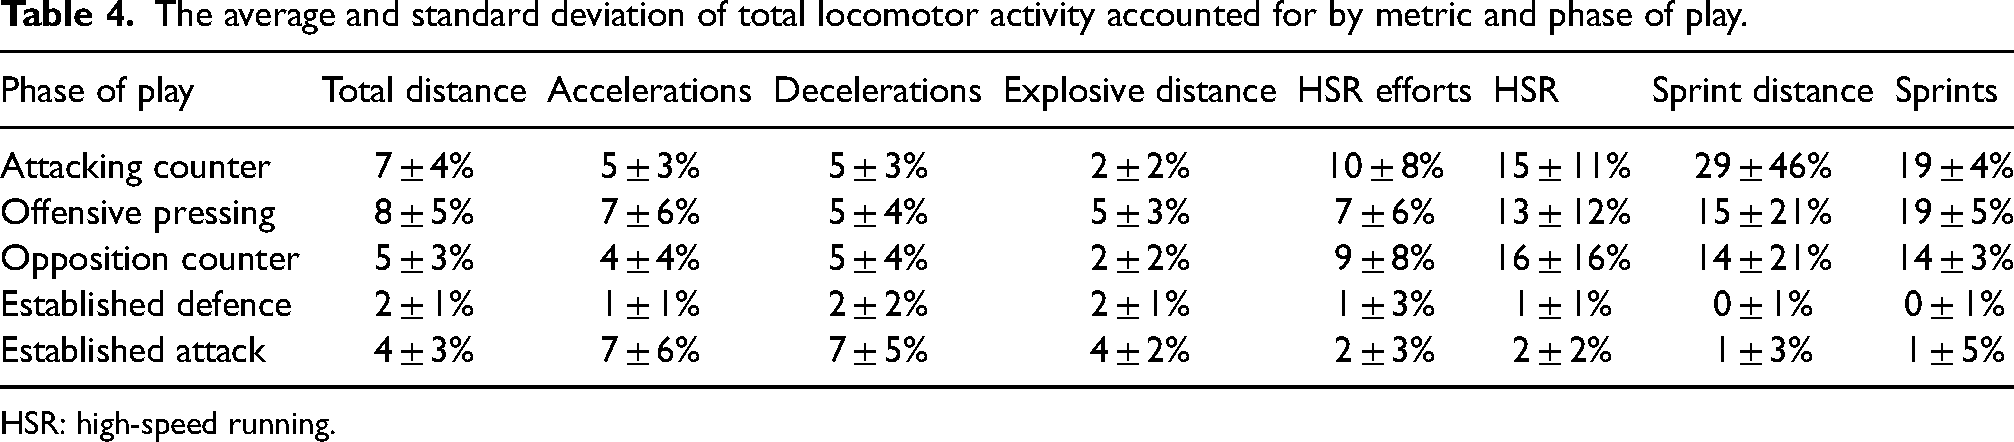
HSR: high-speed running.
The five phases of play accounted for, on average, 7 ± 3% (attacking counterattacks), 16 ± 6% (offensive pressing), 5 ± 3% (opposition counterattacks), 2 ± 2% (established defence) and 4 ± 2% (established attack) of playing time. On average, there were 11 ± 2 attacking counterattacks, 9 ± 1 opposition counterattacks, 13 ± 2 established defence, 11 ± 1 established attack and 19 ± 3 offensive pressing phases per match on a team level.
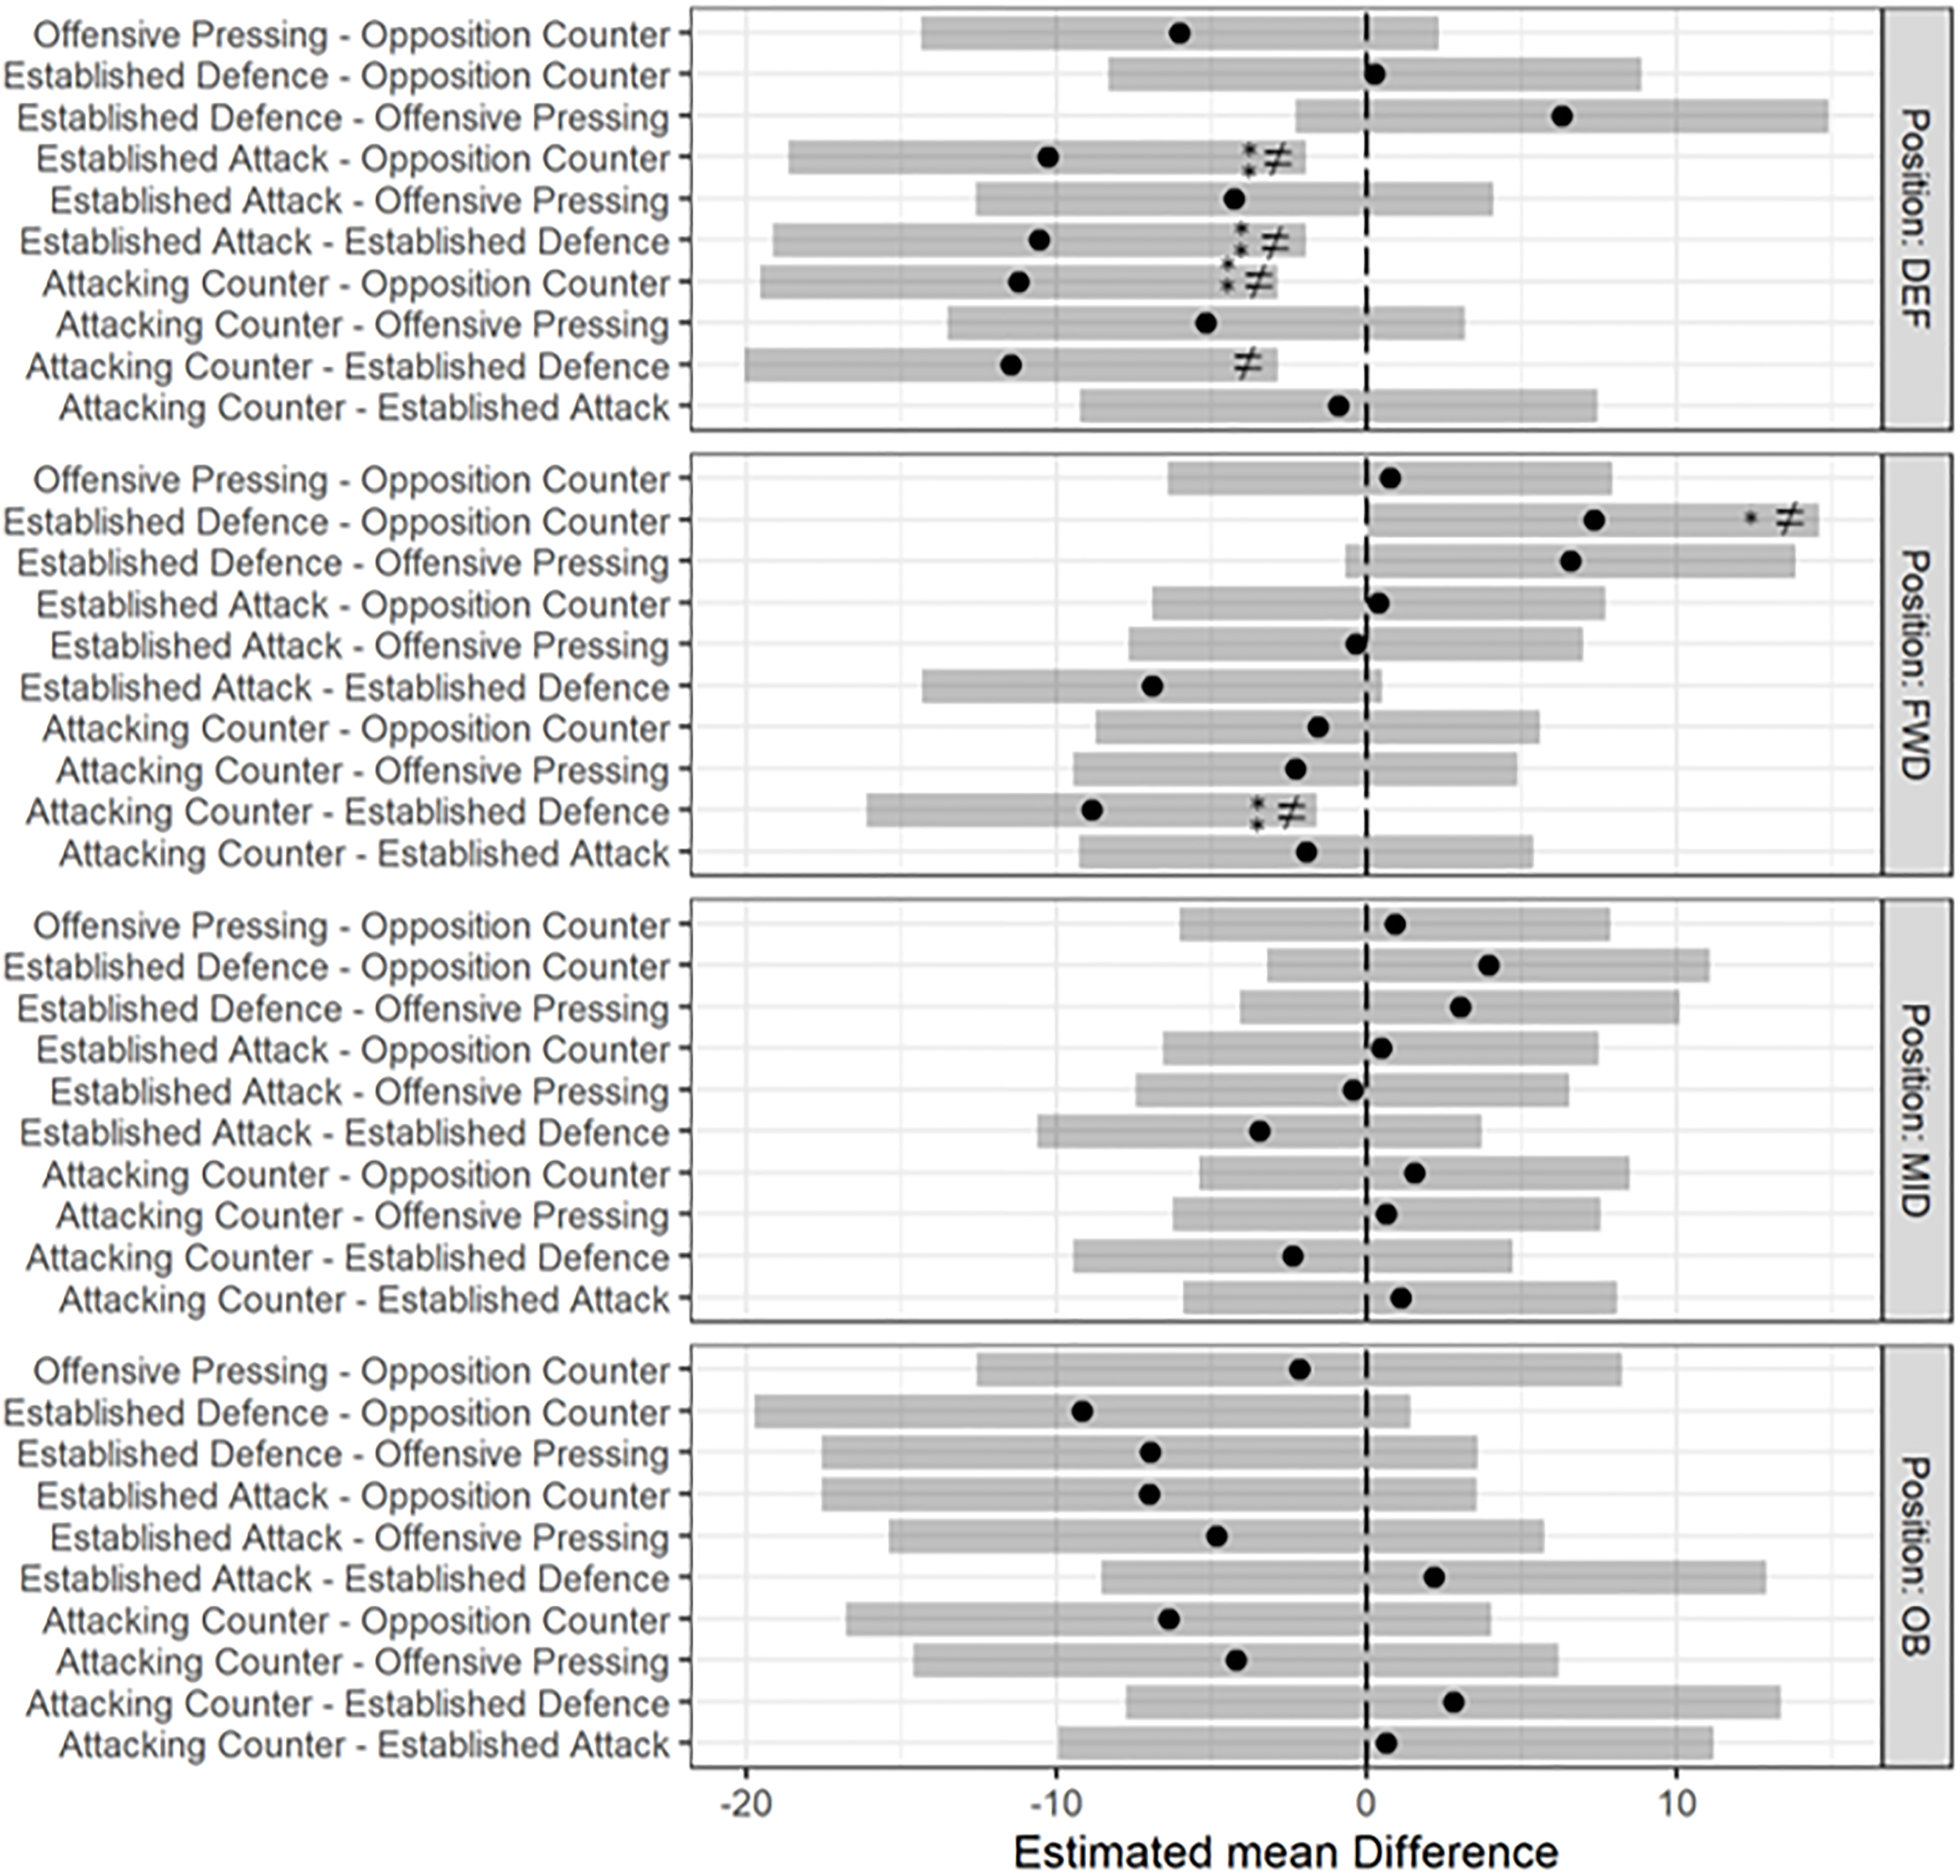
Significant main effects were found for both position and phase of play (p < 0.05), however, there were no significant interaction effects between position and phase of play (p > 0.05). Figure 1 displays the estimated marginal means of each phase by position and metric with 95% CIs. Estimated marginal means results revealed significant differences between several phases, within positions, for RTD. Opposition counterattacks elicited the highest mean values for RTD across all positions (141–156 m/min). Established attacks elicited the lowest mean values for RTD across all positions (104–121 m/min).
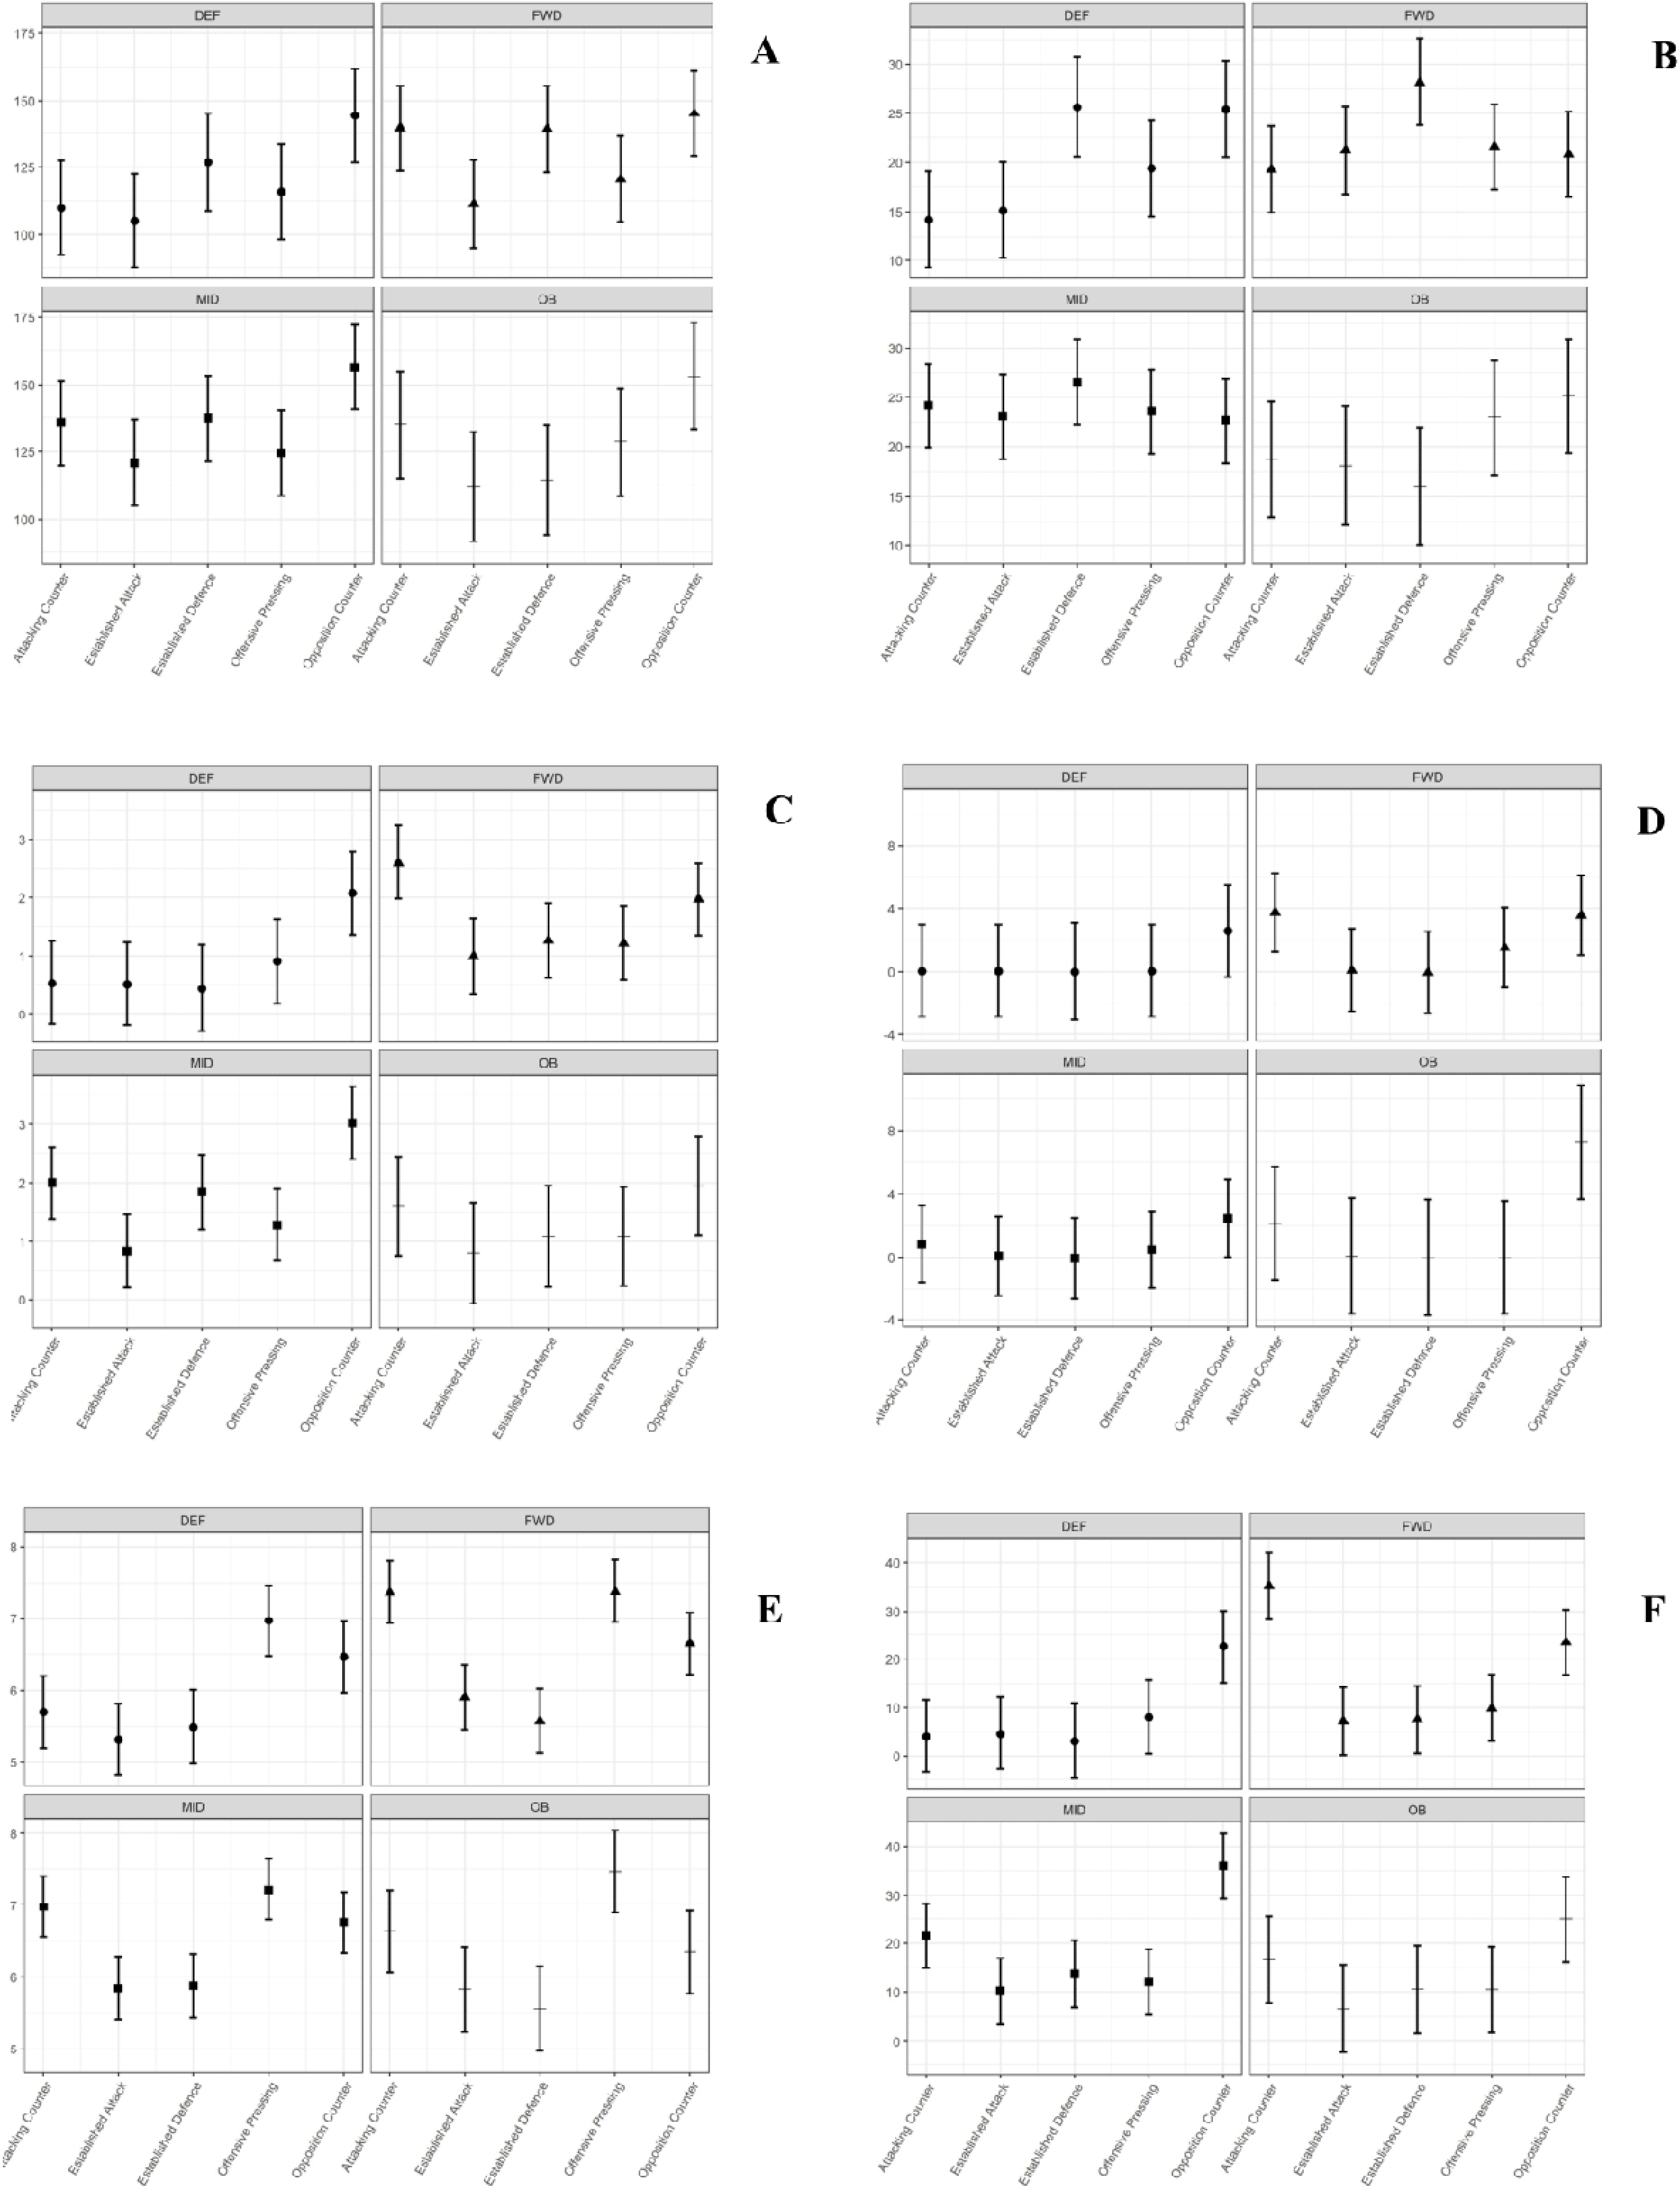
Estimated marginal means with 95% CIs for each phase of play by position. A = Relative total distance (m/min), B = Explosive distance (m/min), C = HSR efforts (au), D = Sprint distance (m/min), E= Max speed (m/s) and F = HSR (m/min).
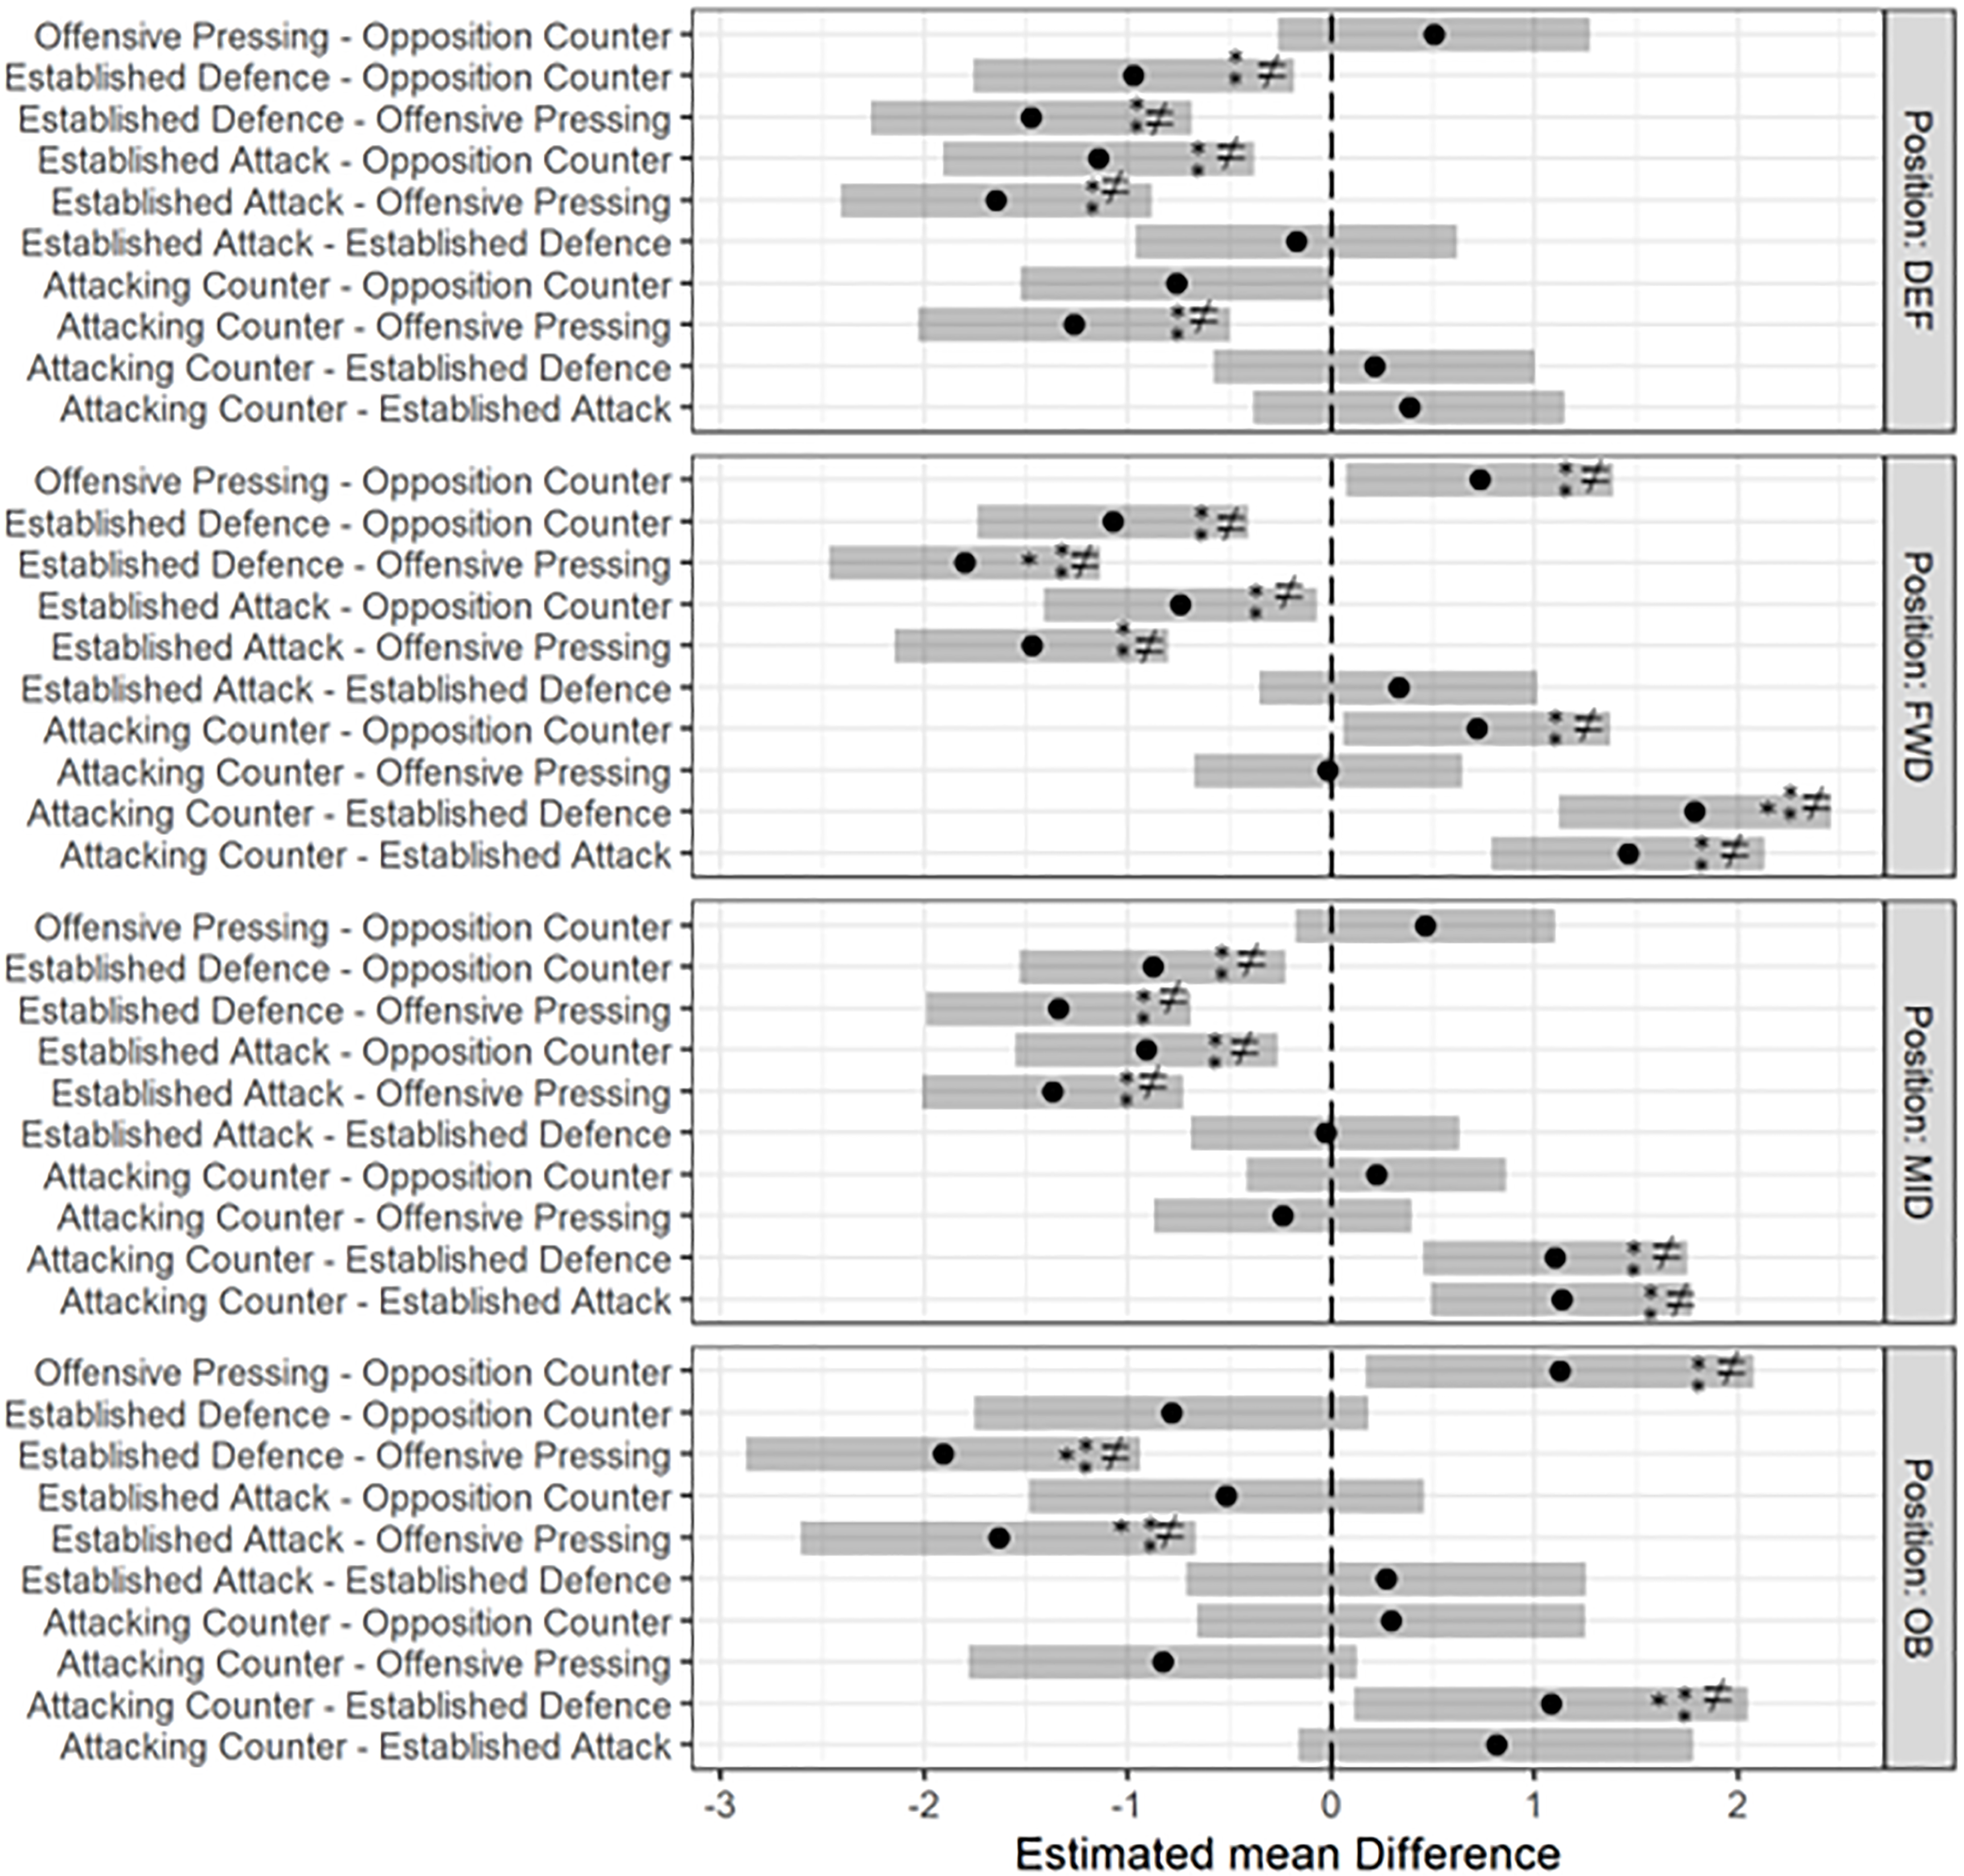
Offensive pressing elicited the highest values across all positions for max speed (6.97–7.46 m/s). Established attack elicited the lowest values for defenders (5.32 m/s – SE: 0.25 m/s) and midfielders (5.85 m/s – SE: 0.22 m/s) while established defence elicited the lowest max speed values for forwards (5.58 m/s – SE: 0.23 m/s) and outside backs (5.56 m/s – SE: 0.30 m/s). Figures 2 to 7 report the estimated mean differences, with 95% CIs, for all metrics investigated. Established defence elicited the highest mean values for ED across all positions (26–28 m/min), except outside backs who achieve peak values during opposition counterattacks (23 m/min). Different phases elicited the lowest mean values for ED across all positions. However, only defenders and forwards displayed, within the position, differences between phases (Figure 5).
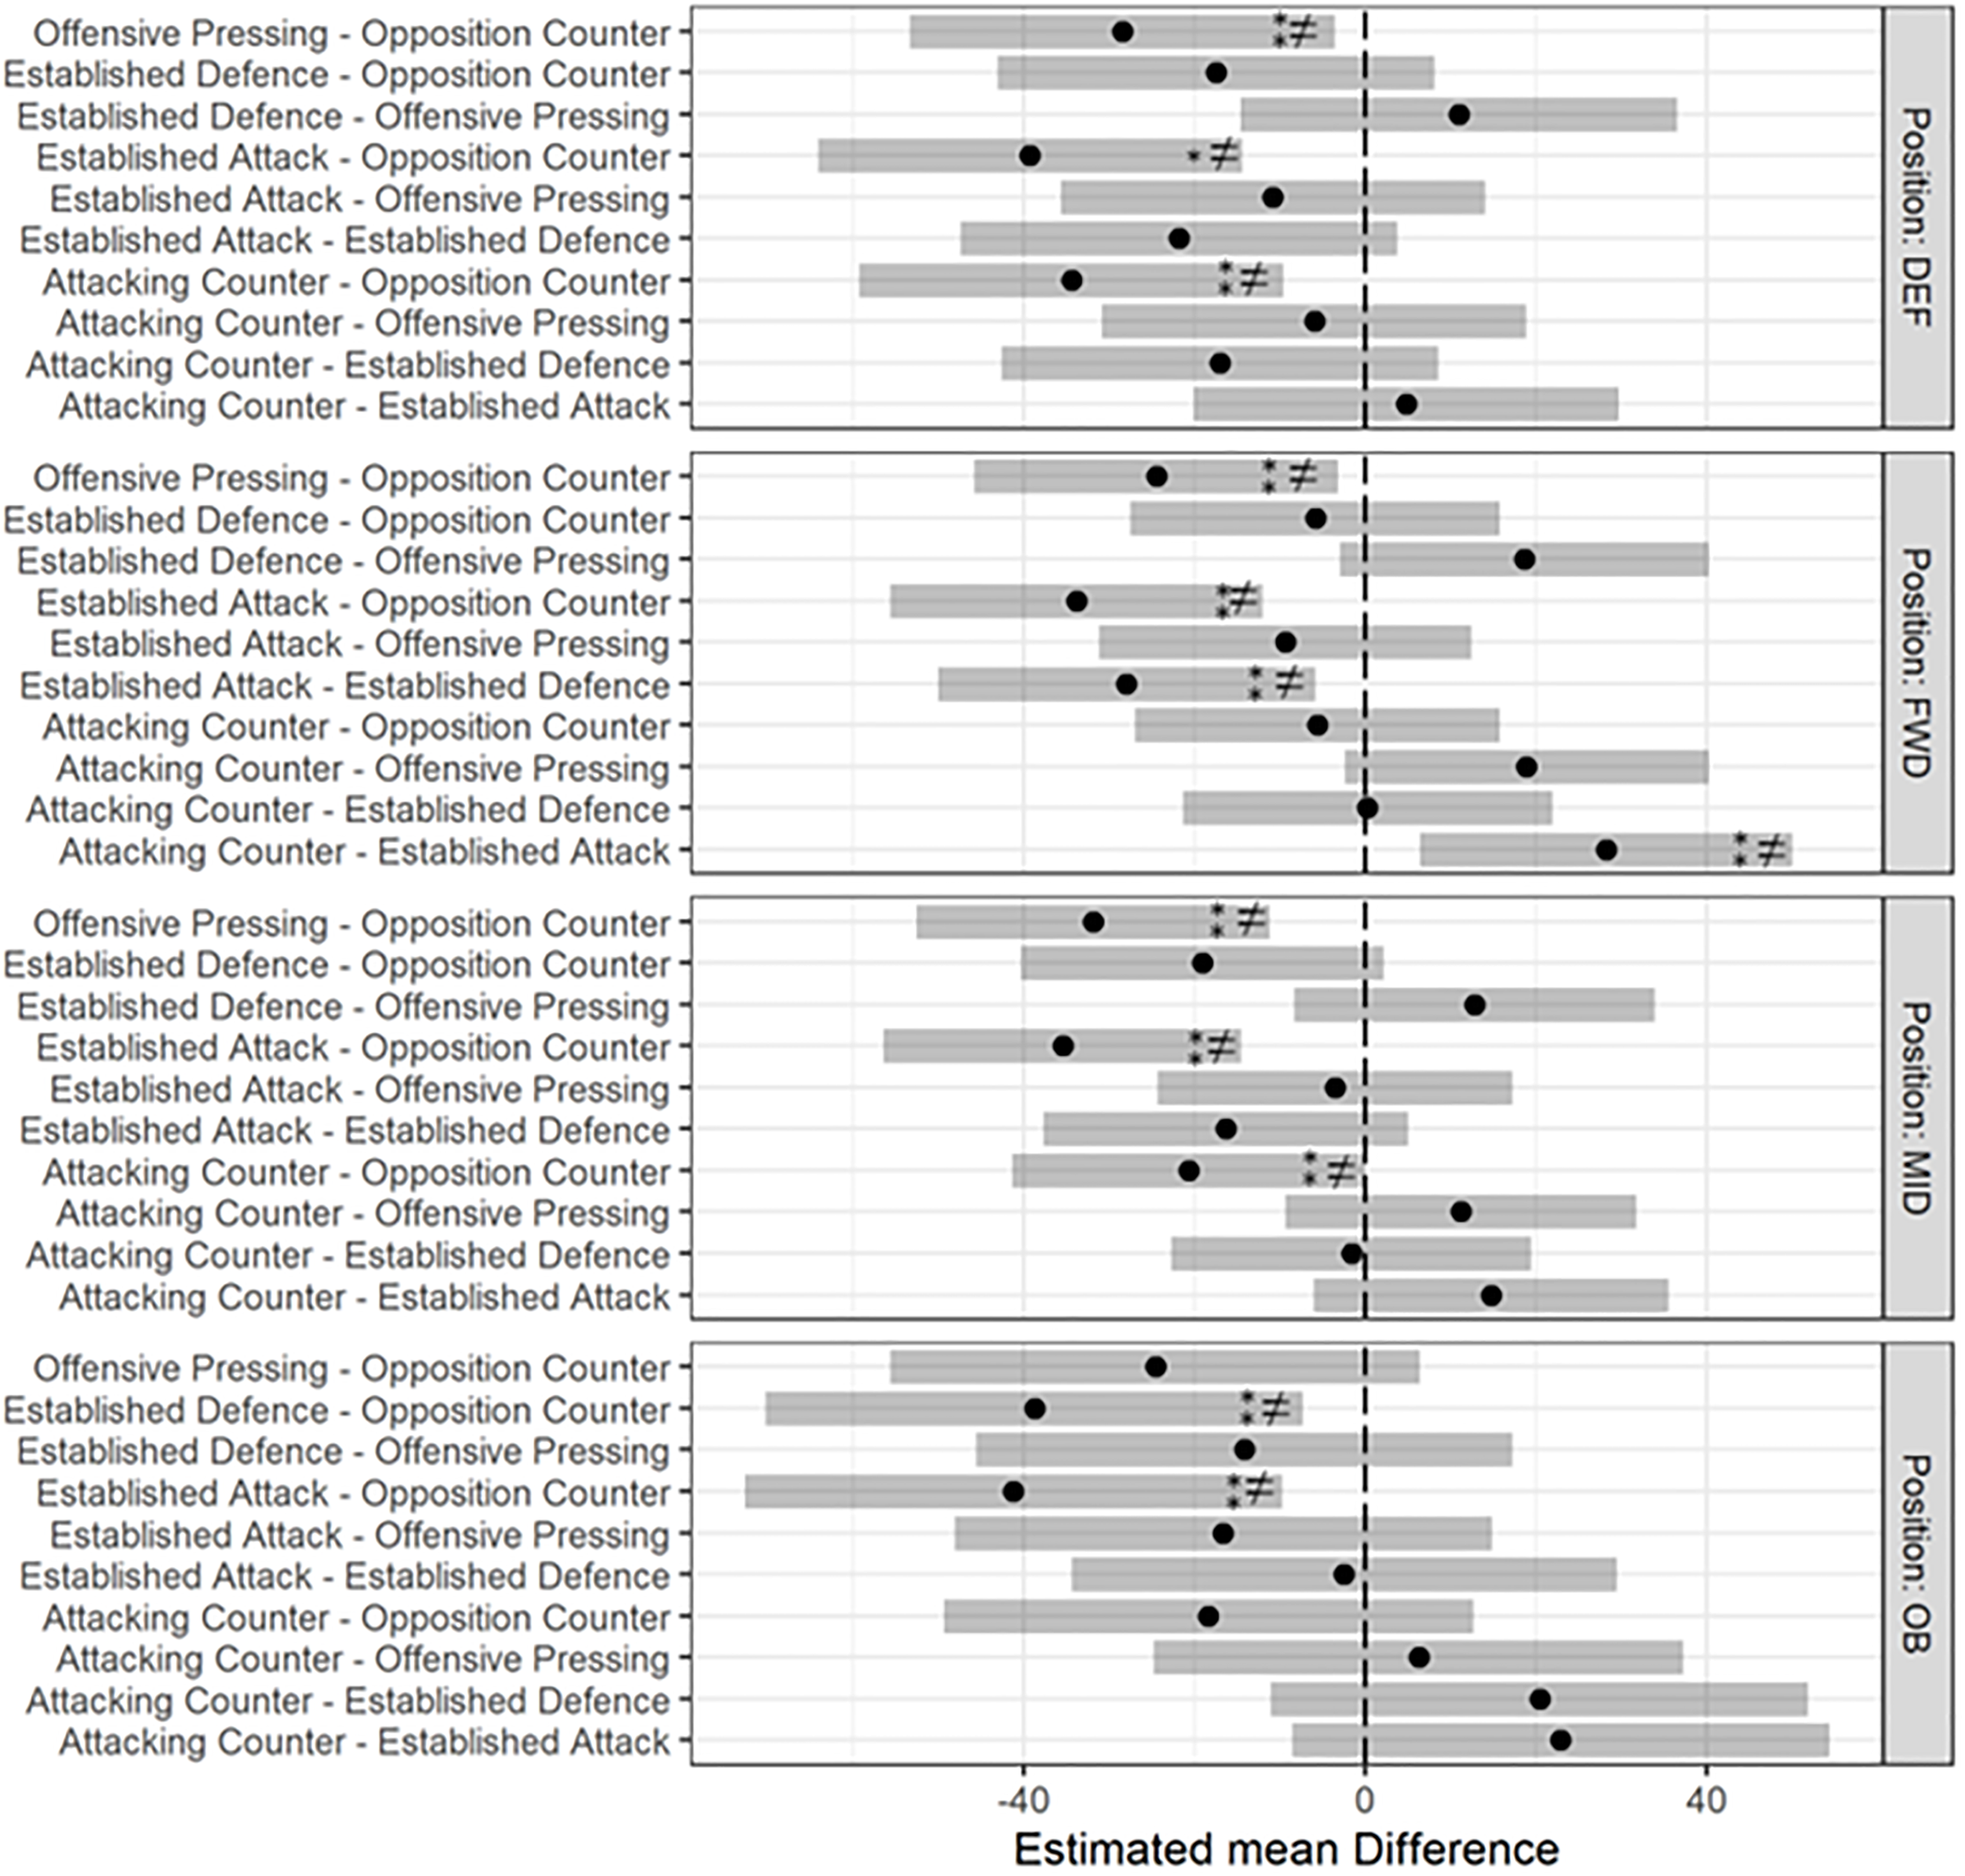
The estimated mean differences, relative total distance (RTD), between phases of play for each position with 95% CIs. ≠ = statistically significantly different. ⁎ = small effect sizes. ⁑ = moderate effect sizes. ⁎⁑ = large effect sizes.
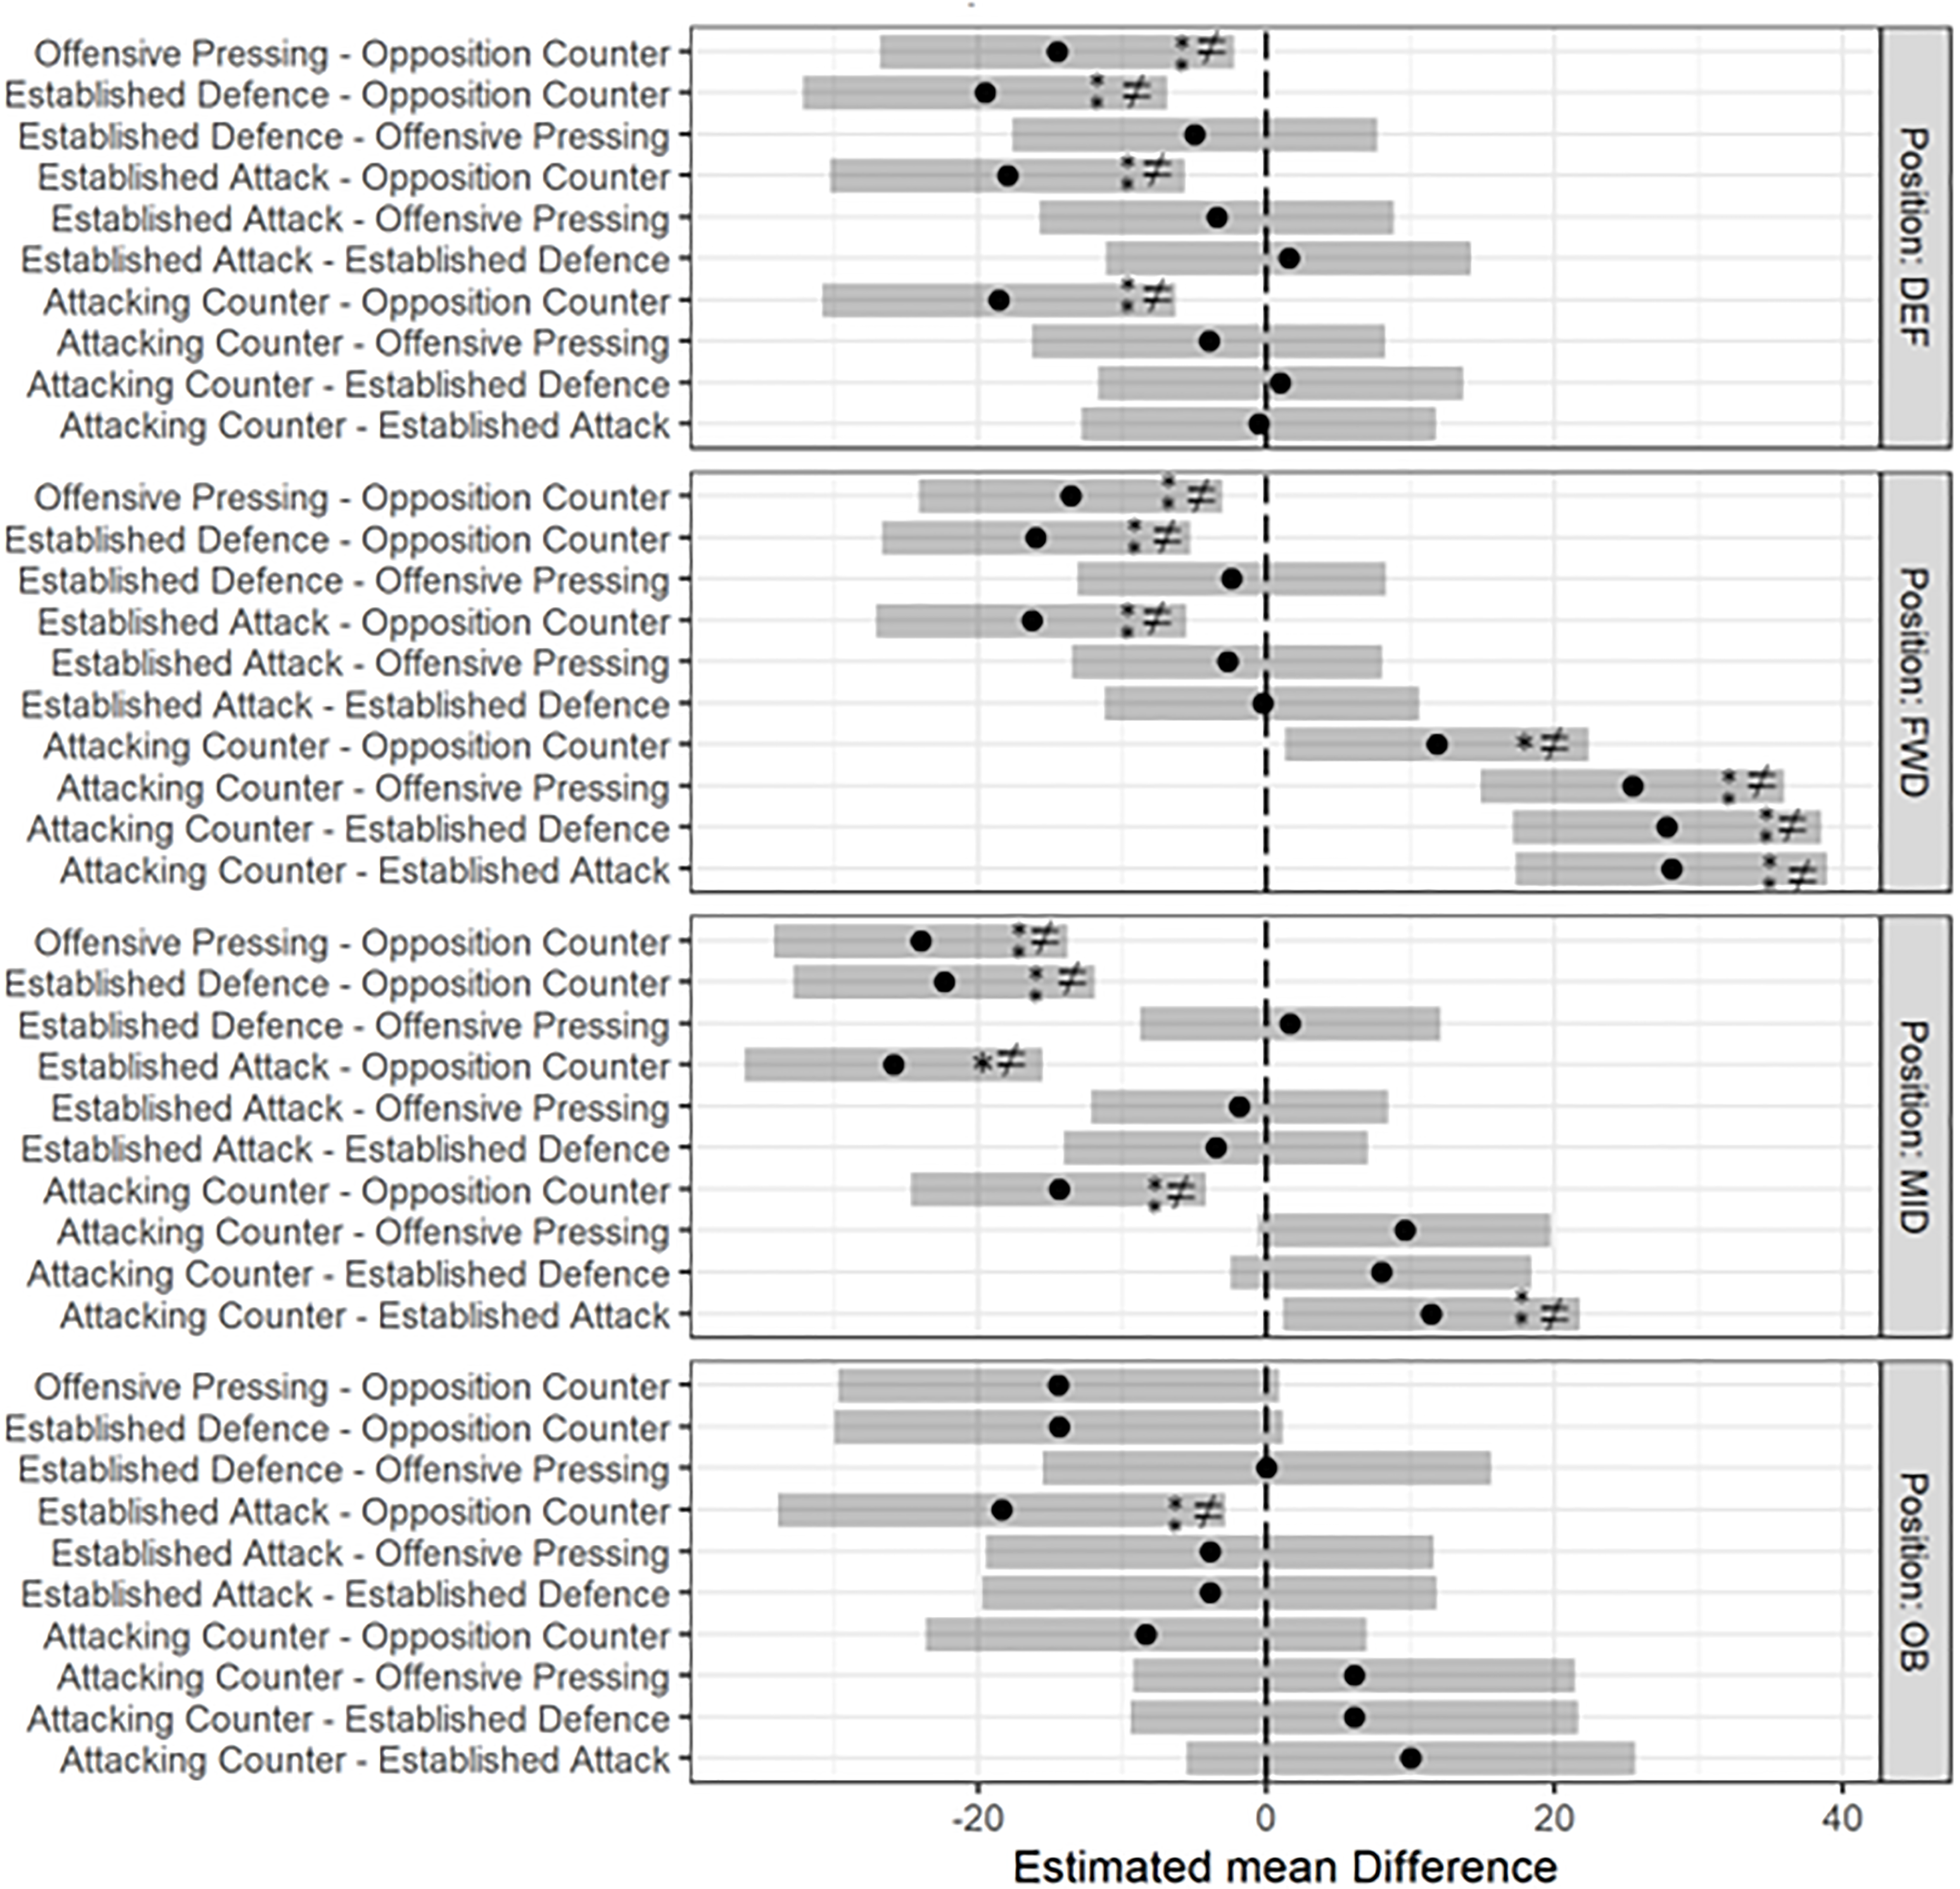
The estimated mean differences, for high-speed running (>5.5 m/s), between phases of play for each position with 95% CIs. ≠ = statistically significantly different. ⁎ = small effect sizes. ⁑ = moderate effect sizes. ⁎⁑ = large effect sizes.
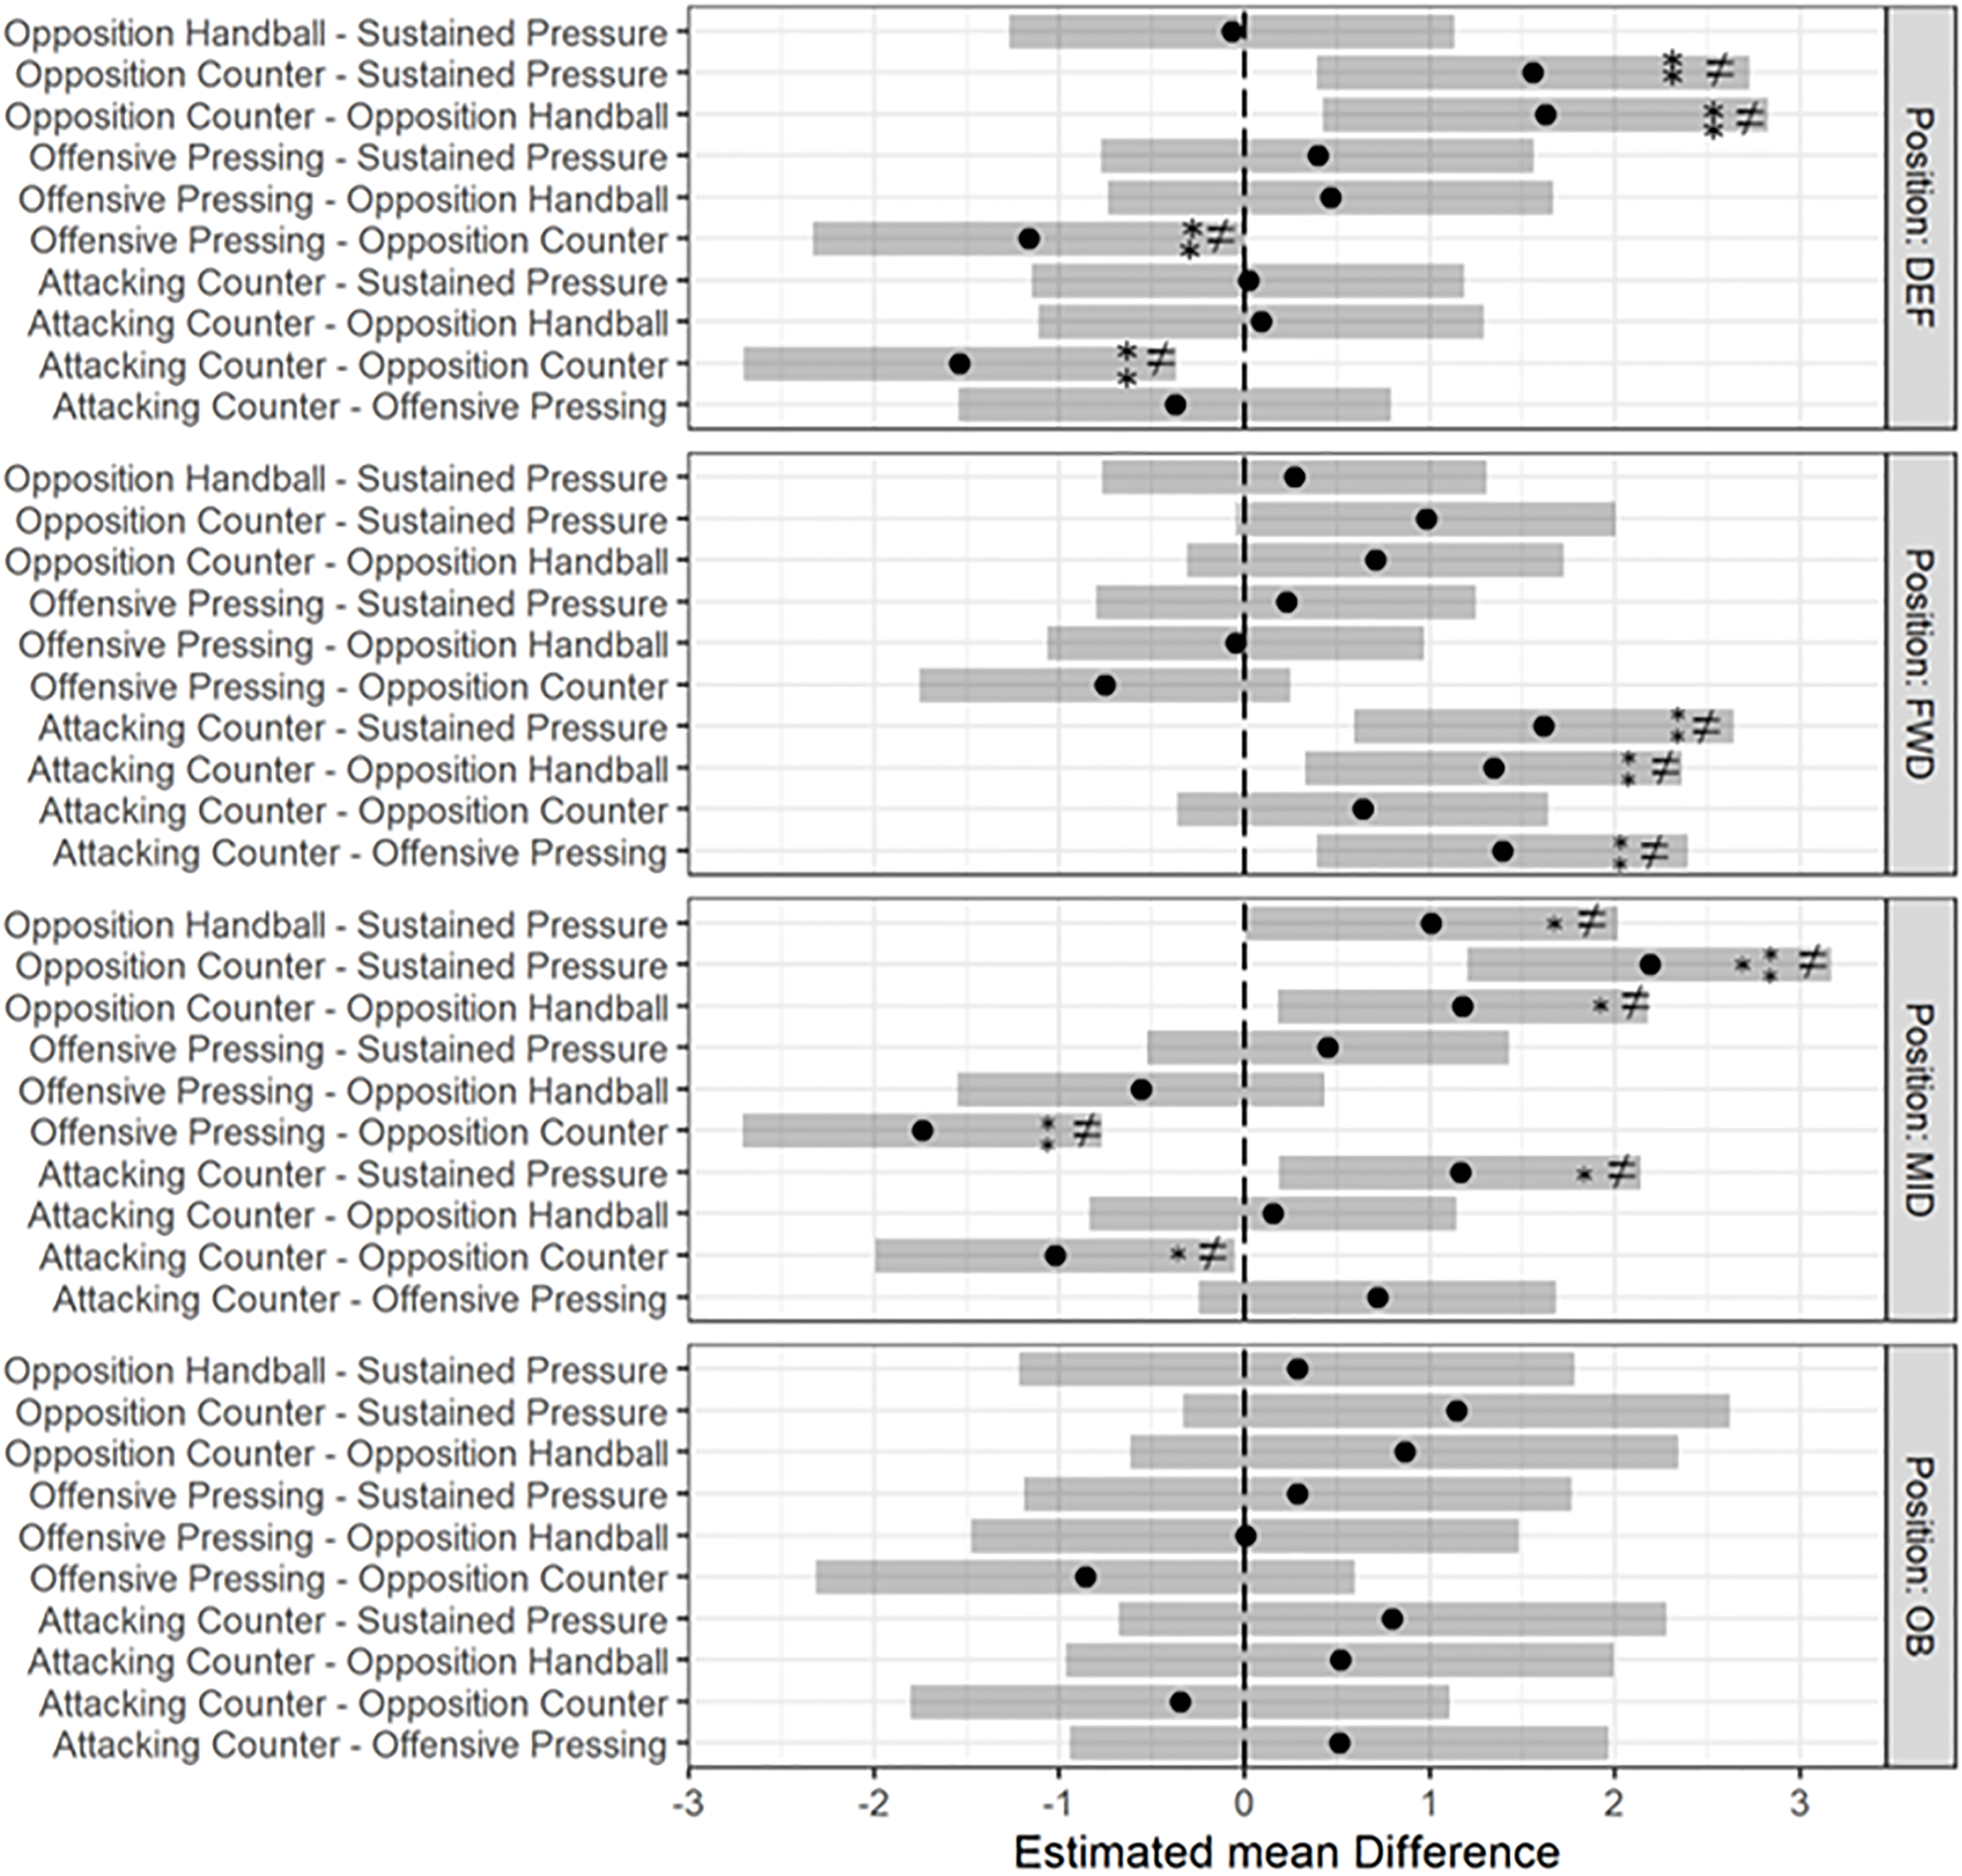
The estimated mean differences, for high-speed running efforts (>5.5 m/s), between phases of play for each position with 95% CIs. ≠ = statistically significantly different. ⁎ = small effect sizes. ⁑ = moderate effect sizes. ⁎⁑ = large effect sizes.
The estimated mean differences, for explosive distance, between phases of play for each position with 95% CIs. ≠ = statistically significantly different. ⁎ = small effect sizes. ⁑ = moderate effect sizes. ⁎⁑ = large effect sizes.
The estimated mean differences, for max speed, between phases of play for each position with 95% CIs. ≠ = statistically significantly different. ⁎ = small effect sizes. ⁑ = moderate effect sizes. ⁎⁑ = large effect sizes.
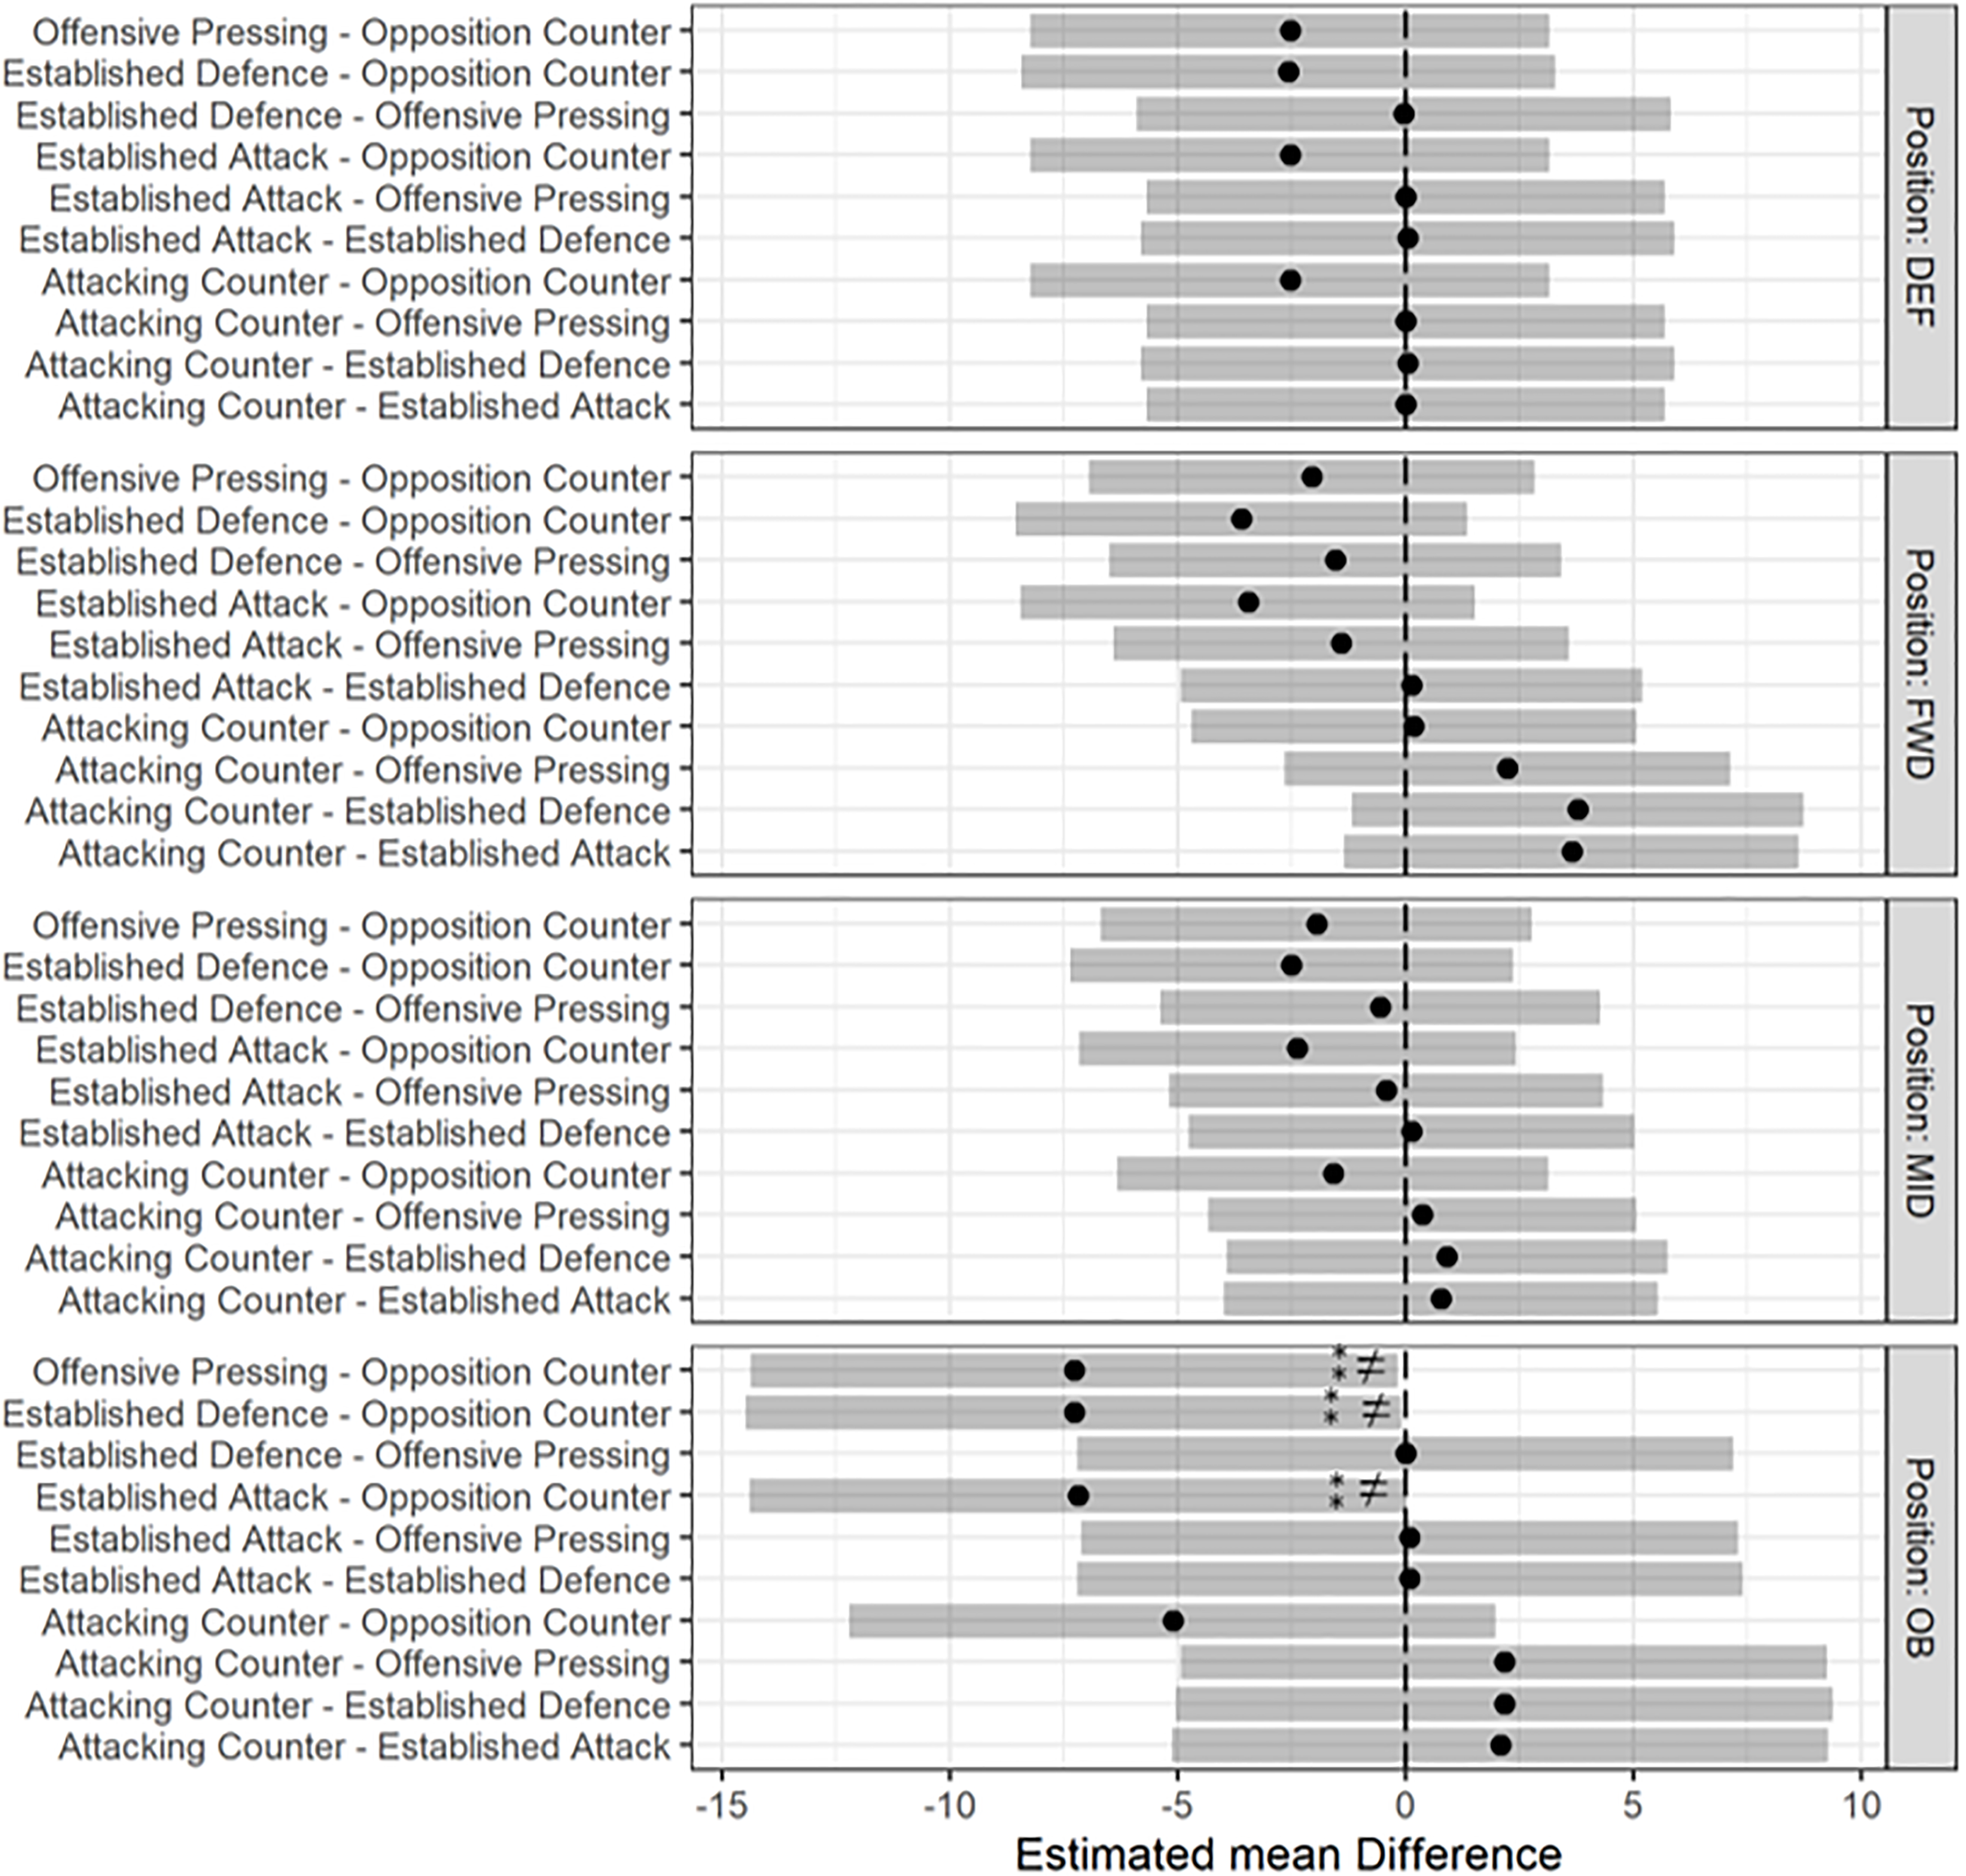
The estimated mean differences, for sprint distance (>7 m/s for 1 s), between phases of play for each position with 95% CIs. ≠ = statistically significantly different. ⁎ = small effect sizes. ⁑ = moderate effect sizes. ⁎⁑ = large effect sizes.
Opposition counterattacks elicited the highest amount of sprint distance per phase for defenders (2.59 m, SE: 1.48 m), outside backs (7.25 m, SE: 1.84 m) and midfielders (2.45 m, SE: 1.26 m). Attacking counterattacks elicited the highest mean sprint distance per phase for forwards (4 m, SE: 1.29 m). Established defence displayed the lowest sprint distance per phase for all positions, however, no significant differences were identified between phases for sprint distance for all positions except outside backs (Figure 7). Opposition counterattacks elicited significantly more sprint distance than offensive pressing (7.13 m, SE: 2.22, p = 0.01, ES: 0.94), established defence (7.15 m, SE: 2.27, p = 0.02, ES: 0.95) and established attack (7.06 m, SE:2.06, p = 0.02, ES: 0.94) for outside backs. Between position, contrasts can be found in Table 5.
Statistically significant different contrasts between positions, for the phase of play, by metric with standard error, p-values and Cohen’s D effect size.
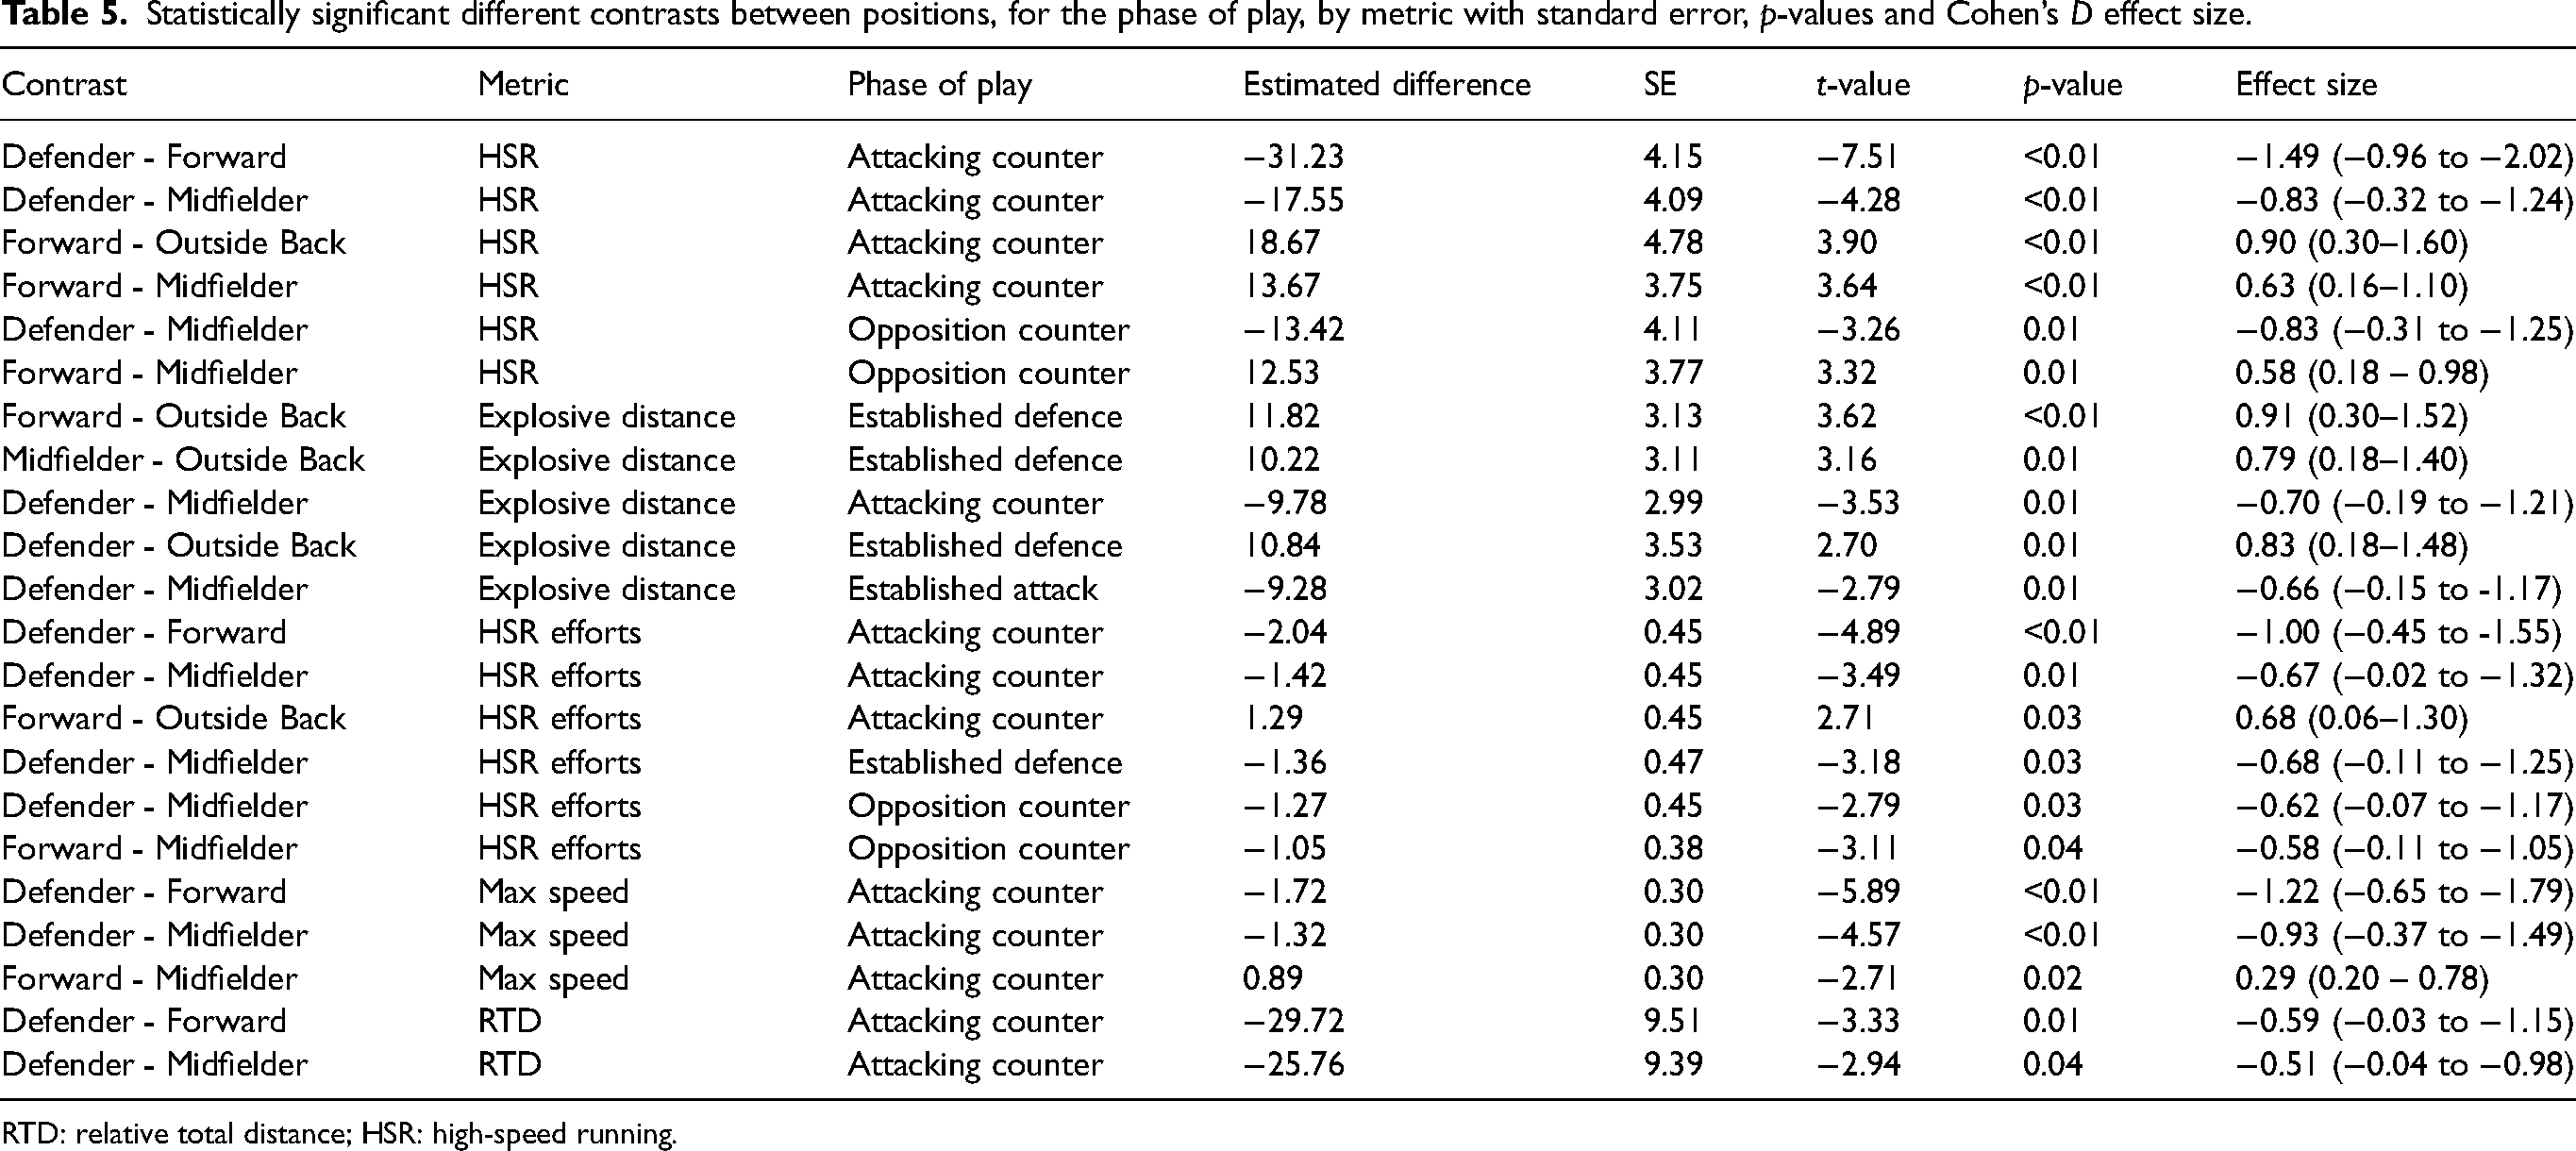
RTD: relative total distance; HSR: high-speed running.
Model performance
The phase of play alone explained between 3 (ED) and 22 (RTD)% (R2) of the variance present in the data, depending on the metric. Combined with position, including the interaction effect, 9%–26% of the variance was explained. Conditional R2, which includes the random effects, identifies that the model captured between 21% and 38% of the variance in the data.
Discussion
This is the first study to investigate the influence of phase of play on locomotor activity in men's international hockey. The primary aim of this investigation was to identify the differences between phases of play while considering playing position, to provide a greater understanding of the foundations of locomotor activity. An identifiable trend was apparent across positions with particular phases producing peak values for some metrics. For example, peak max speed was achieved for all positions during offensive pressing phases (Figure 1), while peak RTD values were displayed during opposition counterattacks (Figure 1). A large quantity of between-phase differences for each position, and between-positions differences, were apparent for max speed (Figure 6), HSR efforts (Figure 4) and HSR (Figure 3). These findings may identify potential reasons for the existence of inter-position differences in locomotor activity across a match and provide potential insight for the planning of match-related training.
Positional differences existed during attacking counterattack phases, with defenders producing lower values than both midfielders and forwards for HSR, HSR efforts, max speed and RTD (Figure 1). Combined with the finding that during opposition counterattacks defenders displayed significantly greater RTD (Figure 2) and ED (Figure 5), with moderate ES, compared to attacking counterattacks, our results highlight that the role of defenders in attacking counterattacks is less physically demanding than other positions. Positional differences potentially exist during attacking counterattacks, due to the tactical instructions given to defenders. Forwards are typically located higher up the pitch, with their main priority in the early phases of a counterattack being to increase the spread of the team vertically up the pitch, 30 as quickly as possible, in order to increase the space in which the opposition defence must cover. Additionally, midfielders are tasked with supporting these forward players once they receive the ball higher up the pitch. Therein, the rapid transition from defensive to offensive phases is more physically challenging for midfielders and forwards as the tactical demands of the position require them to operate during these phases. In contrast, there is limited transition required into attacking phases of play for defenders as they are tasked with preventing the next counterattack and to stay in a more defensive position. This is substantiated by the finding that defenders complete less HSR (moderate) (Table 5) and less HSR Efforts (moderate) (Table 5) than midfielders during opposition counterattacks highlighting that their already defensively advantageous position limits the physical challenge of this transition. A likely explanation of these findings is counterattacks usually occur because of a turnover which may mean midfielders are in an advanced position and the general team is in an unstructured state with large amounts of the pitch to cover to return to a defensively advantageous position. Therein, they must quickly retreat to their defensive half, compared to defenders who would be expected to already be in a defensively advantageous position.
The established defence also presents positional differences regarding match demands. Outside backs display lower values for ED than defenders (moderate), midfielders (moderate) and forwards (moderate) (Table 5). It is interesting that during a defensive phase that a position (outside back) that is typically more defensively orientated does not cover more distance, as it is defined by extended periods of opposition possession close to the investigated team's goal. It would be expected that outside backs are heavily involved in established defence phases of play due to the need to man-mark opposition forwards, however, it is now evident that they are more stationary. Established defence elicited the second lowest values for RTD and the lowest for ED compared to other phases for outside backs (Figure 1). Both opposition counterattacks and offensive pressing phases elicit greater max speeds than established defence phases for all positions (Figure 6). This highlights that the max speed qualities of players are not maximally challenged during established defence phases and other physical qualities may be more important during these phases. This may occur as these phases typically occur for long periods in a condensed area with limited spatial exploration taking place. Instead, the tactical structure is important during this phase to limit the space the opposition can operate within.
Attacking counterattacks also elicit greater max speeds than established defence phases for outside backs, midfielders, and forwards (Figure 6). This again highlights the limited interaction that defenders have with this phase. Max speed, however, should be focused on as an important quality for the other positions. Additionally, it should be noted that an increase in attacking counterattacks will demand higher levels of maximal speed efforts from these positions and this is something that should be accounted for in training. Furthermore, the amount of both forms of counterattacks should be considered in the analysis of full-match locomotor activity and may explain the greater amount of high-speed running completed by forwards and midfielders compared to other positions noted in research. 31
Phases of established attack also elicit lower max speed values than offensive pressing phases for all positions as well as compared to opposition counterattacks for defenders, midfielders, and forwards (Figure 6). In terms of max speed, it appears that extended periods of play in compressed space limit the requirement to run at high speed. This insight is beneficial for the planning of training, particularly around planning exposure to particular types of fatigue during a microcycle. Additionally, it has a role in a players return to play training process as identifying phases of play that place lower physical stress on the players, can assist with training session design, for example aiding a safe return to play post hamstring injury via prevention of sudden exposures to max speed by avoiding counterattack drills. 32 It is worth considering the percentage of the players max speed capacity, in this case, no phase exposed players beyond 86% of their max speed capacity with offensive pressing and attacking counters.
HSR is a highly important metric in hockey, 33 with findings from this study noting opposition counterattacks eliciting peak average values for defenders, outside backs and midfielders. This phase presents the largest physical demand (HSR – Figure 1) for defenders with significantly moderate effect sizes identified between opposition and attacking counterattacks (Figure 3). Despite displaying peak average values during opposition counterattacks, attacking counterattacks are similarly challenging to HSR capacities for outside backs. Outside backs are the only position to not display a significant difference between these two phases, highlighting the need to split defenders into two groups which are not common in hockey research. 7
Phases of established attack offer the lowest physical demand (HSR) across all positions (Figure 1), with opposition counterattacks displaying moderate differences for all positions compared to phases of established attack (Figure 3). Attacking counterattacks display similar findings, but only for forwards and midfielders. These findings highlight how certain elements of locomotor activity in hockey are accumulated and some of the possible reasons for the existence of inter-positional output differences across a match. 7 Relatively similar trends were identified for HSR efforts, with low levels of effort displayed during the established attack and established defence phases.
Outside backs displayed no significant differences between phases for HSR efforts, which points to a consistent level of engagement across all phases. This contrasts with defenders, who completed more HSR efforts during the opposition counterattack than during the attacking counterattack (moderate) and offensive pressing (moderate) phase (Figure 4). This identifies that outside backs accumulate certain locomotor activity metrics in a different manner to defenders which should be acknowledged when investigating and comparing the locomotor activity profiles of hockey players.7,15,34 These positions are often amalgamated in hockey; however, they have distinct patterns of accumulation and tactical roles, thus the nuances of each role should be considered in future hockey research.
In hockey research, there is a large focus on match summaries and tournament summaries with a minimal exploration of contextual factors or segmentation of time. 31 RTD has been noted as 117 ± 11 m/min, 123 ± 9 m/min and 127 ± 15 across match play,8,35 however, these values are not reflective of the true intensity players are exposed to within match play. Within team sports36,37 the most intense period of play, using 1–10-min periods has been widely investigated and this style of analysis has transferred to hockey.3,6,34 Peak intensity periods, 1-min moving average intervals, have been reported as 50%–65% greater than total match averages, 34 however, attempts to replicate these periods in training, from an RTD perspective, have been unsuccessful. 38 This attempt was made through the use of varied size small, sided games; however, this may not elicit large-scale counterattacks as the playing numbers were small and so too was the playing pitch which may have prevented the accumulation of HSR and HSR Efforts and thus lower RTD. Drills which encourage repetitive counterattacks over large spaces may be more successful in replicating peak intensity demands for RTD, given the higher RTD values noted across positions for this period compared to total match averages. 39 This added context to the accumulation of locomotor activity by phase within match play is vital to informing training practices and narrowing the performance-training gap.40,41
This study is not without limitations as a single team was investigated throughout, meaning these findings potentially only reflect this team's tactical style and positional functions. Further investigation is warranted in a multi-team environment, yet challenges exist in this realm as there is limited sharing of data between international teams and inconsistent data collection processes between teams. Ten games are a small sample size, compared to similar studies completed in Australian Football, 42 however in international hockey competitive match play within a calendar year is limited. Additionally, fixtures are spread throughout a calendar year and to account for changes in squad selection and fitness levels it was deemed logical to only select matches played within a three-month period.
Multiple other factors that have been shown to influence match play locomotor activity were not included in this analysis, such as match result, location, quality of the opposition and weather conditions. 43 These should be considered in future investigations.
A final limitation of this investigation is the interaction between phases is not considered, without doubt, the previous phase of play has an impact on the next phase of play because it effectively determines the starting position of the next phase. Transitioning from an established attack to an opposition counterattack potentially means a greater distance will be completed compared to an established attack transitioning to offensive pressing. It would be worth further exploring how the previous phase impacts the following phase as well as how the total duration of each phase, relative to the total playing time of each position as a percentage, has on the locomotor activity of the players.
The model's total explanatory power is noteworthy (conditional R2 = 21%–38%), and the part related to the fixed effects alone (marginal R2) is 9%–26% depending on the metric. Positional differences are evident in hockey locomotor activity with limited research examining ‘why’ being sparsely available. Locomotor activity metrics such as max speed achieved and HSR phase of play explained a noteworthy amount of the variance present in the data. Even though less than 50% of the variance is explained by the model, it highlights the contribution phase of play has in the accumulation of locomotor activity and interposition differences in locomotor activity.
It is important to note that collecting five phases of play does not account for a portion of the total locomotor activity. It appears that this approach better captures higher-speed locomotor activity, that is, high-speed running and sprint distance (65% and 70% on average compared to 41% for total distance). Regarding explosive distance, for example, offensive pressing can only be sustained for a certain amount of time before physical limitations take effect, the opposition finds a way to play around/through the press, or the investigated team regains possession. We believe the unaccounted element of explosive distance occurs when the investigated team is not in a high press, or when the game is in a more settled pattern of ‘build up’ for either team with no clear high press. These are unstructured phases of play that have no clear pattern and do not fit within the analysis model employed by the performance analysis team and coach.
On a per-phase basis, attacking counterattacks, offensive pressing, and opposition counterattacks accounted for a greater proportion of output completed compared to other phases. As highlighted by this investigation, these phases particularly stress metrics relating high-speed activities, as well as relative total distance and a large part of their ability to capture the output, may be attributed to their importance as phases within the sport and their contribution to the high relative intensities displayed by hockey players compared to other sports.43,44 It may be important to quantify further phases of play in order to capture a greater proportion of the low-intensity output of players.
In conclusion, the phase of play has a main effect on locomotor activity in men's international hockey. Opposition counterattacks present a unique maximal challenge in terms of max speed and RTD across positions. Positional differences are illustrated dependent on the phase of play, with these findings perhaps explaining the positional differences identified in previous research.7,31 Differences identified between phases for the position of the outside back confirms the necessity to separate this position from defenders when analysing locomotor activity. Finally, locomotor activity data should be analysed through the lens of the match phase of play to better understand how match play locomotor activity is accumulated.
Practical applications
Outside backs should be considered as a separate position from defenders in future hockey research as their pattern of accumulation relating to locomotor activity is different from other positions. This identifies their different tactical role, and they may require different training compared to other positions.
These findings explain some of the differences in locomotor activity total match values between positions.
During the counterattacking phase of play, the demands on forwards and midfielders are higher. This phase of play calls for maximal demands in terms of HSR, HSR entries and max speed across positions.
locomotor activity data should be analysed through the lens of the match phase of play to better understand how match play locomotor activity is accumulated.
Footnotes
Declaration of conflicting interests
The authors declared no potential conflicts of interest with respect to the research, authorship, and/or publication of this article.
Funding
The authors disclosed receipt of the following financial support for the research, authorship, and/or publication of this article: Funded by the Irish Research Council through an enterprise partnership with Hockey Ireland – grant number: EPSPG/2019/458.