
Abstract
This study aimed to investigate the differences in physical and technical characteristics among three specific rugby union small-sided games (SSG) and to examine the variability of these characteristics over three weeks within a preseason of a professional rugby union club. Eighteen backs and 22 forwards were recruited for the study. The three SSG designs were: backs only (SSG-B), forwards only (SSG-F) and both backs and forwards (SSG-BF). Physical characteristics were quantified using external (e.g., total distance covered [m·min−1]) and internal (i.e., Stagno's training impulse [AU·min−1]) load measures. Technical characteristics were quantified using the number of rucks, successful passes, unsuccessful passes, line breaks and tries per minute. The SSG-BF produced a greater high speed (>61%) running distance covered in comparison with SSG-B (1.97 vs. 1.32 m·min−1) and SSG-F (1.26 vs. 0.94 m·min−1), and more successful passes (9.47 vs. 9.36 count·min−1) and line breaks (0.98 vs. 0.65 count·min−1) than SSG-F. Conversely, all the other physical and technical characteristics were higher in SSG-B and SSG-F. All the physical and technical characteristics, except high speed (>61%) distance covered in forwards and unsuccessful passes and tries per minute, changed over days showing either a linear or quadratic pattern. Based on these findings, practitioners may implement position-specific SSG (i.e., SSG-B and SSG-F) to expose players to greater physical and technical characteristics. Furthermore, if SSGs were to be repeated across multiple days, practitioners should be aware of the possible variability in physical and technical characteristics due to potential adaptations to the constraints or the onset of fatigue.
Introduction
The main objectives of preseason are the improvement of physical characteristics (e.g., cardiovascular capacity, strength), alongside technical skills and tactical understanding in preparation for the upcoming competitive season.1–3 These components may be trained in isolation or concurrently. 4 Small-sided game (SSG) training is a training method that can be used to develop physical, technical and tactical characteristics concurrently 5 and is commonly implemented during the preparatory periods of the season in team sport athletes.6–8 Multiple factors should be considered when designing an SSG, such as the specific objective of the game (e.g., improving tactical understanding) and the pedagogical approach used (e.g., constraints-led approach). 9 In addition, during the design process, sport coaches and sport scientists may also consider which physical stimuli (e.g., total distance covered) may contribute to a certain physiological response in their athletes when manipulating specific constraints. 10 Constraints have been defined as ‘information to shape or guide the (re)organisation of a complex adaptive system’ 9 p.14 and have been categorised into individual (e.g., training experience), environmental (e.g., playing surface) and task (e.g., playing rules) constraints.
Extensive research has been carried out on SSG in soccer, Australian rules football and hurling. 11 However, findings from this literature may have little applicability to rugby football codes. As recommended by Abt et al., 12 it is important to recognise why research carried out in some sports may not be directly transferable to others. When designing practice sessions to develop technical skills and tactical understanding, training practice should have high ecological validity, meaning that there is a similarity between information that the athlete can detect from the training environment and information detected during official competitions. 9 Therefore, the specific nature of rugby football codes (i.e., the ball must be passed backwards, rucks in open play) should be considered in the process of SSG design if the goal is to develop physical, technical and tactical characteristics concurrently. 13
Limited research is available investigating the effect of constraint manipulation on physical and technical characteristics specifically in rugby football codes SSG and contrasting findings can be found in the literature. 14 For example, in terms of physical characteristics, Kennett, Kempton 15 found higher external and internal loads with greater pitch dimensions, whereas Vaz et al. 16 observed no effect of pitch dimensions on external and internal loads in rugby union. Similarly, technical characteristics (e.g., total passes) showed both no difference 17 and an increase 18 when pitch dimensions were reduced in rugby league SSG.
In rugby union, during the process of SSG design, the anthropometrical differences between forwards and backs (e.g., stature) 19 and their different roles during competitive games 20 should also be considered to ensure ecologically valid SSGs. For example, an SSG may be designed to develop certain aspects of the game (e.g., attack) for a specific positional group (e.g., backs only) or to reproduce game-based scenarios, thus including both backs and forwards. 13 To date, however, only one study in rugby union SSG has specified the positional group of the players involved, although this SSG was characterised by low ecological validity since the ball could be passed in any direction.14,21 Consequently, limited research is available to support the design of ecologically valid rugby union SSG, considering the differences between backs and forwards.
Throughout the preseason, SSGs are often repeated over multiple days and knowledge of the variability of physical and technical characteristics may support practitioners in the process of training design. 10 Previous studies in rugby union and rugby league SSG found that physical characteristics showed minimal variability across two separate days (e.g., total distance: ICC[90%CI] = 0.90[0.82, 0.95], mean percentage of maximal heart rate: day-1 mean[SD] = 89.0[4.1]%, day-2 mean[SD] = 88.5[4.1]%, ICC = 0.81, 95% limits of agreement = 0.2 ± 4.4), whereas no study has looked at the variability of technical characteristics.15,22 However, in practice, SSGs are often implemented over longer periods of time (e.g., three-week training block), and studies investigating a higher number of sessions may be necessary to understand whether rugby union SSG would offer a consistent physical and technical stimulus to players over multiple days.
Therefore, this study aimed to: (1) investigate the differences in physical and technical characteristics among positional, group-specific rugby union SSGs, and (2) examine the variability of physical and technical characteristics throughout three weeks of the preseason in a professional rugby union club. Based on the contrasting findings from previous research on rugby union SSGs, 14 and the lack of a clear direction of effect, it was hypothesised that the physical and technical characteristics would be similar across SSG designs. Conversely, due to the limited research on the effect of time, a specific hypothesis could not be formulated.
Methods
Subjects
The sample size of the present study was characterised by forty professional rugby union players (Table 1) from the same rugby union club competing in the English Gallagher Premiership. The sample from the study was based on the availability of players at the professional rugby union club throughout the preseason 2019/2020; hence, it was derived from convenience sampling. 23 Informed and written consent were received by all the participants before the start of data collection. The protocol of the study followed the guidelines of the Declaration of Helsinki and received ethical approval from Leeds Beckett University Ethics Committee (ethics ID: 82039).
Individual characteristics for the subjects of the study.
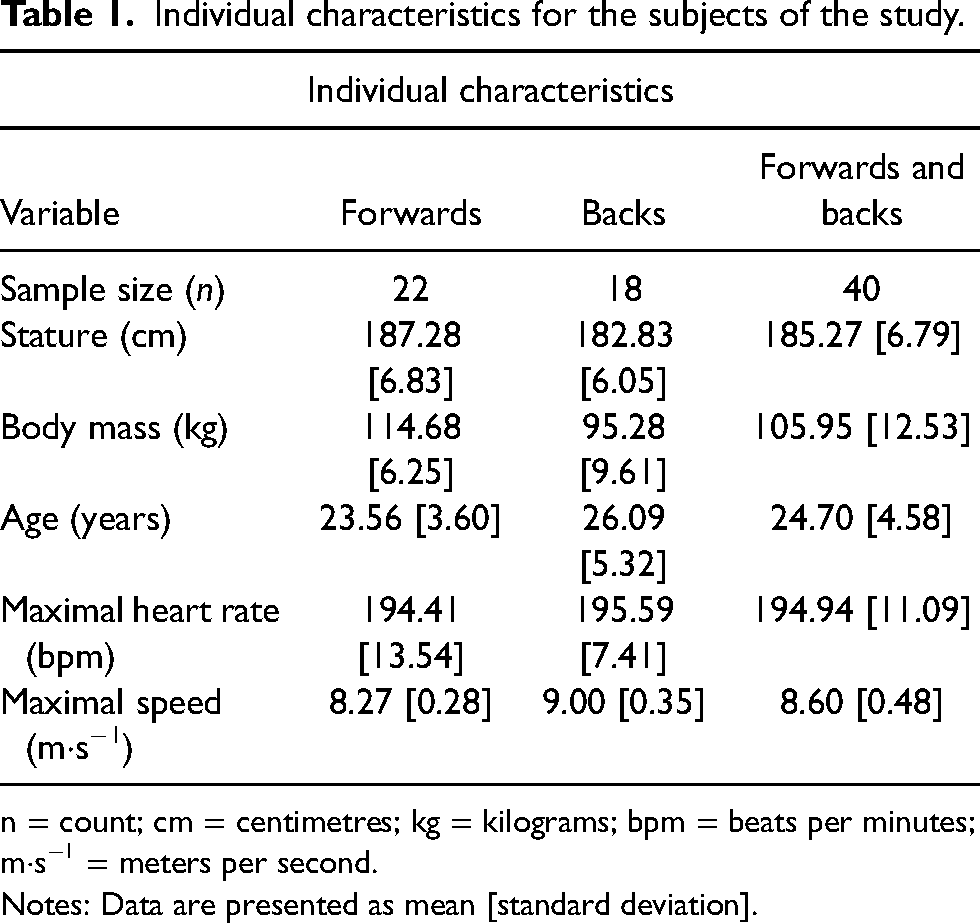
n = count; cm = centimetres; kg = kilograms; bpm = beats per minutes; m·s−1 = meters per second.
Notes: Data are presented as mean [standard deviation].
Design
Three different SSGs were designed using a constraints-led approach through the collaboration between sports scientists and elite rugby union coaches. 9 One SSG was designed specifically for backs (SSG-B), one specifically for forwards (SSG-F) and one specifically for both backs and forwards (SSG-BF). The objectives of the SSG-B and SSG-F were: (1) tactical, the improvement of the tactical understanding of specific attacking shapes, and (2) physical, the delivery of high-intensity interval training with a 2:1 work-to-rest ratio to develop the cardiopulmonary system. The objectives of the SSG-BF were: (1) tactical, exposing players to official game-based scenarios, thus improving decision-making and attacking shapes, and (2) physical, delivering a similar physical stimulus to SSG-B and SSG-F. The specific constraints of each SSG are reported in Table 2.
Constraints of the three small-sided games.
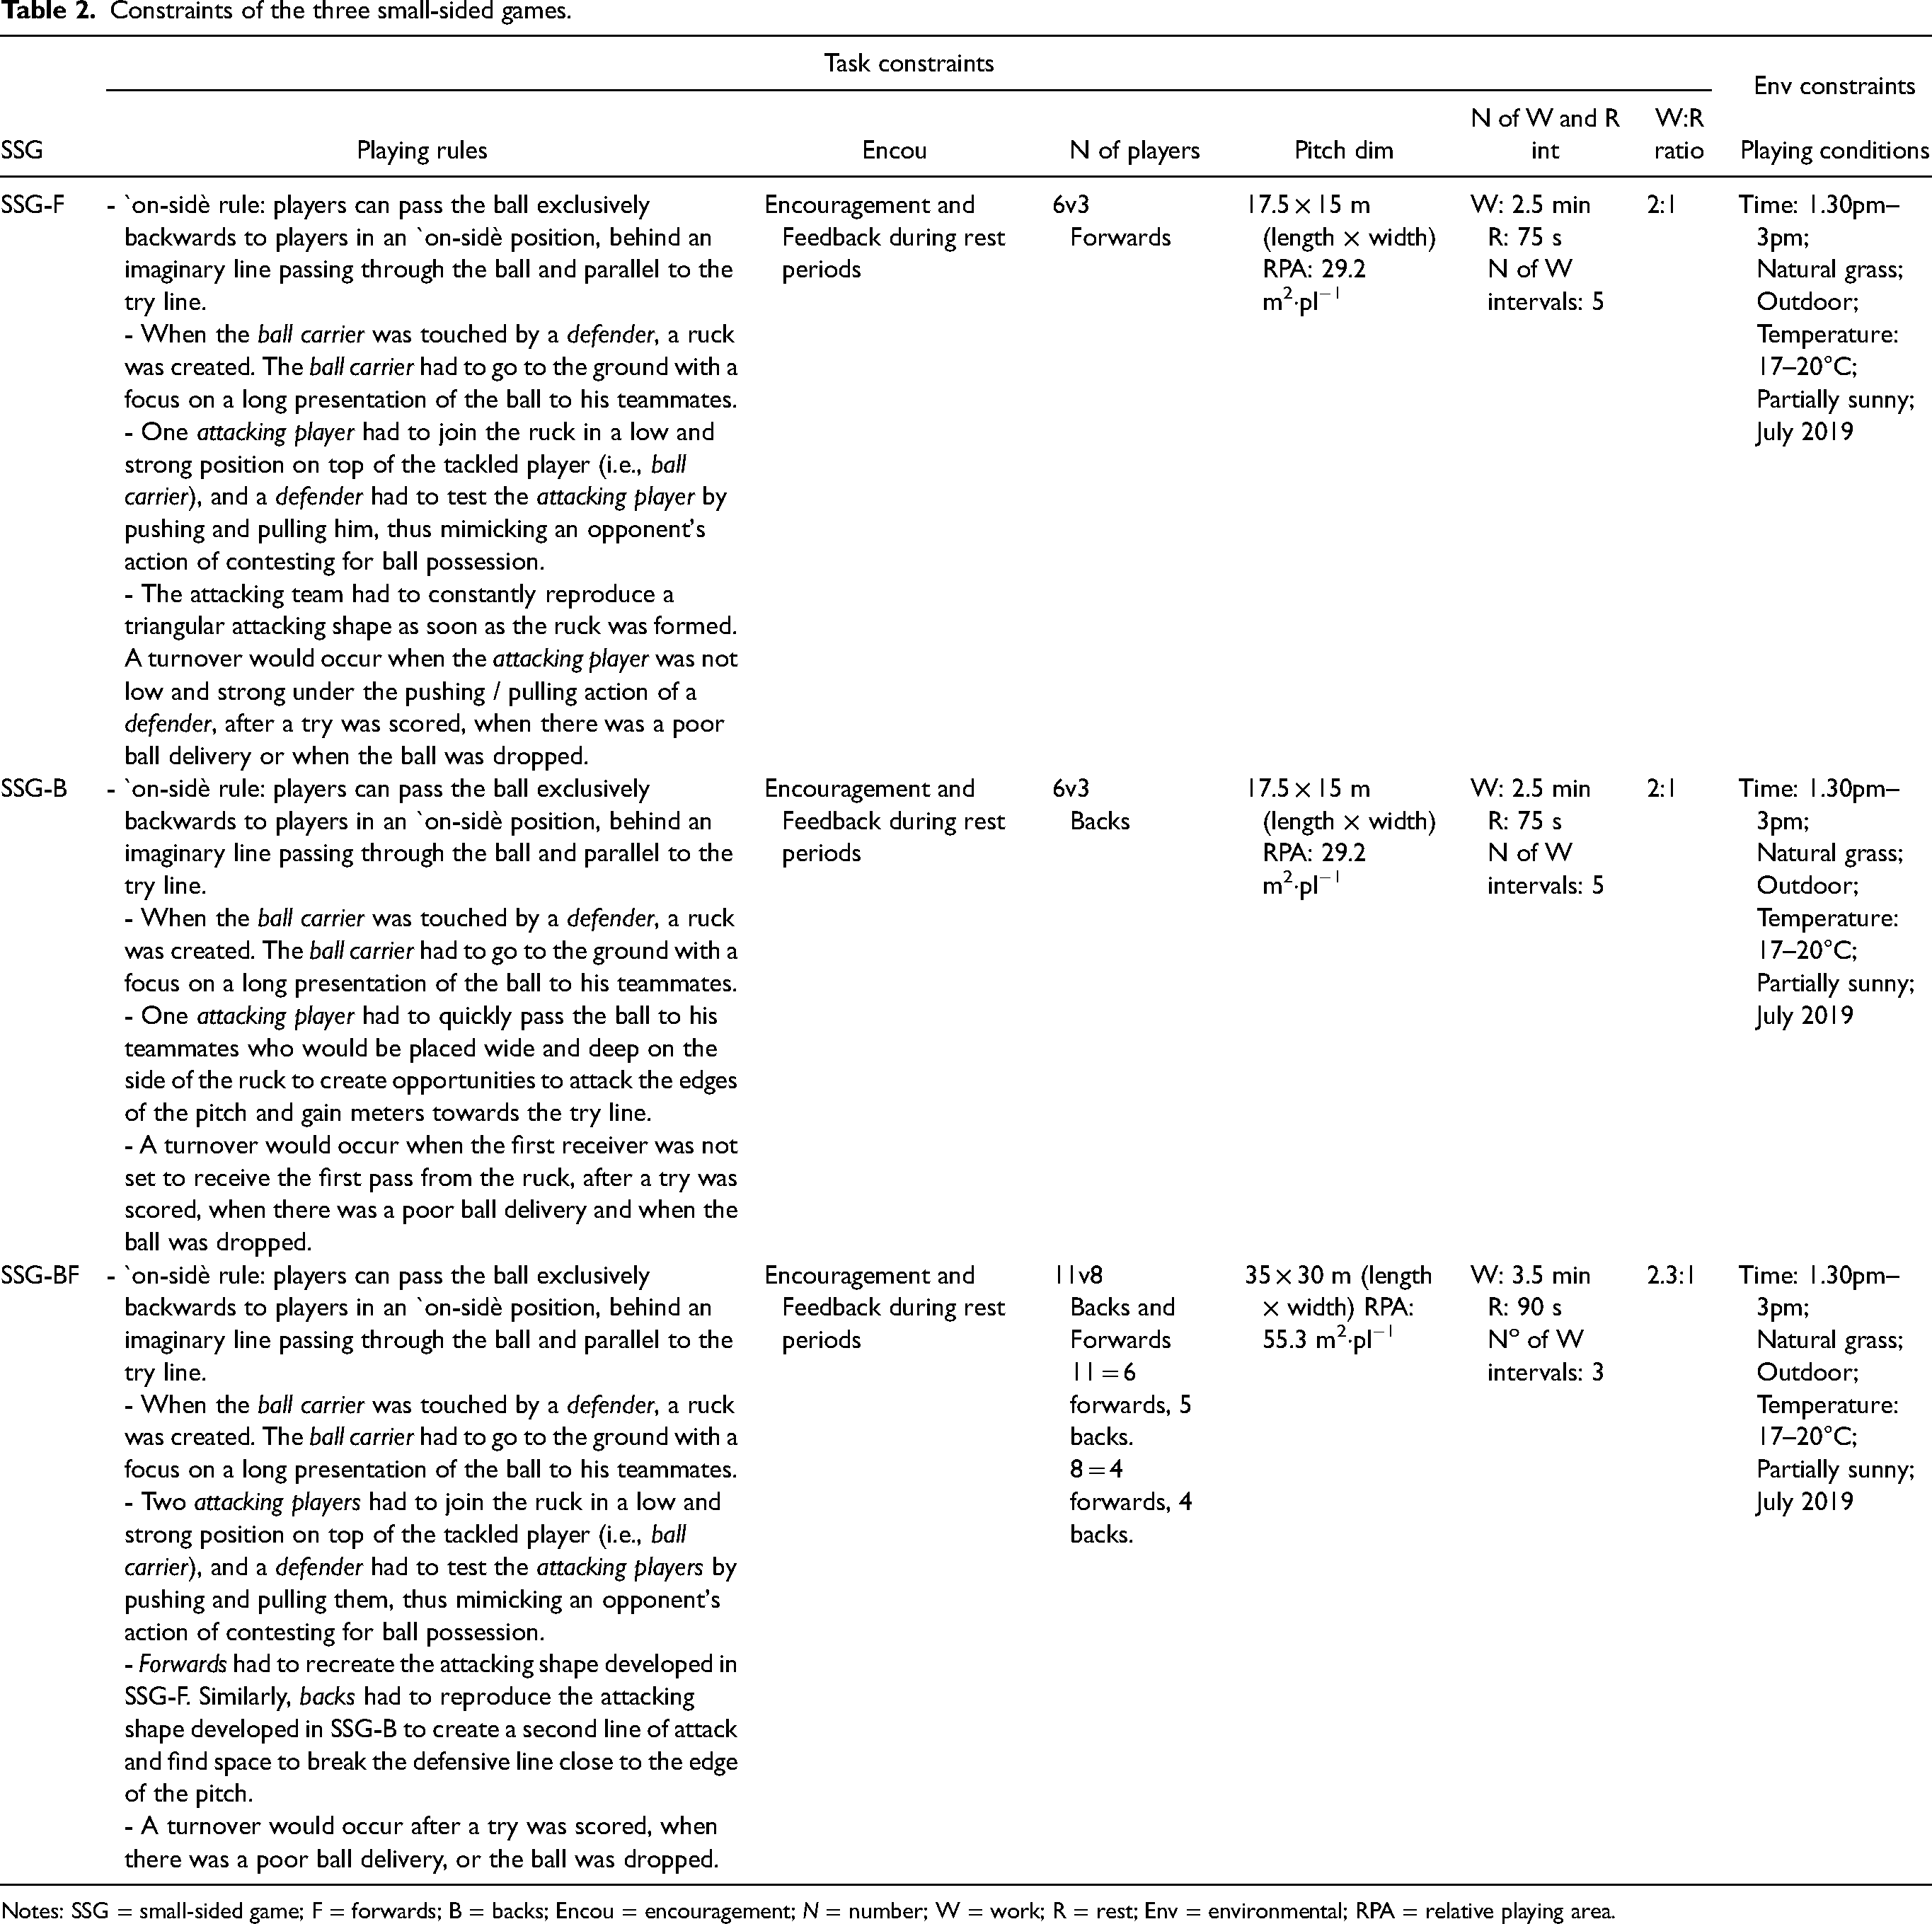
Notes: SSG = small-sided game; F = forwards; B = backs; Encou = encouragement; N = number; W = work; R = rest; Env = environmental; RPA = relative playing area.
Data for the SSGs were collected on six different days, separated by a minimum of 48 h recovery, over a three-week period during the preseason of the English Gallagher Premiership 2019/2020 (Table 3). Due to the Rugby World Cup taking place in Japan (2019), the preseason for the Gallagher Premiership 2019/2020 campaign was characterised by 12 weeks of training. The SSGs were placed after three weeks of on-feet running conditioning and speed development, in weeks 4–6 of the first block of the preseason training. Each day of data collection was characterised by a standardised warm-up consisting of light aerobic exercise, change of direction and sprint efforts, followed by the SSG-B and SSG-F which occurred concurrently, a recovery period of 3 min, and ultimately SSG-BF (Table 3). Throughout the three weeks before the start of data collection, individuals’ maximal speed was collected using a 40-m straight line sprint, 24 and individuals’ maximal heart rate was collected as the 5-s average maximal heart rate collected over multiple training methods (i.e., 30–15 intermittent fitness test, running conditioning and tactical training). 25
Preseason plan and days of data collection.
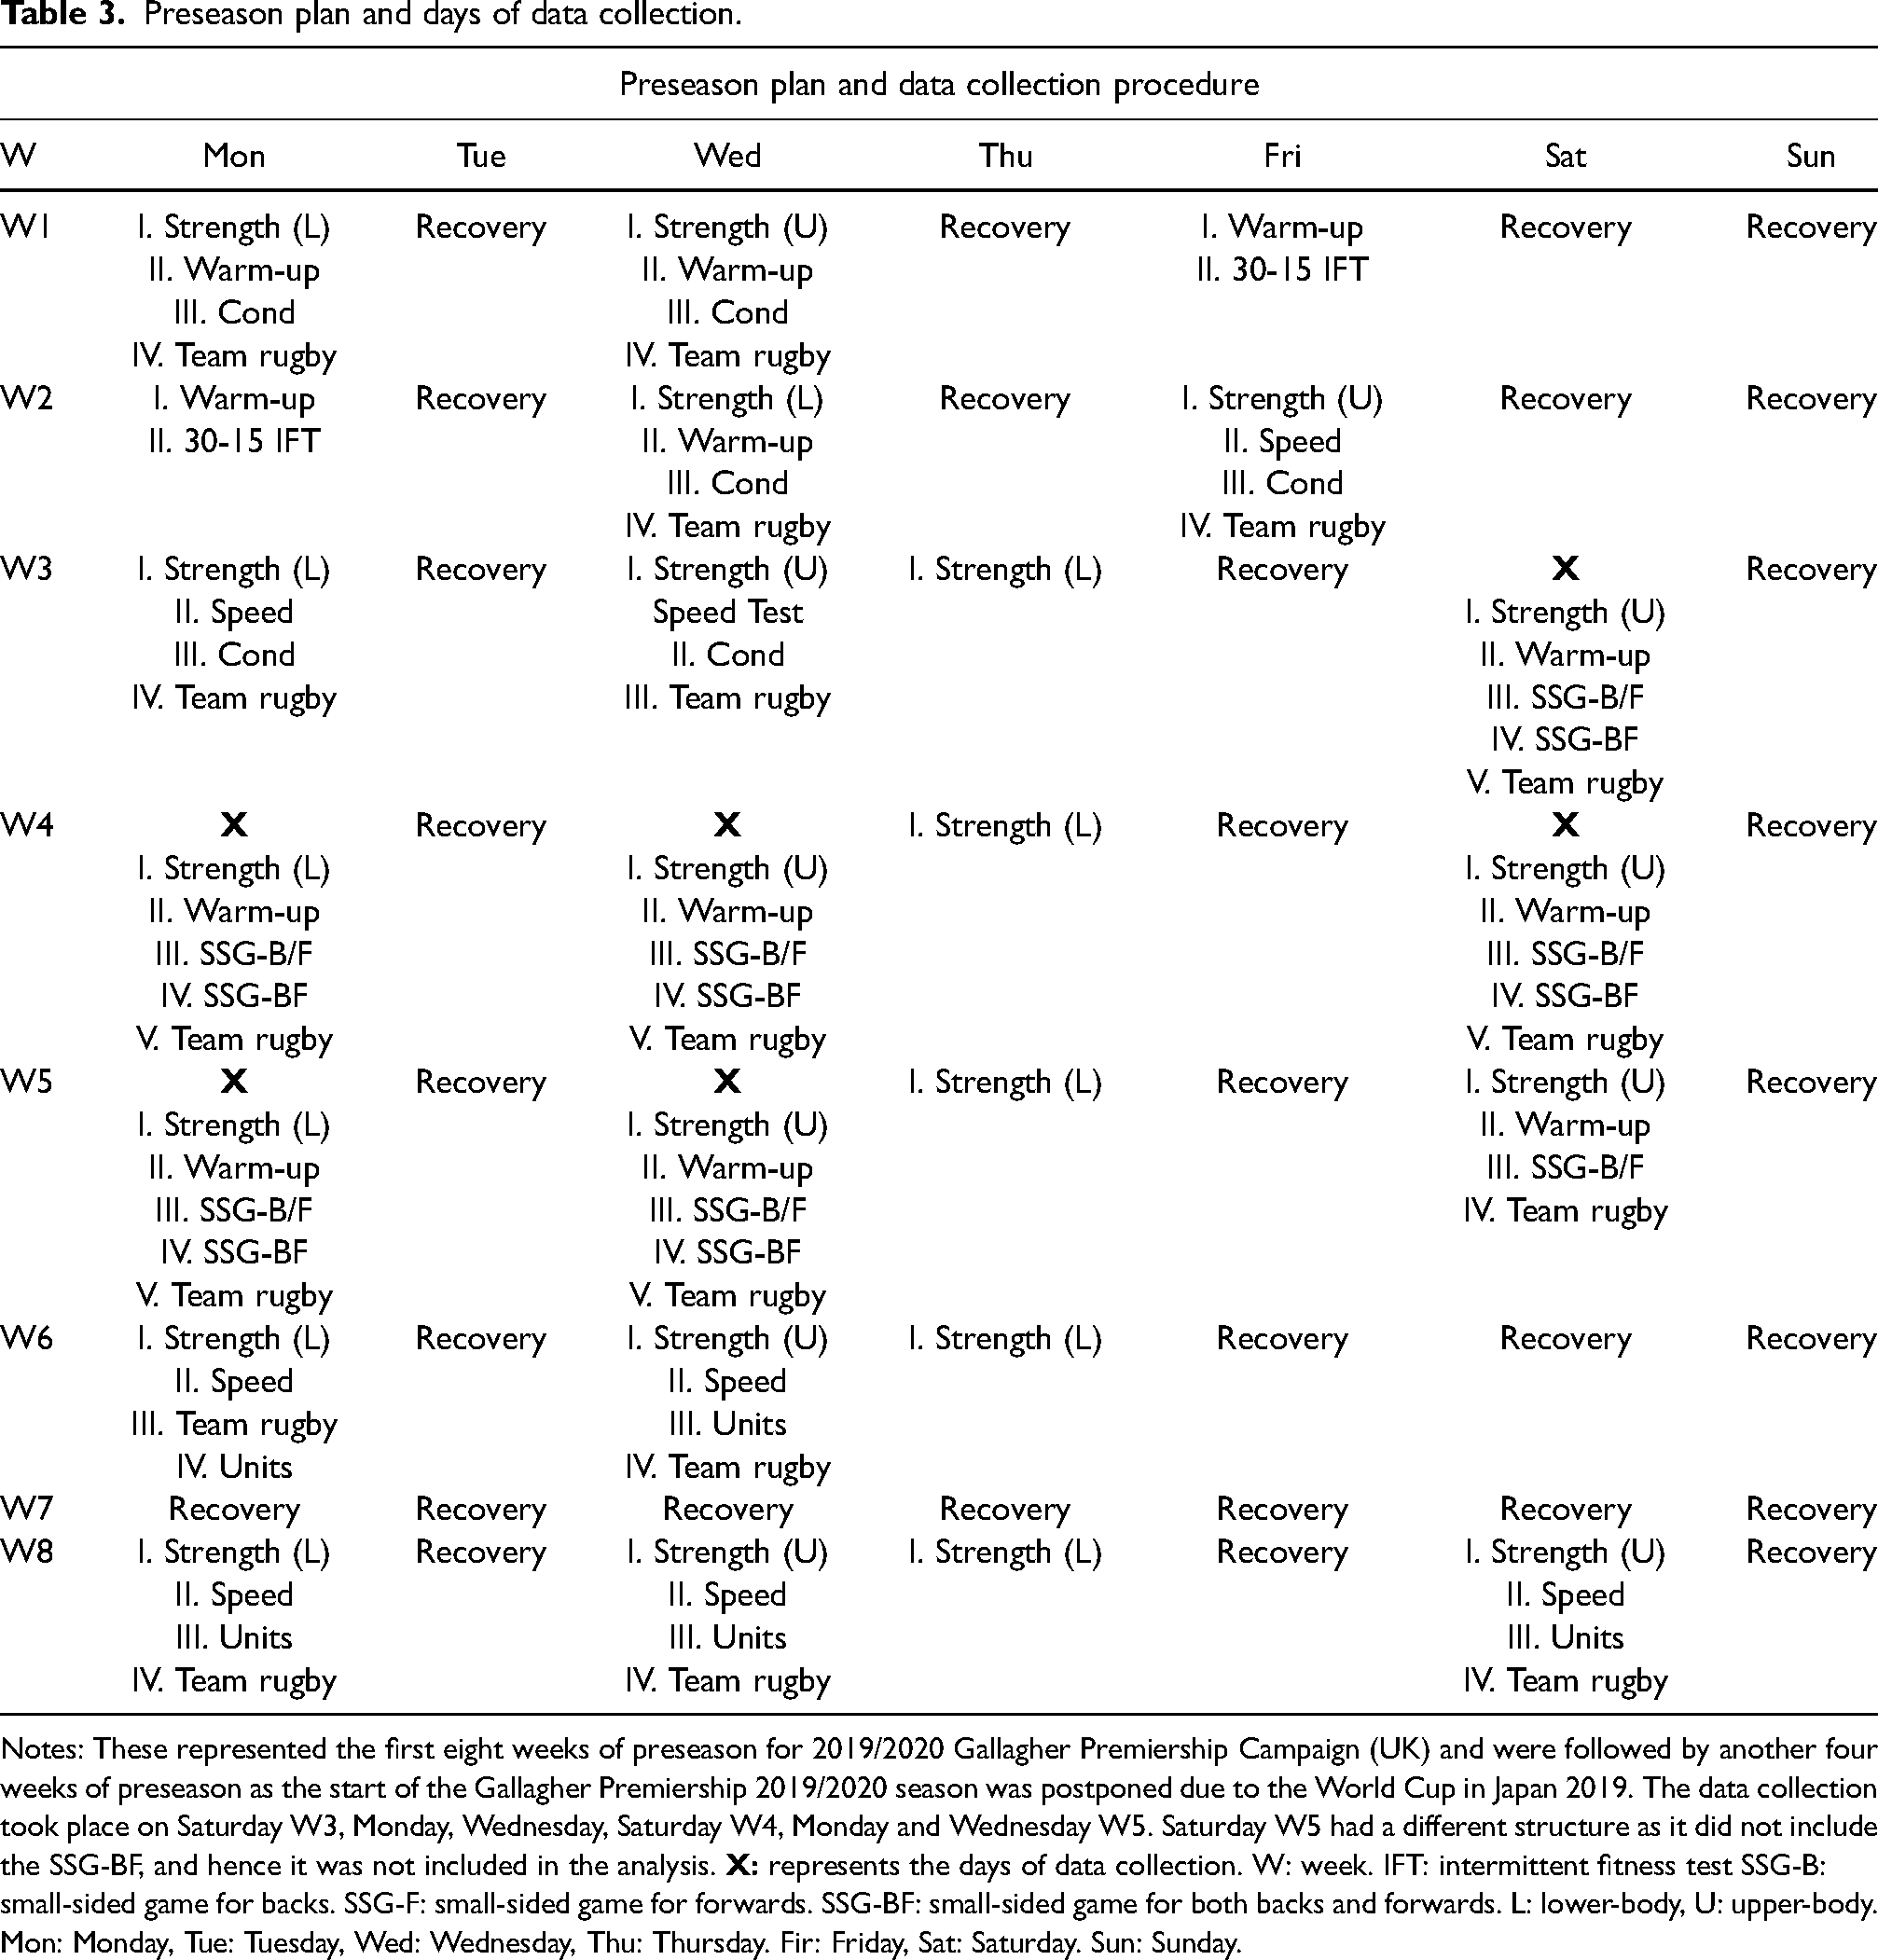
Notes: These represented the first eight weeks of preseason for 2019/2020 Gallagher Premiership Campaign (UK) and were followed by another four weeks of preseason as the start of the Gallagher Premiership 2019/2020 season was postponed due to the World Cup in Japan 2019. The data collection took place on Saturday W3, Monday, Wednesday, Saturday W4, Monday and Wednesday W5. Saturday W5 had a different structure as it did not include the SSG-BF, and hence it was not included in the analysis.
Methodology
Physical characteristics were quantified using: GNSS 10Hz devices (Vector S7, Catapult Sports, Catapult Innovations, Melbourne, Australia), video camera 25Hz (Sony NXCAM Avchd MPEG2 SD, Sony, Tokyo, Japan) and chest strap heart rate monitors (Polar H1, Polar, Kempele, Finland).
The GNSS 10 Hz devices were turned on outside fifteen minutes before players’ arrival to ensure that the devices were connected to a sufficient number of satellites (e.g., >6) before the start of the training session. 26 The devices were placed in a pocket of a custom-made vest produced by the GNSS manufacturer (Catapult Sports, Catapult Innovations, Melbourne, Australia) positioned on the upper back. Each player was assigned a unique microtechnology device for the entire duration of the study to minimise measurement error resulting from inter-device variability. 26 Total distance covered (m), high speed (>61%) running (HSR) distance (m) and average acceleration-deceleration (m·s−2) were collected to quantify external load using GNSS 10 Hz, pre-processed in Catapult OpenField console 3.3.0 and exported from Catapult OpenField cloud (Catapult Sports, Catapult Innovations, Melbourne, Australia). The validity and reliability of GNSS 10Hz have been reported previously.27–29 The mean and standard deviation (SD) for the number of satellites and horizontal dilution of precision throughout the duration of the study were mean = 12.5, SD = 1.46, and mean = 0.67, SD = 0.06, respectively.
A video camera 25Hz was utilised to record each SSG. Videos were then imported into Catapult Vision (Catapult Sports, Catapult Innovations, Melbourne, Australia) where the number of times a player got down to, and up from the ground, which was defined as get-up (count), was visually identified. This physical activity was considered due to the increased heart rate resulting from exercises involving upper limbs and transitioning from a lying to a standing position.30,31 Therefore, the number of get-ups would be representative of the external load. 32 The process of data collection was carried out by the first author (MZ). Intrarater reliability was assessed by re-coding a single day of data collection chosen at random after a six-week washout period. A two-way agreement mixed-effects model was used to determine intraclass correlation coefficients (ICC), 33 using the icc() function in the irr package in R 4.0.3. 34 Intraclass correlation resulted to be ‘excellent’ with an ICC [95%CI] of 0.98 [0.98–0.99]. 35
Chest strap heart rate monitors showed the highest accuracy when compared to an electrocardiogram (r = 0.99). 36 Heart rate was used as an objective measure to quantify internal load, using Stagno's training impulse (TRIMP) (AU) as an outcome measure. 37 The validity of this measure is supported by its relationship with changes in maximal oxygen uptake (r = 0.80, p = 0.017) and velocity at the onset of blood lactate accumulation (r = 0.71, p = 0.024) following a training intervention. 37 Stagno's TRIMP was determined by using individuals’ maximal heart rate, predetermined heart rate zones and weighting factors, similar to previous research.1,21
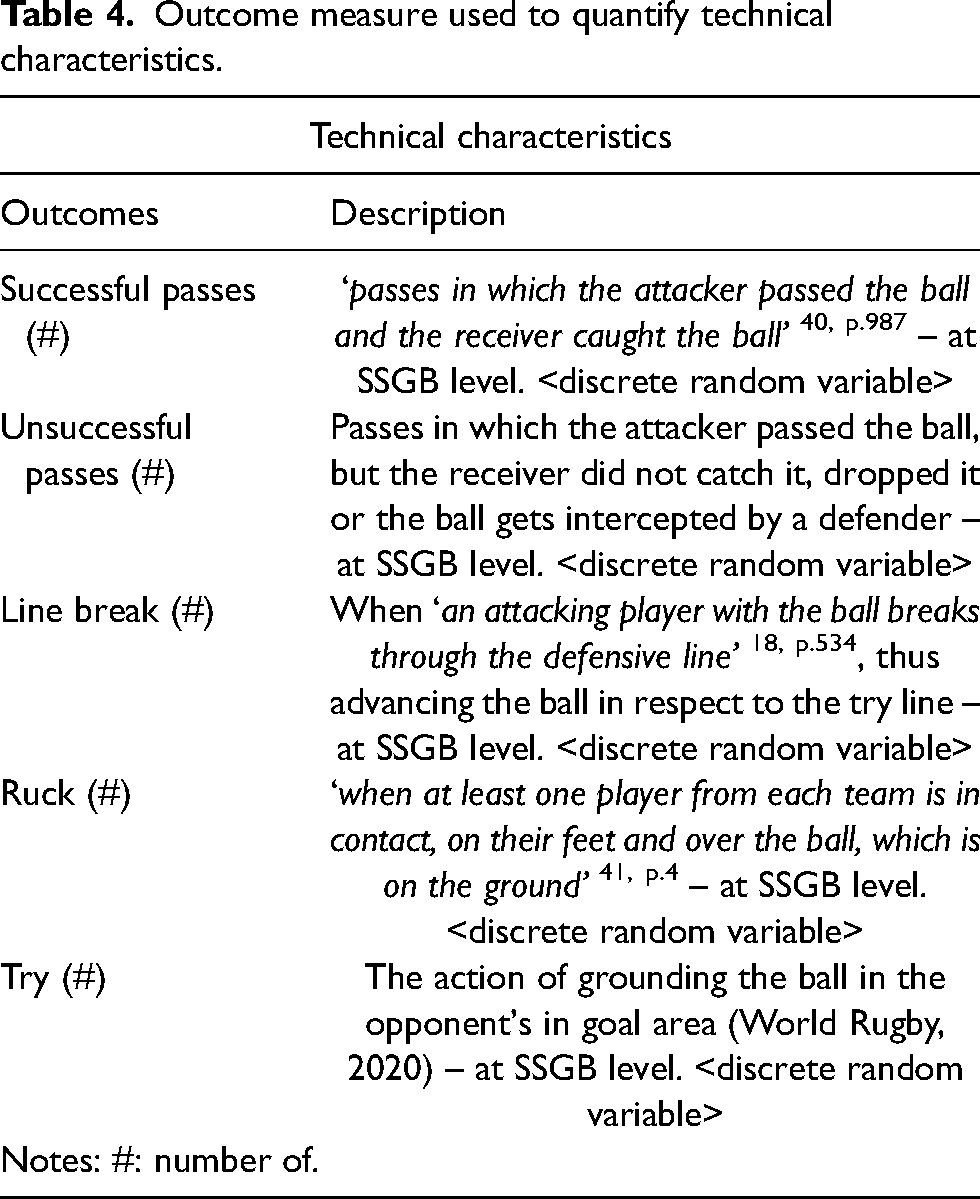
Technical characteristics were quantified using video camera recording at 25Hz (Sony NXCAM Avchd MPEG2 SD, Sony, Tokyo, Japan). Videos were imported into Vision Catapult (Catapult Sports, Catapult Innovations, Melbourne, Australia), where notational analysis was used to identify the technical actions over each SSG bout (Table 4). The validity of the metrics utilised (Table 4) is supported by their previous extensive use in rugby league and rugby union SSG research.38,39 Intrarater reliability for this process – carried out by the first author (MZ) – was ‘excellent’ (ICC[95%CI]: successful passes = 0.98[0.97–0.99], unsuccessful passes = 0.95[0.90, 0.98], line breaks = 0.94[0.89, 0.97], rucks = 0.98[0.96, 0.99] and tries = 0.95[0.90, 0.97]). 35 Intraclass correlation was calculated as a two-way, agreement, mixed effects model using icc() function from irr package in R 4.0.3. 34
Outcome measure used to quantify technical characteristics.
Statistical analysis
Analysis was conducted using R 4.0.3 34 in RStudio (RStudio Team, 2018, v1.2.1335). The likelihood-based approach was implemented for model building and statistical inference. 42 General linear models were implemented to identify the potential confounding factor of playing position (i.e., backs, forwards) over the physical characteristics of each SSG, using lm() function of stats package.34,43 If differences were identified, the effects of SSG design and day of data collection for physical characteristics would be investigated separately for backs and forwards, thus removing the confounding effect of the positional group. Technical characteristics were collected at an SSG bout level assuming similar technical abilities between backs and forwards for the specific variables investigated.
As players had to get down to and up from the ground, concerns were raised about the possibility of misplacement of the chest strap heart rate sensor, thus resulting in extremely low or zero values recorded. Therefore, heart rate data were investigated for potential outliers. Outliers were defined as ‘an observation (or subset of observations) which appears to be inconsistent with the remainder of that set of data’ 44 p.4. Both univariate (i.e., box plots, three SDs, modified z-scores) and multivariate (i.e., studentised deleted residuals, changes in model fit using the coefficient of determination R2 and Akaike Information Criteria, changes in model coefficients using DFBETAS, DFFITS, Cook's distance) techniques were utilised to identify potential outliers. 45
Before formal analysis, as the SSG-B and SSG-F were characterised by a shorter duration (2.5 min) in comparison with SSG-BF (3.5 min), data were standardised by minute (e.g., distance covered per minute and rucks per minute). As the study was characterised by a longitudinal within-subject repeated measures design, general and generalised linear (mixed-effects) models were implemented using lme4, GLMMadaptive and stats packages.34,46,47 The initial models were designed by including the SSG design (i.e., SSG-B, SSG-F, SSG-BF) and day of data collection (i.e., 0, 1, 2, 3, 4, 5) as fixed effects, and the intercept was included as a random effect and allowed to vary based on the individual player for physical characteristics and the individual SSG bout for technical characteristics. 43 In addition, for technical characteristics, the fixed effect of the coach involved in each SSG was included to enhance the accuracy of the estimates for SSG design and day of data collection. Model building was based on the simplicity of the model, Akaike Information Criteria, likelihood ratio test and visual assessment of the regularity of the log-likelihood function. 42 Model inference was based on maximum likelihood estimates (MLEs) and respective standard errors (SEs) derived from the log-likelihood function.42 Section 3.7 Wald statistics (i.e., t and z statistic) were used to test the hypothesis of the model coefficient being different from zero. 42 Values of Wald statistic close to zero suggest that the data are consistent with the hypothesis of the model coefficient being zero, whereas more extreme values suggest evidence against the hypothesis of the model coefficient being zero. 48 The log-likelihood function was also used to determine profile likelihood confidence intervals at the 95% level to identify a range of parameter values compatible with the data under the specified model.42 Section 3.7 The lack of effect of a model parameter was identified by a Wald statistic close to zero and a 95%PLCI including zero.
Results
Findings showed that backs were faster (i.e., maximal speed) than forwards (MLE = 0.74, SE = 0.10, t = 7.40, 95%PLCI = [0.54, 0.94]), but forwards were heavier (i.e., body mass) (MLE = −19.40, SE = 2.52, t = −7.69, 95%PLCI = [−24.51, −14.30]) and taller (i.e., stature) (MLE = −4.44, SE = 2.06, t = −2.15, 95%PLCI = [−8.62, −0.26]). Therefore, to control for these differences, physical characteristics were analysed separately for backs and forwards.
The process of potential outlier detection for heart rate data led to identifying 24 observations in the data frame for backs and 13 observations in the data frame for forwards as outliers. As these observations were produced by measurement errors, they were removed from the data frames.
Model selection led to the final models reported in Tables 5 and 6. Both backs and forwards showed a higher total distance, average acceleration-deceleration, Stagno's TRIMP and the number of get-ups per minute during SSG-B and SSG-F, respectively, in comparison with SSG-BF (Table 5). High speed (>61%) running distance per minute was higher in the SSG-BF for both backs and forwards (Table 5). However, the number of get-ups and HSR per minute was zero-inflated continuous dependent variables for both backs and forwards (Table 5). Specifically, for backs, SSG-BF showed 65% of get-ups and 54% of HSR observations being zero, whereas SSG-B led to 52% of get-ups and 64% of HSR observations being zero. For forwards, SSG-BF showed 63% of get-ups and 60% of HSR observations being zero, whereas SSG-F led to 53% of get-ups and 75% of HSR observations being zero. Across the days of data collection, backs reported SSG-BF mean[SD]: get-up = 0.21[0.35] count·min−1, HSR = 1.36[2.23] m·min−1; SSG-B: get-up = 0.58[0.75] count·min−1, HSR = 0.80[1.68] m·min−1; and for forwards: SSG-BF mean[SD]: get-up = 0.21[0.35] count·min−1, HSR = 0.81[1.66] m·min−1; SSG-F: get-up = 0.53[0.68] count·min−1, HSR = 0.36[0.89] m·min−1.
Models output for the physical characteristics of the SSG showing the effect of SSG design and day of data collection for backs and forwards.
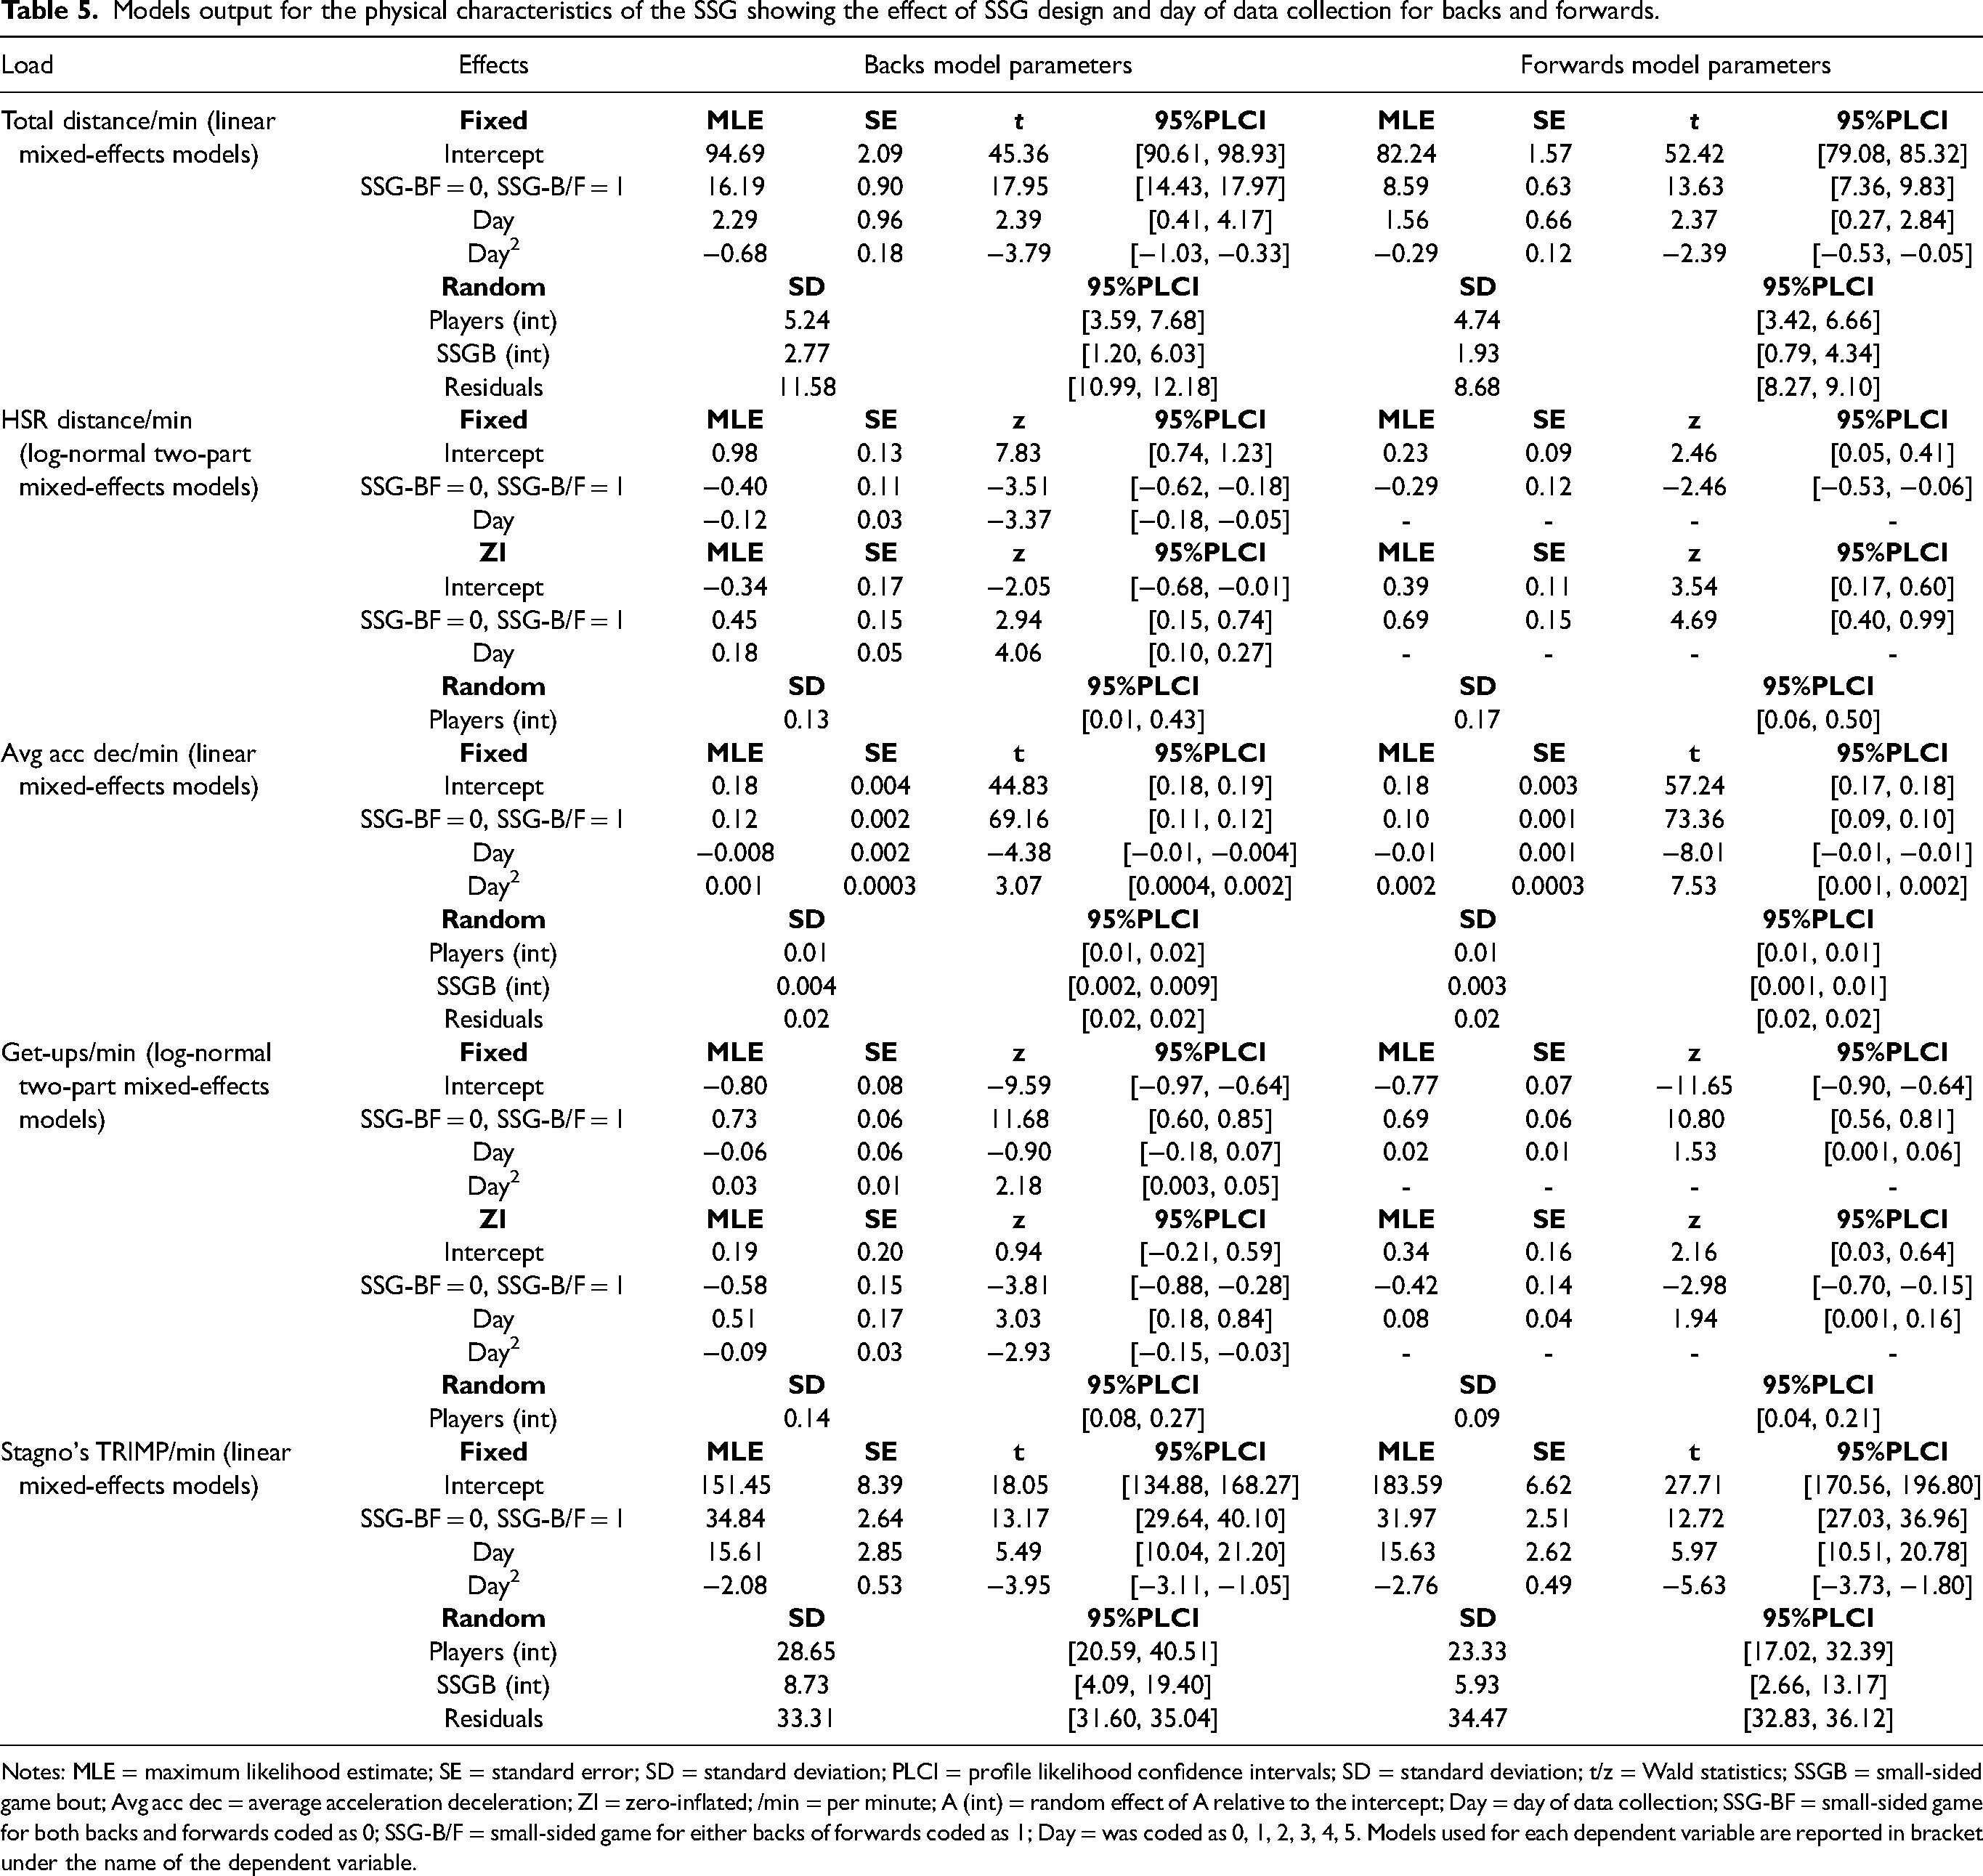
Notes: MLE = maximum likelihood estimate; SE = standard error; SD = standard deviation; PLCI = profile likelihood confidence intervals; SD = standard deviation; t/z = Wald statistics; SSGB = small-sided game bout; Avg acc dec = average acceleration deceleration; ZI = zero-inflated; /min = per minute; A (int) = random effect of A relative to the intercept; Day = day of data collection; SSG-BF = small-sided game for both backs and forwards coded as 0; SSG-B/F = small-sided game for either backs of forwards coded as 1; Day = was coded as 0, 1, 2, 3, 4, 5. Models used for each dependent variable are reported in bracket under the name of the dependent variable.
Model outputs for the technical characteristics of the SSG designs.
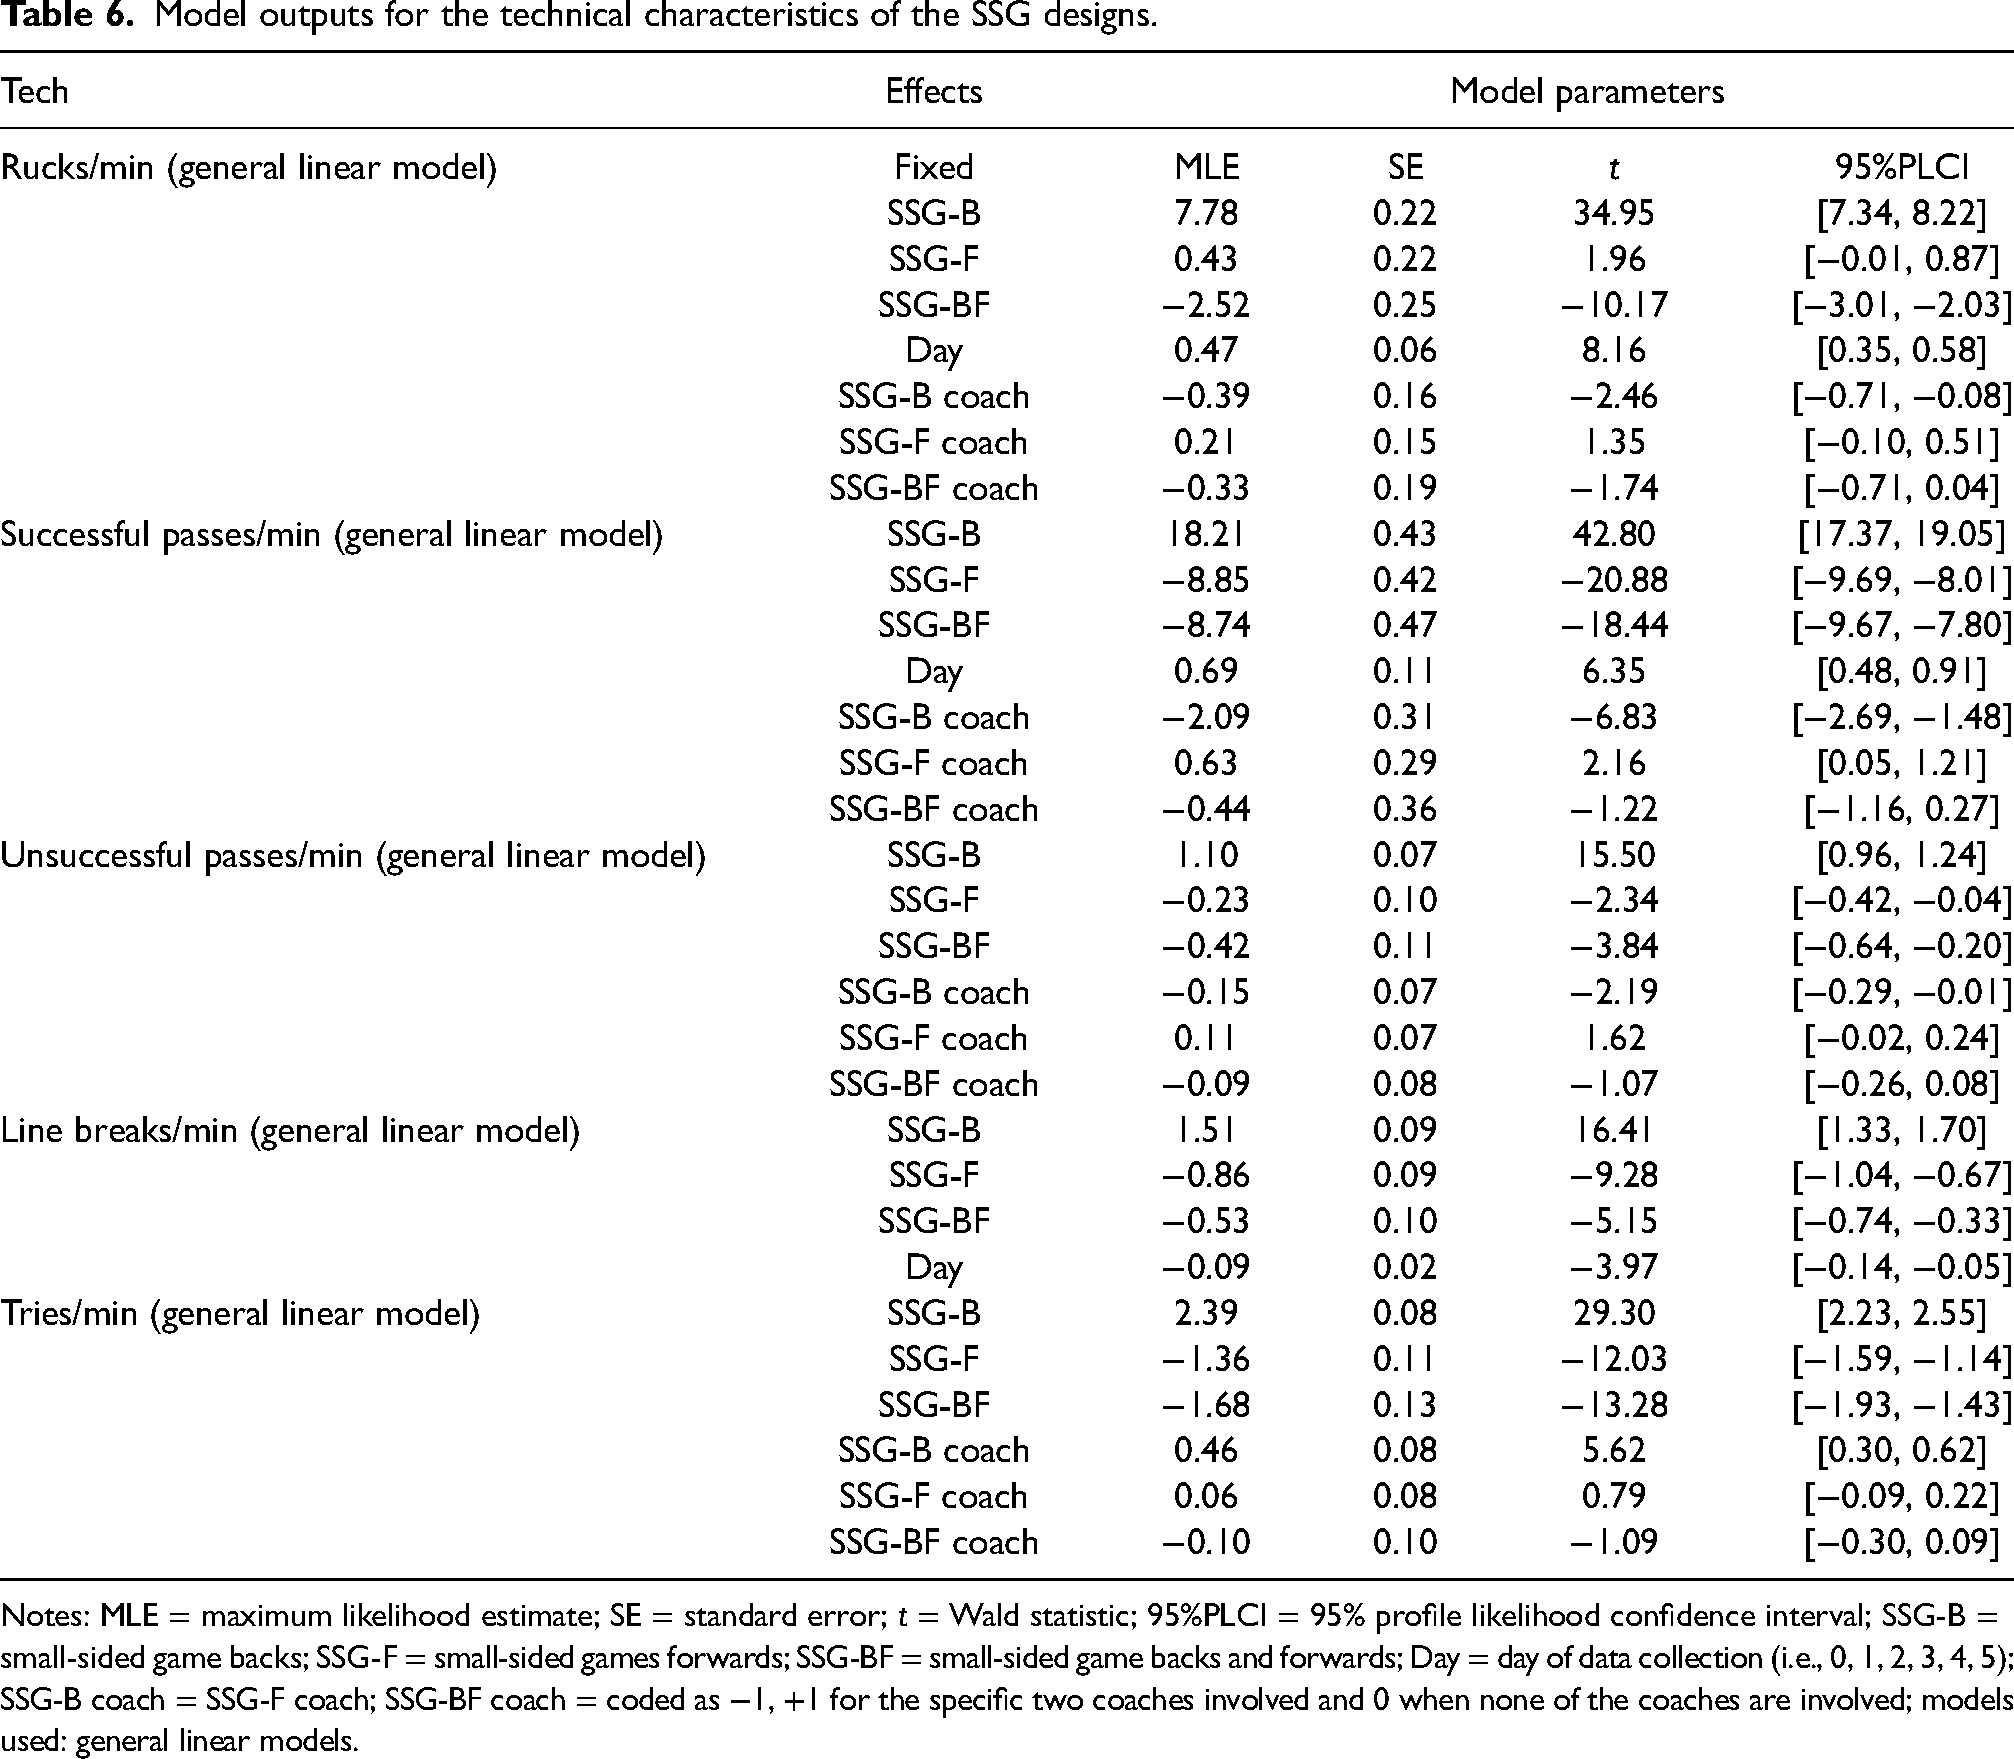
Notes: MLE = maximum likelihood estimate; SE = standard error; t = Wald statistic; 95%PLCI = 95% profile likelihood confidence interval; SSG-B = small-sided game backs; SSG-F = small-sided games forwards; SSG-BF = small-sided game backs and forwards; Day = day of data collection (i.e., 0, 1, 2, 3, 4, 5); SSG-B coach = SSG-F coach; SSG-BF coach = coded as −1, +1 for the specific two coaches involved and 0 when none of the coaches are involved; models used: general linear models.
The day of data collection showed a quadratic pattern of change for all variables investigated except for HSR per minute in backs which showed a linear decrease, HSR per minute in forwards that showed no effect, and get-ups per minute in forwards which showed a linear increase over days (Table 5).
In terms of technical characteristics, the SSG-B and SSG-F showed a higher number of rucks, unsuccessful passes and tries per minute in comparison with SSG-BF (Table 6). However, SSG-BF reported a higher number of successful passes and line breaks per minute than SSG-F (Table 6). The day of data collection led to a linear increase in rucks and successful passes per minute and a linear decrease in line breaks per minute, and it had no effect on unsuccessful passes and tries per minute (Table 6).
The fixed effects of general linear mixed-effects models are interpreted as the traditional general linear model, whereas a one-unit increase in the fixed effect leads to an increase in the dependent variable equal to the MLE for that fixed effect whilst the others stay constant, with the intercept representing the mean for the dependent variable. For instance, the average total distance per minute in backs was 94.69 m·min−1 for SSG-BF and 110.88 m·min−1 for SSG-B. Two-part mixed-effects models have two subcomponents, zero-inflation effects represent the probability of the dependent variable being greater than zero (i.e., logistic model), whereas the fixed effects can be interpreted the same way as for general linear mixed-effects models when the dependent variable is different from zero.
Discussion
This study aimed to investigate the physical and technical characteristics of three position-specific rugby union SSGs, and their variability over three weeks of the preseason in a professional rugby union club. The findings showed that the specific SSG-BF elicited a higher HSR distance covered per minute in comparison with SSG-B and SSG-F (Table 5). Conversely, total distance covered, average acceleration-deceleration, number of get-ups, and Stagno's TRIMP per minute were all higher in the SSG-B and SSG-F (Table 5). In terms of technical characteristics, SSG-B and SSG-F showed a higher number of rucks, unsuccessful passes and tries per minute in comparison to SSG-BF, whilst SSG-BF led to more successful passes and line breaks per minute than SSG-F (Table 6). Across the days of data collection, all the physical characteristics demonstrated either a linear or a quadratic (curved) pattern of change, except for HSR distance per minute in forwards, which did not show variability. Similarly, rucks, successful passes and line breaks per minute demonstrated a linear change over days of data collection, whereas unsuccessful passes and tries per minute remained constant. Therefore, based on the specific SSGs investigated, designing an SSG to target a specific positional group (e.g., SSG-F and SSG-B), thus including either only backs or only forwards, may increase the physical and technical characteristics of the games, and most of these would exhibit some variability over multiple training days.
Small-sided game design
A comparison of the different SSG designs showed that on average over time, within backs, the total distance covered per minute was 16.19 m·min−1 higher in SSG-B in comparison with SSG-BF (Table 5). Similarly, in forwards, the total distance covered per minute was 8.59 m·min−1 higher in the SSG-F than in SSG-BF (Table 5). In addition, on average, backs showed a greater total distance per minute than forwards (94.69 m·min−1 vs. 82.24 m·min−1) (Table 5). The design of the present study, with SSG-BF being played after SSG-B and SSG-F, may have contributed to the difference observed, due to an insufficient time to allow a complete recovery between SSG designs. Nonetheless, SSG-BF exhibited a higher HSR distance per minute; hence, other factors, in addition to residual fatigue, may have contributed to the identified differences.
The consideration of relative playing areas (i.e., pitch area divided by the total number of players on the pitch) in rugby union SSG, where the ball can be passed only backwards, may not be appropriate, and the width of the pitch may play a more important role than length, on total distance covered. 49 This is in line with a study in rugby union SSG which, using the ‘on-side’ rule, found that increasing width per player (e.g., 3 m·player−1 vs. 6 m·player−1) led to a higher total distance covered per minute. 15 Similarly, in the current study, SSG-B and SSG-F were characterised by a similar width per player compared to SSG-BF for the attacking players (i.e., 2.5 m·player−1 in SSG-B and SSG-F and 2.7 m·player−1 in SSG-BF); however, they presented a greater width per player for the defending players (i.e., 5 m·player−1 in SSG-B and SSG-F and 3.75 m·player−1 in SSG-BF). Consequently, defending players may have needed to cover greater distances in SSG-B and SSG-F. Additionally, a higher number of rucks per minute was identified in SSG-B and SSG-F in comparison to SSG-BF (i.e., 8.21, 7.78 and 5.26 count·min−1, respectively) (Table 6). The task constraint of two players joining the ruck in SSG-BF, and the greater number of players that had to organise themselves after each ruck (Table 2) may have contributed to slowing down the speed of the game, thus leading to a lower total distance per minute in SSG-BF. Furthermore, SSG-B and SSG-F presented a higher attackers-to-defenders ratio in comparison with SSG-BF (i.e., 2 vs. 1.37), thus defenders had to cover a greater area to prevent attackers from breaking the defensive line, and attackers had greater running opportunities.
In terms of HSR distance per minute, both backs and forwards demonstrated a greater number of zeros in SSG-B (i.e., 64% vs. 54%) and SSG-F (i.e., 75% vs. 60%), respectively, in comparison with SSG-BF (Table 5). Excluding the zeros, SSG-BF led to a greater HSR distance covered per minute in comparison with SSG-B (i.e., 1.97 m·min−1 = exp[0.98-(0.12 × 2.5)] vs. 1.32 m·min−1 = exp[0.98-0.40-(0.12 × 2.5)]) and SSG-F (i.e., 1.26 m·min−1 = exp[0.23] vs. 0.94 m·min−1 = exp[0.23–0.29]) (Table 5). In this scenario, the greater length of the pitch of SSG-BF (i.e., 35 m vs. 17.5 m) may have allowed players to accelerate for longer, thus reaching higher speeds following a break in the defensive line, in comparison with SSG-B and SSG-F. This may be supported by the finding that SSG-BF did not lead to the highest number of line breaks per minute (i.e., SSG-B: 1.51 count·min−1, SSG-BF: 0.98 count·min−1 and SSG-F: 0.65 count·min−1). Consequently, the greater HSR distance observed in SSG-BF may be the result of pitch length rather than a higher number of line breaks. However, due to the high number of zeros (i.e., range = 54–75% of total observations) and the limited distances observed excluding the zeros (i.e., range = 0.94–1.97 m·min−1), the accumulated HSR distance and differences between designs may not be of practical significance for practitioners.
Average acceleration-deceleration and number of get-ups per minute showed similar patterns to the total distance covered (Table 5). In the backs, the average acceleration-deceleration per minute was 0.12 m·s−2·min−1 higher in SSG-B in comparison with SSG-BF (Table 5). In the forwards, the average acceleration-deceleration per minute was 0.10 m·s−2·min−1 higher in SSG-F than in SSG-BF (Table 5). This may be related to the greater total distance covered observed in SSG-B and SSG-F. Previous studies in soccer SSG showed that increasing pitch dimensions resulted in higher acceleration-deceleration characteristics (e.g., number of accelerations, decelerations [>3 m·s−2]) alongside total distance covered per minute.50–52 Consequently, the greater width per player and attackers-to-defenders ratio observed in SSG-B and SSG-F may have contributed to not only an increase in the total distance covered per minute but also the average acceleration-deceleration. When considering width per player and the attackers-to-defenders ratio instead of the relative playing area, the findings of the current study are in line with previous research in soccer SSG.50–52
Similarly, both SSG-B and SSG-F showed a lower number of zeros recorded and a higher number of get-ups per minute (i.e., SSG-B vs. SSG-BF: 0.97 = exp[−0.80 + 0.73-(0.06 × 2.5) + 0.03 × 2.52] vs. 0.46 = exp[−0.80-(0.06 × 2.5) + 0.03 × 2.52] get-ups·min−1; SSG-F vs. SSG-BF: 0.97 = exp[−0.77 + 0.69 + 0.02 × 2.5] vs. 0.49 = exp[−0.77 + 0.02 × 2.5] get-ups·min−1) in comparison with SSG-BF (Table 5). In the specific SSG investigated, players were generally getting down to, and up from, the ground as a result of a ruck. Therefore, the higher number of rucks observed in SSG-B and SSG-F in comparison to SSG-BF may support the higher frequency of get-ups in these specific SSG designs (Table 6). Previous studies in soccer and field hockey showed that a reduction in the number of players would increase the technical characteristics of the SSG due to greater involvement of players.53,54 This is in line with the present study where SSG-B reported the highest number of successful passes, unsuccessful passes, line breaks and tries per minute, whereas SSG-F showed the highest number of rucks per minute (Table 6). The SSG-BF led only to a marginally higher number of successful passes (9.47 vs. 9.36 count·min−1) and more line breaks per minute (0.98 vs. 0.65 count·min−1) in comparison to SSG-F, which may be related to the inclusion of backs in the SSG-BF and the specific attacking shape to be reproduced during SSG-F (Table 2).
Considering internal load, both SSG-B and SSG-F showed a higher Stagno's TRIMP per minute in comparison with SSG-BF ( + 34.84 and + 31.97 AU·min−1, respectively) (Table 5). This finding is in agreement with previous research in rugby union and rugby league SSG, where an increase in width per player (e.g., 3.33 m vs. 5 m) led to a higher internal load (e.g., blood lactate concentration and percentage of maximal heart rate) (p < 0.05).15,22 The higher internal load observed in SSG-B and SSG-F may reflect the greater external load experienced during these SSGs. 15
Variability over days of data collection
This represents the first study to investigate how the physical and technical characteristics of positional-specific SSGs change across three weeks of the preseason in a professional rugby union club. In both backs and forwards, the total distance covered per minute showed a quadratic (curved) pattern of change (i.e., increasing first, reaching a maximum and then decreasing), with the positive linear effect of the day (i.e., backs = 2.29, forwards = 1.56) becoming progressively less positive (i.e., backs = −0.68, forwards = −0.29) (Table 5). The increasing phase may be the result of players progressively adapting to the constraints and optimising their movement solutions. 55 The decreasing phase may not only show how learning fluctuates over time but also, as players were involved in a six-week training block, fatigue may have started to accumulate, thus reducing the total distance covered per minute.3,56 Research in soccer SSG found that the total distance covered per minute decreased from the first two weeks (SSG performed on three days) to the second two weeks (SSG performed on four days) of a training block (p < 0.001). 1 However, the aggregation of days of data collection over two groups would prevent the identification of other patterns of change over time (e.g., quadratic) rather than linear, making it difficult to fully compare the findings.
Day of data collection was not associated with HSR distance per minute in forwards, and hence not included in the final model used for inference. In addition, in the backs, the probability of zero HSR distance per minute increased over time by 4%, and excluding zeros, the HSR distance covered per minute decreased linearly by 0.18 m·m−1 over days (Table 5). Similar to the total distance covered, this may be not only due to players adapting to the constraints, thus finding alternative movement patterns, but also to an increased fatigue towards the end of the six-week training block. In addition, the high number of zeros observed for HSR and the limited change over days for backs may suggest that these effects have little practical significance for practitioners, who may therefore consider HSR to be limited and consistent across multiple training days.
Average acceleration-deceleration per minute showed a quadratic pattern of change over days (i.e., decreasing first, reaching a minimum, then increasing) for both backs and forwards (Table 5). Specifically, the linear negative effect of day (backs = −0.008, forwards = −0.01) became progressively less negative (backs = 0.001, forwards = 0.002) (Table 5). A similar pattern was observed for the number of get-ups per minute in backs, where the probability of zero get-ups increased first, reached a maximum and then decreased, whilst excluding zeros, the number of get-ups decreased first, reached a minimum and then increased (Table 5). Conversely, the day of data collection showed a positive linear effect on the probability of zero get-ups in forwards (0.08) and excluding zeros, the number of get-ups minimally increased over time (0.02) (Table 5). These increases in average acceleration-deceleration and number of get-ups per minute over time may be responsible for the progressive decrease in total distance and HSR distance covered per minute as more time would be spent accelerating, decelerating and getting down to and up from the ground. These findings may suggest that players alternated between more running and more accelerations, decelerations and get-ups across the days of data collection. These fluctuations of movement patterns may show how learning fluctuates over time due to players’ interaction with the constraints. 56
In terms of internal load, Stagno's TRIMP per minute exhibited a similar pattern of change over time to the total distance covered per minute (i.e., increasing first, reaching a maximum, then decreasing) in both backs and forwards (Table 5). This may support the contribution of external load to internal load in the specific rugby union SSGs designed in this study. Therefore, changes in external load led to changes in internal load. Furthermore, as external load characteristics fluctuated over days of data collection, showing a quadratic pattern of change, it may be expected to observe comparable fluctuations in internal load. Previous research in soccer SSG found that the percentage of maximal heart rate and Stagno's TRIMP did not change from the first two to the second two weeks of preseason. 1 However, the use of pre-post analysis prevents the identification of quadratic patterns of change, and hence results cannot be used for comparisons. In the current study, the decrease in some external load variables after reaching their maximum may suggest that players may have adapted to certain constraints and optimised their movement solutions, thus increasing efficiency and reducing internal load. 55
Technical characteristics demonstrated mainly a linear pattern of change over days of data collection (Table 6). Rucks and successful passes per minute showed a progressive increase (i.e., +0.47, +0.69, respectively) over training days (Table 6). Conversely, line breaks per minute showed a linear decrease of −0.09 over the days of data collection (Table 6). Therefore, the SSGs investigated led to progressively greater exposure to rucks and successful passes over the three weeks of data collection. A recent systematic review of soccer SSG identified considerable variability in technical characteristics among SSG bouts and between two days of data collection. 53 However, no research was available to identify this variability over multiple days. 53 This is partially in line with the current study. The increase in the number of rucks and successful passes over days may be related to the decrease in line breaks, thus leading to a higher number of phases in attack before a try, a turnover or a line break. Nonetheless, the linear decrease in line breaks is relatively small in comparison to rucks and successful passes (i.e., −0.09 vs. 0.47 and 0.69, respectively), and hence it may not be of practical significance for practitioners, who may consider the number of line breaks to remain mostly consistent across training days. Similarly, unsuccessful passes and tries per minute were not affected by the day of data collection as shown by the lack of the fixed effect of day in the final models (Table 6). In addition, no variability among SSG bouts was identified as shown by the lack of this component as a random effect in the models used for inference (Table 6).
Conclusions and practical applications
The current study showed that SSG-BF was characterised by a greater HSR distance covered per minute in comparison with SSG-B and SSG-F, and higher successful passes and line breaks per minute in comparison to SSG-F. Conversely, SSG-B and SSG-F showed a greater total distance covered, average acceleration-deceleration, number of get-ups, Stagno's TRIMP, rucks, unsuccessful passes and tries per minute. In addition, all the physical and technical characteristics – except HSR distance per minute in forwards and unsuccessful passes and tries per minute – showed either a linear or quadratic pattern of change over days of data collection. Therefore, based on the specific rugby union SSGs investigated in this study, practitioners may implement position-specific SSG (i.e., SSG-B and SSG-F) to expose players to greater physical and technical characteristics for the majority of the variables investigated. Furthermore, if SSGs were to be repeated across multiple days, practitioners should be aware of the possible variability in physical and technical characteristics over time, due to possible adaptations to the specific constraints applied or to the onset of fatigue. Further research should investigate these effects over multiple training blocks and during the in-season period.
Footnotes
Authors’ contribution
All authors contributed equally to this paper.
Data availability
Declaration of conflicting interests
The author(s) declared no potential conflicts of interest with respect to the research, authorship, and/or publication of this article.
Funding
The author(s) received no financial support for the research, authorship, and/or publication of this article.