
Abstract
Among all the popular sports, soccer is a relatively long-lasting game with a small number of goals per game. This renders the decision-making cumbersome, since it is not straightforward to evaluate the impact of in-game actions apart from goal scoring. Although several action valuation metrics and counterfactual reasoning have been proposed by researchers in recent years, assisting coaches in discovering the optimal actions in different situations of a soccer game has received little attention of soccer analytics. This work proposes the application of deep reinforcement learning on the event and tracking data of soccer matches to discover the most impactful actions at the interrupting point of a possession. Our optimization framework assists players and coaches in inspecting the optimal action, and on a higher level, we provide for the adjustment required for the teams in terms of their action frequencies in different pitch zones. The optimization results have different suggestions for offensive and defensive teams. For the offensive team, the optimal policy suggests more shots in half-spaces (i.e. long-distance shots). For the defending team, the optimal policy suggests that when locating in wings, defensive players should increase the frequency of fouls and ball outs rather than clearances, and when located in the centre, players should increase the frequency of clearances rather than fouls and ball outs.
Introduction
Recent breakthroughs in the applications of machine learning in soccer data have been contributed to soccer analytics to bridge the gap between coaching and science. The recently proposed action valuation methods, for example, Decroos et al., 1 Liu and Schulte, 2 Liu et al., 3 Fernandez et al., 4 Alguacil et al., 5 Fernandez and Born, 6 and Gyarmati and Stanojevic 7 help coaches and soccer practitioners to analyze the current performance of their team and players. However, the action valuation method leaves the coaches with the value of the performed actions, without any proper proposal of alternative actions, let alone the optimal one. To fill this gap, a few counterfactual reasoning methods, for example, Van Roy et al., 8 and Sandholtz and Bornn9,10 have been proposed that inspect the outcome of alternative decisions without the requirement of actual deployment in a match. Particularly, they provide answers to the questions such as What would have happened if the team had modified the frequency of a particular action by x%? However, their inspections are limited to a few alternative choices and do not explore the larger space of possibilities to get the optimal one.
In the meantime, the application of deep neural networks enables soccer data scientist to remedy the problem of high dimensional tracking data and offers the possibility to incorporate those in their analytics. In this work, we propose the application of deep reinforcement learning (RL) to leverage the high-dimensional tracking data, and to achieve the optimal offensive and defensive actions at the interrupting point of a particular possession. In our dataset, it is assumed that a possession starts from the beginning of a deliberate on-ball action by a team, until it either ends due to some events such as ball out, foul, or shot from offensive players (regardless of who possesses the ball afterward, i.e., the next possession can belong to the same team or to the opponent), or interrupts by a defensive action of the opponent, such as pass interception, tackle, foul, out, or clearance.
We first analyze the actual offensive and defensive behavior of the teams in terms of the probability of performing any of the above-mentioned actions in those situations. We then use RL to tweak the actual probabilities and infer the optimal ones. Thus, given any possession of the offensive team, the action with the highest probability is the optimal action. Nevertheless, we face some challenges when designing the RL environment. First, soccer is a highly interactive and sparse rewarding game with a relatively large number of agents (i.e. players). Thus, state representation is challenging. Second, the spatiotemporal and sequential nature of soccer events and the dynamics of players’ location on the field dramatically increase the state dimensions, which leads to the curse of dimensionality in machine learning tasks. Third, the game context in a soccer match severely affects the model prediction performance. Fourth, evaluating a trained optimal policy would require its deployment in a real soccer match. This work offers solutions to all these challenges. Sports professionals can use our policy optimization method after the match to check what actions the players performed, evaluate them, and find out the optimal alternative action in that situation. Therefore, we can evaluate the players and the teams in terms of their offensive and defensive strategies by inspecting how much their policies diverge from the optimal policy.
In summary, our work contains the following contributions:
We propose an end-to-end RL framework that analyzes the event and tracking data and trains an optimal policy to discover the optimal offensive and defensive actions; We introduce a Markovian ball possession model, and a novel state representation to analyze the impact of actions on subsequent possessions; We propose a new reward function for each of the offensive and defensive actions, based on the output of the neural network predictor model; We provide interpretable results for soccer coaches in terms of the adjustments required in the frequency of offensive and defensive actions on different pitch zones. We rank teams’ effectiveness in terms of their performance in selecting optimal offensive and defensive actions.
Related work
The state-of-the-art models in soccer analytics focus on several aspects such as evaluating actions, players, and strategies. A regression method on actions and shots was firstly proposed by McHale et al. 11 They estimate the number of shots as the function of crosses, dribbles, passes, clearances, etc. Coefficients show how important they are in generating shots. Another interesting player evaluation method is percentiles and player radars by StatsBomb. 12 This method estimates the relative rank for each player based on their actions. For example, a ranking can be assigned to a player for all their defensive actions (tackle/interception/block), their accurate passes, crosses, etc.
The application of a Markovian model in action valuation was first proposed by Rudd 13 and Keith. 14 The input of this model is the probability of ball location in the next five seconds. Assuming we have these probabilities, this model estimates the likely outcomes after many iterations based on the probabilities of transitioning from one state to another. Another application of the Markovian model is the Expected Threat (xT), 15 which uses simulations of soccer matches to assign values to actions. VAEP 1 is another action valuation model, which considers all types of actions; this model uses a classifier to estimate the probability that an action leads to a goal within the next 10 actions, and the game state is considered as three consecutive actions. This model ignores the concept of ball possession in valuation. In contrast, considering the possession, the Expected Possession Value (EPV) metrics in football by Fernandez and Born, 4 and in basketball by Cervone et al. 16 were proposed. These models assume a simple world in which the actions of the players inside possessions are limited to pass, shot, and dribble. Thus, these methods ignore any other actions such as foul, ball out, or errors, which frequently happen in critical situations.
Recently, researchers have utilized deep learning methods due to their promising performance in handling the spatiotemporal data. Fernandez and Born 6 present a convolutional neural network architecture that is capable of estimating full probability surfaces of potential passes in soccer. With regards to the application of RL in soccer analytics, a suitable soccer environment needs to be constructed, and players should be able to interact with this environment and get feedback (i.e. rewards) to gradually learn what is the best decision in each situation to achieve the best results (e.g. maximum number of goals) in the long run. Now such an environment can be a simulation of the games in which the players are allowed to interact with the environment until they learn the optimal actions. Such environments have been recently developed by a Google research team. 17 Furthermore, Mendes-Neves et al. 18 designed a data-driven simulation environment for assessing decision making in soccer. However, when it comes to analyzing a real soccer dataset and evaluating players based on their performance, we cannot use simulation and modify players’ actions realistically. In such models, action valuations and policies must be learned from a fixed set of interactions and rewards that is sampled before the learning process. In this area, Liu and Schulte 2 took advantage of RL, by assigning value to each of the actions in ice-hockey and soccer 3 using the Q-function. Moreover, Dick and Brefeld 19 used RL to rate player positioning in soccer. It was in the works by Rahimian et al.20,21 that used RL to directly derive optimal policy rather than action valuation in soccer. In contrast to the latter two papers that aim to maximize the expected goals of the attacking teams, the current work assists both offensive and defensive players in terms of selecting the most impactful actions at the interrupting point of a possession.
Method
In this section, we provide technical details of modelling soccer dataset to derive the actual behavior of the teams in both offensive and defensive situations, designing the Markovian possession environment, and elaborating on the RL algorithm for the optimization process.
Dataset
The data used to conduct our experiments are collected by a company called InStat. The dataset includes both events and tracking information of 104 European soccer matches played in 11 different national leagues of Portugal, Russia, Hungary, and Germany in the 2017-2018 season. Each record of the event dataset describes one action performed by any of the attacker or defender players with additional features, such as action name (pass, shot, dribble, ball out, foul, clearance, tackle, interception, assist, and events such as goal, offside, own goal, challenges, etc.), (x,y) coordinates of the start and end location of the action, action result (successful or not), body id (action is performed by head, body, or foot), time second, player name, team name, opponents, and match id. The tracking data is one frame per second representation of positions for all players including home and away. We then merged tracking with event data. Each record of our merged dataset includes all players’ coordinates with their corresponding features for each time-step of the event dataset. In total, the dataset includes 98,922 actions (including on-ball and defensive actions), 9462 possessions that are terminated by either one of the defensive actions of the opponent players or a shot, out, foul performed by the offensive players, and 329 goals.
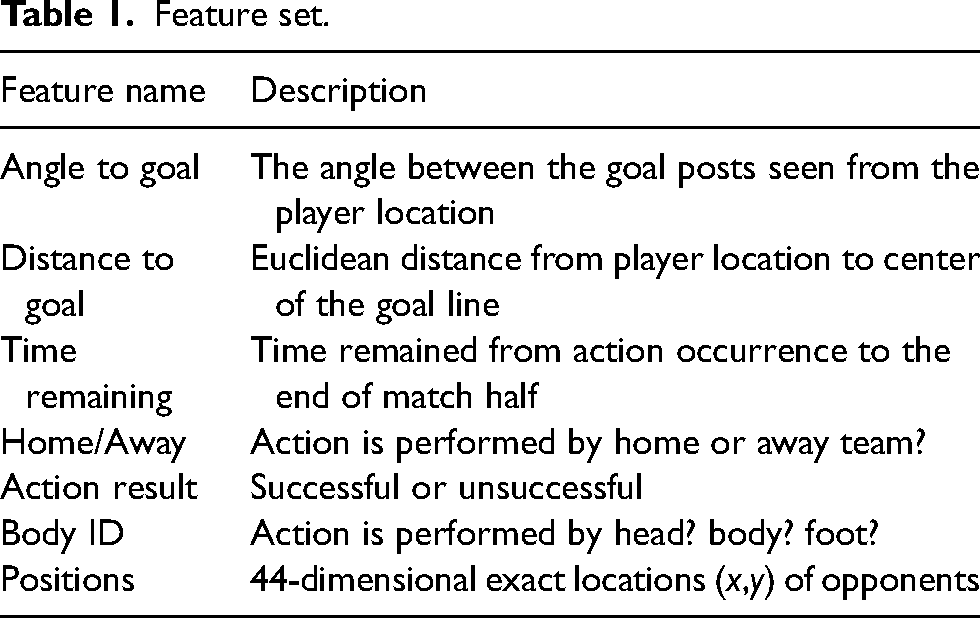
Feature generation
We represent the game state by generating some features on top of tracking data. Thus the game state consists of 44-dimensional (x,y) normalized positions of the 22 players on the pitch from tracking data. Moreover, we construct angles and distances to goal, time remaining, home/away, and body id directly from event stream data. Table 1 shows the list of our constructed features on top of event and tracking data used for our machine learning tasks in the following sections.
Feature set.
Game state representation
One of the most challenging steps in soccer analytics is to represent the game state due to the high-dimensional structure of soccer dataset. We first specify the definition of ball possession. Due to the fluid nature of a game, it is not straightforward to have a comprehensive description of a possession, which applies to all different types of soccer logs provided by different companies (e.g. InStat, Wyscout, StatsBomb, Opta, etc.). In the InStat dataset and accordingly in this work, possessions for any home or away teams are clearly defined and numbered. A possession starts from the beginning of a deliberate on-ball action by a team, until it either ends due to some event like ball out, foul, or shot from offensive players (regardless of who possesses the ball afterward, that is, the next possession can belong to the same team or opposing team), or terminates by a defensive action of the opponent, such as pass interception, tackle, foul, out, or clearance. The possession can be transferred if and only if the team is not in the possession of the ball over two consecutive events. Thus, the unsuccessful touches of the opponent in fewer than three consecutive actions are not considered as a possession loss. Consequently, all actions of players of the same team (e.g. passes, shots, dribbles, crosses, assists, bad ball controls, fouls, challenges, free kicks, etc.) should be counted to get the possession length.
Now we can describe each of the offensive and defensive game states by generating the most relevant features and labels to them. We first filter the dataset for all possessions that are interrupted by a shot, foul, or ball out from offensive players, or a defensive action of the opponent players. The defensive actions are as follows: foul, clearance, out, tackle, and interception. We then demonstrate the state as the combination of different feature vectors
Inferring offensive and defensive players’ actual behavior
We aim to discover the actual offensive and defensive behavior of the soccer teams in each situation. Particularly, we seek for the probability of each of the offensive and defensive action types that a player can perform at the end of the possession. To do so, we employ a neural network to estimate the probabilities and predict the actions according to the historical games in the dataset. In the soccer event dataset, each possession is represented by a sequence of actions. We aim to classify these possessions based on the offensive and defensive action that interrupted them. Thus, each possession is terminated by one of the following classes: shot, foul, ball out performed by an offensive player, or tackle, interception, clearance, foul, or ball out performed by a defensive player. We utilize the classification capability of sequence prediction methods by training a CNN-LSTM network,
22
using CNN for spatial feature extraction of input possessions, and LSTM layer with 100 memory units to support sequence prediction and to interpret features across time steps. Figure 1 depicts the architecture of our network. Note that the feature vector
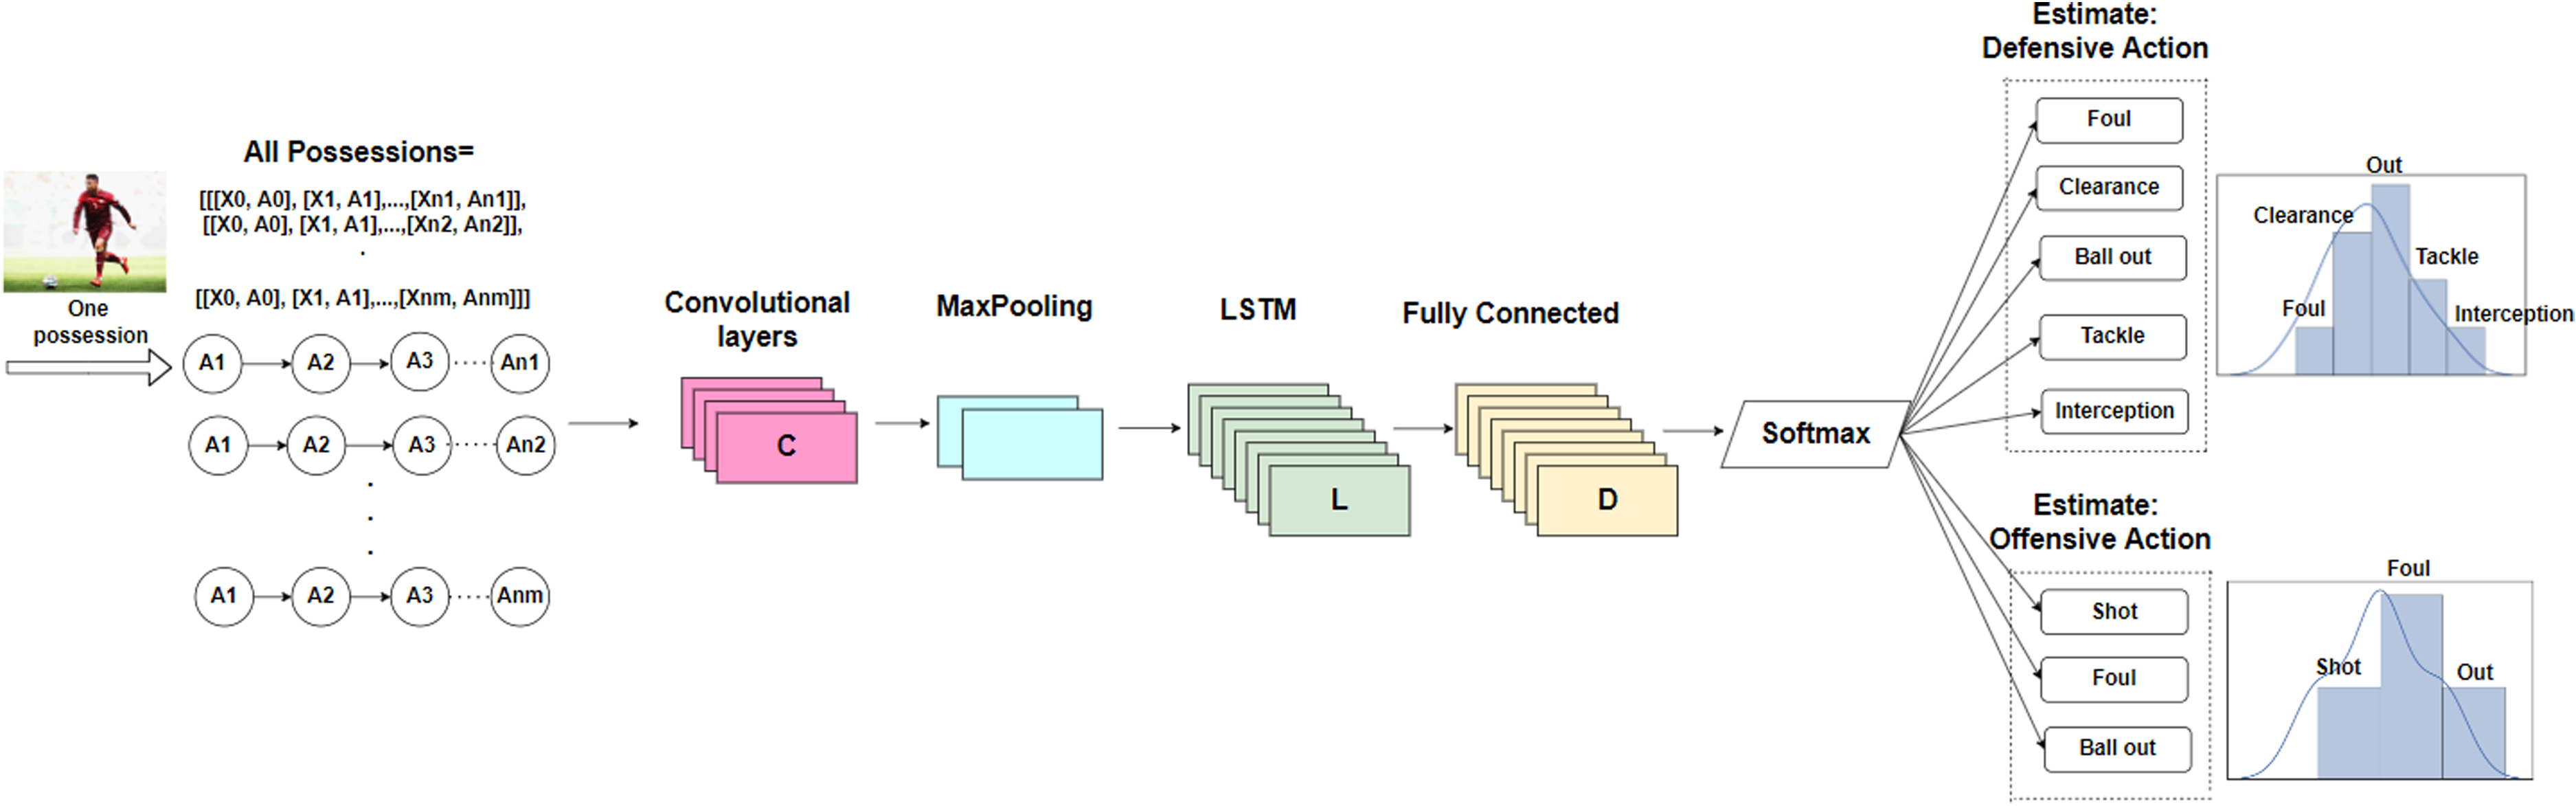
Convolutional neural network and long short-term memory (CNN-LSTM) network structure for prediction of the interrupting offensive and defensive actions, given a possession. Input possessions represent both state features vector
Consequently, the network estimates the categorical probability distribution over the interrupting offensive and defensive actions for any given possession.
Markov decision process
So far, we could model the actual behavior of the soccer teams in terms of the probability of interrupting the possession of the attacking team by performing any of the aforementioned offensive and defensive actions, given any game state described in the previous section. However, the estimated probabilities are not sufficient to assist players and coaches in optimal decision making. This is due to the fact that the neural network is trained with the data of historical games (i.e. the actual actions that the player performed to interrupt the opponent possession). However, it is possible that other actions would have been better for attacking or defending. Thus, RL can help to learn from the short-term rewards that the attackers and defenders earned in the historical games, to increase the probability of highly rewarding actions, and to decrease the low rewarding ones when the player gets in the same situation in the future.
In order to design and train a RL model, we first represent a soccer game as a Markov Decision Process (MDP). An MDP consists of the following components:
State: which describes the situation in the environment; Action: which specifies one of the set of possible actions; Policy: which determines the probability of selecting each action in the states; Reward: which determines the short-term feedback from environment after performing the action.
Next, we define each of these components in our soccer setup.
Our designed MDP consists of the following components:
State ( Action ( Episode ( Reward Objective Function: Sum of discounted rewards through all episodes of the games. Intuitively, the attacking team aims to maximize the expected goal and prevent possession loss. The defending team aims to minimize the expected goal of the attacking team and interrupt their possession, which favors the defending team.
Reward function
Owing to the complex and sparse reward environment of soccer games, it is not straightforward to assign rewards to the actions. Several works (e.g. Liu and Schulte
2
and Liu et al.
3
) propose 0-1 rewarding systems, which assign 1 to the goal actions, and 0 to the rest of the actions. However, this sparse rewarding system is not applicable in our case, since we want to derive the optimal offensive and defensive actions with different objective functions. Therefore, we propose hand-crafted reward functions which assign rewards to each of the offensive and defensive actions separately according to their impact on maximizing or minimizing scoring chances at the end of the episode. For both reward functions, we need to estimate the probability of scoring a goal for the ball possessor team within the next 10 actions of the interrupted point of possession, before (
Offensive team
For any of the offensive ending actions (i.e. shot, foul, or out), the ball possession could either be saved, or be transferred to the opponent team. Depending on the type of ending action and if it could save the possession or not, we assign reward to each of the action as follows: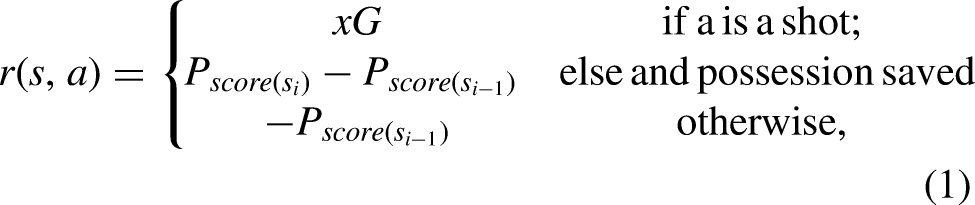
Defensive team
Analyzing defensive actions are more challenging than offensive actions since they usually prevent something from happening (e.g. the threat of goal scoring by the offensive team). The probability of scoring before the ending action (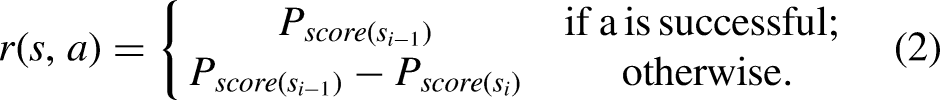
Training protocol and return
For each game state, the network needs to decide about performing the appropriate offensive and defensive action with the corresponding parameter gradient. The parameter gradient tells us how the network should modify the parameters if we want to encourage that decision in that possession in the future. We modulate the loss for each interrupting action taken at the end of a possession according to their eventual outcome since we aim to increase the log probability of successful actions (with higher rewards) and decrease it for the unsuccessful actions.
We define discounted reward (return) for episode 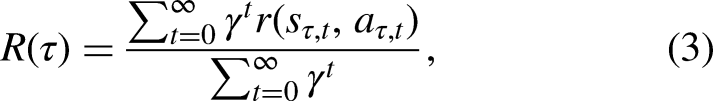
Policy gradient
So far, we are able to predict the most probable offensive and defensive actions that an average team will take to either save the possession for the offensive team in case of attack, or interrupt the offensive possession and prevent the threat in case of defense. We propose employing CNN-LSTM network that is able to predict the probabilities of performing each of the defensive actions. Moreover, by predicting the probability of goal scoring withing the next 10 actions before and after the occurrence of the ending action, we can estimate the rewards described in the previous section. Therefore, each of the ending actions is assigned positive or negative rewards depending on their impact. It might happen that a defensive action, such as committing a foul, has temporarily interrupted the possession and led to a free kick with a large expected goal, or a clearance that moved the ball to an area on the pitch that opened up space for the attacking team. In order to decrease the likelihood of such actions with high negative rewards in the same situation in the future, and to increase the likelihood of actions that can earn a large positive reward in the same situation, we propose training the network with Policy Gradient (PG) which is a type of score function gradient estimator. Using PG, we aim to train a defensive policy network that directly learns the optimal offensive and defensive policies by learning a function that outputs the best offensive and defensive actions to be taken at the end of the possession with a maximum impact on the future depending on the objective function of the team.
We seek to learn how the distribution of the offensive and defensive actions should be shifted (through its parameter
Using PG, the gradient vector computes a direction in the parameter space leading to an increase in the probability assigned to the action
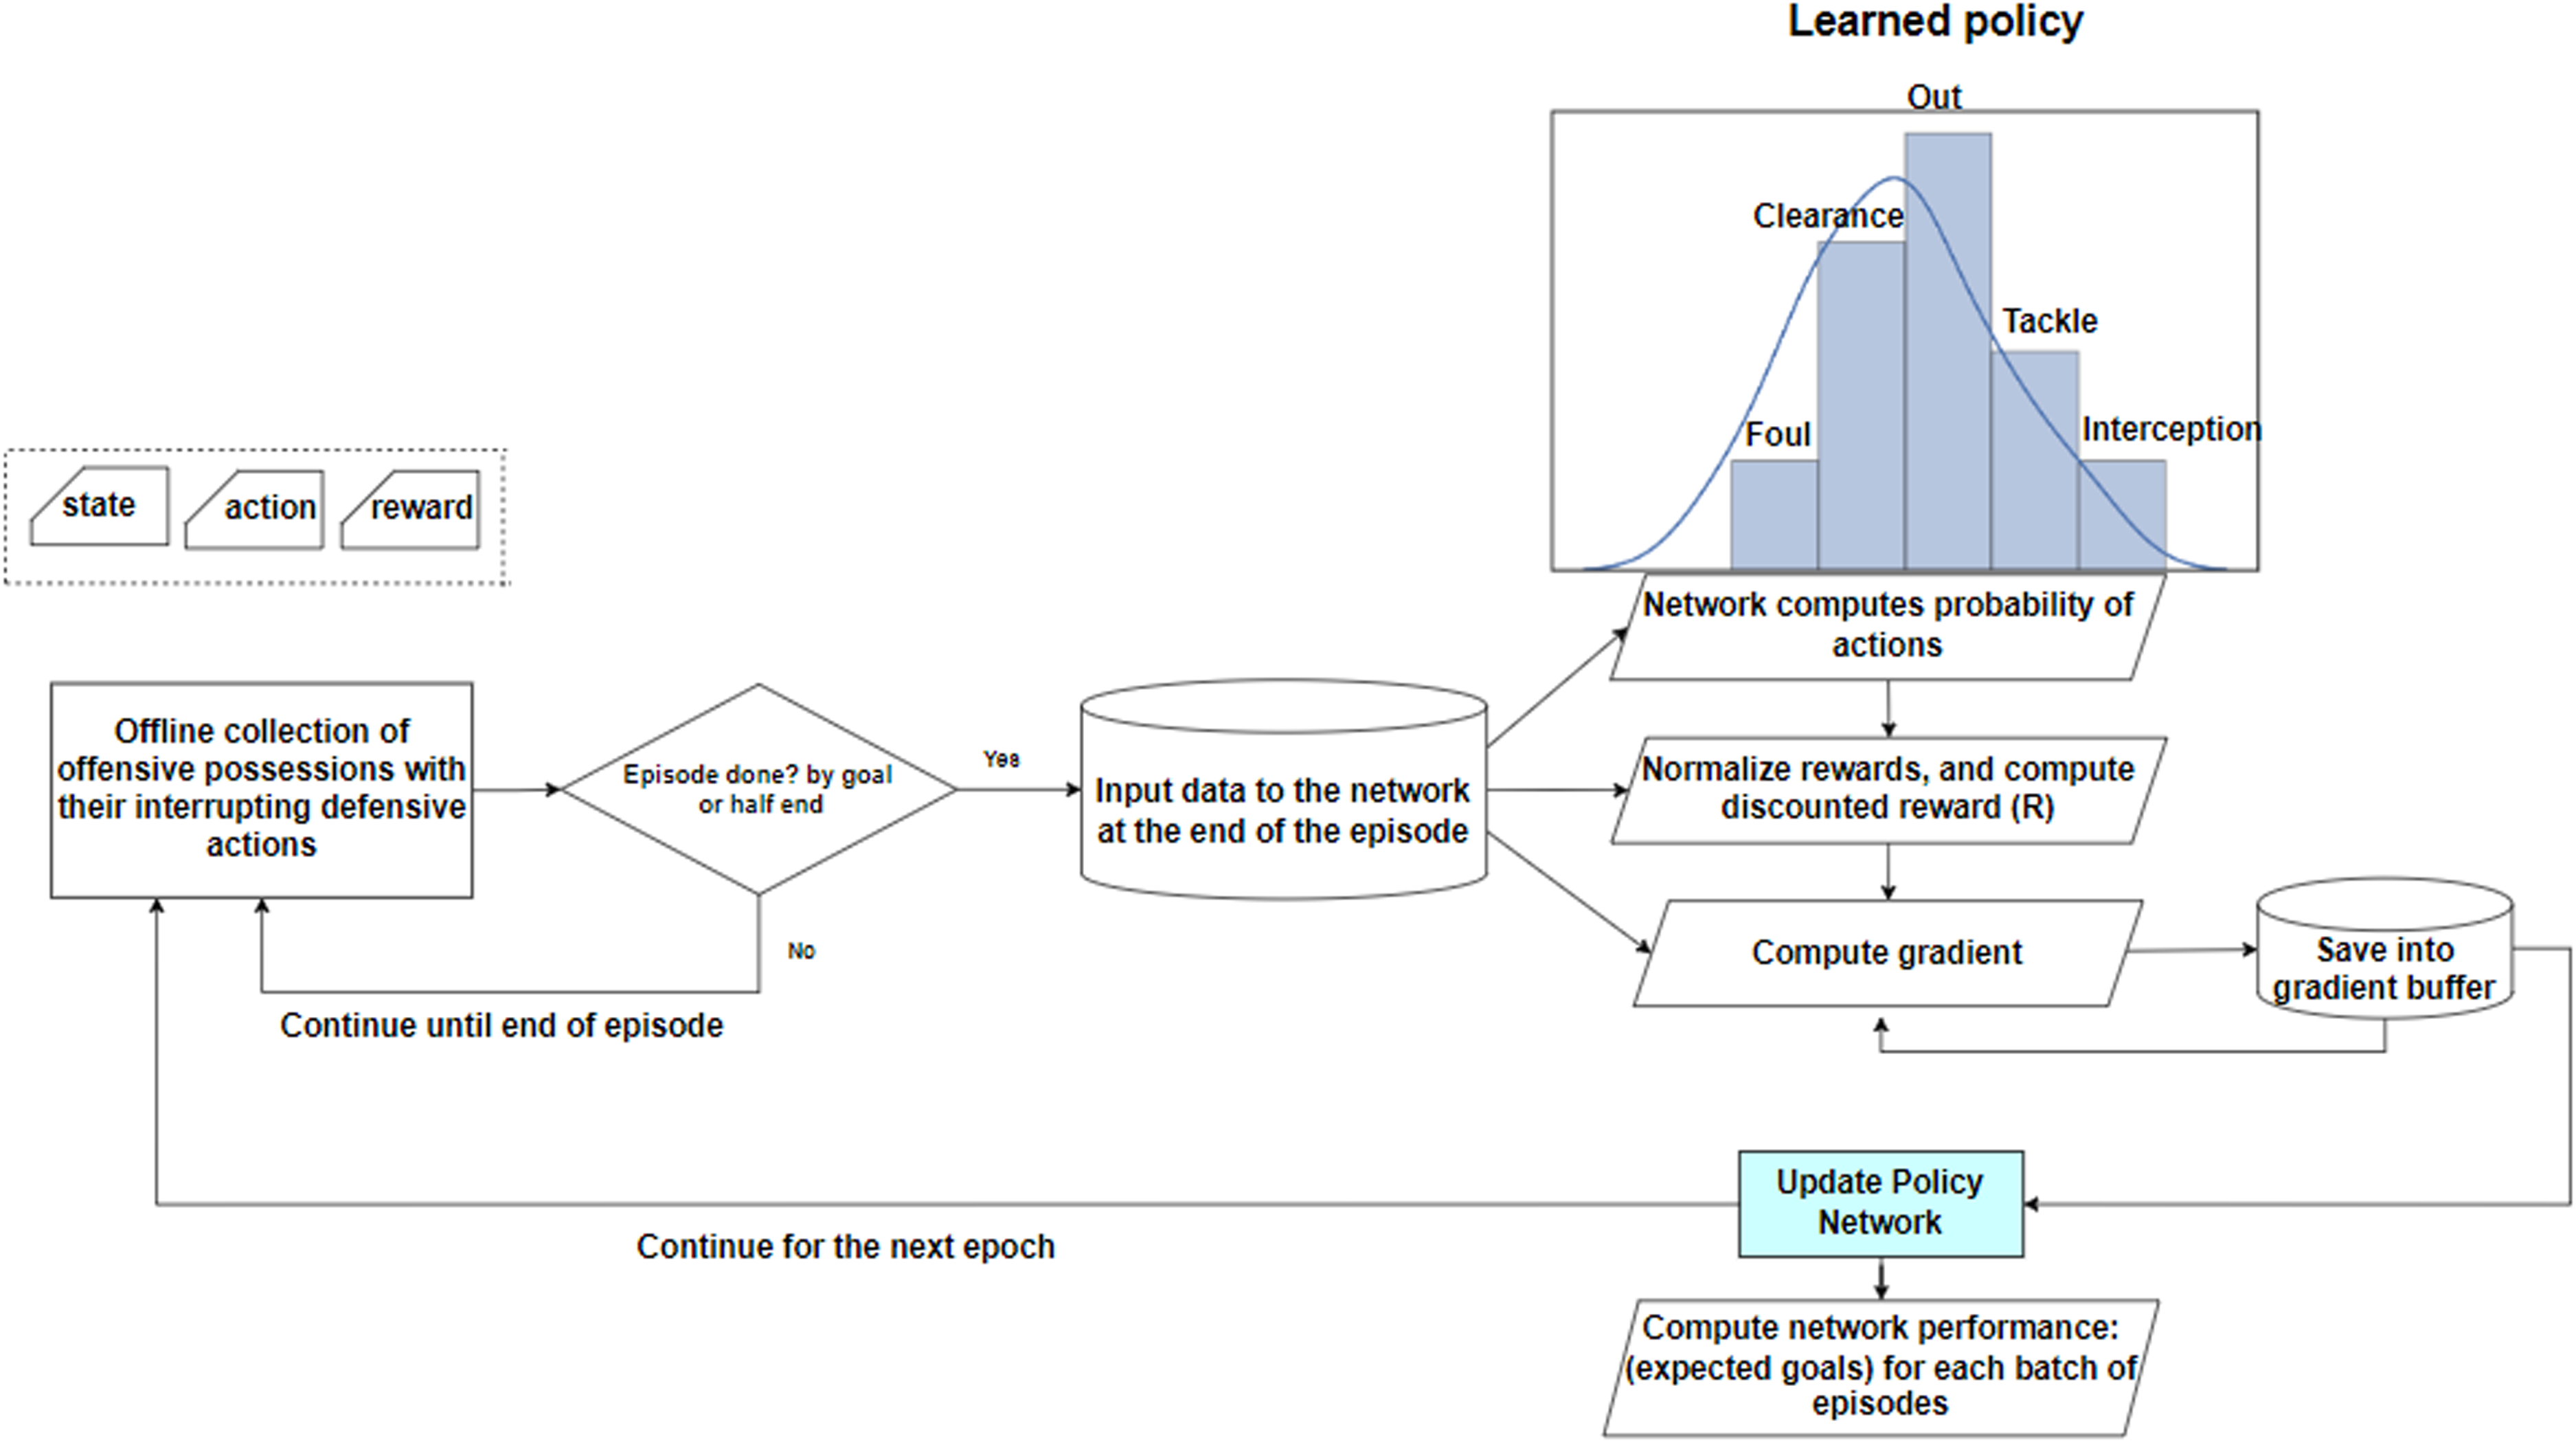
Policy gradient workflow.
Results
In this section, we provide the experimental results and evaluation of the proposed approach in different phases of analysis.
Offensive and defensive behavior prediction results
In this section, we inspect the performance of the teams’ offensive and defensive behavior prediction (i.e. the probability of interrupting a possession by each of the offensive and defensive actions. In order to handle the spatiotemporal nature of our dataset, we needed a sophisticated model and rich feature set, which could optimize the prediction performance. Thus, model selection was the core task of this study. We first created appropriate state dimensions suitable for each model by reshaping the state inputs, then fed our reshaped arrays to the following networks: 3D-CNN, LSTM, Autoencoder-LSTM, and CNN-LSTM, to compare their classification performance (cf. Table 2). We chronologically split the attacking possessions into 80% of train, 10% of validation for hyperparameter tuning and model selection, and the remaining 10% as hold-out data for testing. Categorical cross-entropy loss on train and validation datasets is used to evaluate the model. All layers of the networks are carefully calibrated. Dropout is used to reduce interdependent learning among units, and early stopping is used to avoid overfitting. As the table suggests, CNN-LSTM 22 outperforms other models in terms of accuracy and loss in the test set.
Classification performance of different design choices for spatiotemporal analysis. (Inference times are the average running times over 20 iterations of training using a server enriched with a Tesla K80 GPU). The dimension of the state is calculated as follows: [features (6) + locations (44) + actions (11)].
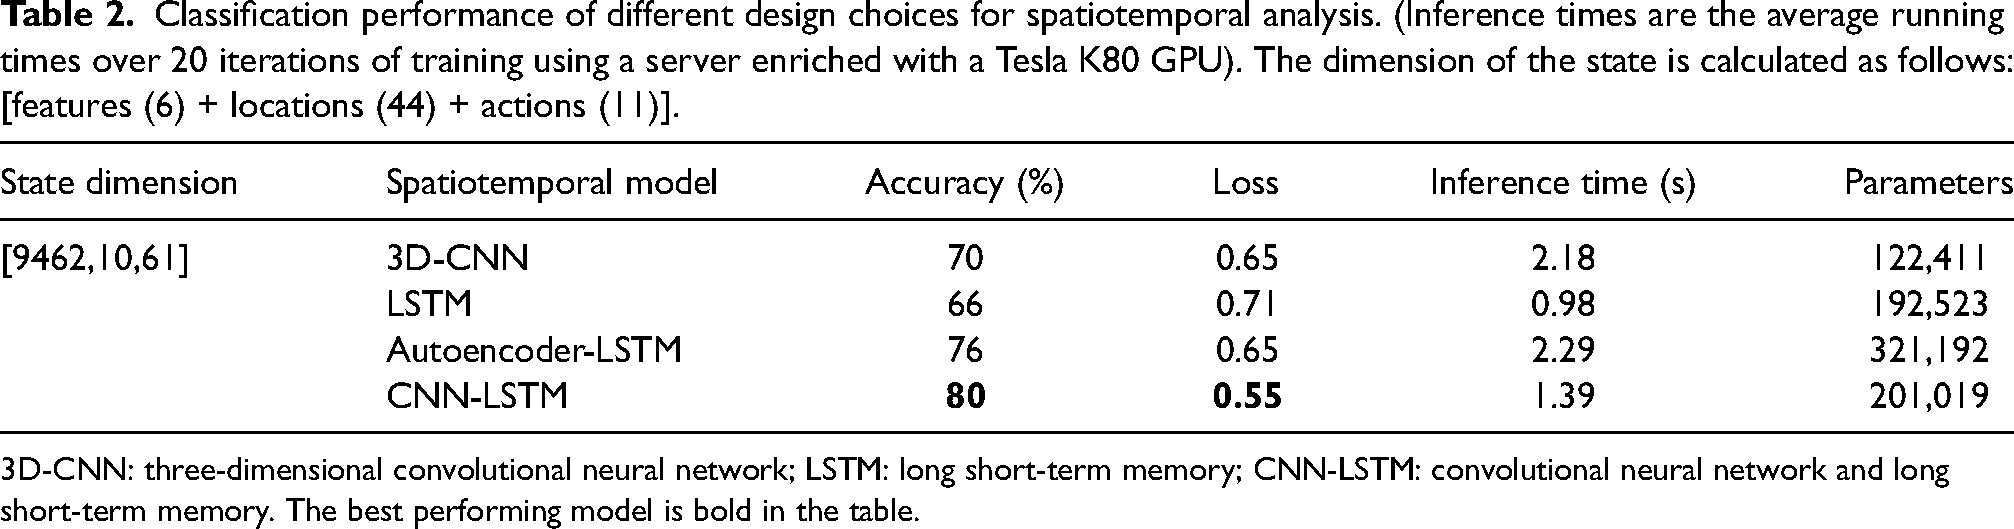
3D-CNN: three-dimensional convolutional neural network; LSTM: long short-term memory; CNN-LSTM: convolutional neural network and long short-term memory. The best performing model is bold in the table.
Expected goal results
In order to estimate the reward functions in (1) and (2), we need to calculate the probability of scoring a goal by the attacking team within the next 10 actions of the point of the interruption, before and after the interrupting action. To do so, we again collect all possessions described before, and label them as a goal or no-goal depending on what has happened within the next 10 actions considering all features listed in Table 1, including the locations. This binary classification model was trained with the same CNN-LSTM network and showed an accuracy of 78% on the test set.
Optimization results
In contrast to the behavior prediction and the expected goal models in which we have access to the labels, it is a challenging task to evaluate the optimization results, since there is no ground truth method for action valuation or optimal actions in soccer. Therefore, we evaluate the performance of our proposed framework with an eye towards two questions: (1) How well our optimized network maximizes the expected goal for an offensive team and minimizes the threat for a defensive team in comparison to the actual policy? We answer this question by the off-policy evaluation (OPE) method. (2) What is the intuition behind the selected actions of our target policy? We elaborate on this by providing two scenarios of the different situations in a particular match from the dataset.
Off-policy evaluation with importance sampling
Applying the off-policy method in our soccer analysis problem, we faced the following challenge: while training can be performed without a real robot (simulator), the evaluation cannot, because we cannot deploy the learned policy in a real soccer match to test its performance. This challenge motivated us to use OPE, which is a common technique for testing the performance of a new policy, when the environment is not available or it is expensive to use. With OPE, we aim to estimate the value and performance of our newly optimized policy based on the historical match data collected by a different actual policy obeyed by the players. For this aim, we use, the importance sampling method, similar to related works, such as Xie et al. 23 The importance sampling method takes samples from the actual policy distribution to evaluate the performance of the target policy distribution. The workflow of the evaluation with importance sampling for defensive actions is sketched in Figure 3.
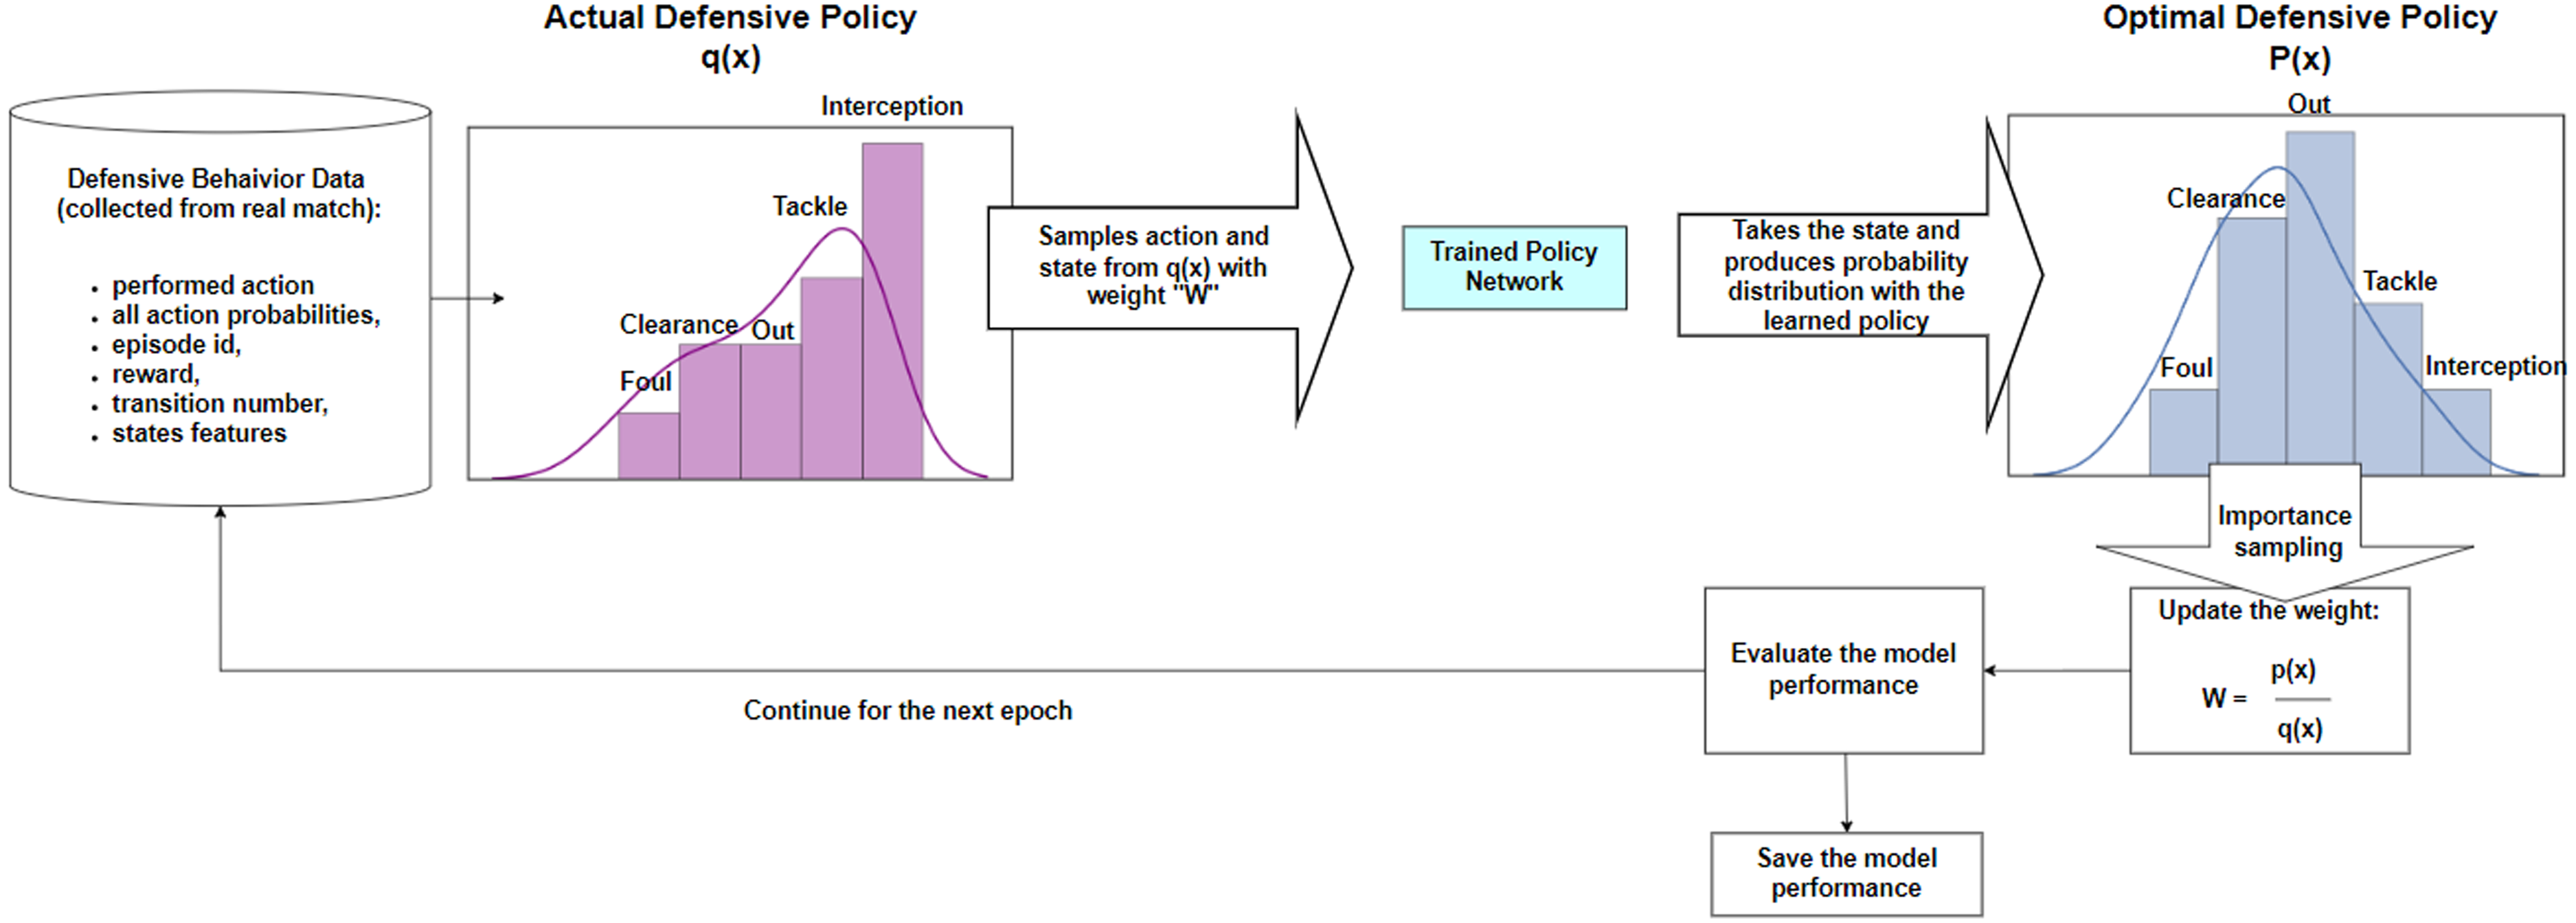
Importance sampling workflow to evaluate the performance of the optimal policy.
Discovering the optimal actions in different pitch zones
Our proposed framework tweaks the probability distribution of occurring offensive and defensive actions given any possession. Thus, the action that has the maximum probability after optimization is considered as the optimal action. This application assists soccer data analysts to feed any kind of states of the possessions to the policy networks and infer the optimal offensive and defensive actions. However, coaches are more enthusiastic with high-level results that help them in optimal decision making and planning for future games. To create such insights, we divide the soccer pitch into five different zones: left wing, left half-space (i.e. the area between left wing and center), center, right half-space (i.e. the area between right wing and center), and right wing. We then compare the action frequency using the actual policy (computed from the event data) and our trained optimal policy in each of the zones for each of the offensive and defensive teams. Figures 4 and 5 illustrate the comparison of action frequency in each of the zones following actual and optimal policies. The top row in these figures provides the exact action frequencies, and the bottom rows show the Kernel Density Estimation (KDE) of the mean rewards on average of all the 104 games following actual and optimal policies. The summary of the most important results for the offensive and defensive approaches according to their objectives and reward functions is as follows (Note: we provide some justification of the obvious results in soccer games in parentheses that partially proves the validity of our approach):
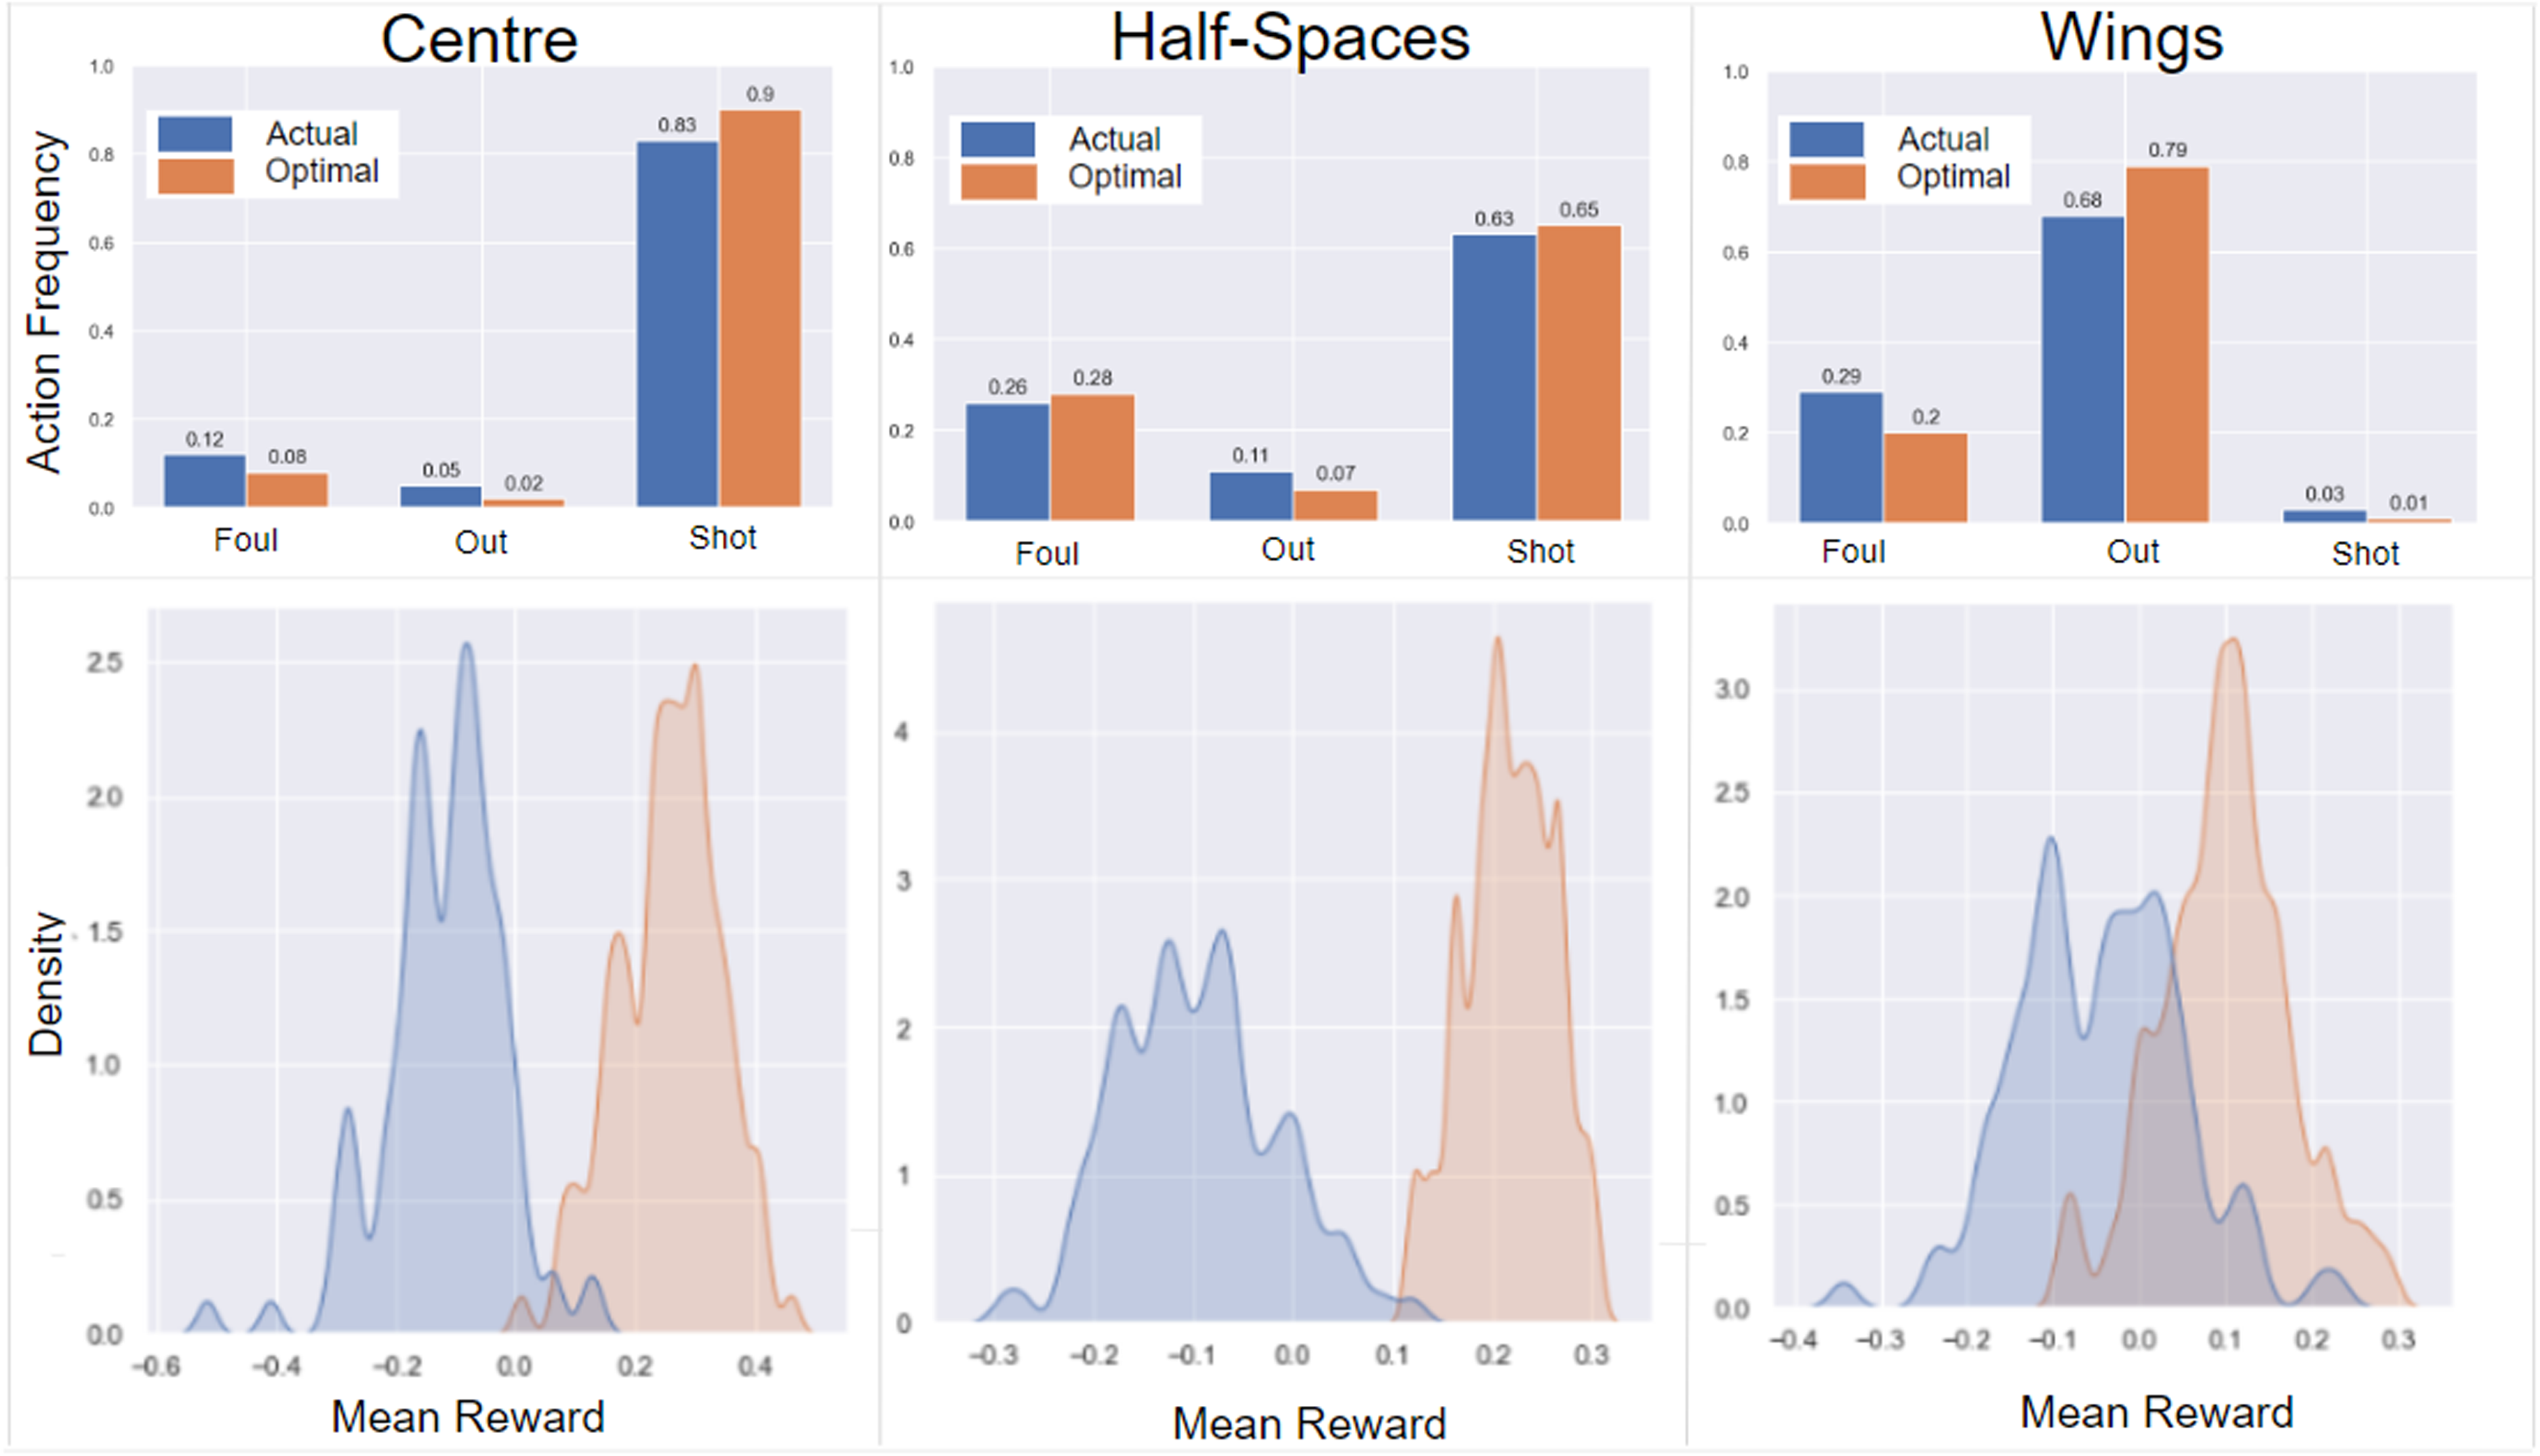
Optimization results for offensive actions in different pitch zones. The top charts illustrate the actual and optimal offensive action frequencies and the bottom charts show the Kernel Density Estimation (KDE) of the mean rewards following each of the actual and optimal policies. Mean rewards show the amount of expected goal difference the offensive team can gain on an average of all games following each of the actual and optimal policies.
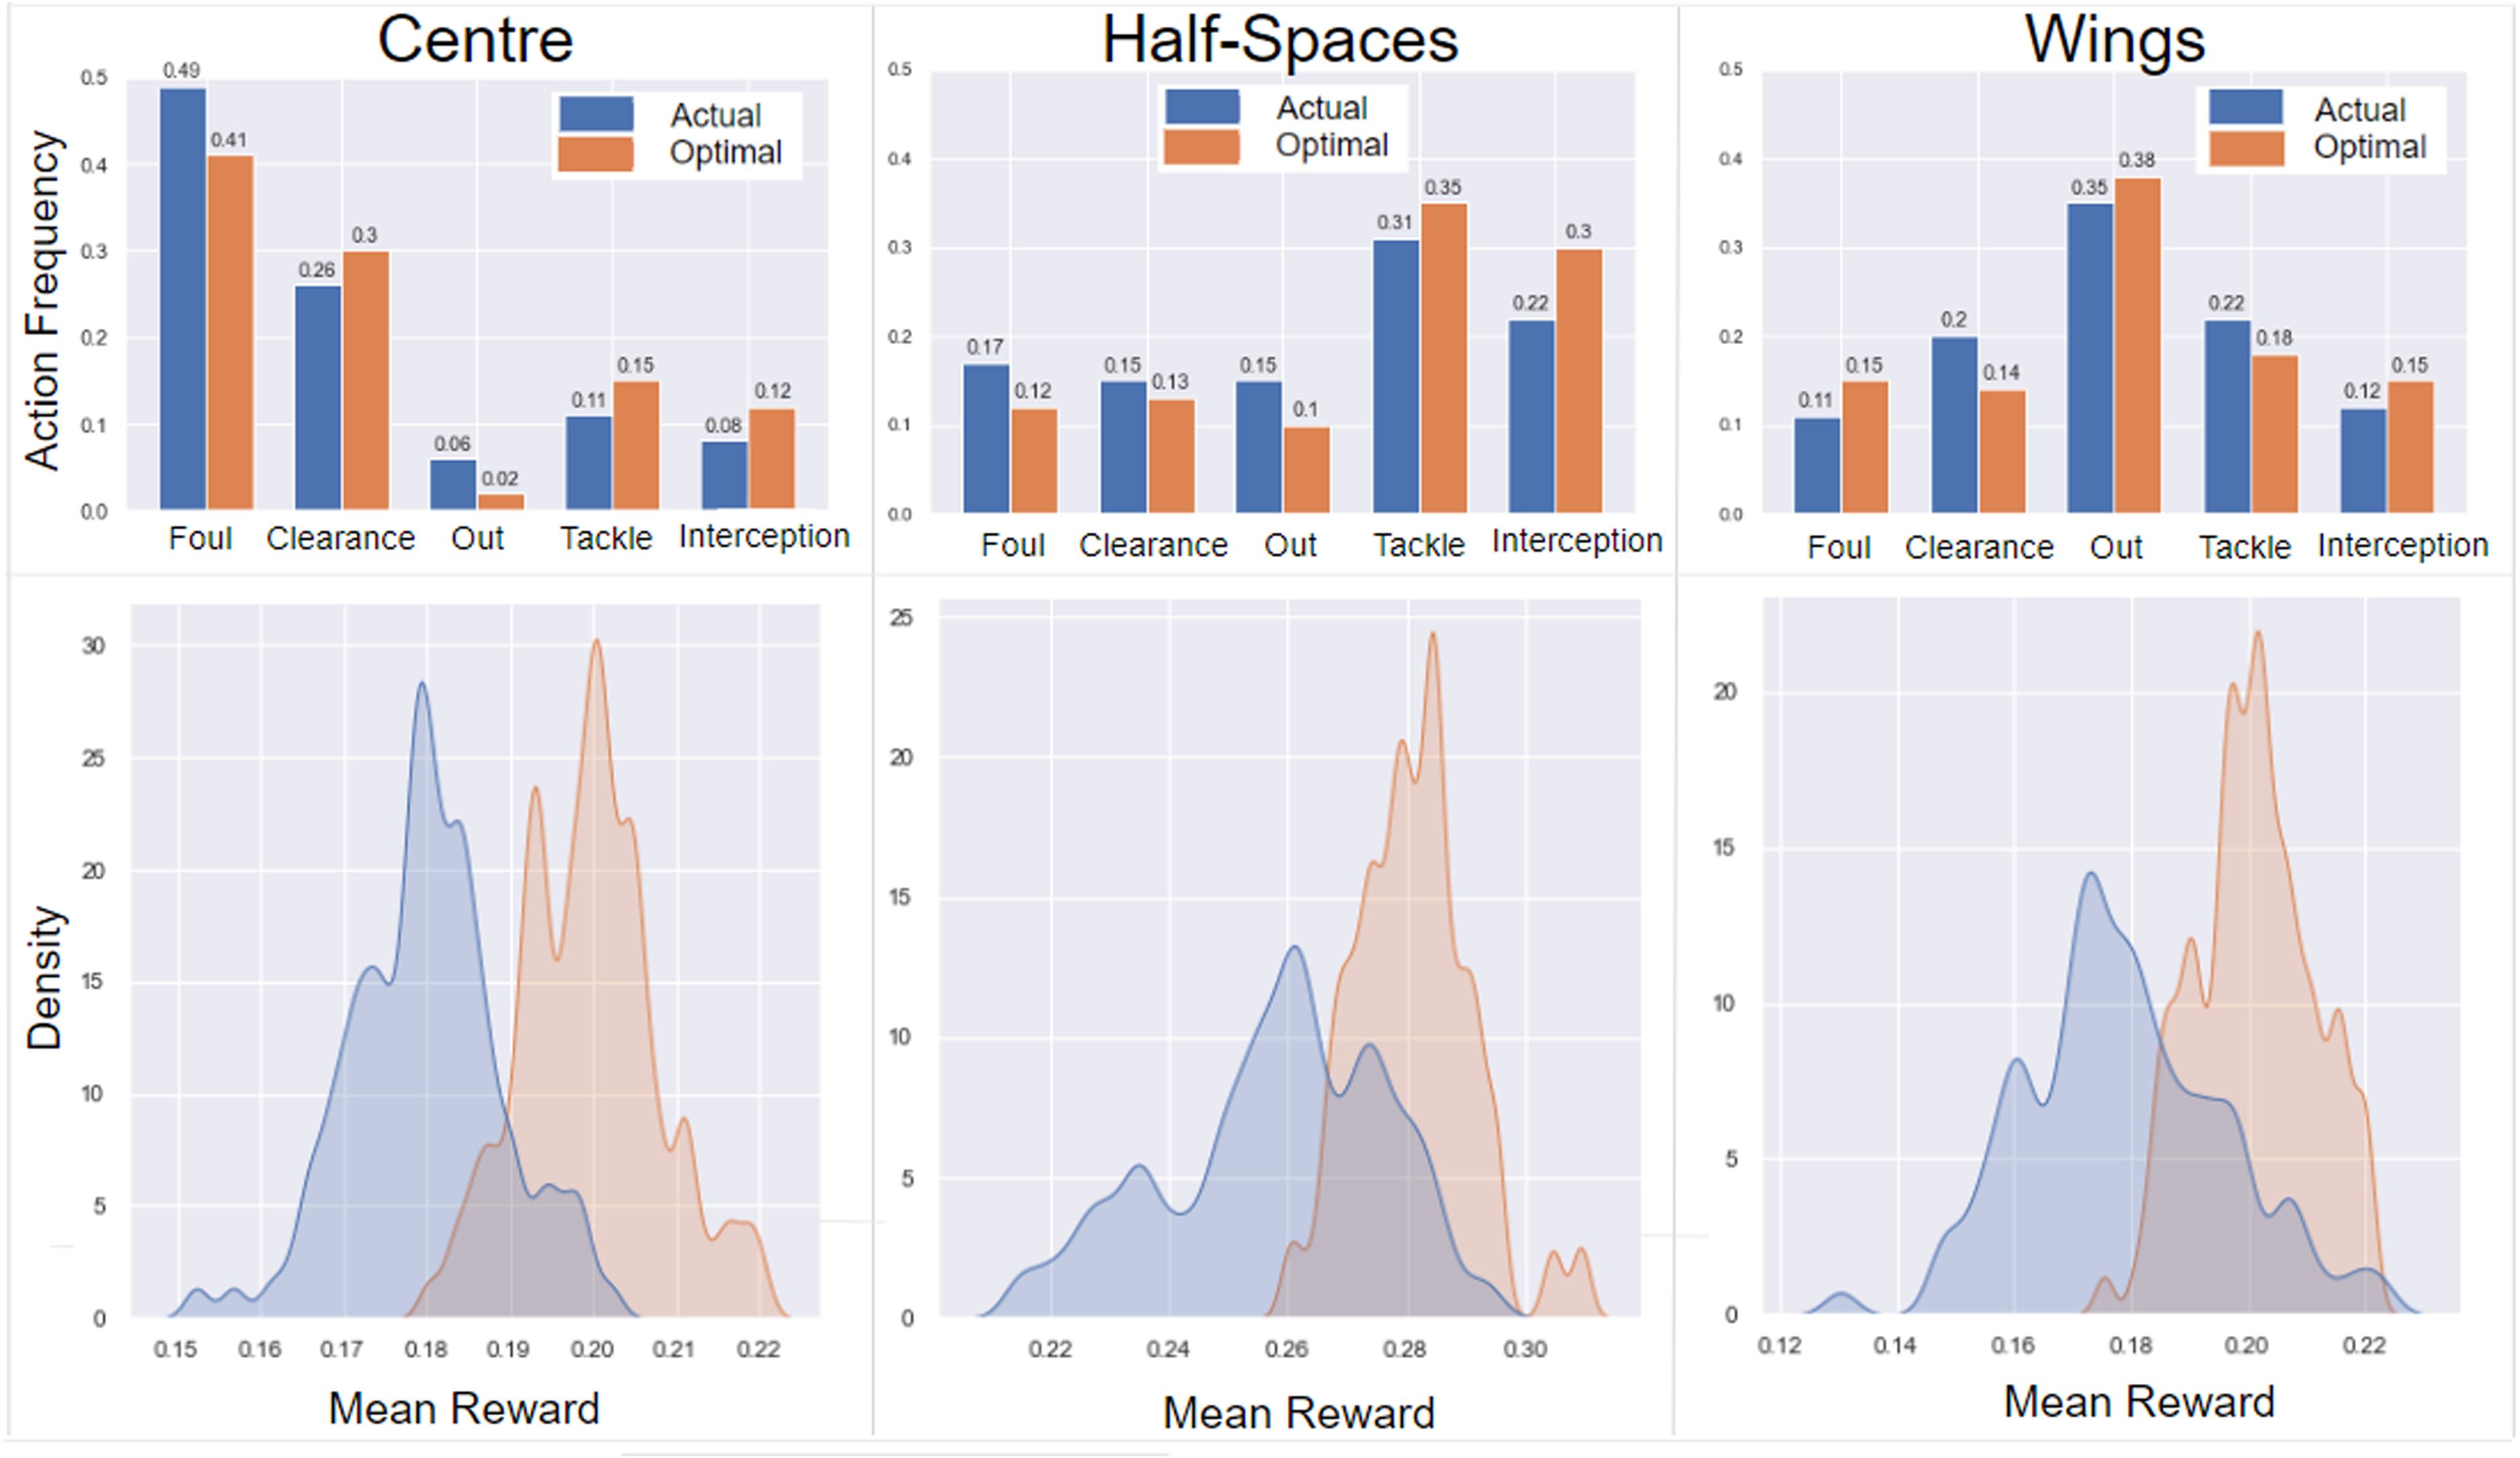
Optimization results for defensive actions in different pitch zones. The top charts illustrate the actual and optimal offensive action frequencies and the bottom charts show the Kernel Density Estimation (KDE) of the mean rewards following each of the actual and optimal policies. Mean rewards show the amount of decrease in the chance of scoring by attacking teams (preventing the threat) before and after the defensive action of the defender team on an average of all games. Thus, a higher mean rewards favours the defending team.
Offensive approach
In Centre: the optimal policy proposes more shots (due to the large xG values in this zone) and less fouls (due to the punishment resulting in a penalty or free kick). The proposed modification in action frequencies results in a 0.4 increase in mean rewards (i.e. expected goal of the attacking team) from In Half-Spaces: the optimal policy suggests more fouls and more shots (i.e. long-distance shots). The proposed modifications in action frequencies results in a 0.3 increase in mean rewards from In Wings: the optimal policy suggests increasing the number of ball-out actions and committing less fouls. This modification in frequencies changes the mean rewards from
In total, the amount of expected goal difference before and after the interrupting action for the offensive team would be
Now, we consider an offensive scenario to see how the optimized policy works compared to the actual policy.
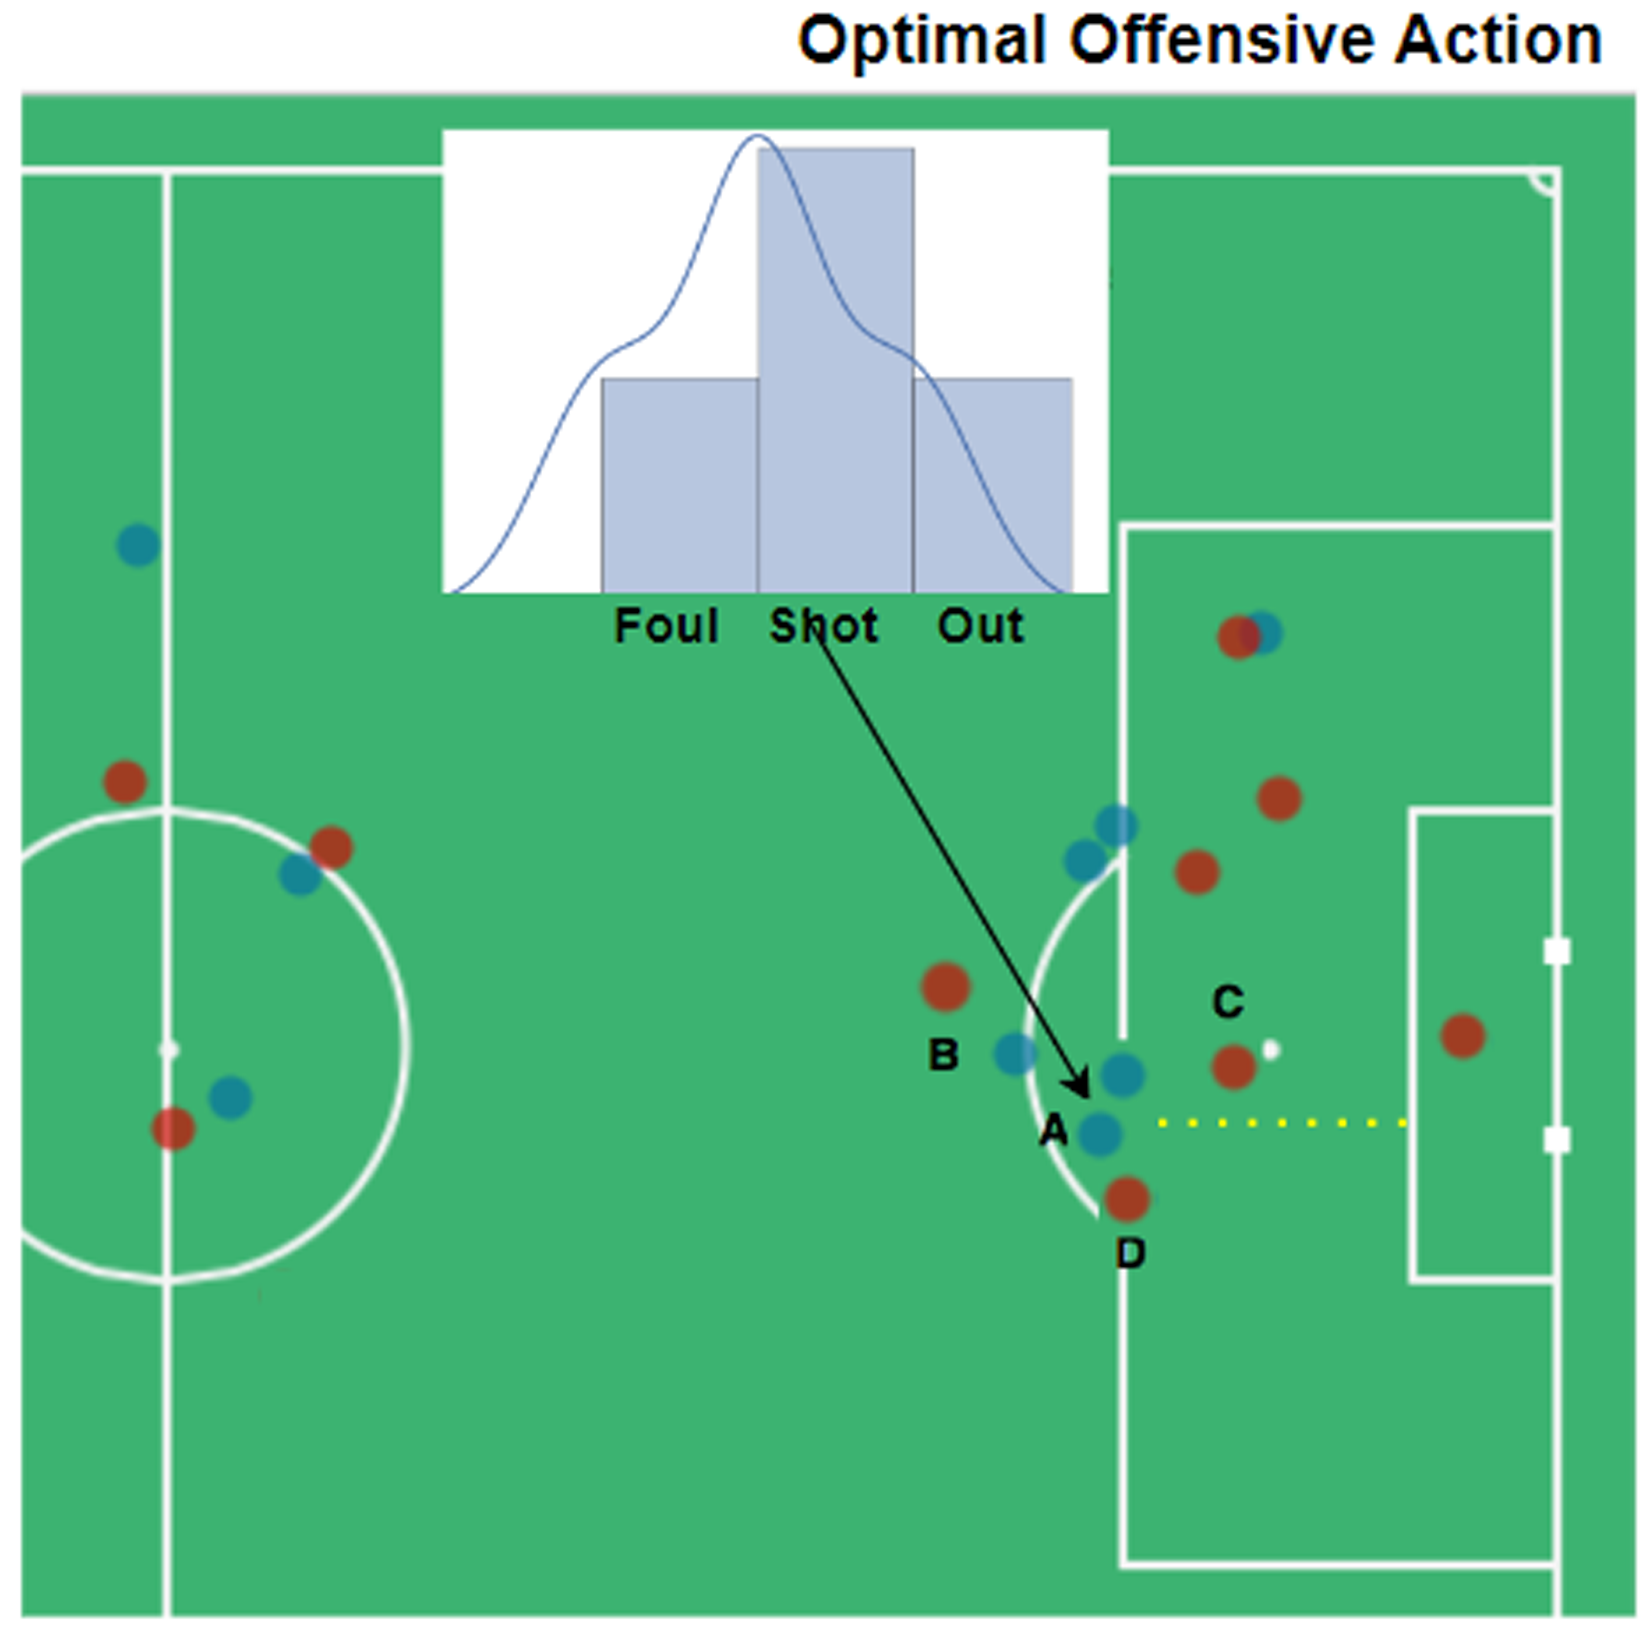
Offensive scenario: Blue dots are offensive team players, and reds are defenders. Player (a) is the attacker and the ball holder, and players (b, c, and d) are the defenders. The attack direction is from left to right. Yellow dashed lines show the optimal trajectory of ball, if player (a) was following optimal policy. The probability distributions show the optimal output of our trained policy network.
Defensive approach
In Centre: the optimal policy proposes less fouls (since it usually results in a free kick and high chances of goal by attackers), more clearances, less ball outs, more tackles, and interceptions. The proposed modifications in defensive action frequencies result in a 0.02 increase in mean rewards for the defending team (i.e. 0.02 decrease in the scoring chance of the attacking team) from 0.18 to 0.20 on average of all games. In Half-Spaces: the optimal policy suggests less fouls, clearances, and ball outs, and more tackles and interceptions instead. The proposed modifications in action frequencies result again in a 0.02 increase in mean rewards for the defending team (i.e. 0.02 decrease in the scoring chance of the attacking team) from 0.26 to 0.28 on an average of all games. In Wings: the optimal policy suggests increasing the number of fouls (since it usually results in a free kick which is less riskier from the wings than in the center), less clearance, more ball outs (since it usually crosses the touchline and results in a throw-in which is considered to be less riskier than a free kick), less tackles, and more interceptions. The proposed modifications in action frequencies result in a 0.03 increase in mean rewards for the defending team (i.e. 0.03 of decrease in the scoring chance of attacking team) from 0.17 to 0.20 on average of all games.
In total, the defensive team can decrease the expected goal difference of the offensive team by 0.2 following the interrupting defensive action of the actual policy, and they can increase this amount to 0.22 following optimal policy, which indicates a 0.02 improvement in decreasing the scoring probabilities on average of all episodes through the games.
Now, we consider a defensive scenario to see how the optimized policy works compared to the actual policy.
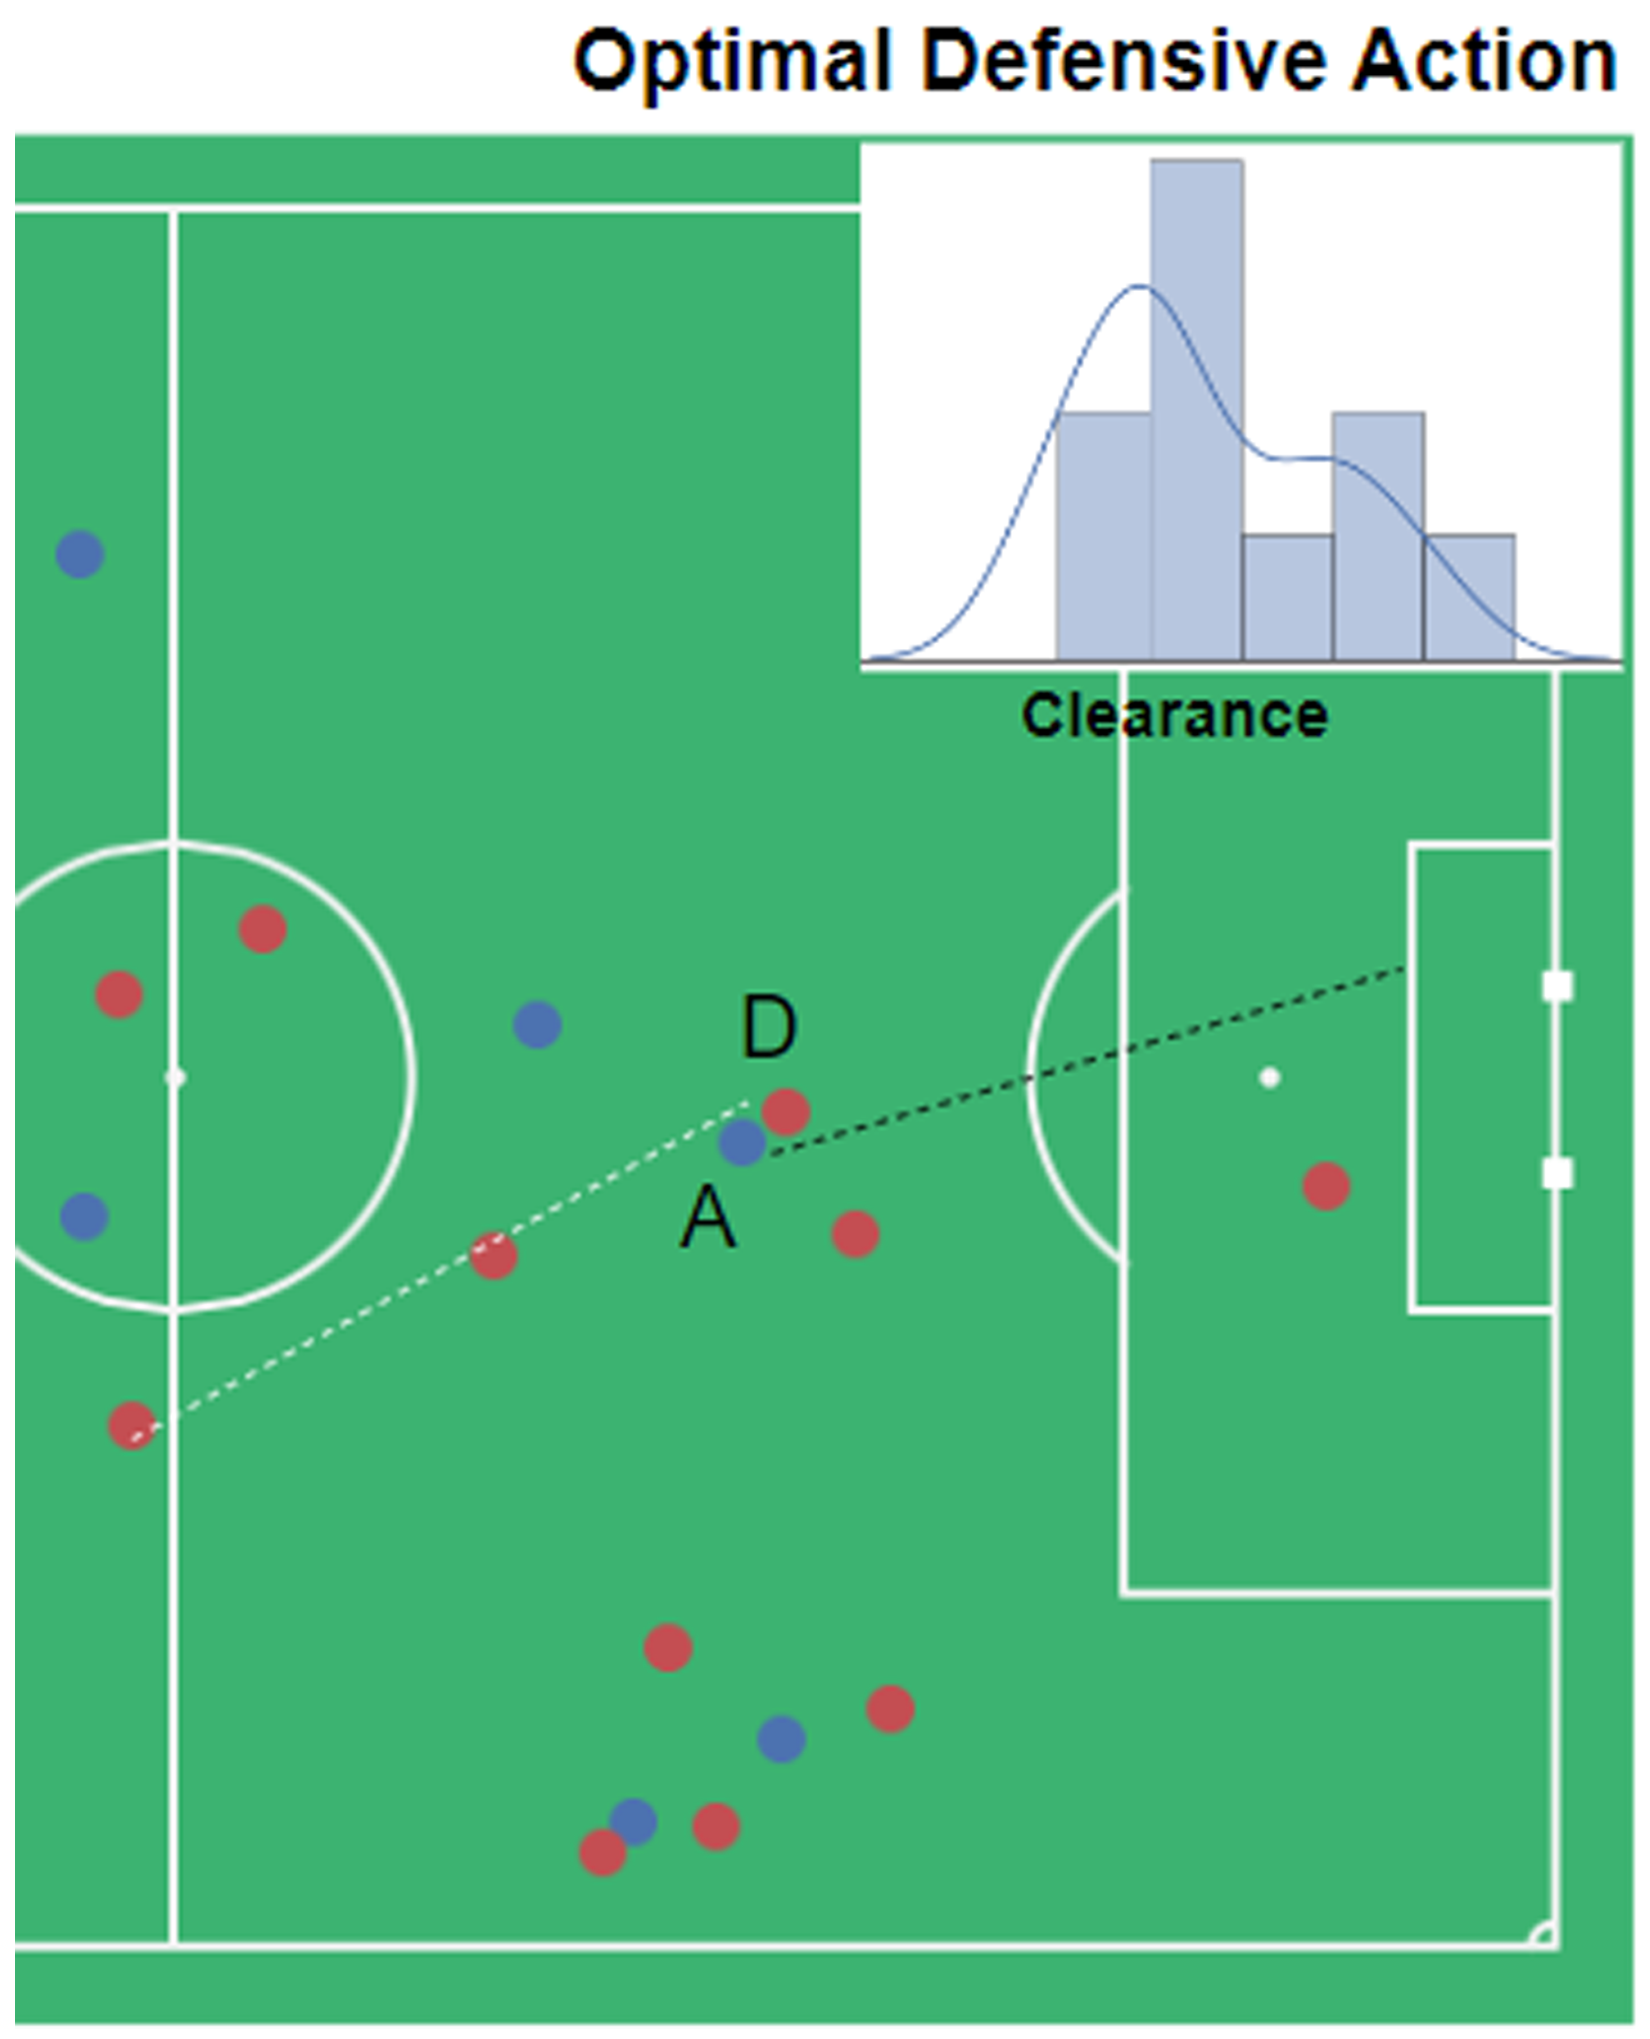
Defensive scenario: Blue dots are offensive team players, and reds are defenders. Player (a) is the attacker and the ball holder, and players (d) are is the defender. The attack direction in is from left to right. Black dashed line shows the actual ball trajectory and White dashed lines show the optimal trajectory of ball, if player (d) was following optimal policy. The probability distributions show the optimal output of our trained policy network.
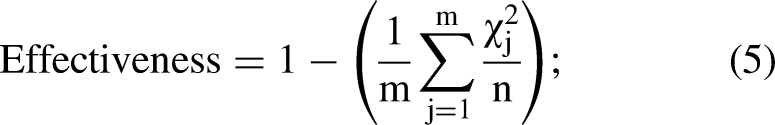
Measuring teams’ effectiveness
Measuring teams’ effectiveness is one of the most prominent use-cases of our approach. Since we access both the actual and optimal probabilities of performing any offensive and defensive actions for each team in different situations of the soccer games, we could estimate their distances and use it to measure effectiveness. To do so, we use Chi-square distance that is a statistical method, generally used for measuring similarity between histograms. The Chi-square distance of two arrays “x” and “y” with “n” dimension is calculated as follows: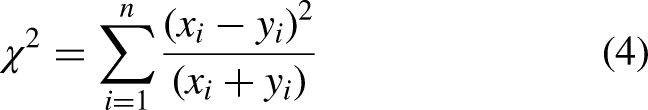
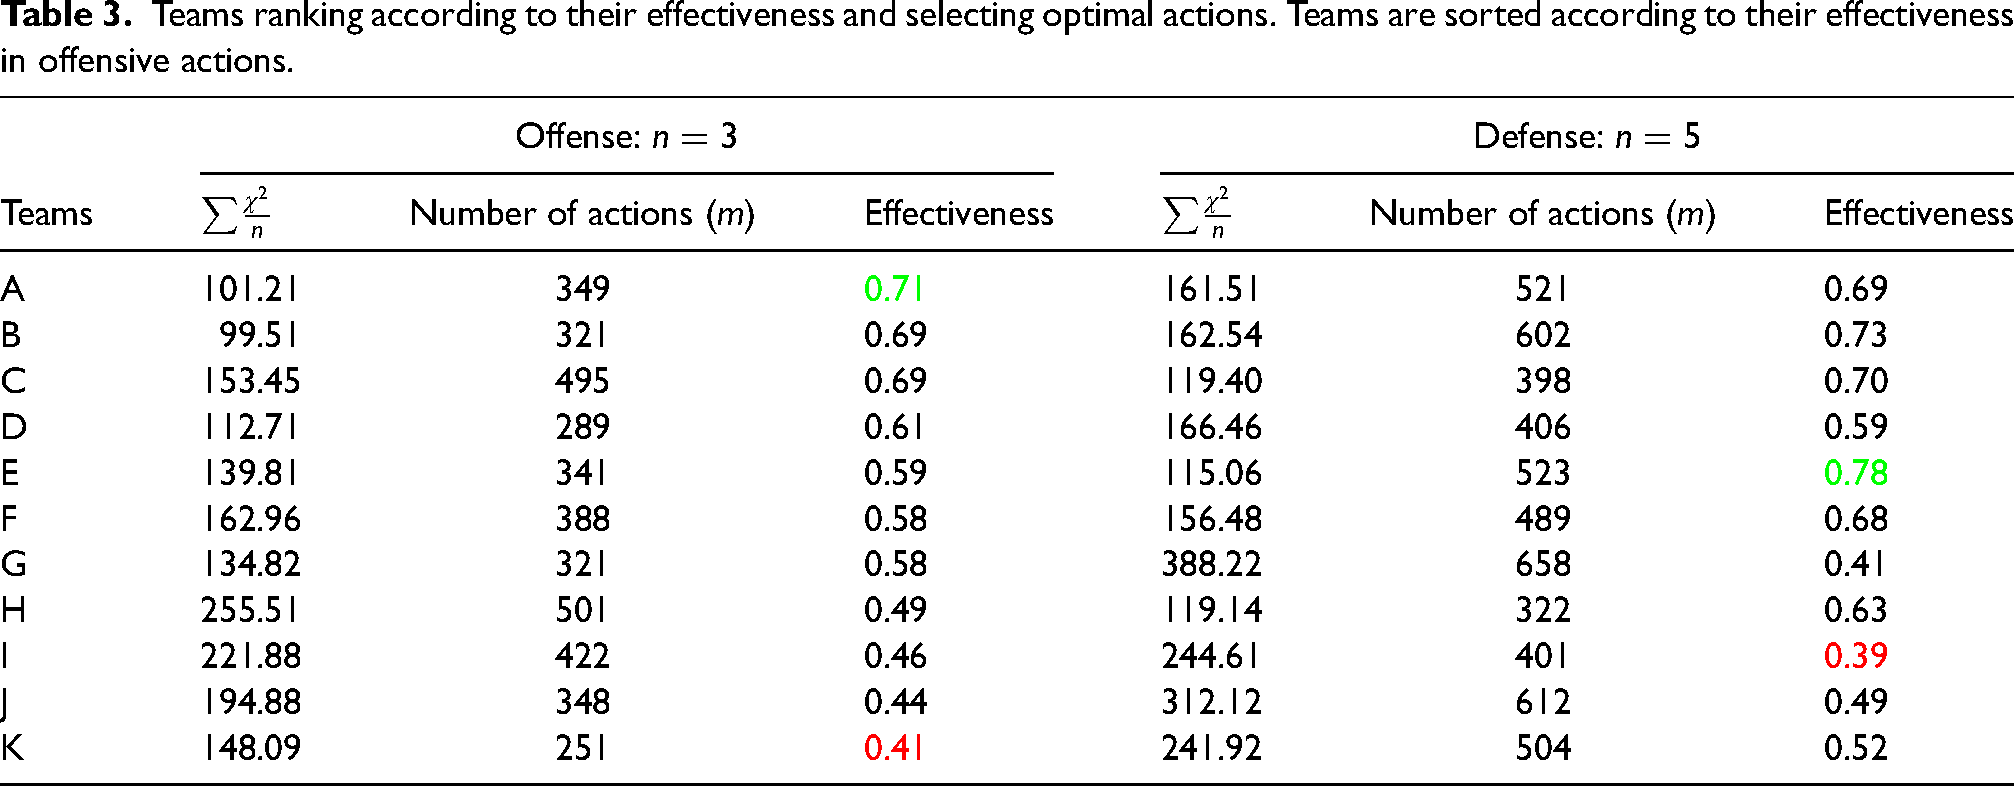
Teams ranking according to their effectiveness and selecting optimal actions. Teams are sorted according to their effectiveness in offensive actions.
Conclusion
This work proposes a data-driven deep reinforcement learning framework to help offensive and defensive players to select the best action at the interrupting point of a possession.
Our framework built on a training policy network helps the players and coaches to compare their actual policy with the optimal one. More specifically, sports professionals can feed any state with the proposed possession features and state representation to find the optimal offensive and defensive actions. Furthermore, coaches can use the results of our optimization for future planing in terms of the adjustment required in action frequencies on different pitch zones. We analyzed 104 matches from 11 teams and showed that the optimal policy network can increase their mean rewards on average of all games in the dataset at both offensive and defensive situations. Concisely, the optimization results have different suggestions for offensive and defensive teams. For offensive team, the optimal policy suggests more shots in half-spaces (i.e. long-distance shots). For the defending team, the optimal policy suggests that when locating in wings, defensive players should increase the frequency of fouls and ball outs rather than clearances, and = when located in the center, players should increase the frequency of clearances rather than fouls and ball outs. Moreover, we provide the studied teams’ ranking in terms of their effectiveness in selecting optimal offensive and defensive actions throughout their games.
In this work, we optimize the policies independently and assume that the behavior of the opponent team is not adapted to the optimal policy. Thus, a direction for future work is to use multi-agent reinforcement learning to adapt the opponent teams with the optimal policy as well, which might decrease the amount of improvement in mean rewards reported in this article. Another limitation of the current study is the focus on on-ball defensive actions, hence, the ignorance of the positioning decisions of the teams. Moreover, further information of the game context, such as different attributes of passes (e.g. height, length, angle, etc.), teams’ and players’ abilities and their specific strategies would significantly improve the results.
Footnotes
Declaration of conflicting interests
The author(s) declared no potential conflicts of interest with respect to the research, authorship, and/or publication of this article.
Funding
The author(s) disclosed receipt of the following financial support for the research, authorship and/or publication of this article: Project no. 128233 has been implemented with the support provided by the Ministry of Innovation and Technology of Hungary from the National Research, Development and Innovation Fund, financed under the FK_18 funding scheme.