
Abstract
The aim of the present study was twofold: (i) to analyze the relationship between weekly variations in ACWR, training monotony (TM), training strain (TS), s-RPE and the number of jumps; and (ii) to explore the association between tests based on the external and internal training intensity (TI) measures across weeks. An observational cohort study was conducted. Ten female elite volleyball players (two setters, three middle-blockers, three outside hitters, and two opposites) of a first Division Portuguese team (24.1 ± 6.12 years old; 66.48 ± 6.85 kg; and 175.4 ± 6.52 cm) participated in this study. Players were monitored for external and internal TI measures. The correlation coefficients between internal and external TI measures were determined using Pearson's r. The results showed a moderate relationship between weekly variations of ACWR, TM, TS, s-RPE, and the number of jumps. Additionally, a moderate association between external and internal TI measures were detected. In conclusion, s-RPE seems to be a more sensible measure than the number of jumps, since its percentage of variation was higher.
Introduction
The monitoring of training intensity (TI) has been thoroughly highlighted within the strength and conditioning sports literature. 1 Specifically, monitoring training is intended to provide information about the impacts of internal and external TI on athletes, 2 thereby giving sports stakeholders (e.g. coaches, performance analysts, and researchers) an ongoing and renewed understanding of individual responses to distinct training stimuli. The concept of TI displays the input (manipulated) variable in terms of intensity and volume to prompt an intentional training response. 3
So far, different methods have been used to measure TI, such as internal and external TI. 4 Due to volleyball's intrinsic physical and physiological demands, the TI of athletes of this sport are characterized by short, high-intensity efforts on displacements and the explosive power exerted during vertical jumps, which are deeply intertwined with the successful performance of functional technical and tactical skills. 5 Therefore, the current understanding of both internal and external TI in volleyball needs to be updated and extended to optimize training planning and, consequently, to sustain the high technical-tactical performance of athletes.
Internal TI, which refers to individual responses to external stimuli, 4 has been assessed through several indicators (e.g. acute-chronic workload ratio, s-RPE). For example, Clemente et al. 6 analyzed the relationships among and variance in perceived internal TI and wellness status in elite male volleyballers. They concluded that weekly internal TI primarily impacts players’ wellness status during the preseason and the middle of the season. Also, a study conducted on professional women soccer players found that spikes in ACWR values may induce higher perceived stress. 7
On the other hand, external TI refers to the exterior stimuli applied to players, independent of their inner features. 8 In this sense, concerning volleyball, external TI can be represented by the number of jumps per training session or game. 9 Usually, the procedures inherent to counting jumps are carried out using notational video analysis. However, this method is time-consuming and labor-intensive. A reductor method is also used to collect data. This method exclusively informs about the number of jumps but does not measure the load (i.e. jump height) associated with the jumps. 10 As recently claimed and empirically tested in several studies, the Vert device can address this issue in volleyball.11–13
Several empirical investigations have examined the effects of internal or external TI on volleyball athletes’ performance.5,14 However, such studies commonly analyze each type of TI separately. Therefore, it remains unclear how the relationship between internal and external TI should be expressed. In this respect, Akubat et al., 15 and, more recently, Beato and Drust, 16 underlined the importance of combining both parameters to better comprehend players’ TI.
Moreover, while some investigations have explored the effects of accumulated perceived TI in volleyball, 17 they lack correlations between TI and other important indicators such as TM and TS. 17 Indeed, the study of accumulated TI and its variations is essential to comprehending the influence of training methods and strategies on players’ TI adaptations. Such studies could help coaches plan micro-cycles and design training tasks. Despite its pertinence, the ways in which variations in TI could occur within and between training weeks remains understudied in the volleyball literature. Specifically, it is unknown how these variations could be expressed by female volleyball players, as the studies published so far tend to include youth or senior male players.5,18–20
Based on the above discussion, the purpose of conducting this study on an elite female volleyball team was twofold. First, we sought to analyze the agreement of between-week variations in acute, ACWR, TM and TS measures, as they are related to s-RPE and number of jumps. Secondly, we examined the association between tests based on the external and internal TI measures across weeks.
Materials and methods
Participants
Ten female elite volleyball players (two setters, three middle-blockers, three outside hitters, and two opposites) of a team from the Portuguese 1st Division (24.1 ± 6.12 years old; 66.48 ± 6.85 kg; and 175.4 ± 6.52 cm) participated in this study. The players were monitored in 32 training sessions throughout 10 weeks (October to December)—analyzing the entire first phase of the championship. The training sessions lasted between 90 and 120 minutes and always started at 6:45 p.m. The team had some issues regarding Covid-19 and the competitive schedule was adapted with several congested fixtures. To balance the TI and recovery, only allowed the team to practice 2 or 3 times a week. The following inclusion criteria were defined: (i) players did not suffer any injuries or illnesses during the period of data collection (injury was defined as any physical or psychological complaint resulting in an incapacity to train or compete normally 21 ) and (ii) players participated in all training sessions during the study period. Also, weeks with less than three training sessions were excluded from the analysis.
All players voluntarily participated in the study and were informed about the study's scope, design, implications, risks, and benefits before they signed informed consent forms. The ethical standards for the study of human beings were followed according to the Declaration of Helsinki, and the study was conducted in line with the ethical international guidelines for sport and exercise science research. 22 The study protocol was also approved by a local university's ethics committee before the data collection began.
Design and procedures
An observational cohort study was conducted. Both internal and external TI measures were monitored, during all training sessions, over 10 weeks (mid-season, October to December 2020). Eligible players were monitored for internal and external TI in all training sessions and matches throughout the study period. First, the week-to-week variations in the TI measures were analyzed. Then, a correlational research design tested the relationships between internal and external TI measures. The ecological validity of the study was ensured, and the researchers did not interfere with the team's planning or training routines of the team.
Internal intensity quantification
To assess internal TI, we applied Borg's CR-10 rate of perceived exertion (RPE) scale in every training sessions, roughly 30 minutes after each training session. 23 The players’ ratings were provided in response to the question, “How hard was the training session?” The responses on the scale ranged from 1 (very light activity) to 10 (maximal exertion). All responses were recorded by the same researcher (who was also the team's assistant coach). The scores were provided individually to reduce potential confounding caused by listening to other players’ responses. The players had previously been familiarized with the scale during a three-week period to increase the accuracy of their answers.
The RPE scores were also used to determine session RPE (sRPE) (calculated as the CR-10 RPE score multiplied by the duration of the training session (in minutes). 24 The training duration was recorded by the same researcher of the coaching staff who monitored perceived exertion (i.e. the assistant coach). ACWR is a rolling average used to compare the acute TI completed recently (usually 5–10 days) with the chronic TI completed over an extended period (usually four–six weeks). 25 In this study, based on jumps and s-RPE from the athletes, the acute training load was measured based in one week and chronic load from the fourth week. ACWR was calculated from the fourth to the 10th week of the study period by dividing the acute by the chronic TI. A value greater than 1 indicated that the acute TI was greater than the chronic TI. 26
Both TM and TS were calculated following the method used by Foster. 24 TM was calculated as the average of TI of the last seven days divided by the standard deviation of the last seven days, while TS was determined as the product of weekly TI and TM. 17 The TI measures were calculated weekly for each player and used in the data treatment.
External intensity quantification
An inertial measurement unit consisting of three-axis gyroscopes, three-axis magnetometers, and three-axis accelerometers (Vert® Classic, MyVert, Florida, USA) was used by each player during the data collection period to determine the external TI of each training session. Players wore the device after warming up to ensure the accurate monitoring of external TI during technical or tactical exercises. The unit estimated the total number of jumps and the height of each jump. The inertial sensor was placed on a belt that players wore on their hips from the start of the training session until the end. This instrument is a valid tool for field-based measurements of jumps and has been used in other studies.5,27–29
The data were transmitted via Bluetooth to the MyVert Coach application, making it possible to monitor all players in real time. The device presents a mean error of −0.945 inches when compared to gold standard methods. 29 The following TI measures, were calculated weekly for each player based on the number of jumps per training session: TM, TS and ACWR.
Statistical analysis
Based on the number of jumps and duration of each training session, descriptive statistics were presented as mean values with standard deviations and percentage of difference across weeks. Between weeks percentage of variation was calculated by subtracting the value from the second week (x2) from the first week (x1), dividing the result by × 1 and multiplying by 100
Results
The weekly number of training sessions, matches, and training duration (minutes) is presented in Table 1. On average, the team performed one official match per week. Throughout the weeks six, seven and nine, it was not played any official match. While, throughout the weeks four, eight, and 10, the team conducted two games each week (wk).
Descriptive analysis of the number and duration of training sessions, and matches, per week.
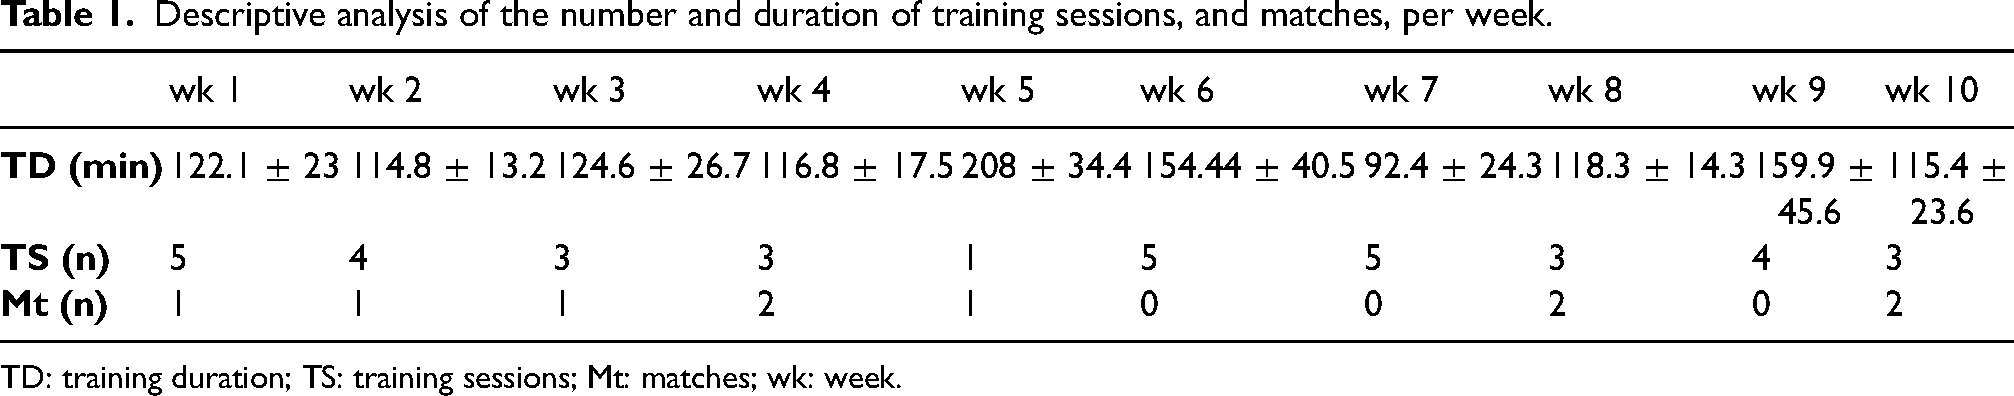
TD: training duration; TS: training sessions; Mt: matches; wk: week.
It was observed a range of 1 to 5 training sessions per week. The average duration (minutes) per training session was variable in accordance with the number of training per week as well as competitions at the weekend. Considering the number of jumps or sRPE, the acute training load, monotony, and strain variation within weeks are presented in Table 2.
Week variation (mean ± SD) for acute training load, monotony, and strain, considering the number of jumps or training duration.
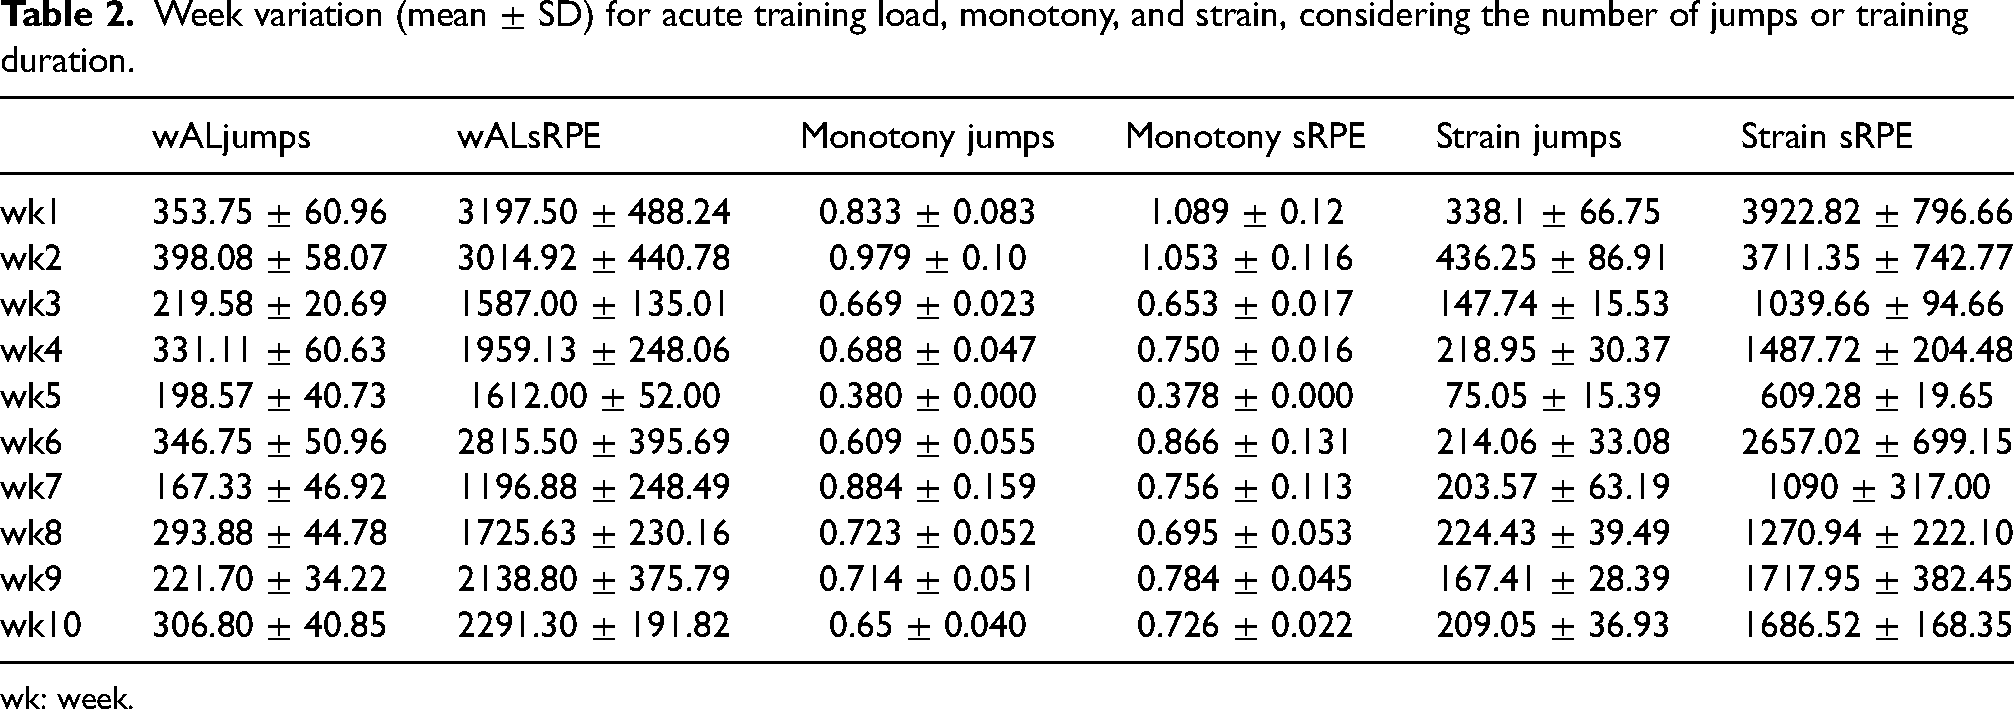
wk: week.
Figure 1 represents the percentage of difference from acute TI, monotony, and strain between weeks, demonstrating a clear match between the two measurements (number of jumps or sRPE). However, the percentage of variation is higher for sRPE when compared to the number of jumps.
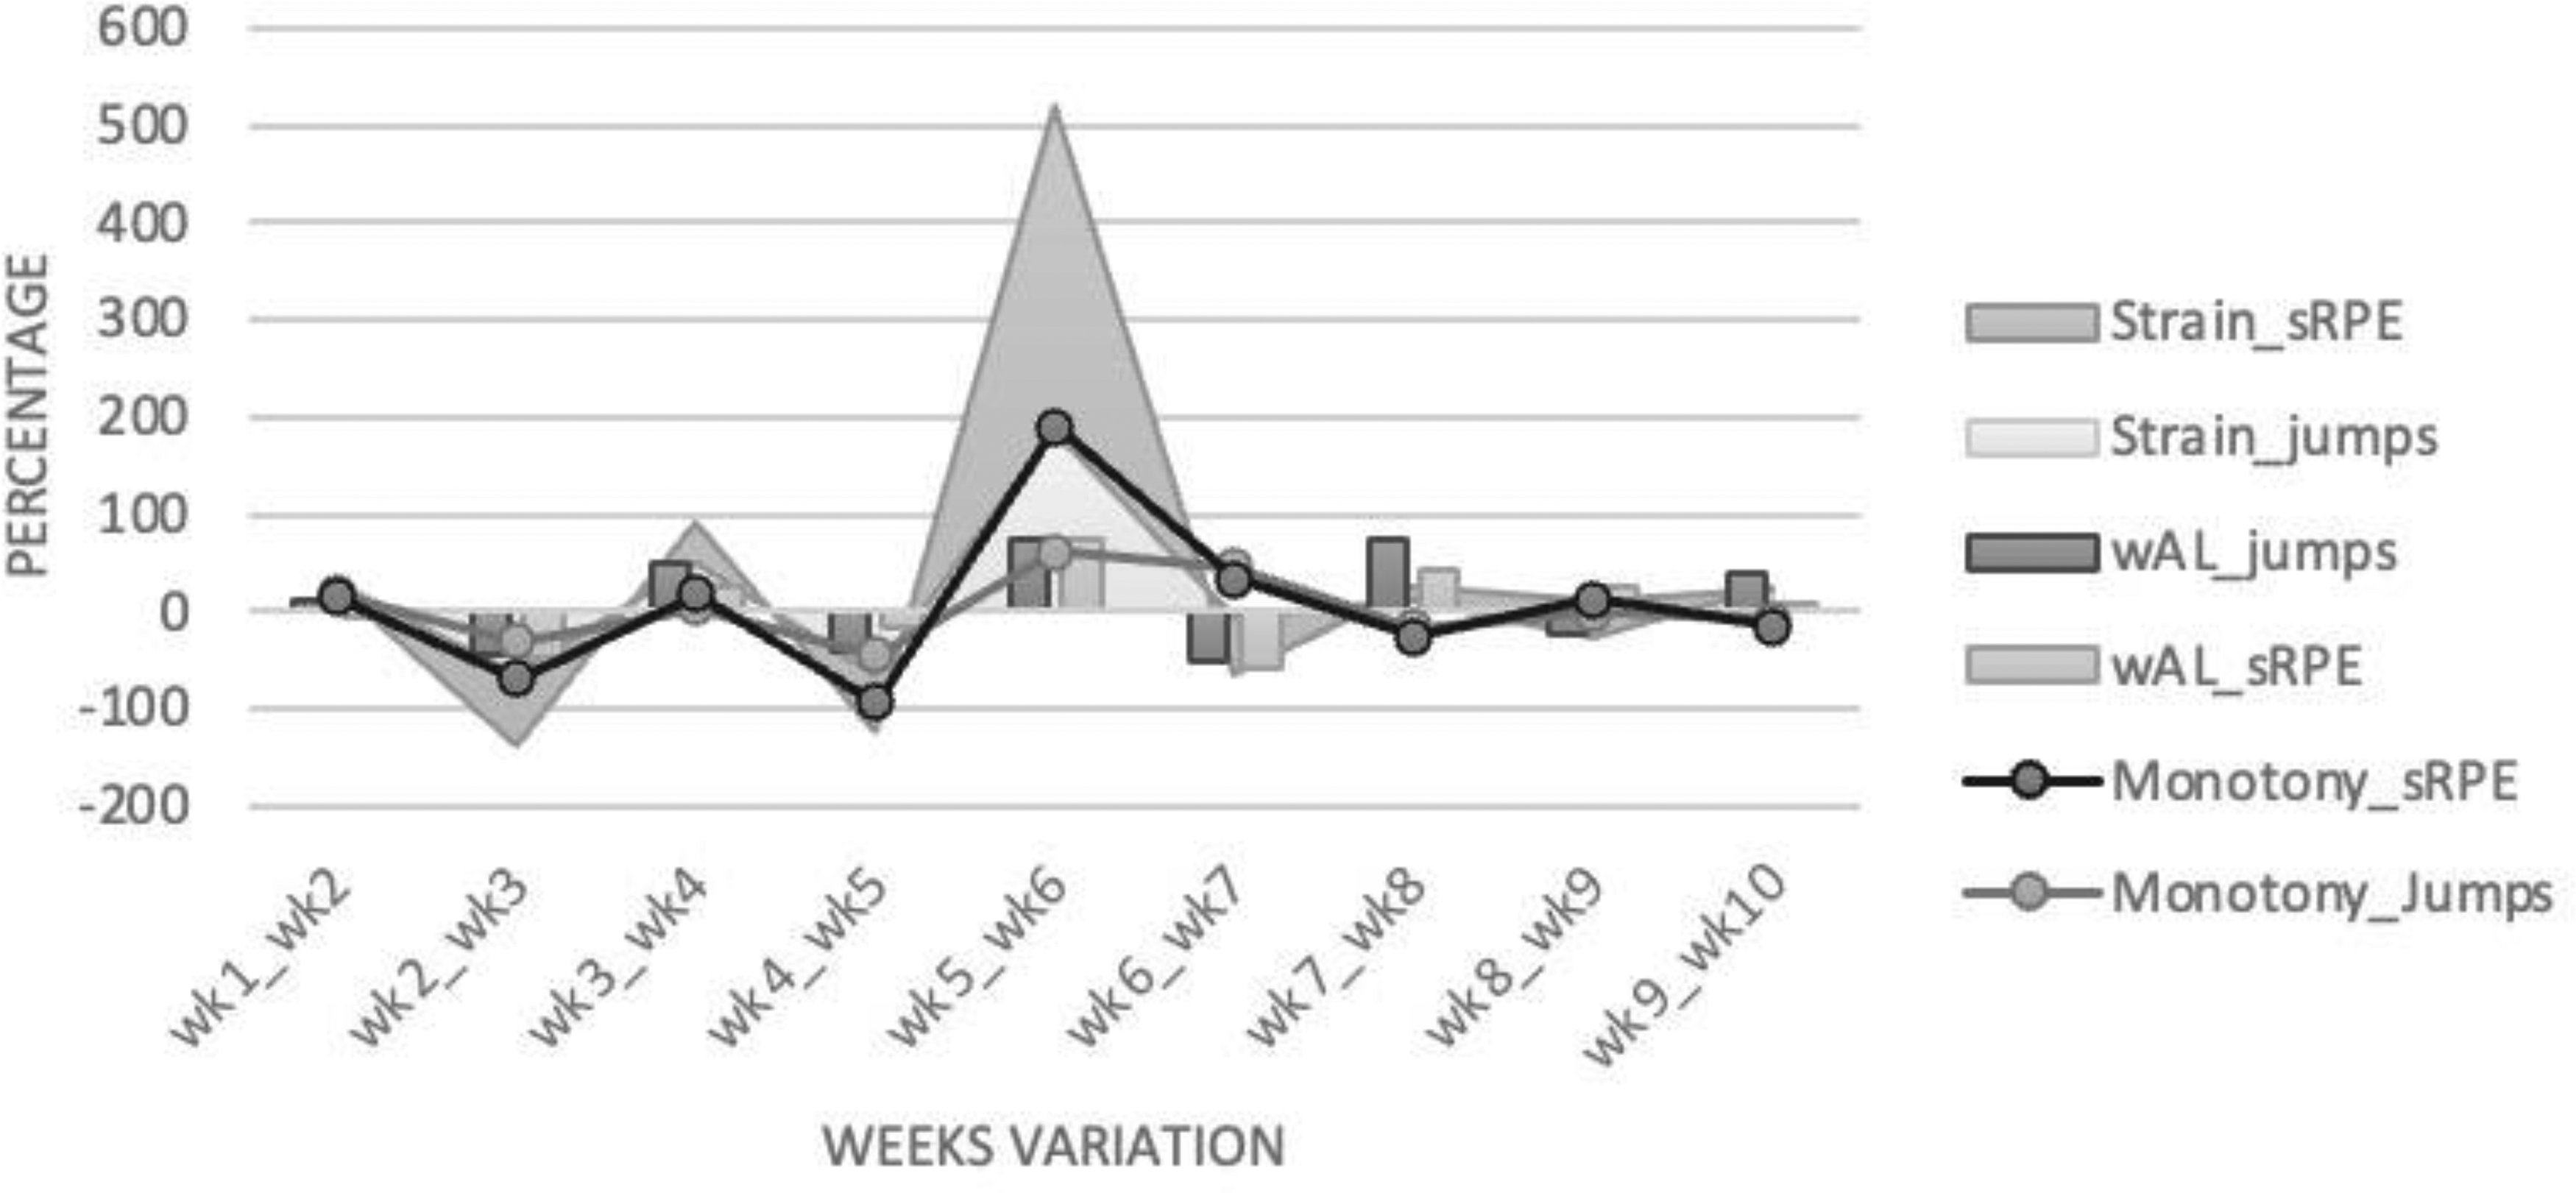
Percentage of difference between weeks acute training load, monotony and strain, considering number of jumps or session-RPE (sRPE) (multiplication of the rated of perceived exertion (RPE) score by the time of the session in minutes).
The percentage of difference had a greater magnitude between weeks two to three, three to four and five to six. This difference was always more evident when considering sRPE in contrast with the number of jumps. The acute-chronic workload ratio between weeks, and the respective percentage of difference, are presented in Table 3.
Acute-chronic workload ratio between weeks, considering the number of jumps or sRPE (mean ± SD).
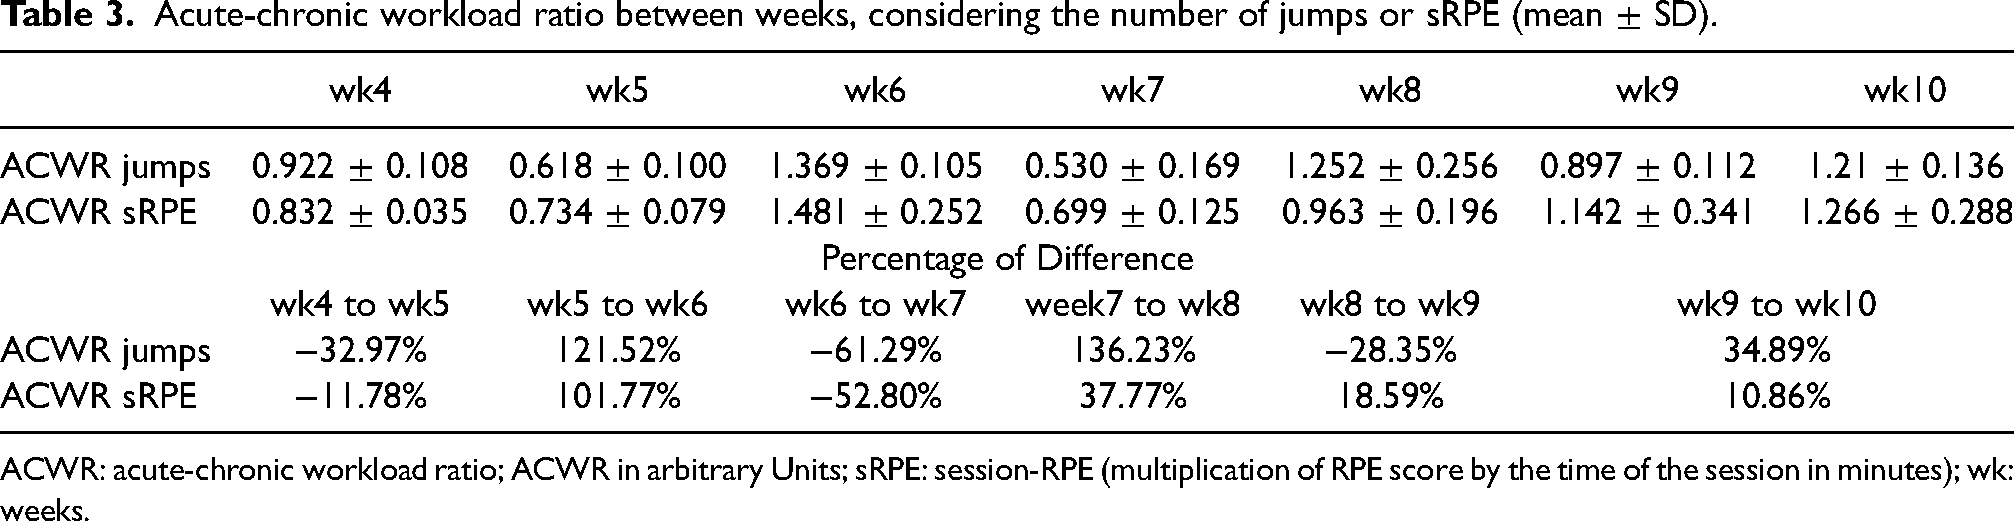
ACWR: acute-chronic workload ratio; ACWR in arbitrary Units; sRPE: session-RPE (multiplication of RPE score by the time of the session in minutes); wk: weeks.
The weekly variation in ACWR was more evident observing the percentage of difference, with a very marked difference in week seven to eight. The coefficient of correlation between sRPE and the number of jumps for the different TI measures demonstrate a large significant difference only in weeks two and seven (Table 4).
Correlations between acute chronic workload assessed by the number of jumps and sRPE.
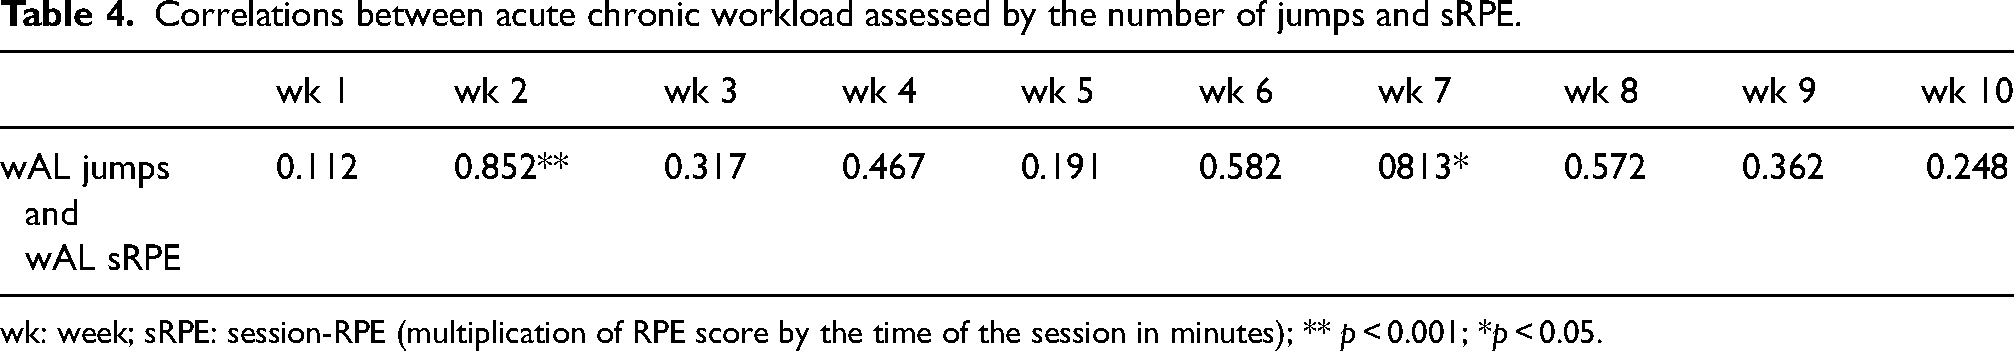
wk: week; sRPE: session-RPE (multiplication of RPE score by the time of the session in minutes); ** p < 0.001; *p < 0.05.
Discussion
The aim of the present study was twofold: (i) to analyze the relationship between weekly variations in ACWR, training monotony, training strain, sRPE and the number of jumps; and (ii) to explore the association between tests based on the external and internal TI measures across weeks. The results showed a moderate correlation between those measurements, denoting an application of weekly variations of TI measures. Moreover, a moderate association between external and internal TI measures was observed, mainly in the week with the highest imposed TI (week two). Nevertheless, sRPE seems to be a more sensible measure than the number of jumps since its percentage of variation was higher.
Throughout the 10 weeks, the highest values of the overall TL measures included in the study were observed in the first two weeks. Those values coincide with the preseason, which is primarily characterized by a high training volume combined with a significant component of fitness development (in terms of endurance, strength, and speed). 30 Indeed, during the first training sessions of the season, coaches intend to maximize a strength and conditioning routine to prepare their athletes for the upcoming competitive season. However, as explained in the present study, coaches have a limited amount of time to work with their athletes during the preseason, justified by the six weeks of preparation period before the start of the competitive period.
The monitoring process allows coaches to control the biological and physical stress that training and competition impose on players. 31 The collected data regarding TI measures also provide information that gives coaches a great opportunity to adjust TI during a microcycle and to prevent injuries. 31 This is likely why a “W” shape was observed regarding the application of the different TI measures during the 10 weeks analyzed in the present study (Table 2). These results are in line with the literature,32–34 including other studies in volleyball in particular.5,35 In fact, it has been proposed that coaches must consider week-to-week changes in TL, as large changes in TL increase the risk of injury.
A study conducted on 12 professional volleyball players reported that higher TI were present during the first two days of the six-day microcycle with five tournament matches in between. 36 However, the above-mentioned study analyzed within-week differences during a congested period, which makes it difficult to compare to the results of the present study. Despite that, a study conducted on basketball players that analyzed between-week variations in TI, reported higher acute TI in weeks without matches than in weeks with one or more matches. 37 However, in the present study, this pattern was not clearly observed. Of weeks six, seven, and nine (the weeks in which no match was played), internal and external TI measures were high only in week six, while they decreased the following week. Nevertheless, weeks six and nine were the weeks with the most minutes of training, demonstrating that the coach increased the TI by increasing the training volume and frequency. Inversely, although fewer minutes of training were registered in weeks four, eight, and 10, lower TI values were not recorded.
The analysis of internal and external load has been frequently studied, being reported a good coherence between them. 5 Therefore, the sRPE method seems to be a valid and practical indicator of TI in volleyball. 19 In fact, this coherence was observed in the present study (Figure 1). Nevertheless, only in weeks two and seven were the correlations between ACWR (assessed by the number of jumps) and sRPE almost perfect and strong, respectively (Table 4).
Moreover, Table 3 shows some inconsistencies between internal and external TI, especially from week seven to week nine. In those weeks, the athletes’ perception of effort seemed to be delayed, as the number of jumps increased. While sRPE increased in the following week (during which the number of jumps decreased). Therefore, longer studies should be carried out, especially in women, as most similar studies were conducted in male teams.
Variations in internal and external TI measures seem to indicate that sRPE is a more sensible measure of TI than the number of jumps performed, as greater oscillations in internal TI were registered when sRPE was considered. In fact, internal TI should be carefully considered by coaches when planning training programs, as it is an individual response to external stimuli, including psycho-biological responses. Therefore, athletes’ wellness status should also be considered when analyzing the effects of the imposed TI. Indeed, it has been shown that sRPE and wellness categories are moderately to largely correlated from the preseason to the middle of the season.
This study has some limitations, including the small number of weeks analyzed. Future studies should include more weeks or even the entire season. Nevertheless, the present study provides some insights into the monitoring of training and suggests that gender differences exist Also, athletes’ wellness status could be considered in future studies to understand if it is more variable and, if so, in what field, as well as if it coincides more with the external or internal load.
Practical applications
The present study revealed that although internal TI measures had moderate associations with external TI measures, the monitoring of internal TI measures seems to be more useful for decision-making than the number of jumps. Still, these results suggest that the monitoring of both analyzed internal and external TI measures can help volleyball coaches to better adjust the weekly TI imposed on their athletes. That is, coaches must track the variability and the magnitude of internal TI across weeks and the variability of the number of recorded jumps during training sessions since these measures are related to each other. Moreover, given the higher percentage of variation of recorded jumps, these results suggest that coaches should also consider training individualization to increase or decrease the weekly jump activities according to each player’s needs.
Conclusion
This study showed a moderate relationship between weekly variations of ACWR, training monotony, training strain, s-RPE, and the number of jumps. Moreover, a moderate association between external and internal load measures were detected. Nevertheless, s-RPE seems to be a more sensible measure than the number of jumps, since its percentage of variation was higher.
Footnotes
Acknowledgements
This study was done as part of a master’s thesis in sports training, Escola Superior de Desporto e Lazer, Instituto Politécnico de Viana do Castelo, Portugal.
Authorship contributions
Conceptualization, RL and FMC; methodology, RL and FMC; formal analysis, BS; writing-original draft, RL, AR, AS, BS, JP, and FMC; writing-review and editing RL, AR, AS, BS, JP, RS, and FMC. All authors read and approved the final version of the manuscript.
Declaration of conflicting interests
The author(s) declared no potential conflicts of interest with respect to the research, authorship, and/or publication of this article.
Funding
The author(s) disclosed receipt of the following financial support for the research, authorship, and/or publication of this article. Filipe Manuel Clemente: This work is funded by Fundação para a Ciência e Tecnologia/Ministério da Ciência, Tecnologia e Ensino Superior through national funds and when applicable co-funded EU funds under the project UIDB/50008/2020.