
Abstract
This short communication considers the calculation of player speed from tracking data. Whereas there are many player tracking systems, all rely on the collection of Cartesian coordinates corresponding to the players on the pitch. From these Cartesian coordinates, there are many ways that one could approximate player speed and acceleration. We introduce some simple principles from exploratory data analysis, which help yield more reliable speed calculations. The general principles are illustrated on various player tracking systems.
Introduction
In the past decade, the advent of player tracking data has sparked a revolution in sports analytics. 1 With player tracking data, analysts have access to the Cartesian coordinates of each player on the pitch where the observations are recorded frequently (e.g. 10 times per second). The availability of such detailed data provides opportunities to investigate sporting questions that were previously unimaginable. Gudmundsson and Horton 2 provide a review paper on spatio-temporal analyses used in invasion sports where player tracking data are available.
Currently, player tracking systems are expensive, and consequently, tracking data are only collected in “big” sports such as basketball (the National Basketball Association), soccer (various leagues and competitions), football (the National Football League) and hockey (the National Hockey League). Tracking data are not only collected during matches but also during workout sessions where fitness, training and health considerations are main concerns.
Tracking data are typically proprietary and are supplied by service providers using various technologies.
3
There are four prominent technologies:
global positioning systems (GPS), local positioning systems (LPS), inertial measurement units (IMU) and optical tracking (OT) systems.
OT systems are fundamentally different as they do not require wearable devices and do not directly determine player coordinates. Instead, OT technology requires advanced camera systems and player recognition software to evaluate player coordinates. No matter which technology is utilized, tracking systems begin with the collection of the
In this paper, we are concerned with derivative calculations associated with tracking data coordinates. Specifically, we are interested in the approximation of player speed which is an important statistic in sports analytics and sports science. For example, Wu and Swartz 4 require player speeds in soccer to assess off-the-ball activity. They introduce a measure which addresses defensive anticipation. Buchheit et al. 5 use regression methodology to determine factors that are associated with player speed in soccer. For example, horizontal force and horizontal power were seen to be associated with speed. Oliva-Lozano et al. 6 characterize positional differences in soccer based on acceleration and sprint profiles. Related to speed, Shen et al. 7 analyze pace of play in soccer, and conclude that pace increases with decreasing team quality, which indicates the importance of playing with pace. From a training and performance perspective, Ferrari Bravo et al. 8 demonstrate that sprint-training significantly increases both aerobic and anaerobic performances in soccer. Naturally, different applications require different levels of accuracy. For example, in sports science, critical velocity is an active research field which relies on highly accurate measurements of speed. 9 Much has been written on the accuracy of various tracking data technologies. For example, Mara et al. 10 considered the displacement accuracy of an OT system, Tan et al. 11 investigated the validity and accuracy of a GPS system, and Pino-Ortega et al. 12 provided a review of the validity and reliability of LPS systems against other devices. Massard et al. 13 questioned the need for sprint testing based on the comparison of GPS match and field-testing data. However, all of these investigations rely on some measure of the truth against which tracking measurements are compared. What should experimenters do if they do not have access to the truth and they are unsure of the accuracy of speed calculations obtained from tracking data? This paper introduces some simple principles from exploratory data analysis that assist experimenters to obtain more reliable estimates of speed.
In Section “Data,” we describe the datasets upon which our methods are illustrated, and we describe how player speed is calculated from tracking data coordinates. In Section “Exploratory analyses,” some simple exploratory plots are introduced that help the analyst obtain more reliable speed calculations. We conclude with a short discussion in Section “Discussion.”
Data
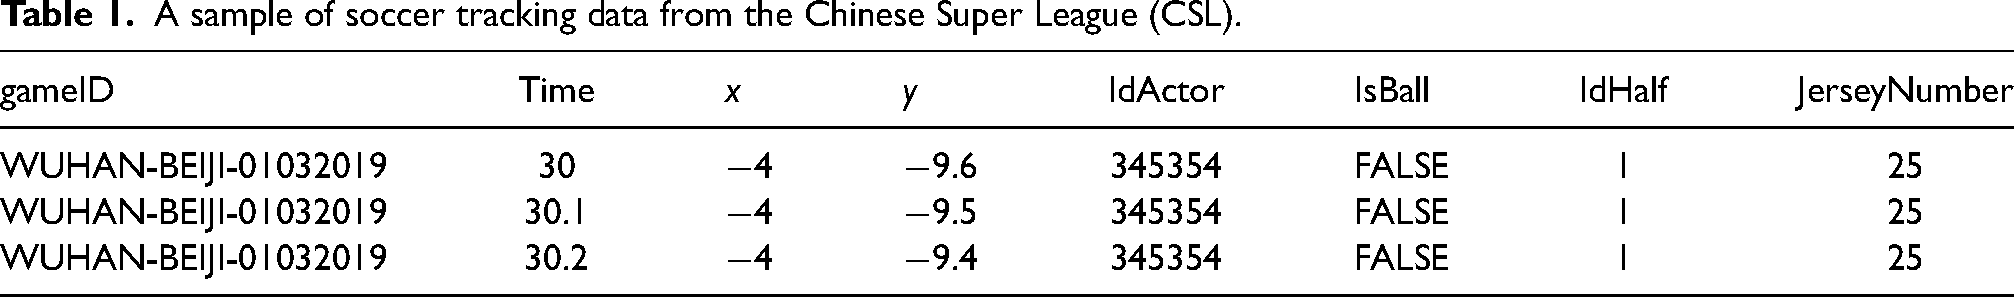
We have access to tracking data from matches during the 2019 season of the Chinese Super League (CSL). The CSL uses OT technology (previously discussed) provided by Stats Perform where observations were recorded 10 times per second. The tracking data consist of roughly one million rows per match measured on seven variables. Each row corresponds to a particular player at a given instant in time. The soccer tracking data were initially provided as xml files, and were processed in R for further analysis. In Table 1, we present three rows of the soccer tracking data. Here we observe
A sample of soccer tracking data from the Chinese Super League (CSL).
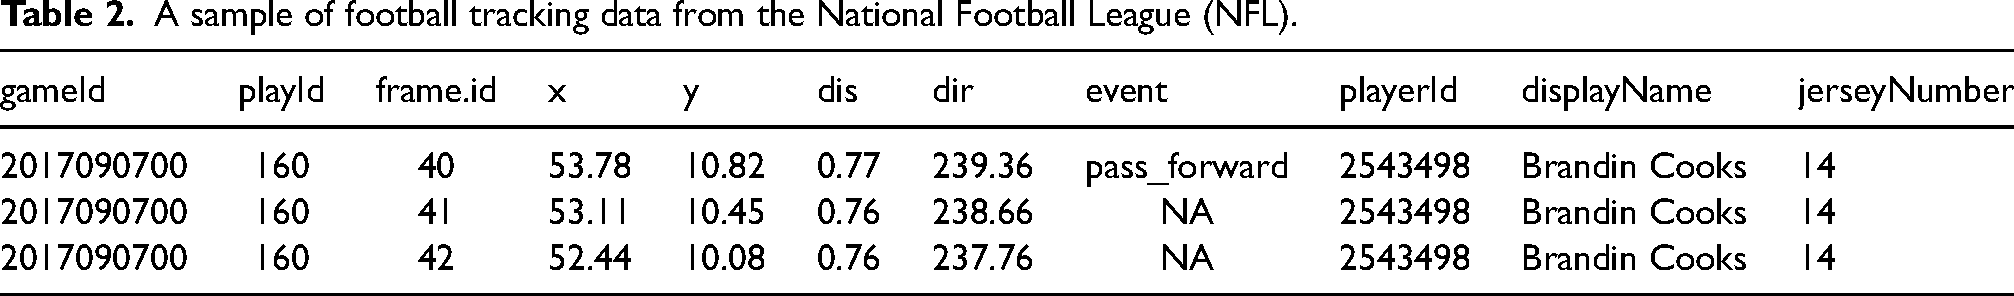
Our second dataset corresponds to tracking data from the National Football League (NFL). Unlike the OT soccer data, the NFL data were based on GPS technology, but were also collected using 10 Hz sampling frames. The data were used in the 2019 Big Data Bowl competition and are publicly available at https://github.com/nfl-football-ops/Big-Data-Bowl. Here we use data corresponding to a single deep pass play by the wide receiver Brandin Cooks of the New England Patriots taken from a 7-second interval during 7 September 2017 match against the Kansas City Chiefs. In Table 2, we present three rows of the football tracking data. Here we observe a similar structure to the tracking data in soccer. The football tracking data include the
A sample of football tracking data from the National Football League (NFL).
Speed calculations
We emphasize that the approach that we introduce is general and straightforward. It can be utilized using any tracking technology in any sport. However, knowledge of the sport dictates our interpretation of the exploratory plots.
Consider then a particular player where our interest concerns the calculation of their speed. If 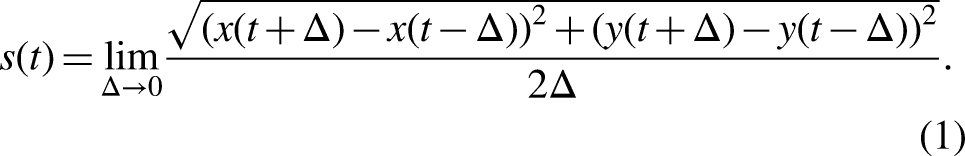
We have simplified the discussion by referring to speed. The approximation of velocity is also of interest where velocity has a directional component in addition to the scalar quantity speed. Note that acceleration calculations are also important, and are obtained as derivatives of speed.
Exploratory analyses
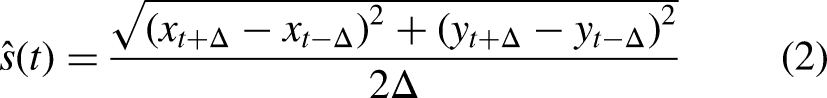
Whereas the estimand
To theoretically investigate the magnitude of error in speed via measurement error in the numerator of (2), we consider the true speed 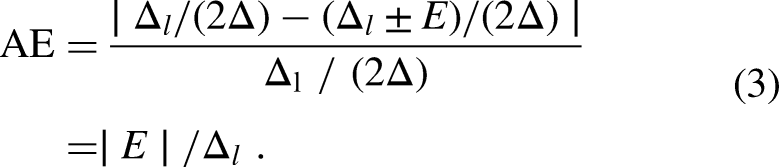
Soccer example
To begin our investigation, Figure 1 provides a plot of the locations of a player from the CSL dataset taken during a 29-second interval where he is known to be running fast during portions of the interval. When a player is running fast, it is physically impossible to make sharp turns, and therefore, the smoothness of the path suggests apparent accuracy in the location measurements.
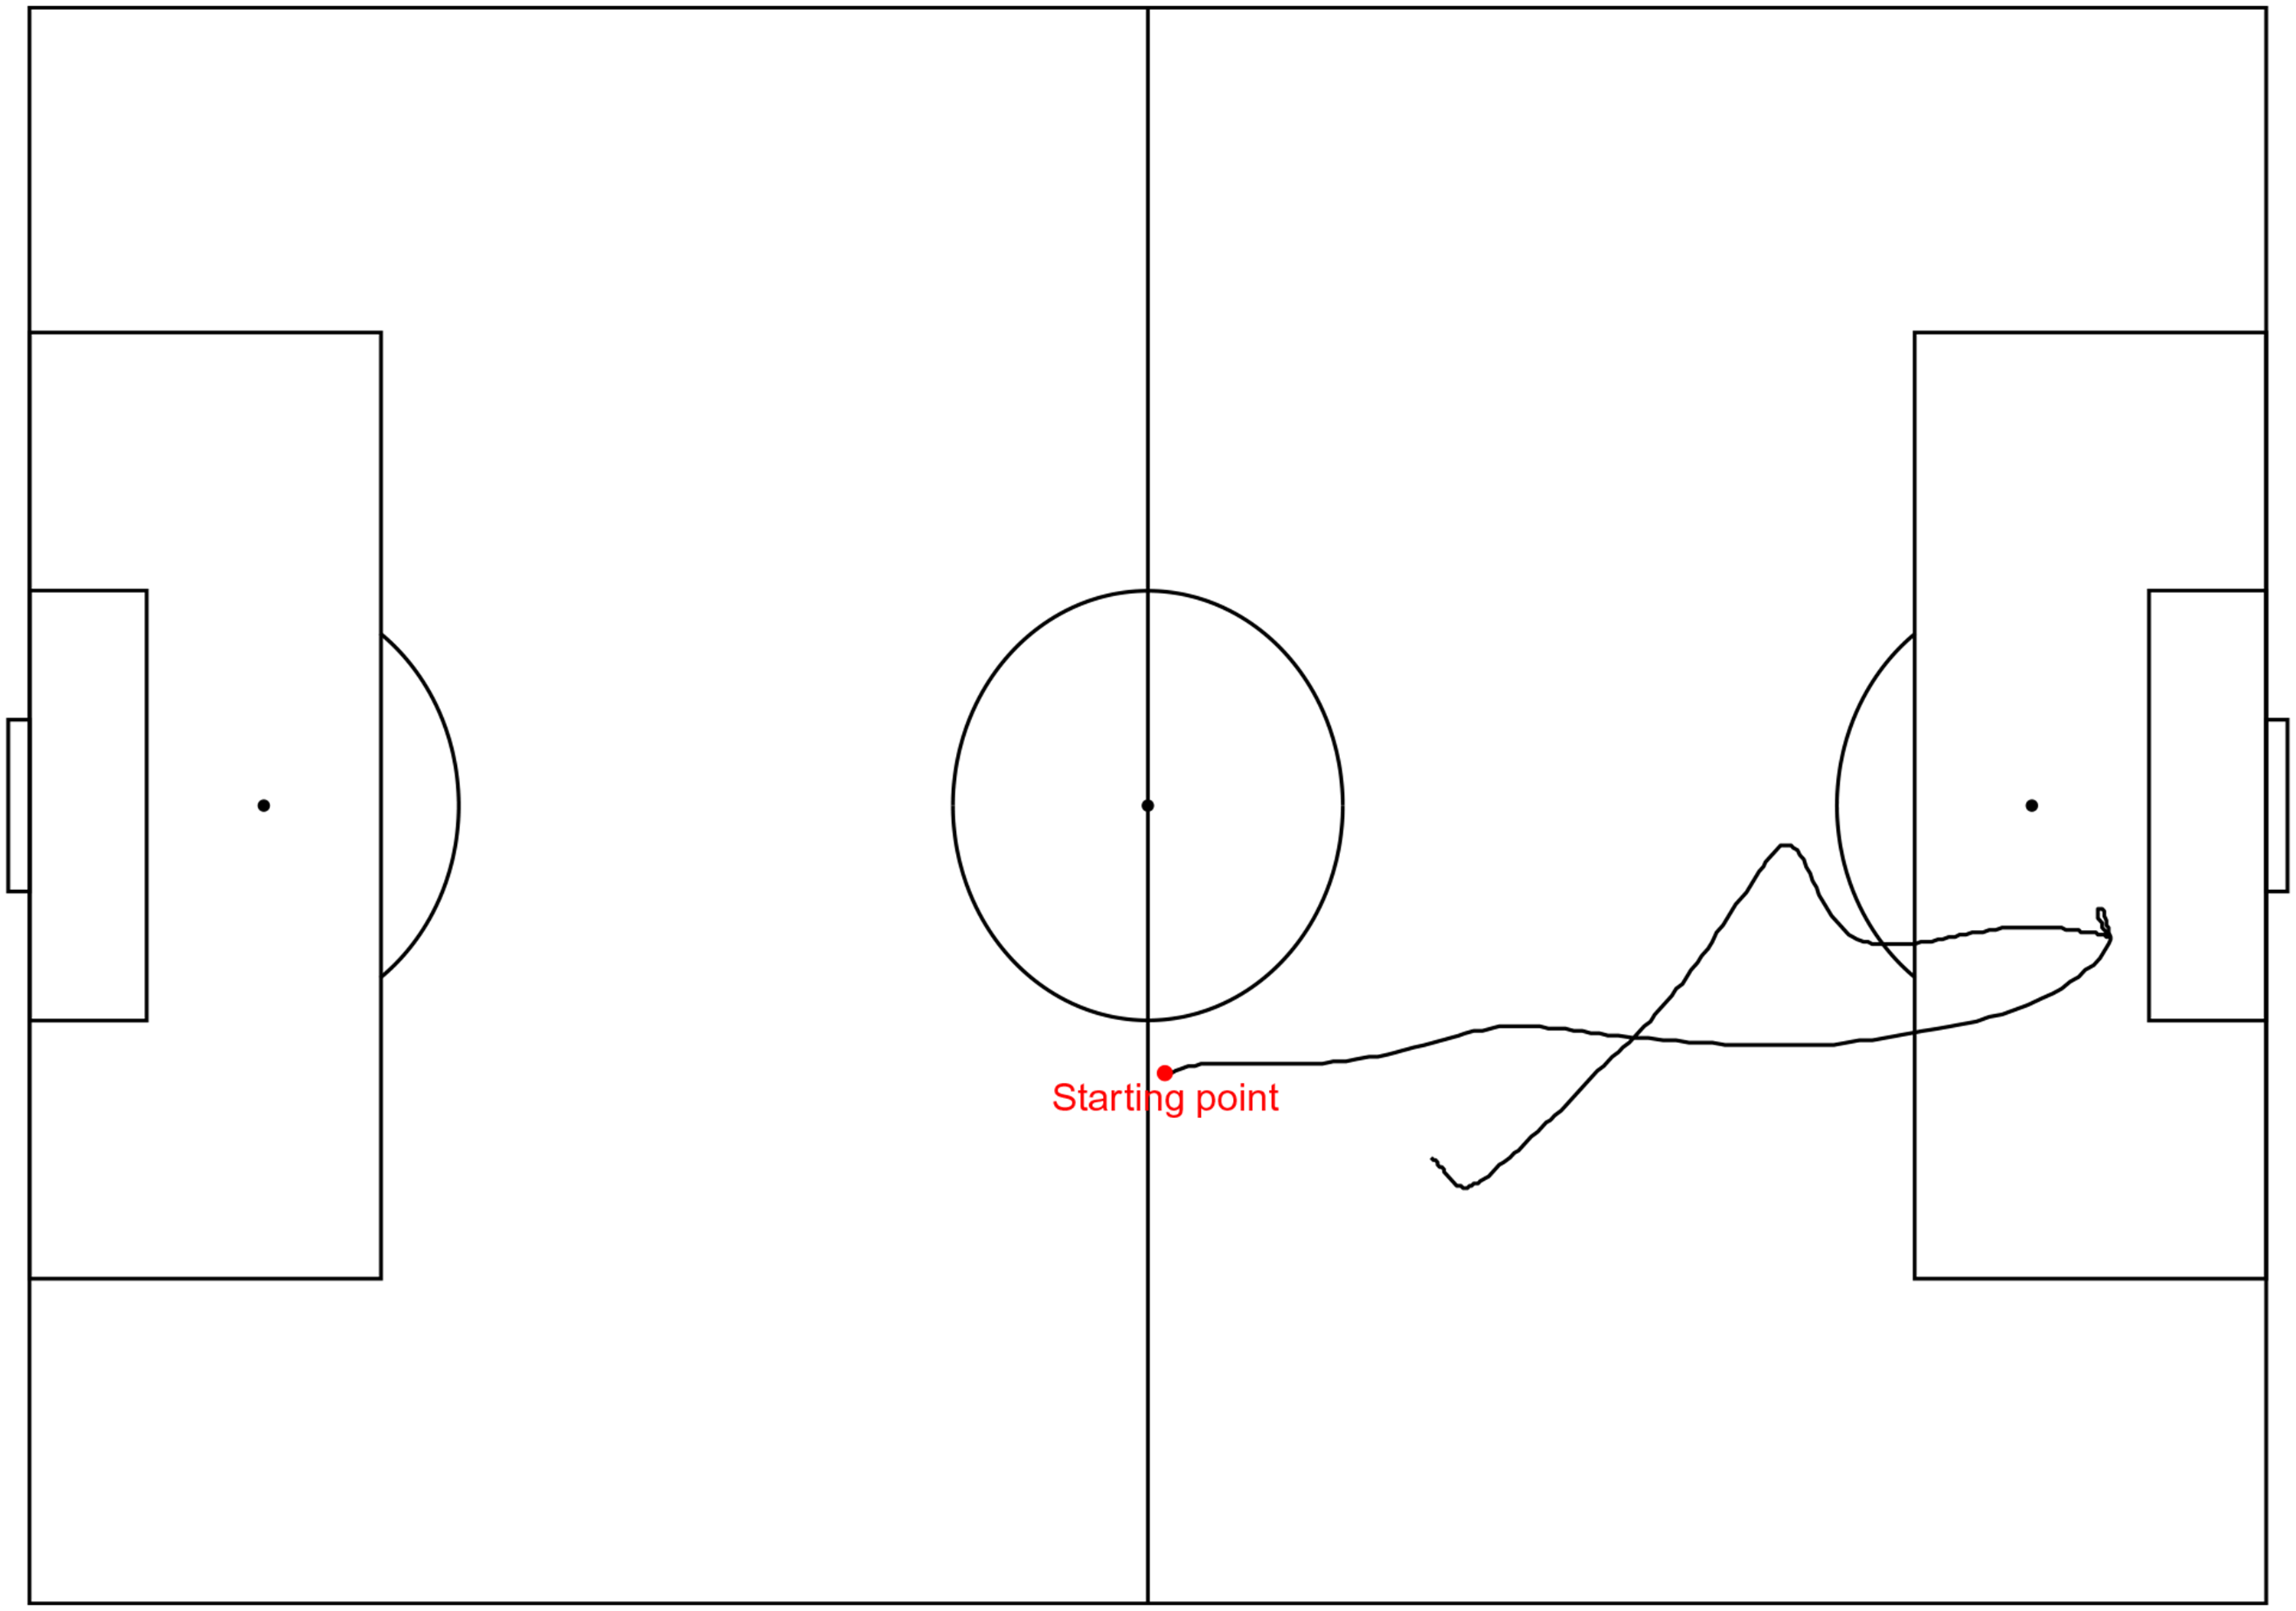
Path of a player over a 29-second interval based on location data recorded at 10 Hz.
However, when we take the path locations in Figure 1, and estimate speeds (2) using
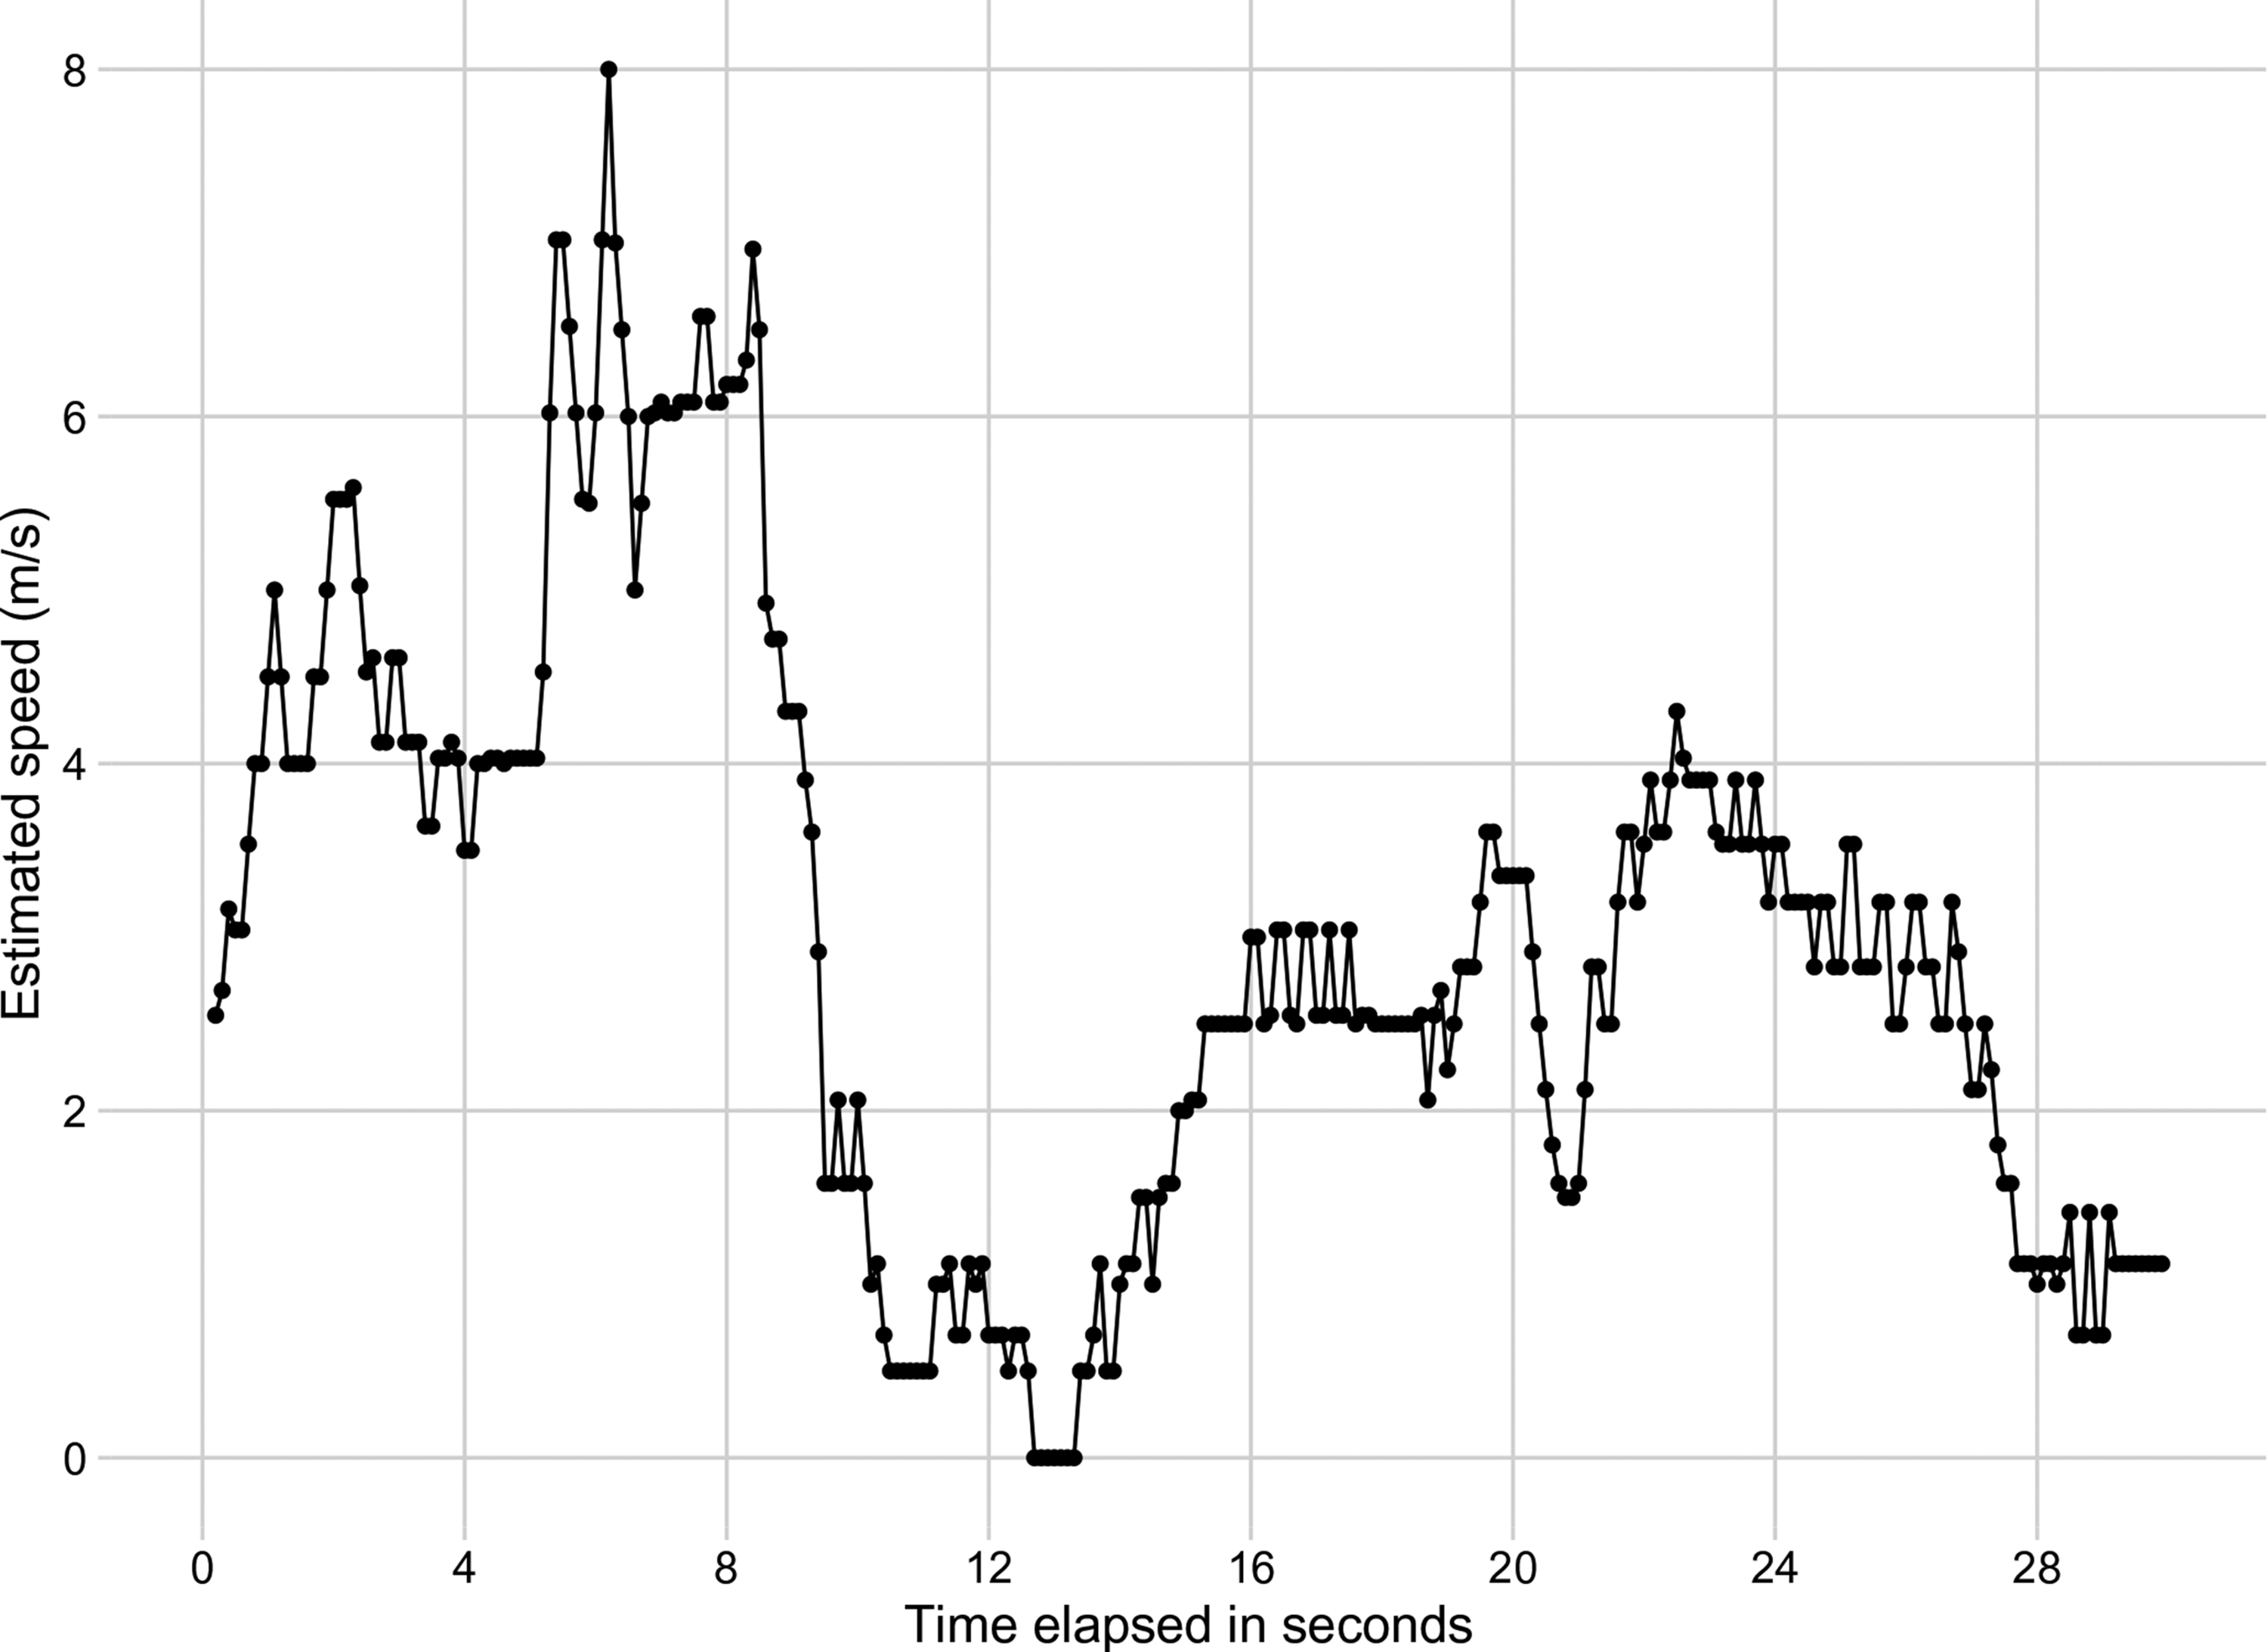
Estimated speed (
A remedy to the estimation of the instantaneous speed
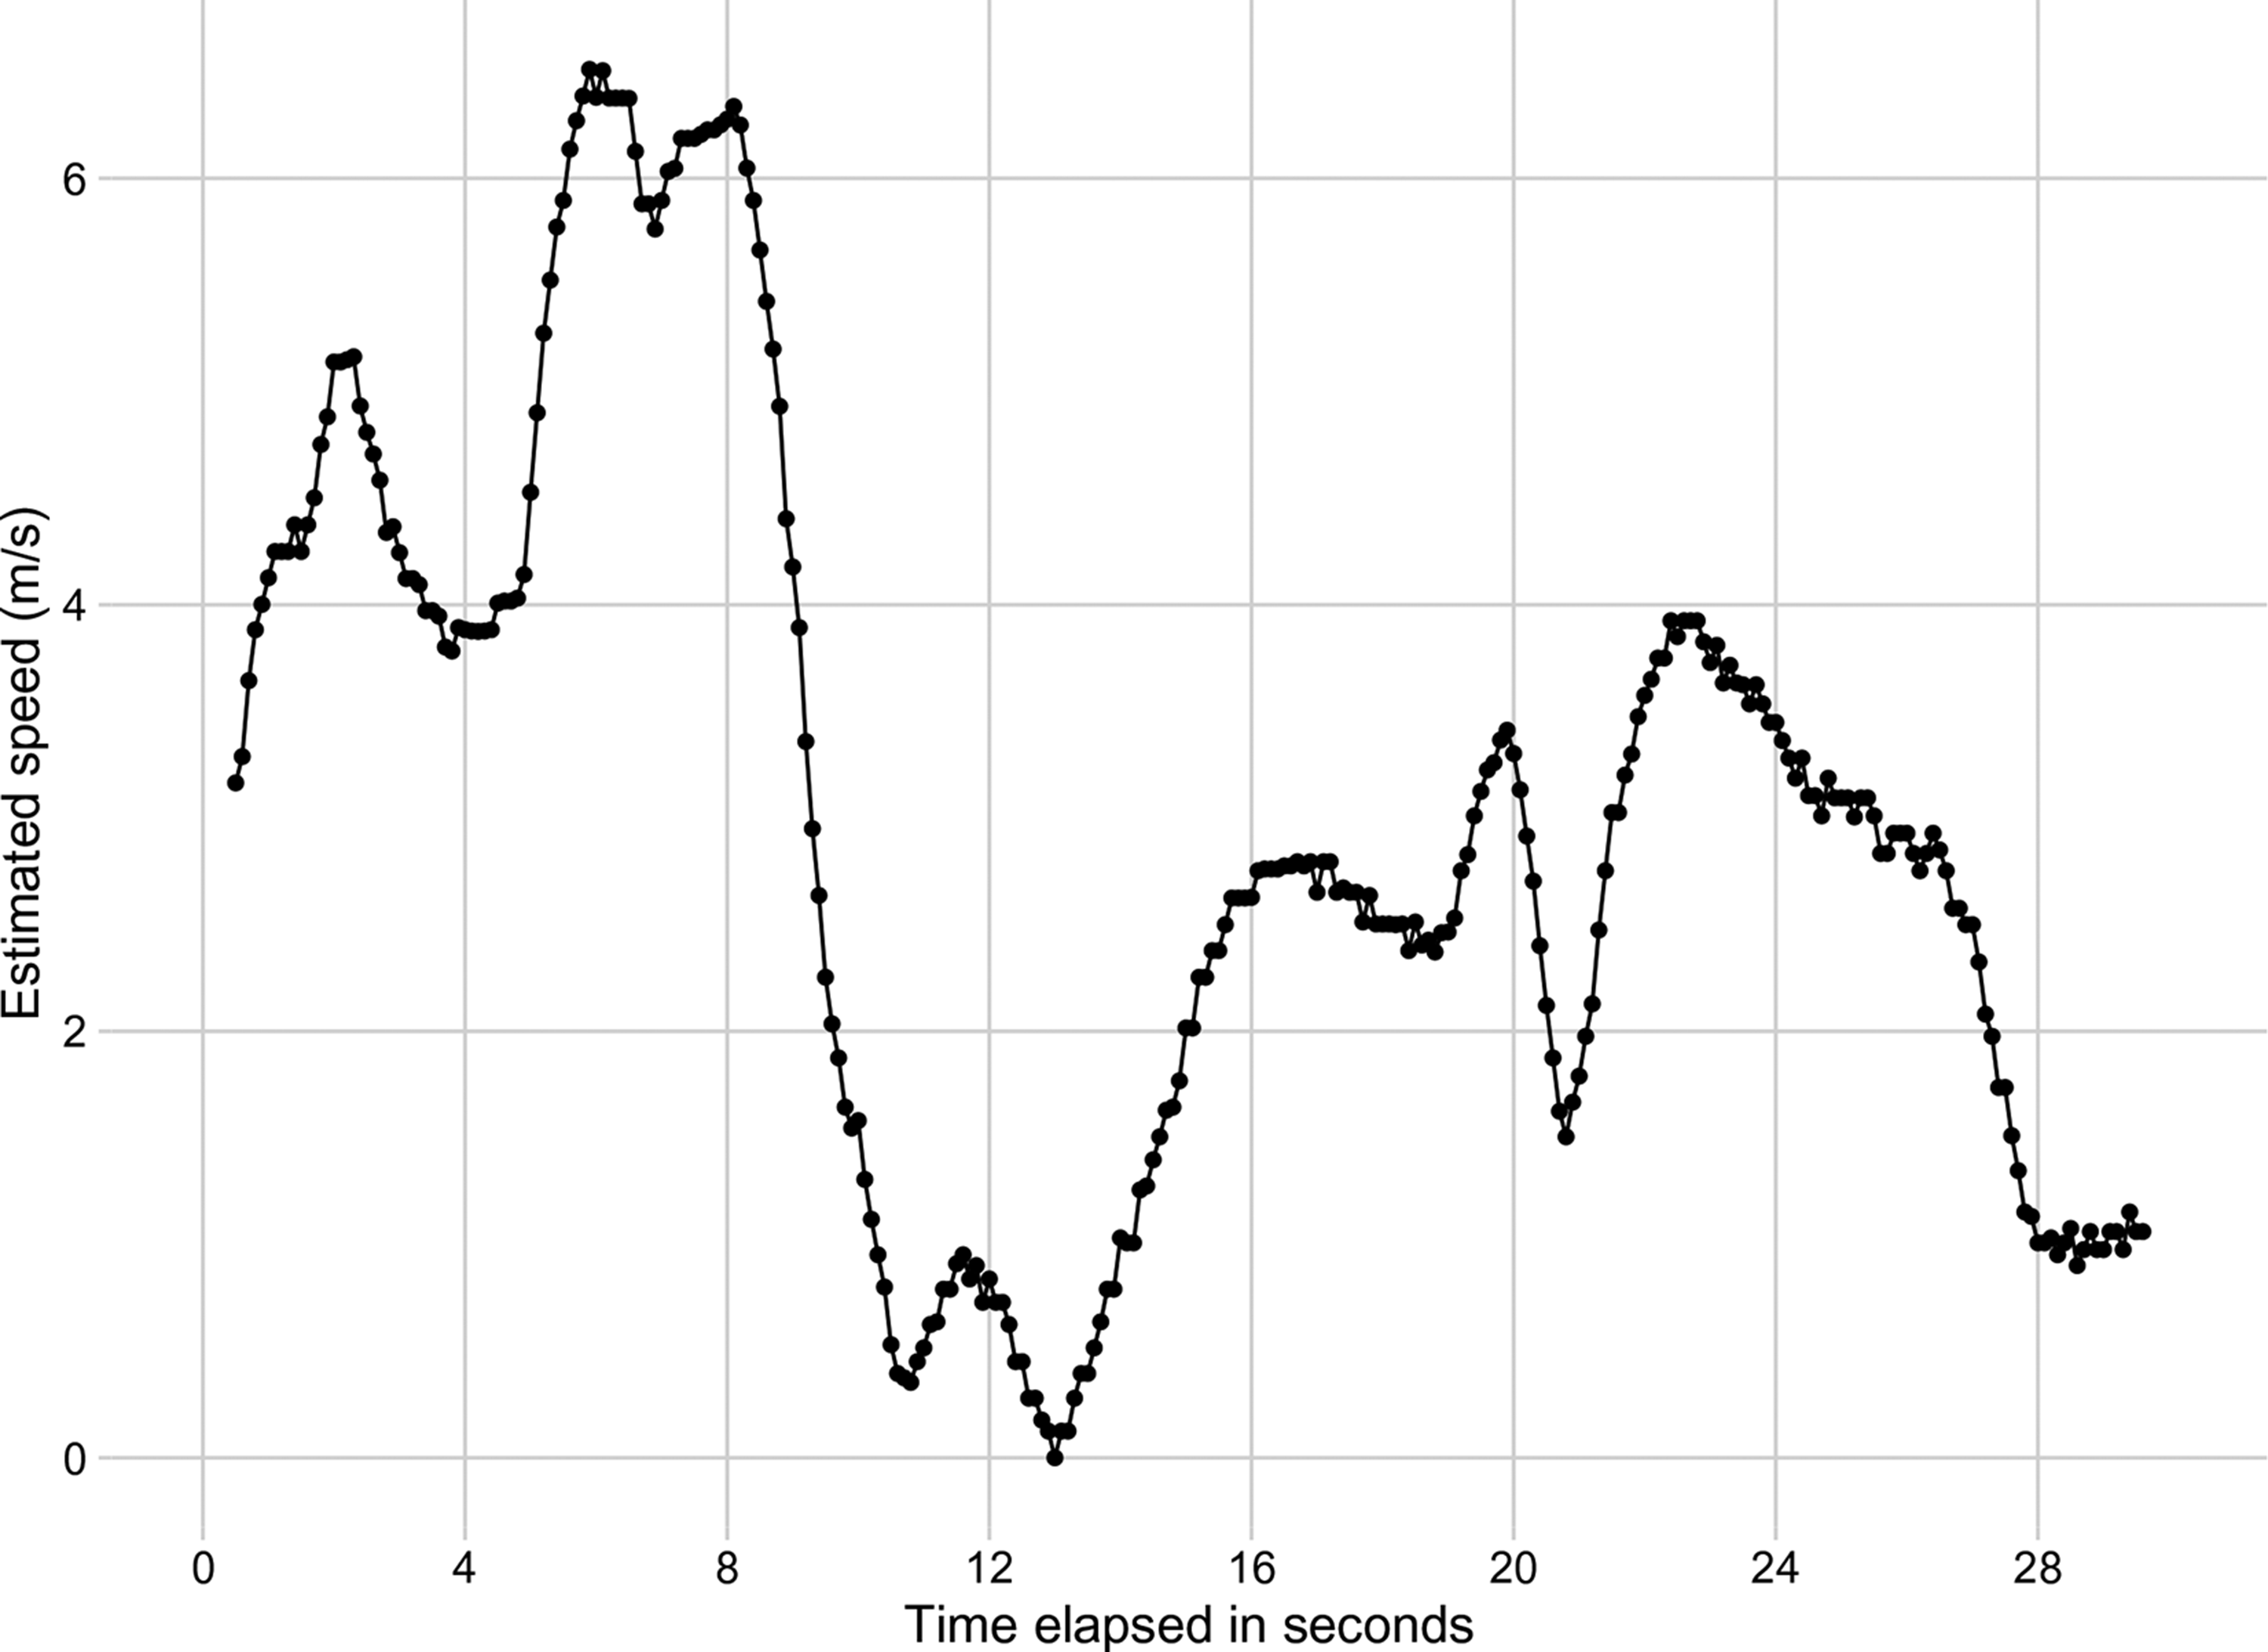
Estimated speed (
We refer back to the theoretical analysis of absolute error at the beginning of Section “Exploratory analyses.” In this example, we have seen that we prefer the time increment
Issues which arise in speed measurements are a consequence of the fact that speed is the derivative of position, and that position is not measured with sufficient accuracy. In applications where acceleration measurements are important, one can imagine even greater challenges since acceleration is the derivative of speed. This is illustrated in the following example.
NFL football example
In the second example, we first note that the running patterns of an NFL wide receiver differ from those of a soccer player. Typically, the wide receiver sprints over a short-time interval and does not make many changes of direction. This has implications for the estimation of speed.
In Figure 4, we provide the estimated speed and acceleration estimates for Brandin Cooks based on a 7-second pass route. The red-lined plots correspond to estimates based on
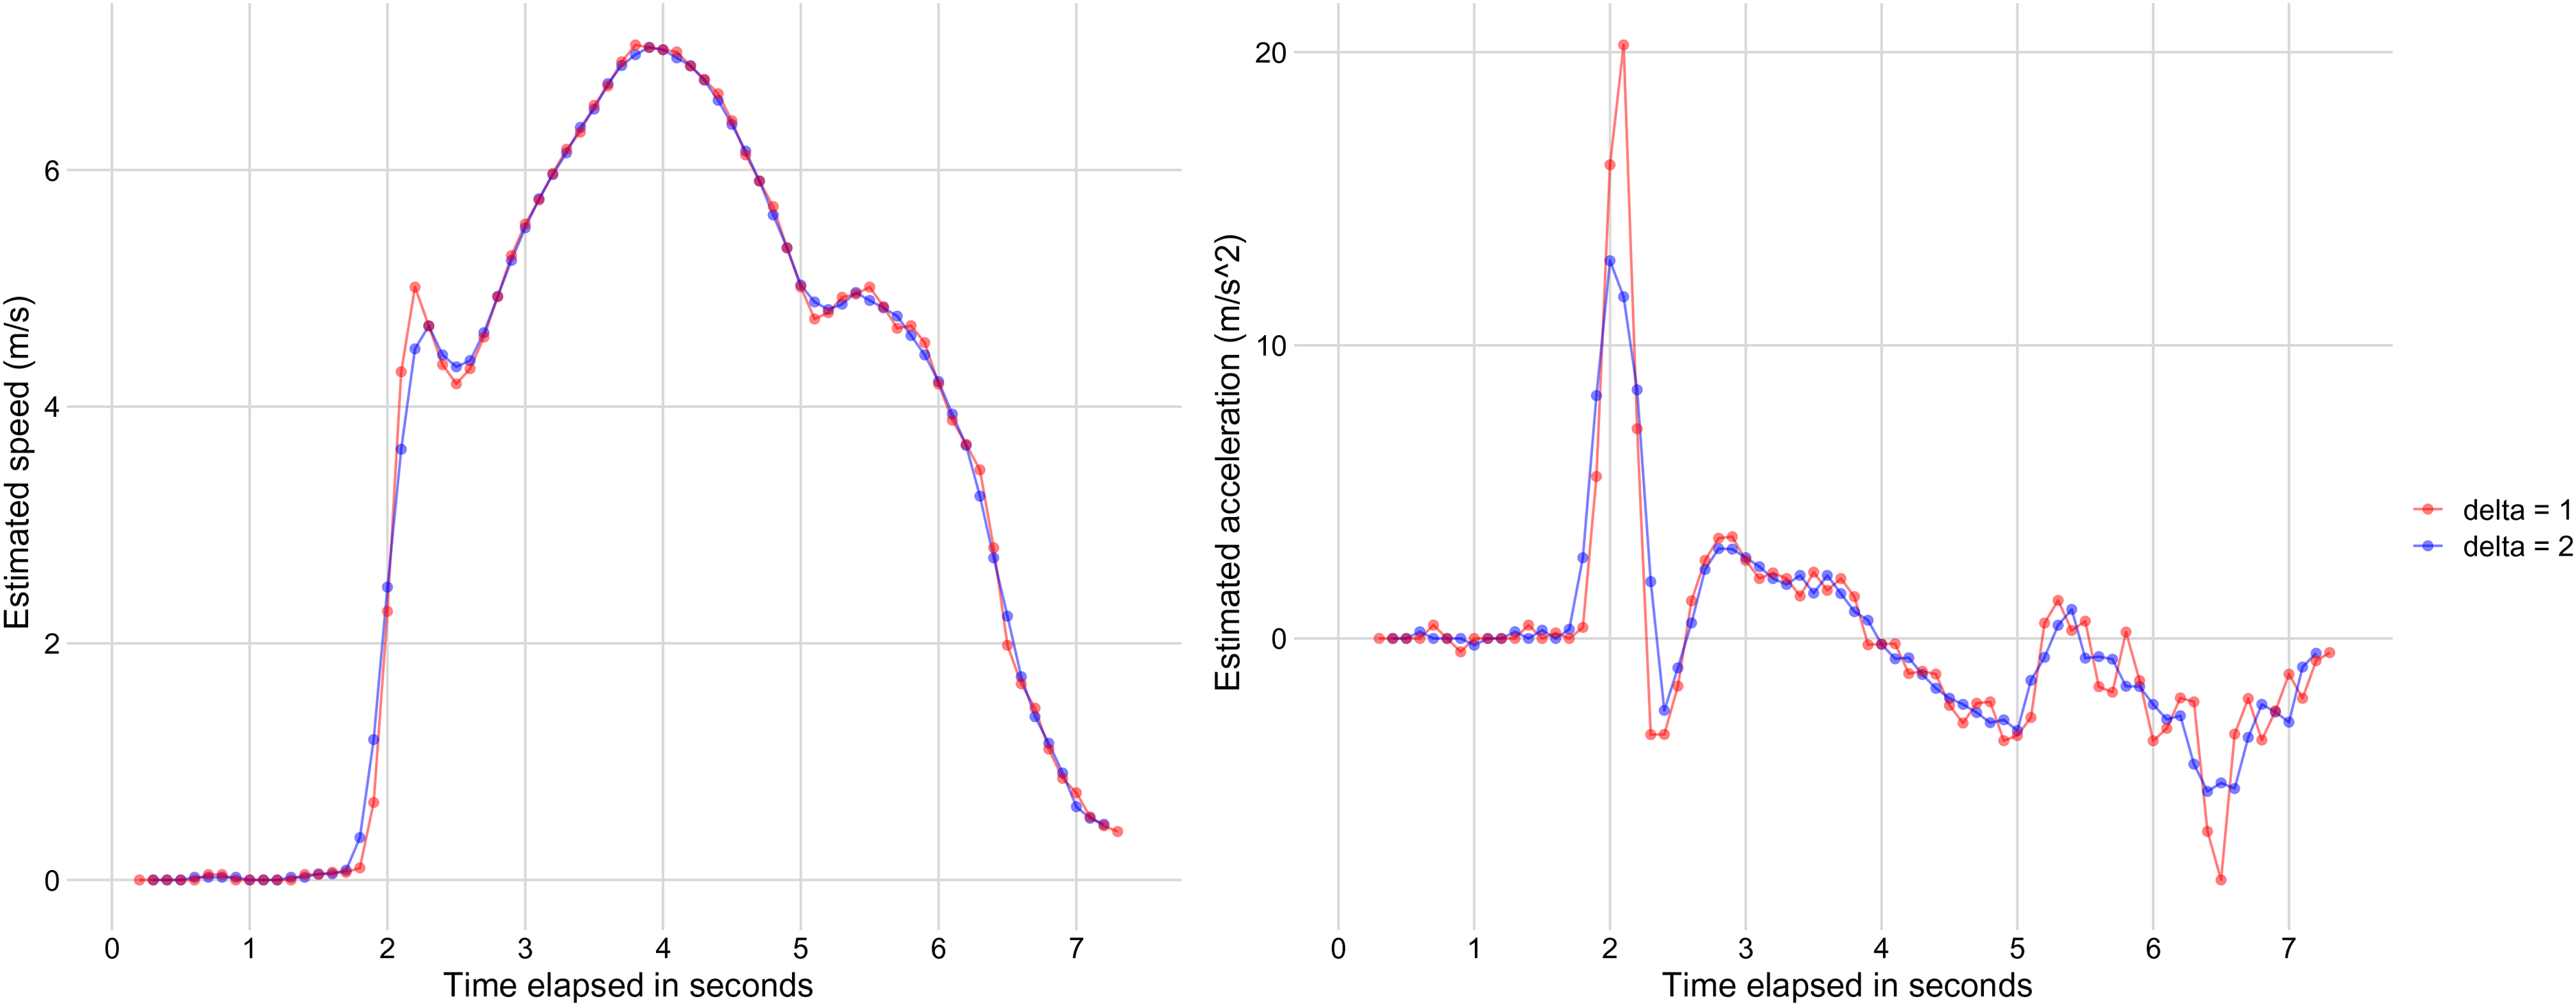
The red-lined plots correspond to speed and acceleration estimates (
When we look at the acceleration plots in Figure 4, it appears that
Discussion
Tracking data have provided opportunities to study problems in sports analytics, which were once unimaginable. However, sound tracking data analyses require data that are reliable, and the reliability of tracking data statistics often degrade with increasingly complex statistics. We have provided some simple principles from exploratory data analysis to help experimenters derive more reliable estimates of player speed. The same principles can be utilized in the calculation of velocities and accelerations.
The principles developed here are general and can be used with any type of player tracking system in any sport. The experimenter needs to consider the estimands of interest. The experimenter also requires domain knowledge of the sport to assess whether the resultant variations in the estimates are reasonable.
An avenue of future research may involve the implementation of statistical methods to smooth estimates of speed and acceleration. For example, one might consider the Hodrick-Prescott filter to smooth estimates of speed.
14
Instead of having experimenters manually estimate speed from
Footnotes
Acknowledgements
Swartz has been partially supported by the Natural Sciences and Engineering Research Council of Canada. Swartz is also a member of the Canadian Statistical Sciences Institute (CANSSI) Collaborative Research Team in Sports Analytics which has also partially supported the research. The authors thank Daniel Stenz, former Technical Director of Shandong Luneng Taishan FC who provided the data used in this paper. The authors also thank the reviewer László Csató whose helpful comments improved the paper.
Declaration of conflicting interests
The authors declared no potential conflicts of interest with respect to the research, authorship and/or publication of this article.
Funding
The authors received no financial support for the research, authorship, and/or publication of this article.