
Abstract
The optimization of cycling position is essential to improve performance and prevent overuse injuries. Bike-fitting methods, based on biomechanical variables, have been proposed in the scientific literature. To facilitate and generalize their use, the bike-fitting industry has developed various technologies to study and analyze the cycling position. The vast majority of bike-fitting protocols are based on joint kinematics, which can be evaluated in laboratory with two- or three-dimensional motion analysis systems. Joint kinematics can also be assessed in outdoor conditions with inertial measurement units, but currently, these tools provide a limited number of variables compared to laboratory systems. In addition, the bike-fitting professional can analyse pedalling technique with pedal forces to understand the effects of the bike adjustments on pedalling effectiveness. To complete the biomechanical evaluation, pressure mapping sensors allow for the measurement of the pressure load and distribution on the interfaces between the cyclist and the bicycle to detect imbalances and choose bike components (e.g., saddle). To go further in the analysis, muscular activity can be assessed with surface electromyography sensors to detect imbalances or asymmetry. The aim of this literature overview is to clearly define the role of these technologies in a bike-fitting protocol and identify their characteristics and limitations while proposing perspectives for future developments. Therefore, this work is intended for bike-fitting professionals and coaches wishing to choose the most suitable technologies to study and improve the cycling position, and for the bike-fitting industry, in order to optimize existing technologies and help develop new concepts.
Keywords
Introduction
Biomechanics is defined as the application of the laws of mechanics to the problems of biology, physiology and medicine. 1 In sports, this discipline focuses on human movement patterns to help people perform their chosen sporting activity better and to reduce the risk of injury. 2 This involves analyzing the movement (i.e., kinematics) and the forces that induce this movement (i.e., kinetics) in order to develop strategies of optimization. In cycling, bike-fitting is considered as one of the primary ways to optimize performance and comfort and to prevent pathology.3–6 The bike-fitting consists of adjusting foot–shoe–pedal interface (i.e., pedal type, cleat adjustment, horizontal distance between feet and crank arm length), pelvis–saddle interface (i.e., saddle type, saddle height and saddle setback) and hand–handlebar interface (i.e., handlebar model, handlebar length and handlebar height) considering the individual characteristics.5,7
Bike-fitting professionals, researchers and clinicians can rely on various technologies to optimize the cycling position and to determine the suitable components adapted to the individual. 7 The bike-fitting protocols generally rely on biomechanical variables, and particularly joint kinematics, using two-dimensional (2D) or three-dimensional (3D) motion capture systems. 8 During the last decade, inertial measurement units (IMUs) have been developed to carry out outdoor joint kinematic measurements. 9 In addition, force sensors are used to measure the magnitude and orientation of the forces applied to the pedals in two or three dimensions. 10 To assess pedalling technique in the field, cyclists now have access to instrumented pedals that measure tangential force, which corresponds to the effective part of the force that allows propulsion. These tools make it possible to evaluate the changes in pedalling effectiveness according to the bike configuration. 11 Kinematic and kinetic systems provide relevant variables for bike-fitting, but it is often difficult to explain saddle discomfort or foot instability. To understand what is happening at the different interfaces between the body and the bicycle, mapping sensors are available. The goal of these devices is to optimize the position and the choice of components in order to reduce high peak pressure that can cause discomfort. 12 Finally, surface electromyography (sEMG) sensors can be used to measure the activity of the muscles recruited during pedalling. 13 Analysing muscle activity is complex and is usually reserved for researchers, but wearable systems integrated into shorts have been developed for bike-fitting professionals and coaches in order to measure muscle activity while cycling. 14
Considering the large quantity and variety of systems and research tools developed by the bike-fitting industry, it seems complicated to choose the most suitable technologies to optimize the cyclists' position. The aim of this literature overview is therefore to present and compare the characteristics of various technologies related to cycling biomechanics to help bike-fitting professionals, coaches and researchers to select the most appropriate tool(s) to study and optimize the cycling position. The last part of the paper focuses on the prospects for the evolution of these technologies in order to improve bike-fitting protocols.
Kinematics
To optimize the transfer of forces to the pedals and prevent overuse injuries, the cyclist should be in a favourable configuration to produce the pedalling movement. 15 The variables related to the joint kinematics (e.g., joint angles) are measurable with motion capture systems and IMU. 16 These tools have evolved greatly in recent years to become accessible to bike-fitting specialists and are now essential for evaluating and optimizing the cycling position.7,15 Joint kinematics corresponds to the relative motion of two consecutive segments of the body during pedalling. For each body segment, the International Society of Biomechanics has proposed standards for joint coordinate systems in order to analyze human joint motion.17,18 Joint kinematics is influenced by several factors: bike configuration,19,20 cleat adjustment, 21 condition of measurement (i.e., static vs. dynamic), 22 pedalling technique, 23 fatigue rate 24 and workload. 25 Therefore, it is now advisable to carry out joint kinematic measurements with motion capture systems during pedalling at intensities close to those experienced during training and racing. 25 In this context, various technologies have been developed to carry out indoor or outdoor kinematic measurements. These systems allow for the analysis of the lower and upper limb joint angles throughout the pedal stroke in two or three dimensions, and to relate them to standards recommended in the literature19,20 or by bike-fitting companies. 26 In addition to joint angles, some motion capture systems offer a large number of movement-related variables, such as the angular velocity and acceleration of the joints, which provide information on the fluidity of the gesture. Lower limb joint velocity influenced muscle shortening velocity 27 and is particularly affected by the saddle height which is related to the joint stress, 28 but these variables are currently little used by specialists.
Laboratory motion capture systems
To measure joint kinematics, reflective markers are positioned on the different joint centres and are followed by cameras throughout the pedalling exercise to determine joint angles during flexion and extension and to calculate the range of motion. In the laboratory, motion analysis can be performed in 2D with a camera positioned in the sagittal plane and eventually in the frontal plane (e.g., Cycling 2DMA, Stt Systems, San Sebastian, Spain; Gebiomized, Münster, Germany). In recent years, bike-fitting companies have proposed 3D motion capture systems composed of multiple cameras positioned around the rider (e.g., Cycling 3DMA, Stt Systems; Qualisys, Göteborg, Sweden) or of 3D single side bar(s) placed in the sagittal plane (e.g., Retül, Boulder, Colorado, USA; Bioracer Motion, Tessenderlo, Belgium; 3D motion analyzer, Shimano Bikefitting, Valkenburg, Netherlands). Companies can rely on retroreflective passive markers or on active infrared emitting markers. Active markers have the advantage of not being influenced by reflections from other light sources and are easier to use. 29
The analysis of pedalling patterns is generally limited to eight markers positioned on the sagittal side of the cyclist because the range of joint motion is much greater than in the frontal and transverse planes and the movement of flexion/extension actively participates in propulsion. 30 Free software, considered scientifically valid, 31 is available to assess 2D joint kinematics (Kinovea version 0.8.24, Kinovea open-source project, www.kinovea.org). However, the resolution of the camera should be sufficient to accurately identify the markers while pedalling analysis (at least 1080p, but a resolution of 2.7 K or 4 K is recommended). Moreover, the shutter speed should be high to avoid motion blur caused by the rapid pedalling movement. This factor can be adjusted according to the pedalling frequency of the individual. 32 Finally, the light must be sufficient to allow great illumination of the cyclist 32 Millour et al. point out that lower limb discrepancy, which affects some cyclists, can cause an asymmetry between joint angles of both lower limbs. 33 In this case, it appears mandatory to assess joint kinematics of each side of the body. The authors agree that the 2D analysis is reliable for measuring joint angles in the sagittal plane. 8 However, two studies observed a knee angle lower by 2°–3° in 2D compared to the knee angle measured in 3D.8,30
Gregersen and Hull have shown the importance of evaluating knee movement in the transverse and frontal planes because these non-driving motions take an important part of the intersegmental knee moments and may be responsible for pathologies. 34 Kinematics in the frontal plane can detect abnormal knee motions that can lead to overuse injuries. 35 To do that, the use of 3D motion capture systems is more suitable. The 3D single side bars can be positioned on one side or on either side of the cyclist and require the same number of markers than 2D motion capture systems. Among these systems, the Shimano 3D motion analyzer and the Retül system are considered scientifically valid to assess 3D joint kinematics during cycling, compared to a gold standard motion capture system (Vicon Motion Systems Ltd Oxford, UK).36,37 However, Bouillod et al. advise favouring an opto-electronic system based on several cameras positioned around the cyclists for research purposes. 36 The complete 3D motion capture protocols require an important number of markers positioned on specific anatomical points (Figure 1). They are notably placed on both sides of the body and on the spine to improve the accuracy of the analysis and detect imbalances or asymmetries. However, the preparation before the bike-fitting is lengthened and the expert must have a thorough knowledge of anatomy in order to position the markers correctly.
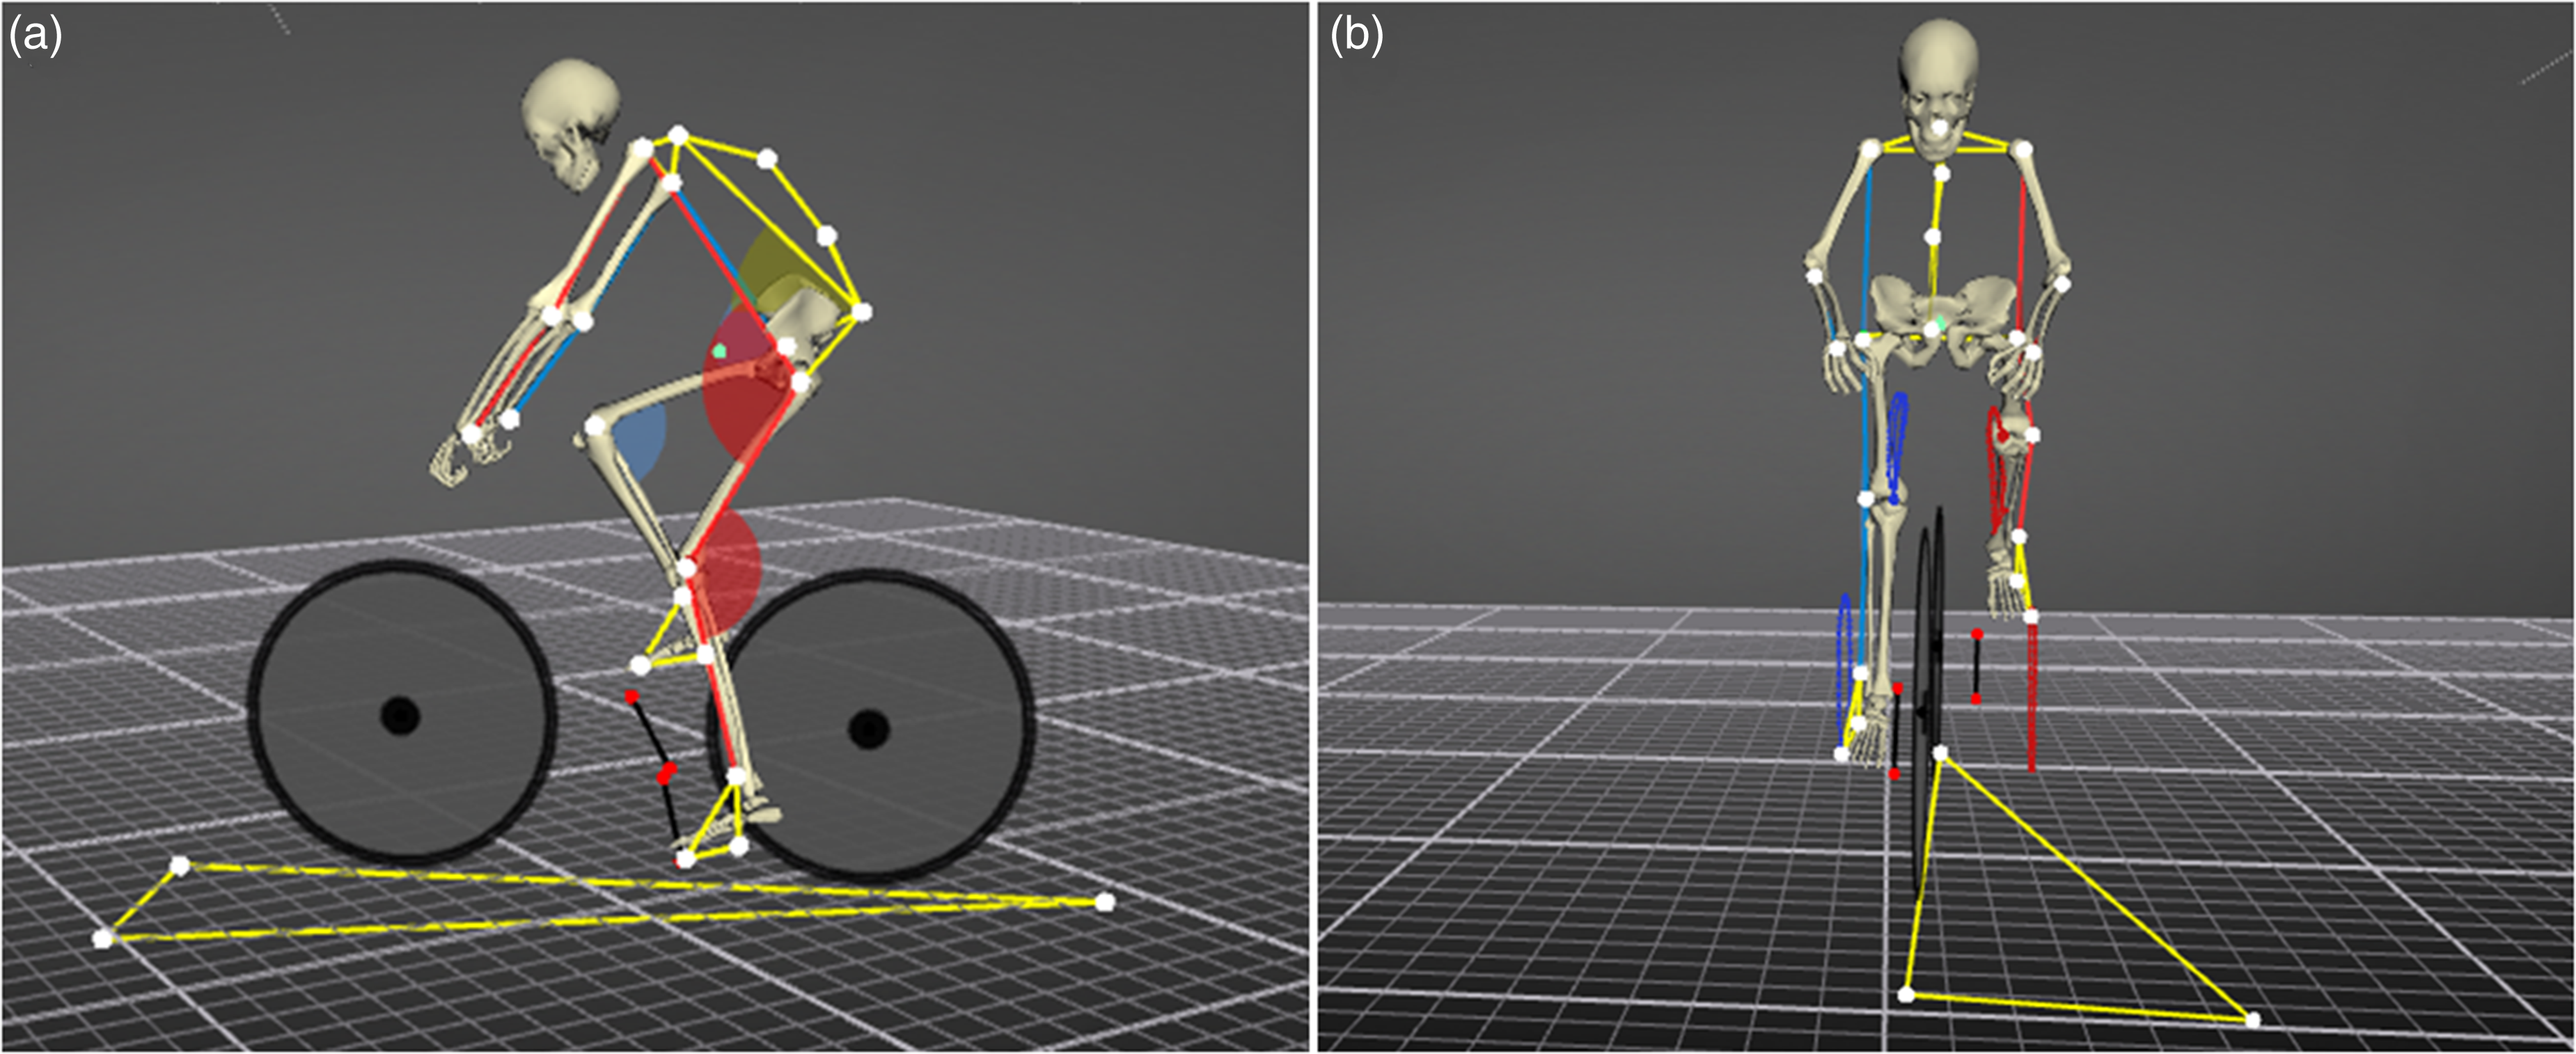
Full-body protocol of the STT system in the sagittal (a) and frontal (b) planes (images displayed in the STT software).
It is also important to consider the sampling rate for data acquisition, which can vary between 18 and 360 Hz depending on the company. For example, the frame rate of the Bioracer system is considerably greater than that of the Retül system (120 Hz vs. 18 Hz), which can induce changes in joint angle measures during the analysis. Indeed, for a cyclist pedalling at 90 rpm, the Retül and the Bioracer systems provide approximately one frame per 31° and one frame per 5° of the pedalling cycle, respectively, which could cause differences in the knee angle measurement during lower limb extension, and therefore, variations in saddle height adjustment if short periods of time are used for captures. This may partly explain the variations of bike adjustment during a bike-fitting carried out with experts using these technologies. 38
However, all these different devices are restricted to the laboratory where all the variables can be controlled, which is a limitation when considering the potential position adaptations that occur in real condition of practice due to the wind and the slope of the road, notably.
Inertial measurement units
To analyze the motion in ecological environments, researchers can use micro-electro-mechanical systems, and notably IMUs. Due to their small size, low mass and ease of connection with mobile devices, among other advantages, they are usually referred to as wearable, allowing them to be used in outdoor environments. Unlike motion capture systems, they do not require landmarks to be positioned on the joint axes. These systems internally integrate an accelerometer, a gyroscope, and sometimes a magnetometer, and provide linear and angular motion measurements of individual segments. 39
The STT Systems, Delsys (Delsys Inc., Boston, USA), Shimmer Sensing (Shimmer Research Ltd, Dublin, Ireland) and Vicon companies, among others, offer IMU systems that can be configured with the desired number of sensors and implemented in cycling research. In addition, some companies present applications for cycling that can be used with smartphones or tablets (Leomo Inc., Boulder, USA; Wiva, Castel Maggiore, Italy) (Figure 2). The companies that are specialized in bike-fitting benefit from providing protocols to assess cycling motion and pedalling technique. They generally recommend placing sensors on the lower back, on the lower limbs and on the feet to evaluate pelvis rotation and range of motion of the thighs and feet in the sagittal plane. 40 A study demonstrated through the use of IMU that reducing pelvis rotation in the medio-lateral axis was associated with a decreased rate of perceived exertion during road tests. 41 Moreover, cyclists who produce greater power at lactate thresholds present less leg and foot range of motions in the sagittal plane. 40 Future studies should confirm a link between these variables and performance. The Leomo company also recommends positioning a sensor on the torso to assess torso angle, rock and rotation. Torso angle is commonly assessed in time trial due to its significant influence on aerodynamic drag. 42 Moreover, this company has developed indicators, the Dead Spot Scores and the leg smoothness, to evaluate pedalling technique. These metrics measures foot and leg angular velocity during pedalling in order to detect deviation from a smooth angular velocity sine curve. However, no study has assessed the relationship of these metrics with pedalling kinetic variables (e.g., index of force effectiveness [IE] or positive impulse proportion [PIP]) and they seem little related to performance. 40 In addition, further analysis should compare the metrics obtained with these IMUs with optoelectronic motion capture systems.
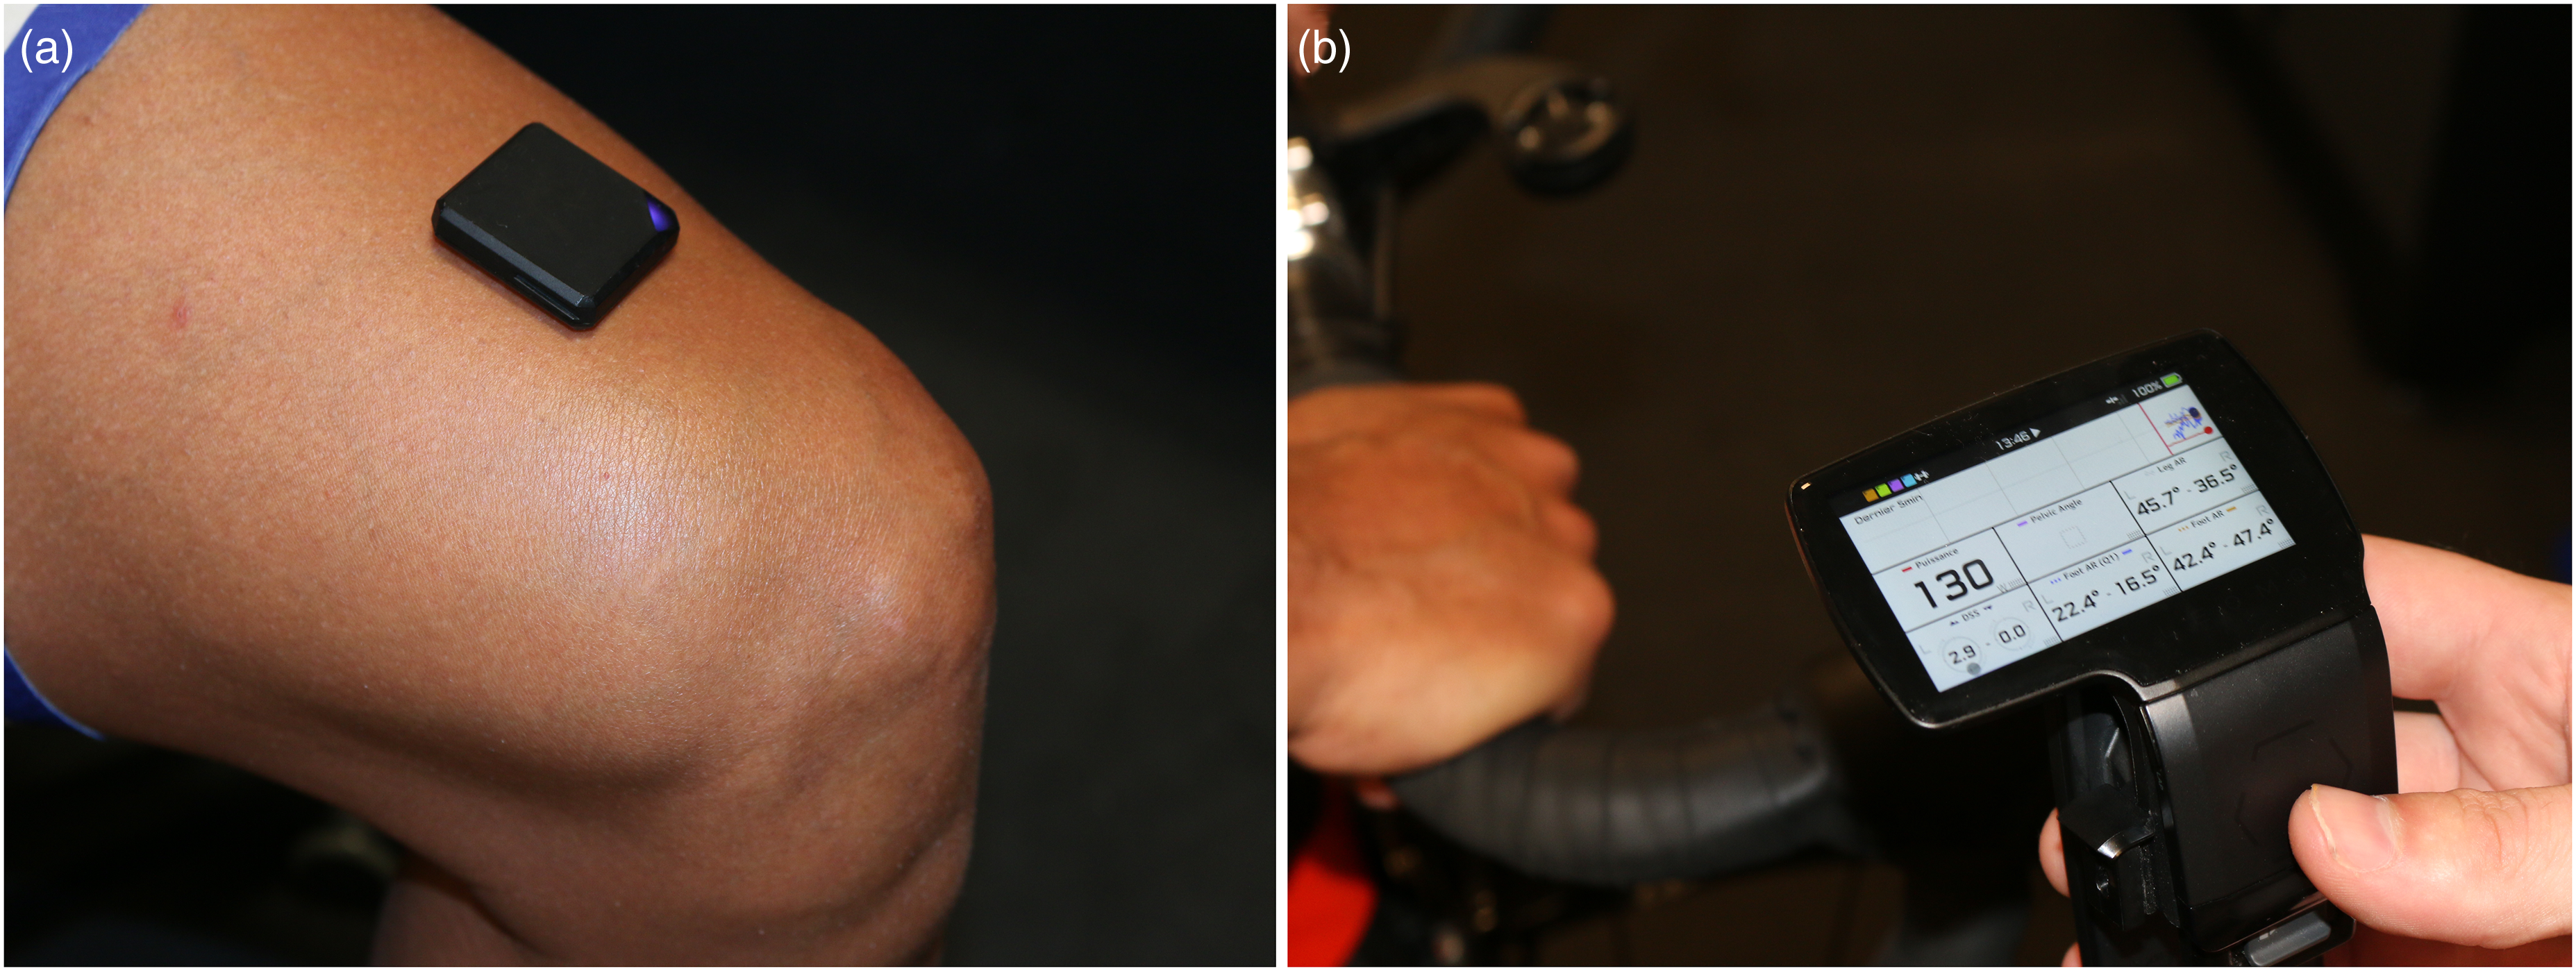
Leomo inertial measurement unit (IMU) sensor positioned on the cyclist thigh (a) and TYPE-S main unit (b) to capture and analyze data in real time.
Picerno notes that care should be taken regarding ferromagnetic disturbances, sensor-to-segment alignment and proprietary sensor fusion algorithms’ accuracy when estimating the orientation of the 3D sensors, which make it difficult to accurately measure joint angles between two sensors. 43 Therefore, the systems available on the market are currently limited to angle or angular velocity variations of a sensor during pedalling or certain parts of the pedal stroke. The IMUs can be used for position optimization in the field after performing laboratory bike-fitting. For example, the pelvis stability, torso angle and head movements, which are critical in reducing aerodynamic drag, can be assessed throughout training or competition in order to consider the effect of fatigue and environment on these variables.42,44,45 Nonetheless, recent research seems promising to measure joint angles (angle between two independent sensors) and, therefore, to be able to perform complete in situ bike-fitting.9,46 Cordillet et al. have presented an application of these sensors in a competitive cycling environment to determine the difference of segment orientation and joint angular kinematics between the left and right lower limbs. 9
Kinetics
The motion capture only provides information about the movement pattern, not the forces resulting from this movement. For that, instrumented pedals are used to assess the cyclist's pedalling technique in order to provide objective metrics to adjust the bike-fitting intervention. Indeed, it has been demonstrated that saddle height 47 and saddle setback 48 influence pedalling effectiveness.
For a given pedalling cadence, the power output depends on the magnitude and orientation of the force applied on the pedals. The power output is the product between the angular velocity of the crank (rad·sec−1) and the crank torque (N·m).
49
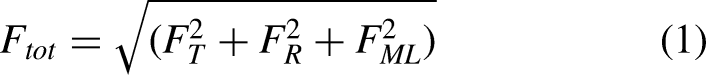
The crank torque relies on the tangential force (N), applied by the cyclist to the pedals perpendicular to the crank, and to the crank length (m), which corresponds to the lever arm. However, a part of the total force (N) is ineffective because it does not contribute to the production of crank torque. Thus, in a three-dimensional representation of the force applied to the pedals, the total force (Ftot) has a tangential component (FT), which is effective, a radial component (FR) and a medio-lateral component (FML), which are both ineffective (Eq. 1; Figure 3).
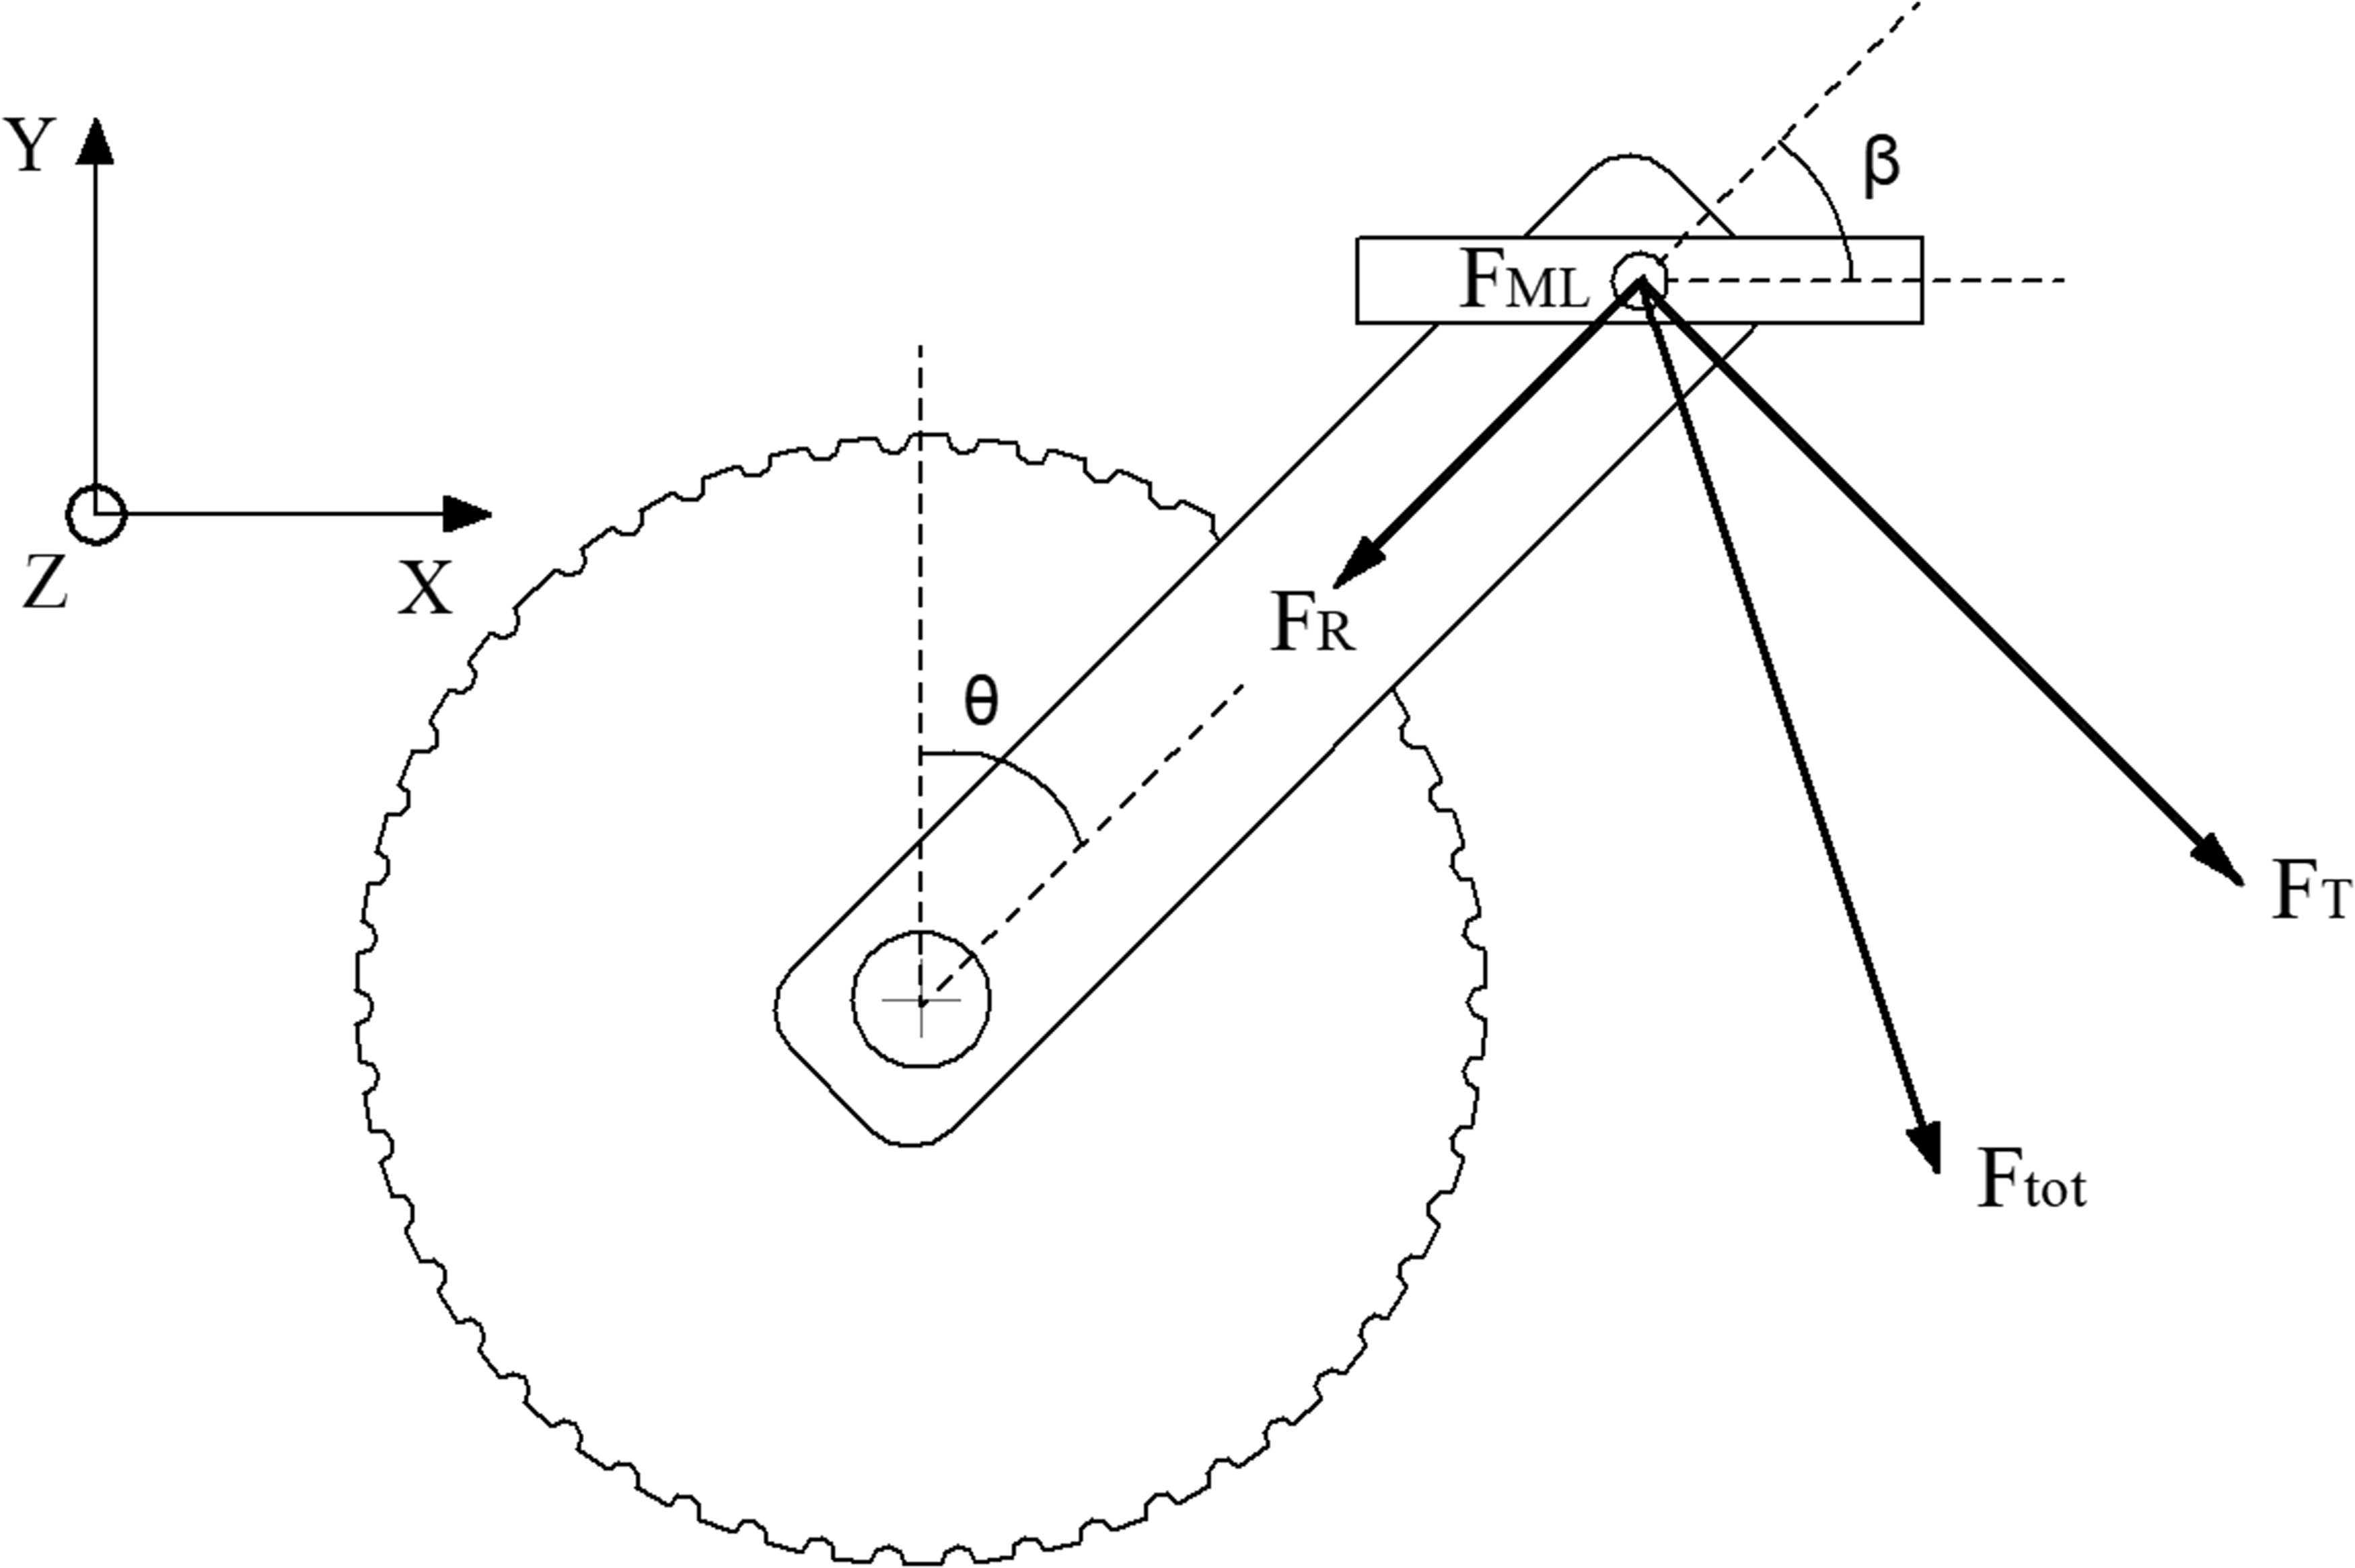
Representation of the various forces applied on the right pedal: total force (Ftot), tangential force (FT), radial force (FR) and medio-lateral force (FML). θ is the angle (degree) between the crank and a line connecting the bottom bracket axle and the top dead centre. β is the angle (degree) between the pedal and the crank.
The force applied to the pedal and its components cited above can be evaluated using dynamometric pedals or instrumented cranks, composed of strain gauges or piezoelectric transducers. Although piezoelectric sensors exhibit higher sensitivity, strain gauges are more frequently used due to lower cost and easier data processing.
10
Two-dimensional (Powerforce) or three-dimensional (JA:Ped3; I-crank system, Sensix, Poitiers, France; Forped, Cycling Science, d.o.o., Ljubljana, Slovenia) dynamometric pedals have been used in the literature to measure pedal forces.50–54 Authors have shown that the I-crank system provides accurate measurements of crank torque, power output and mechanical work output.
53
However, Bini and Hume have observed that this system is reliable to measure power output and IE within a given session, but variability in data increased between two sessions, probably due to the repositioning of the motion tracking sensors.
54
In addition, instrumented bicycle crank systems, which can be used for laboratory and field tests (Axis Cranks, Swift Performance, Australia), allow accurate measurements of 2D pedal forces on both the left and right crank arms independently.
55
As mentioned previously, these systems are often used in scientific studies to measure IE (Eq. 2) through the following equation:
Other systems allow for the measurement of the effective part of the force applied on the pedals. It is the case of valid ergometers (wattbike, Wattbike Ltd, Nottingham, United Kingdom) or SRM crank dynamometer (Ptnews Torque Analysis Software, SRM Science, Welldorf, Germany). However, the SRM torque analysis, which measures the crank torque without distinguishing the left and right force application, provides lower results of peak torque for both cranks and delayed crank angle of the peak torque compared to 2D dynamometric pedals.
56
This system would not be suitable to measure angular velocity and mechanical work output.
53
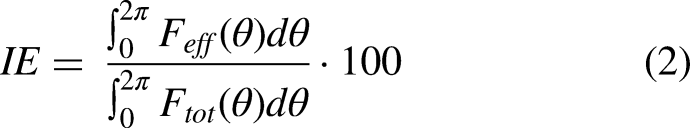
In recent years, instrumented pedals (Garmin Vector, VCT, Olathe, USA; Powertap P1, CycleOps, Madison, USA; Assioma, Favero Electronics srl, Arcade, Trevise, Italy) or bottom bracket (Power2max, Zossen, Germany; Quarq, Spearfish, USA) have been developed for consumers to measure crank torque and power output during training and competition. In addition, these systems can measure various variables related to the pedalling technique (Eq. 3–5; Figure 4) as:

Typical representation of the crank torque throughout a pedalling cycle for one lower limb. P+ represents the positive impulse and P− represents the negative impulse.
The IE is often considered as a gold standard to evaluate the effectiveness of the pedalling technique. 11 It can be improved by accentuating the pulling force during the upstroke or by using a more circular action during the entire pedal revolution, which is facilitated when using a suitable saddle position.47,48 This metrics is correlated with gross efficiency57,58 and elite cyclists would have a better IE than non-cyclists (47.4 ± 4.5% vs 39.2 ± 6.2%) at 90 rpm and 60% of maximal aerobic power. 59 When the system only measures crank torque, the effectiveness of the pedalling technique is characterized by the PIP. 60 These authors reported values of around 83.7 ± 3.9% and 86.5 ± 4.5% for recreational and professional cyclists, respectively, at 90 rpm and at a power output between 200 and 300 W. It has been demonstrated that reducing crank arm length improves PIP by increasing tangential force during the upstroke. 61 However, to our knowledge, no study has related the dead centre size and pedal smoothness to cycling position. Nonetheless, Leirdal and Ettema observed that the dead centre size is more related to gross efficiency than IE, showing that the power output evenness is an important factor of energy saving. 58 These authors found a dead centre size of 25.7 ± 10.0% at 80% VO2max and at a freely chosen cadence in 21 competitive cyclists, while other authors reported values of 32.8 ± 2.8% for pedal smoothness during a Wingate test in 36 competitive cyclists. 62 Although these metrics are neglected in the bike-fitting scientific literature, we can hypothesize that a difficulty in producing positive force at top dead centre or large variation in force production during the pedalling cycle can be linked to an improper bike configuration. For example, a saddle height that is too low or cranks that are too long can induce too much knee flexion, making it difficult for passing the top dead centre. Further studies are needed to integrate these metrics, available with economical instrumented pedals, in bike-fitting studies. In addition, each individual is different in terms of joint mobility and sometimes, joint angles suitable for a cyclist, will not be tolerated by another due to low flexibility,63,64 which could be detected by poor pedalling effectiveness and smoothness during certain parts of the pedal stroke.
Pressure sensor
In some cases, the kinematic and kinetic analyses are not sufficient to understand the cause of discomfort. For example, a cyclist can feel pain in the perineum, but his joint angles are within the norm and he has good pedalling effectiveness. In this case, pressure analysis systems positioned on the saddle can detect areas of high pressure, which is responsible for this discomfort (e.g., Gebiomized; Wiva; Medilogic, Schönefeld, Germany; FSA system, Vista Medical Ltd, Bristol, United Kingdom) (Figure 5a). The saddle interface pressure systems correspond to a thin and flexible film that is positioned between the saddle and the pelvis. The film is composed of a high number of resistive pressure sensors which can range from 64 (Gebiomized) to 480 (Medilogic). To the best of our knowledge, no study demonstrated that the number of sensors integrated into the Gebiomized mapping system is not sufficient to evaluate saddle pressure and this device is commonly used in the scientific literature.12,65 The sensors send information through wireless transmission to specific software. Generally, these systems provide indicators related to the mean pressure across the saddle and the locations of the maximum pressure values (mbar); comparison of pressure distribution between the left and right sides and between the front and rear (pubic and ischial tuberosities) of the saddle (%); the loaded area (cm2); the ischial tuberosity distance (mm); the pelvis rotation (degrees) and the position and movement of the centre of pressure (mm). They have the potential to identify lower limb asymmetry, evaluate pelvis stability, compare different saddle models and detect material deformation, which may be responsible for saddle breakage. Authors have demonstrated the validity and reliability of the FSA saddle interface pressure system. 66 Subsequently, commercially available systems have been used in the scientific literature for research purposes, and studies have shown the impact of gender, workload, cycling position and saddle design on the saddle load pressure.12,67 Holliday et al. recommend asking the cyclist to pedal at an intensity similar to that which he would use during training and racing when evaluating the saddle pressures. 12 These systems, therefore, appear to be complementary to the motion analysis to validate the position and components despite the absence of standard values to guide the use of these tools. 16
The shoe interface pressure systems are also interesting to complete the bike-fitting (Figure 5b). These tools correspond to insoles positioned in the shoes integrating pressure sensors (e.g., 12 for Gebiomized, 32 for Wiva and 93 for Medilogic). A study showed that 8–10 sensors under the foot are sufficient to investigate foot function. 68 These technologies measure the pressure throughout the pedalling cycle and provide various elements of information: mean pressure across the foot and in each zone of the foot, and locations of maximum pressure values (mbar); position and movement of the centre of pressure (mm); pressure and recovery time for each foot (ms); force exerted by each foot (%); movement of the feet (pronation or supination) and symmetry of pressure between both feet (%). The main purpose of these systems is to choose fitting shoes, select insoles adapted to the foot morphology and optimize the cleat placement. For example, during a bike-fitting, the 3D motion capture can show a large knee motion in the frontal plane, which could be responsible for knee injuries. 34 The pressure analysis can detect an instability of the foot centre of pressure which moves abnormally during the pedalling cycle. An insole with arch support could improve the stability of the foot in the shoe, reducing knee movements in the frontal plane. 69
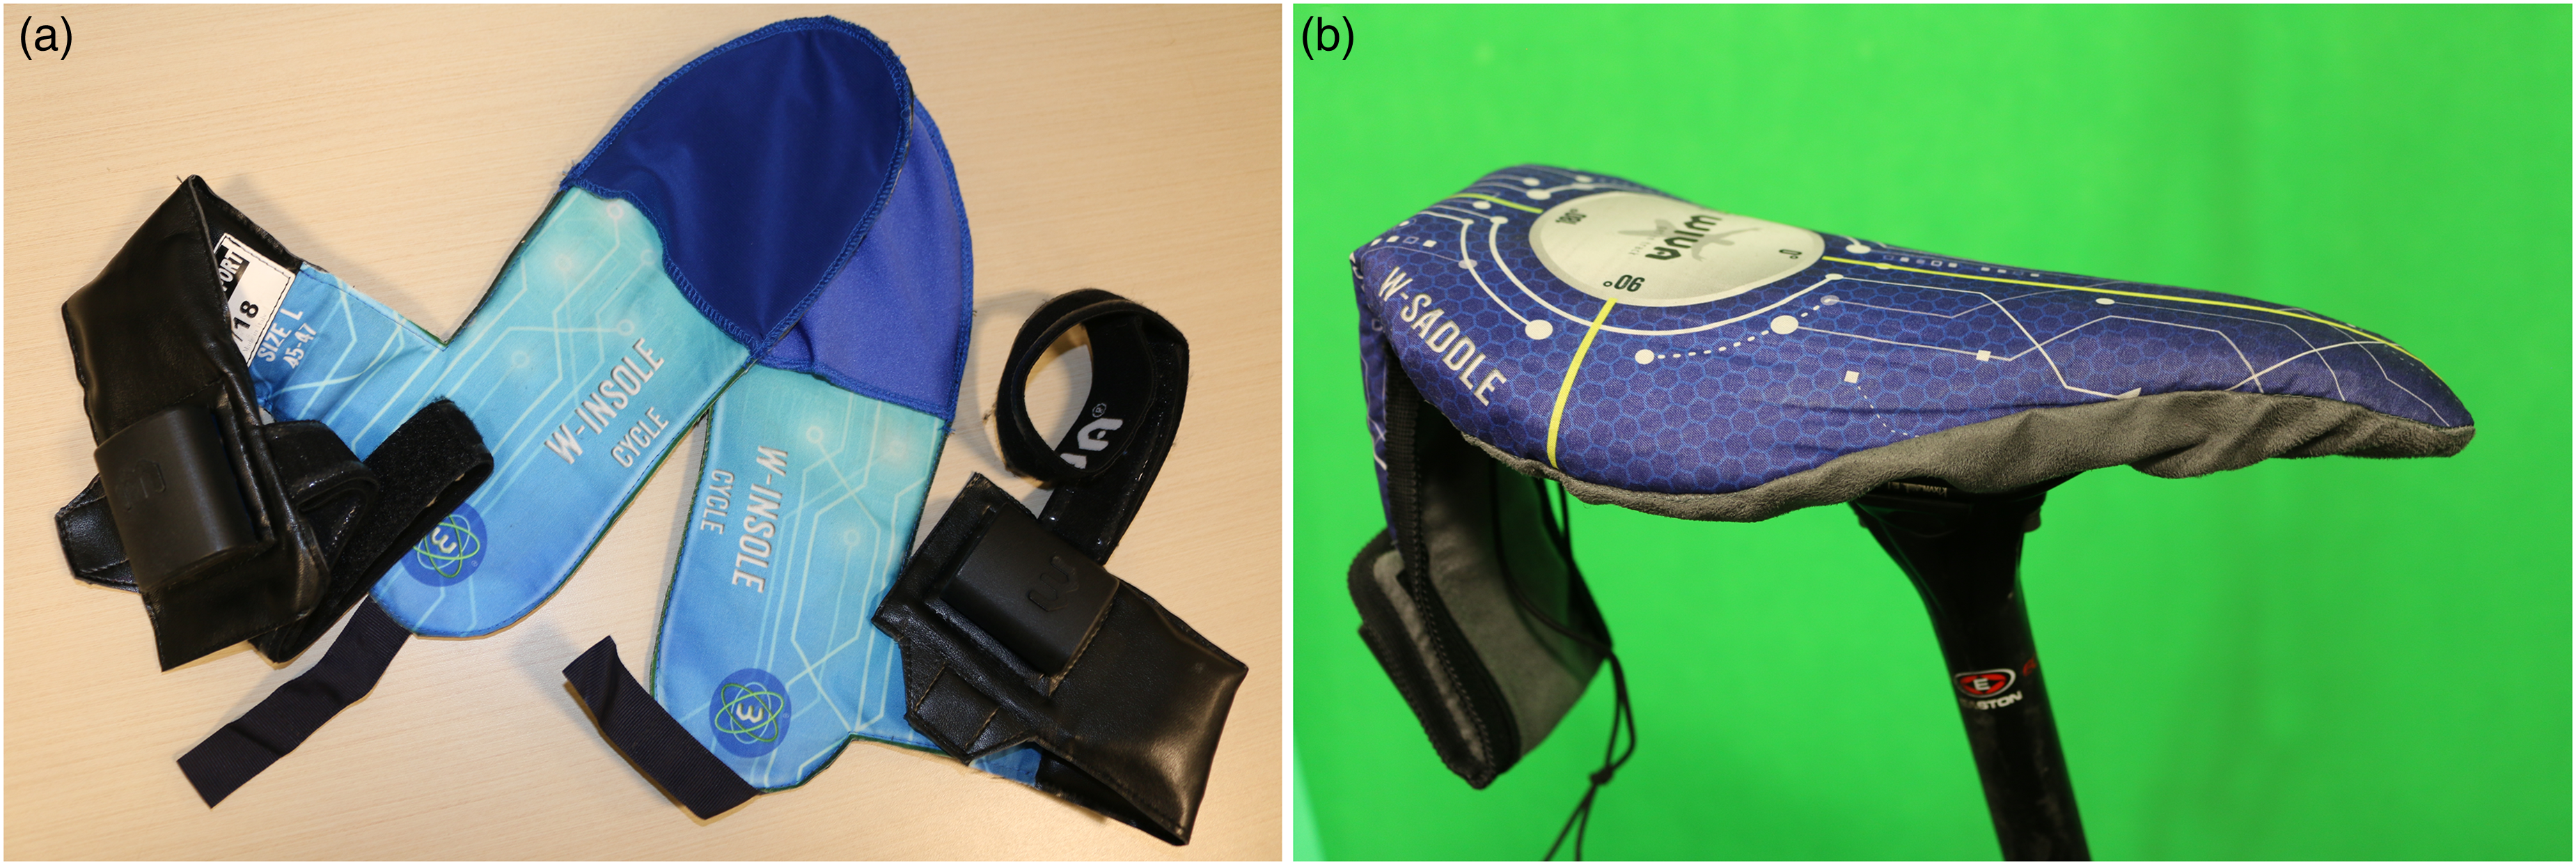
Saddle (a) and foot (b) pressure systems developed by the Wiva company.
As with motion capture, it is important to consider the acquisition frequency that can vary considerably depending on the company (e.g., 60, 100 and 200 Hz for Medilogic, Wiva and Gebiomized, respectively). The higher the sampling frequency, the more accurate will be the measured pressure data. 70
Surface electromyography
The pedalling motion is the result of a synergy between different muscle groups of the lower limbs, which is affected by the cycling position and material used.65,71 The muscle activity can be studied by measuring sEMG activity, which corresponds to the electrical signals that initiate the muscle contraction. The sEMG can be characterized by the muscle activity level (root-mean-square or integrated EMG value) and the muscle activation timing (onset and offset times and duration of EMG burst). 13 Cycling studies are generally limited to ten of the major muscles recruited during pedalling (Figure 6). Specific recommendations (SENIAM: Surface Electromyography for the Non-Invasive Assessment of Muscles; http://www.seniam.org) have been elaborated on sensors (shape, size and material of electrodes, inter-electrode distance and sensor construction), sensor placement (skin preparation, position of patient, sensor location and fixation, testing connection…) and signal processing and modelling.
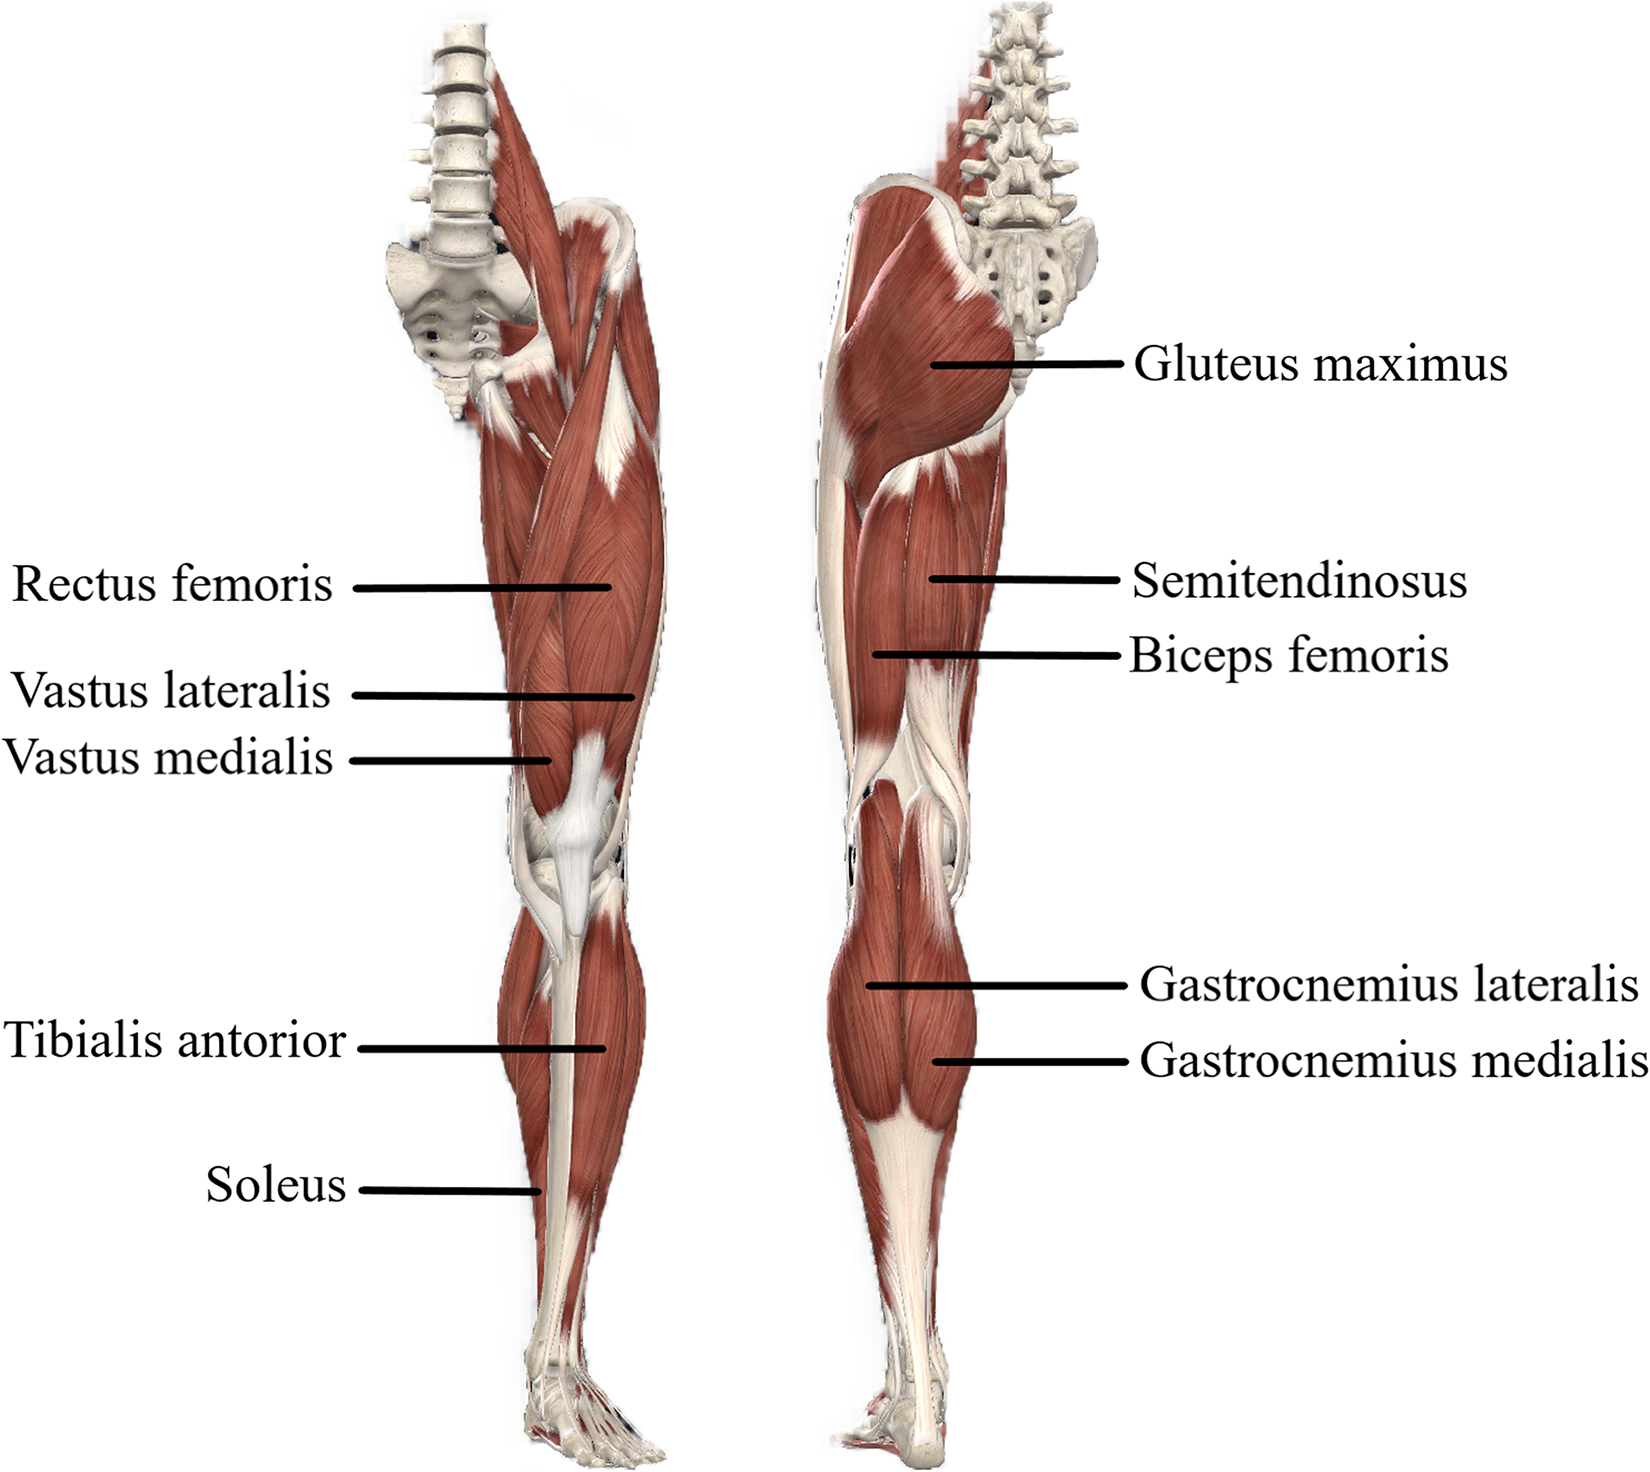
Illustration of 10 of the major muscles involved in the pedalling movement that can be studied from surface electromyography while cycling.
Although some brands include EMG sensors in their IMU (Delsys Inc., Shimmer Research Ltd; Noraxon Inc., Arizona, USA), these technologies are seldom used by bike-fitting professionals. This lack of consideration can be linked to several factors: firstly, the measurements require a long protocol linked to SENIAM recommendations. Secondly, the result analysis is complex and may be in contradiction with the feeling of the cyclist due to a high adaptability of the body muscles. 7 Thirdly, it has been shown that sEMG data are inherently variable and that substantial measurement errors are present, especially when recorded under dynamic conditions. 72
Nonetheless, to facilitate the use of sEMG and allow for outdoor measurements, the Myontec LTD company (Kuopio, Finland) has developed a wearable system integrated in shorts that can measure sEMG activity while cycling. Textile electrodes cover a larger area of the muscle compared to sEMG, and thus provide muscle excitation of whole muscle groups (hamstrings, quadriceps and gluteus muscles) rather than individual muscles. This system could provide comparable muscle excitation information and reproducibility to traditional laboratory systems during dynamic tasks such as cycling 14 and does not require skin preparation. 73 The muscle signals are recorded throughout the training, and a report is provided at the end of the session including the distribution of the muscle load between the two lower limbs and between the different muscle groups. Since IE is related to muscle activity, this information may indicate which muscle group is responsible for low effectiveness (e.g., hip or knee flexor muscles). 59 Thus, despite the inability to measure each muscle independently, this technology is able to provide valuable information for the bike-fitting professional. These tools should be used to further analyze the cyclist by identifying muscle recruitment asymmetries or weaknesses in certain muscle groups that can be resolved with position adjustments or targeted exercises with healthcare professionals (e.g., doctor or physiotherapist).
Conclusion and perspectives
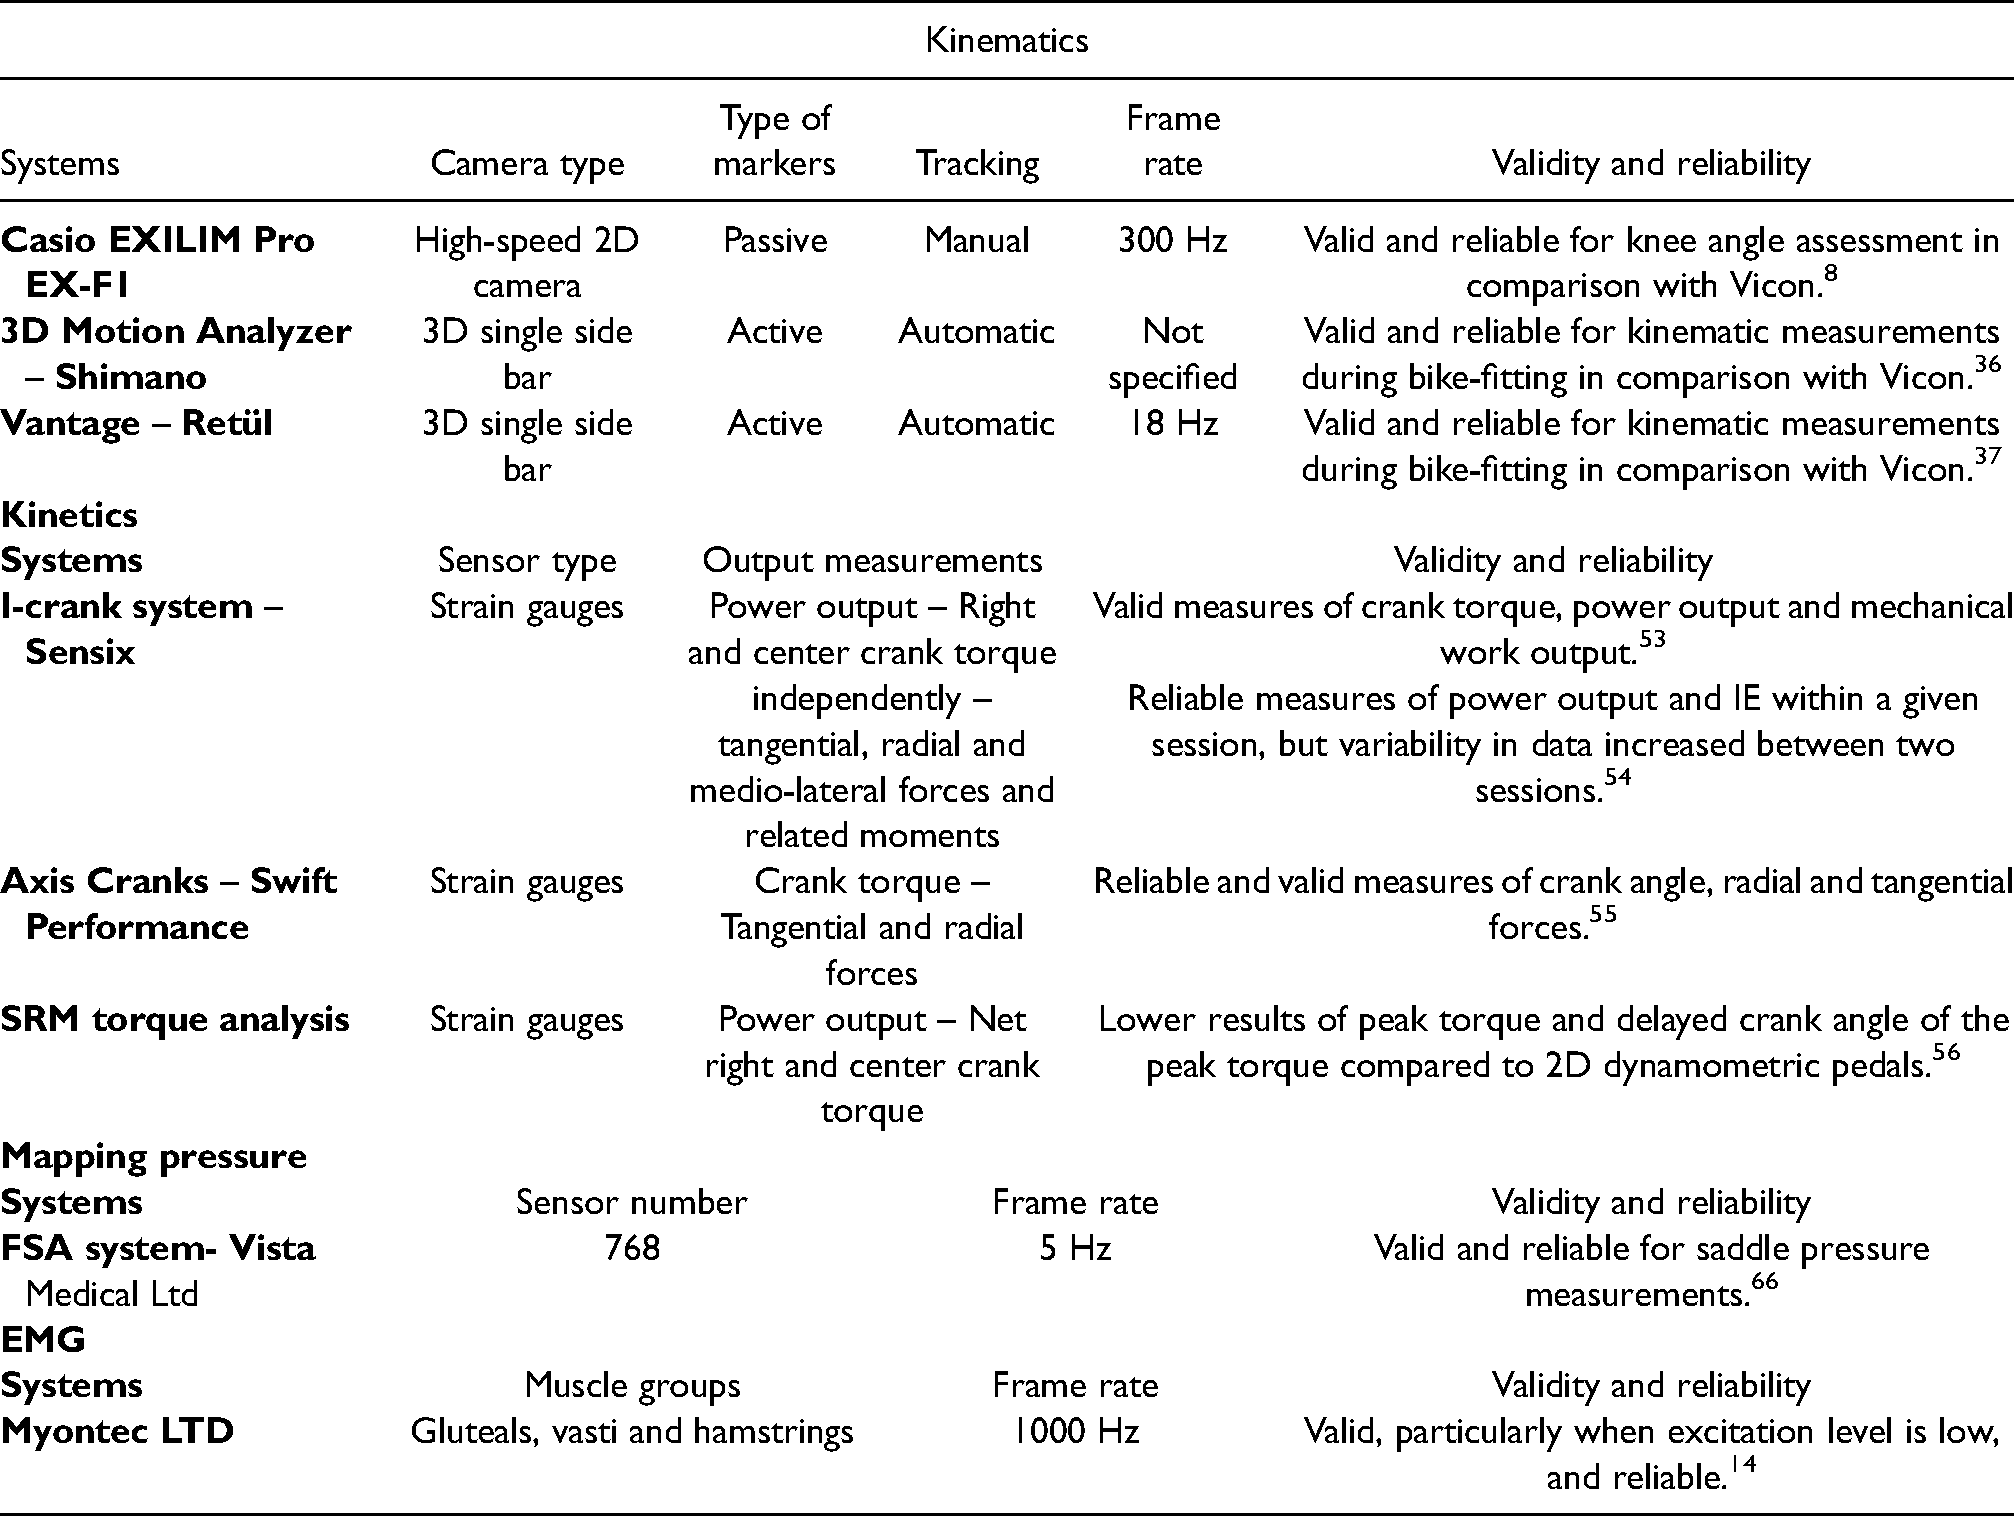
This literature overview has presented the different technologies based on biomechanics developed in the bike-fitting industry. The choice of tools offered to experts is wide so that they can provide a high-quality service to their customers.7,16 Table 1 summarises the main commercially available systems that have been validated in the literature.
Characteristics, validity and reliability of the commercial technologies used in bike-fitting to evaluate pedalling biomechanics.
Most bike-fitting research and systems are based on joint kinematics, and, in this context, three-dimensional motion capture system is recommended for bike-fitting professionals. Indeed, these systems are more precise 8 and they consider the kinematics in the three planes of space, in particular the movement of the knee in the frontal and transverse planes, which can lead to overuse injuries. 34 Some recommendations related to optimal joint angles have been provided in recent years by scientific studies and bike-fitting companies26,63 but need to be validated by further experiments based on efficiency, injury prevention and comfort perception. In addition, it could be interesting to consider the effect of the angular velocity of the joints in bike-fitting studies. 28 Variations of foot and tight angular velocity are provided by some IMU to evaluate pedalling smoothness but the relationship with pedalling effectiveness is not clear. Currently, the IMUs fail to provide the same variables as laboratory systems but are nonetheless great tools for coaches to analyze the rider's position on the field (e.g., pelvis stability, torso flexion and head movement). In addition, recent research seems promising to allow bike-fitting professionals to perform in situ bike-fitting in the near future with IMUs.9,46
To identify the impact of bike adjustments on pedalling technique, it is important to evaluate objective metrics related to pedalling effectiveness, like IE47,48 and PIP. 61 Other kinetic variables (dead centre size and pedal smoothness) are provided by instrumented pedals but, unfortunately, no studies have used them in bike-fitting research. These tools and the associated metrics are nevertheless important in a bike-fitting protocol to individualize the intervention, taking into consideration the characteristics of the individual (e.g., ability to produce force during lower limb extension when passing bottom dead centre). 64 In addition, the development of economical instrumented pedals now allows cyclists and coaches to evaluate the pedalling technique of cyclists in the field, considering the effect of fatigue or the slope of the road. 10 As mentioned in the introduction, a biomechanical protocol must integrate kinematic and kinetic measurements and not rely solely on joint angles. The fusion of these data could give indications of the forces at the joints, thus making it possible to go further in the bike-fitting analyses thanks to a complete and detailed biomechanical environment.74,75 Therefore, complex mathematical models based on joint force could be integrated into bike-fitting systems using 3D kinematics and pedal forces. Based on this type of analysis, two studies have shown that a backward saddle position significantly increases the knee joint force.76,77 From there, we could really approach bike-fitting as a biomechanical analysis and no longer just validate certain angles without really knowing what is happening at the joints that are stressed during pedalling.
This biomechanical environment could be completed with pressure force sensors, which provide complementary information to explain saddle discomfort or detect if an individual needs foot orthotics. These tools measure objective variables to improve the interaction between the cyclist and his bike by adjusting bike position and components.65,67
Finally, sEMG seems little taken into account in bike-fitting, despite the action of the muscles being a key point for efficient pedalling. 75 The appearance of integrated systems in clothing seems to be an interesting innovation for bike-fitting professionals both in terms of ease of use and the reduced cost of the technology compared to traditional systems. 14
Footnotes
Declaration of conflicting interests
The author(s) declared no potential conflicts of interest with respect to the research, authorship, and/or publication of this article.
Funding
The author(s) received no financial support for the research, authorship, and/or publication of this article.