
Abstract
Literature lacks evidence about the physiological recovery of tennis players between points. This study aimed to: (i) verify the heart rate (HR) and oxygen uptake (V̇O2) recovery variance in young tennis players from the end of a tennis drill until the 25-s mark and onwards (65-s limit), performed at several intensities, and (ii) test the curve fitting that better characterizes the players’ HR and V̇O2 recovery, from the end of the drill until the 65-s mark. The sample was composed of 13 male tennis players (age: 16.80 ± 1.61 years) recruited from a National Tennis Association. Players were instructed to perform a drill test (“two-line drill wide mode”) based on an intensity increment protocol. Three levels of intensity were used based on the reserve HR and V̇O2. A significance level effect was observed on the HRreserve and V̇O2reserve (P < .001). At all three levels of intensity, the first 25 s were enough to significantly (P < .001) recover the HRreserve and V̇O2reserve. The same significance trend (P < .001) was maintained until the 65 s but with a lower magnitude over time. Overall, the HR and V̇O2 curve fitting indicated a cubic relationship at the three levels of intensity (except the V̇O2 at the first level). Considering the specific test performed, players significantly elicited their physiological profile for every additional 10 s (after the 25-s rule) in the three levels of intensity performed. Despite this being a drill test and not a competitive point, coaches, players, and tennis organizations should be aware of these findings.
Introduction
More than ever, athletes and coaches understand the importance of training and all aspects related to training programs to achieve optimal performance.1,2 This quest for high performances has led athletes and coaches to constantly seek any advantage that can improve performance. Often these advantages are based on types of training that can bring out the athletes’ specific physical fitness, 3 technical skills, 4 tactics, 5 or even their mindset. 6
On the other hand, recovery is also a key factor in any training program or competition, as it allows the athlete to undergo a restorative process over time, both physically and psychologically. 7 Recovery allows the body to adapt to the stress associated with exercise by restoring muscle glycogen and aiding in the repair time of body tissues. 8 Literature reports three types of recovery: (i) immediate – is the recovery that occurs between rapid, time-proximal finite efforts (e.g. when a runner has one leg in immediate recovery between each stride); (ii) short-term recovery – recovery between exercises or sports movements that allow rest (e.g. recovery between interval sprints or between weight training sets); and (iii) training recovery – recovery between successive workouts or competitions (e.g. two-a-day workouts or sports that have more than one competition on the same day – heats and finals). 9
In the specific case of tennis, it can be considered that during a tennis match players can be under two types of recovery: immediate and short-term. The former corresponds to the recovery between strokes, and the latter to the recovery between points or games. Unlike most sports, tennis has a restrictive rule that after each point within the same game, players have a 25-s limit time between points. 10 Specifically, the server has a 25-s limit between the points. The receiver should play at the pace of the server, but the server should play at a reasonable pace. 10 It was suggested that this rule has two key roles: (i) it allows the players to recover, and (ii) promotes a match with continuity, that is, with as few non-game moments as possible. 11 However, in recent years several questions have been raised in the tennis community and referees’ sensibility to this rule as an official watch has been in use since 2019.10–12 In addition to factors extrinsic to players (e.g. weather conditions, or any other issue that does not allow the match to carry on in a regular way), it could be argued that whenever players exceed this time limit, they are trying to promote greater physical or mental recovery or to “disturb” their opponent. Based on men’s Grand Slam data between 2000 and 2017, a study observed that players took an average time of 19–20 s between points. 12 The same study indicated that the average time between points increased after long rallies, and even more in “big” points. In these years (2000–2017), the time allowed between the points was the 20 s. In Grand Slams, the 25-s rule came into effect in 2018 (implemented to ITF tournaments and junior international tournaments later). 10 Nowadays (i.e. from 2018 onwards) it must be also pointed out that the time between the points is also surface dependable and correlates with the rally duration. 13
Studies have analyzed the physiological profile (heart rate – HR; oxygen uptake – V̇O2) of tennis players and their immediate and short-term recovery.14,15 Furthermore, Duffield et al. 16 have investigated the effects of combining several recovery procedures on physical, physiological, and perceptual recovery after a two-a-day on-court training and match-play sessions (i.e. training recovery). Another study aimed to assess the effect of the recovery duration in intermittent training drills on metabolic and coordination variables. 17 However, there is no information on the physiological recovery of tennis players between points or any other exercise drill that can simulate a tennis point. In the past, it has been indicated that the longer time between points at the French Open was related to longer durations of clay-court rallies. 18 Thus, it can be stated that the recovery between points plays a key role in the performance of the players and an increase in the intensity of the game leads the players to take some extra time for the recovery.
Therefore, the main aims of this study were to: (i) verify the HR and V̇O2 recovery variance in young tennis players from the end of a tennis drill until the 25-s mark and onwards (65-s limit), performed at several intensities, and; (ii) test the curve fitting that better characterizes the players HR and V̇O2 recovery, from the end of the drill until the 65-s mark. It was hypothesized that: (i) players would significantly recover their HR and V̇O2 after 25 s at low and moderate intensity, but not at the highest intensity, and; (ii) HR and V̇O2 recovery would present a cubic fitting at all intensities.
Methods
Participants
The sample was composed of 13 male tennis players (age: 16.80 ± 1.61 years; body mass: 62.77 ± 6.17 kg; height: 176.46 ± 5.32 cm). The players were recruited from a National Tennis Association. They were members of their national squad and participated regularly in international tournaments. All the players were ranked in the top 30 of their country’s age group. At the time of data collection, they were at the end of a training cycle preparing to compete in a major competition. They were tested individually in three consecutive days. The tests were conducted after school and without any extra physical activity. Previous day they had a standard training. The inclusion criteria for the participants were: (1) being national level players in their age-group (Tier 3); 19 (2) having participated in daily training sessions from the beginning of the season, and (3) presenting no injury since the beginning of the season. All participants had more than six years of competitive experience and trained 5–6 sessions per week. Parents or guardians and players signed an informed consent form. All procedures were in accordance with the Declaration of Helsinki regarding human research, and the institutional Ethics Board approved the research design (N.° 75/2022).
Protocol
Players were wearing their competition gear and clothes. Before starting the drill test, they were instructed to perform a 15-min standardized warm-up. Within this time, a two-minute adaptation phase with the release of balls to the central area of the court (minimal lateral displacement). After 10 minutes of passive rest, the athletes were instructed to perform the drill test “two-line drill wide mode” at the lowest ball frequency used. Players were familiarized with the drill test prior to data collection. This is a tennis drill commonly used by tennis players which alternates between hitting a wide forehand (right side of the court), then a wide backhand (left side of the court). Balls were thrown at constant velocity (mean: ∼78 km/h) with a ball machine (Spinfire 2 Pro, Melbourne, Australia). As mentioned before, the ball machine alternated the direction of the ball always in the same sequence, that is, right side and left side of the court. Whenever the ball was directed to the right and left sides of the court, players were instructed to perform a forehand and a backhand stroke, respectively. They had to hit balls in a topspin drive pattern with a previously set landing mark. They were told to hit the ball with the best possible velocity/accuracy ratio, that is, simulating a competitive point. 20 Figure 1 shows the test drill performed.
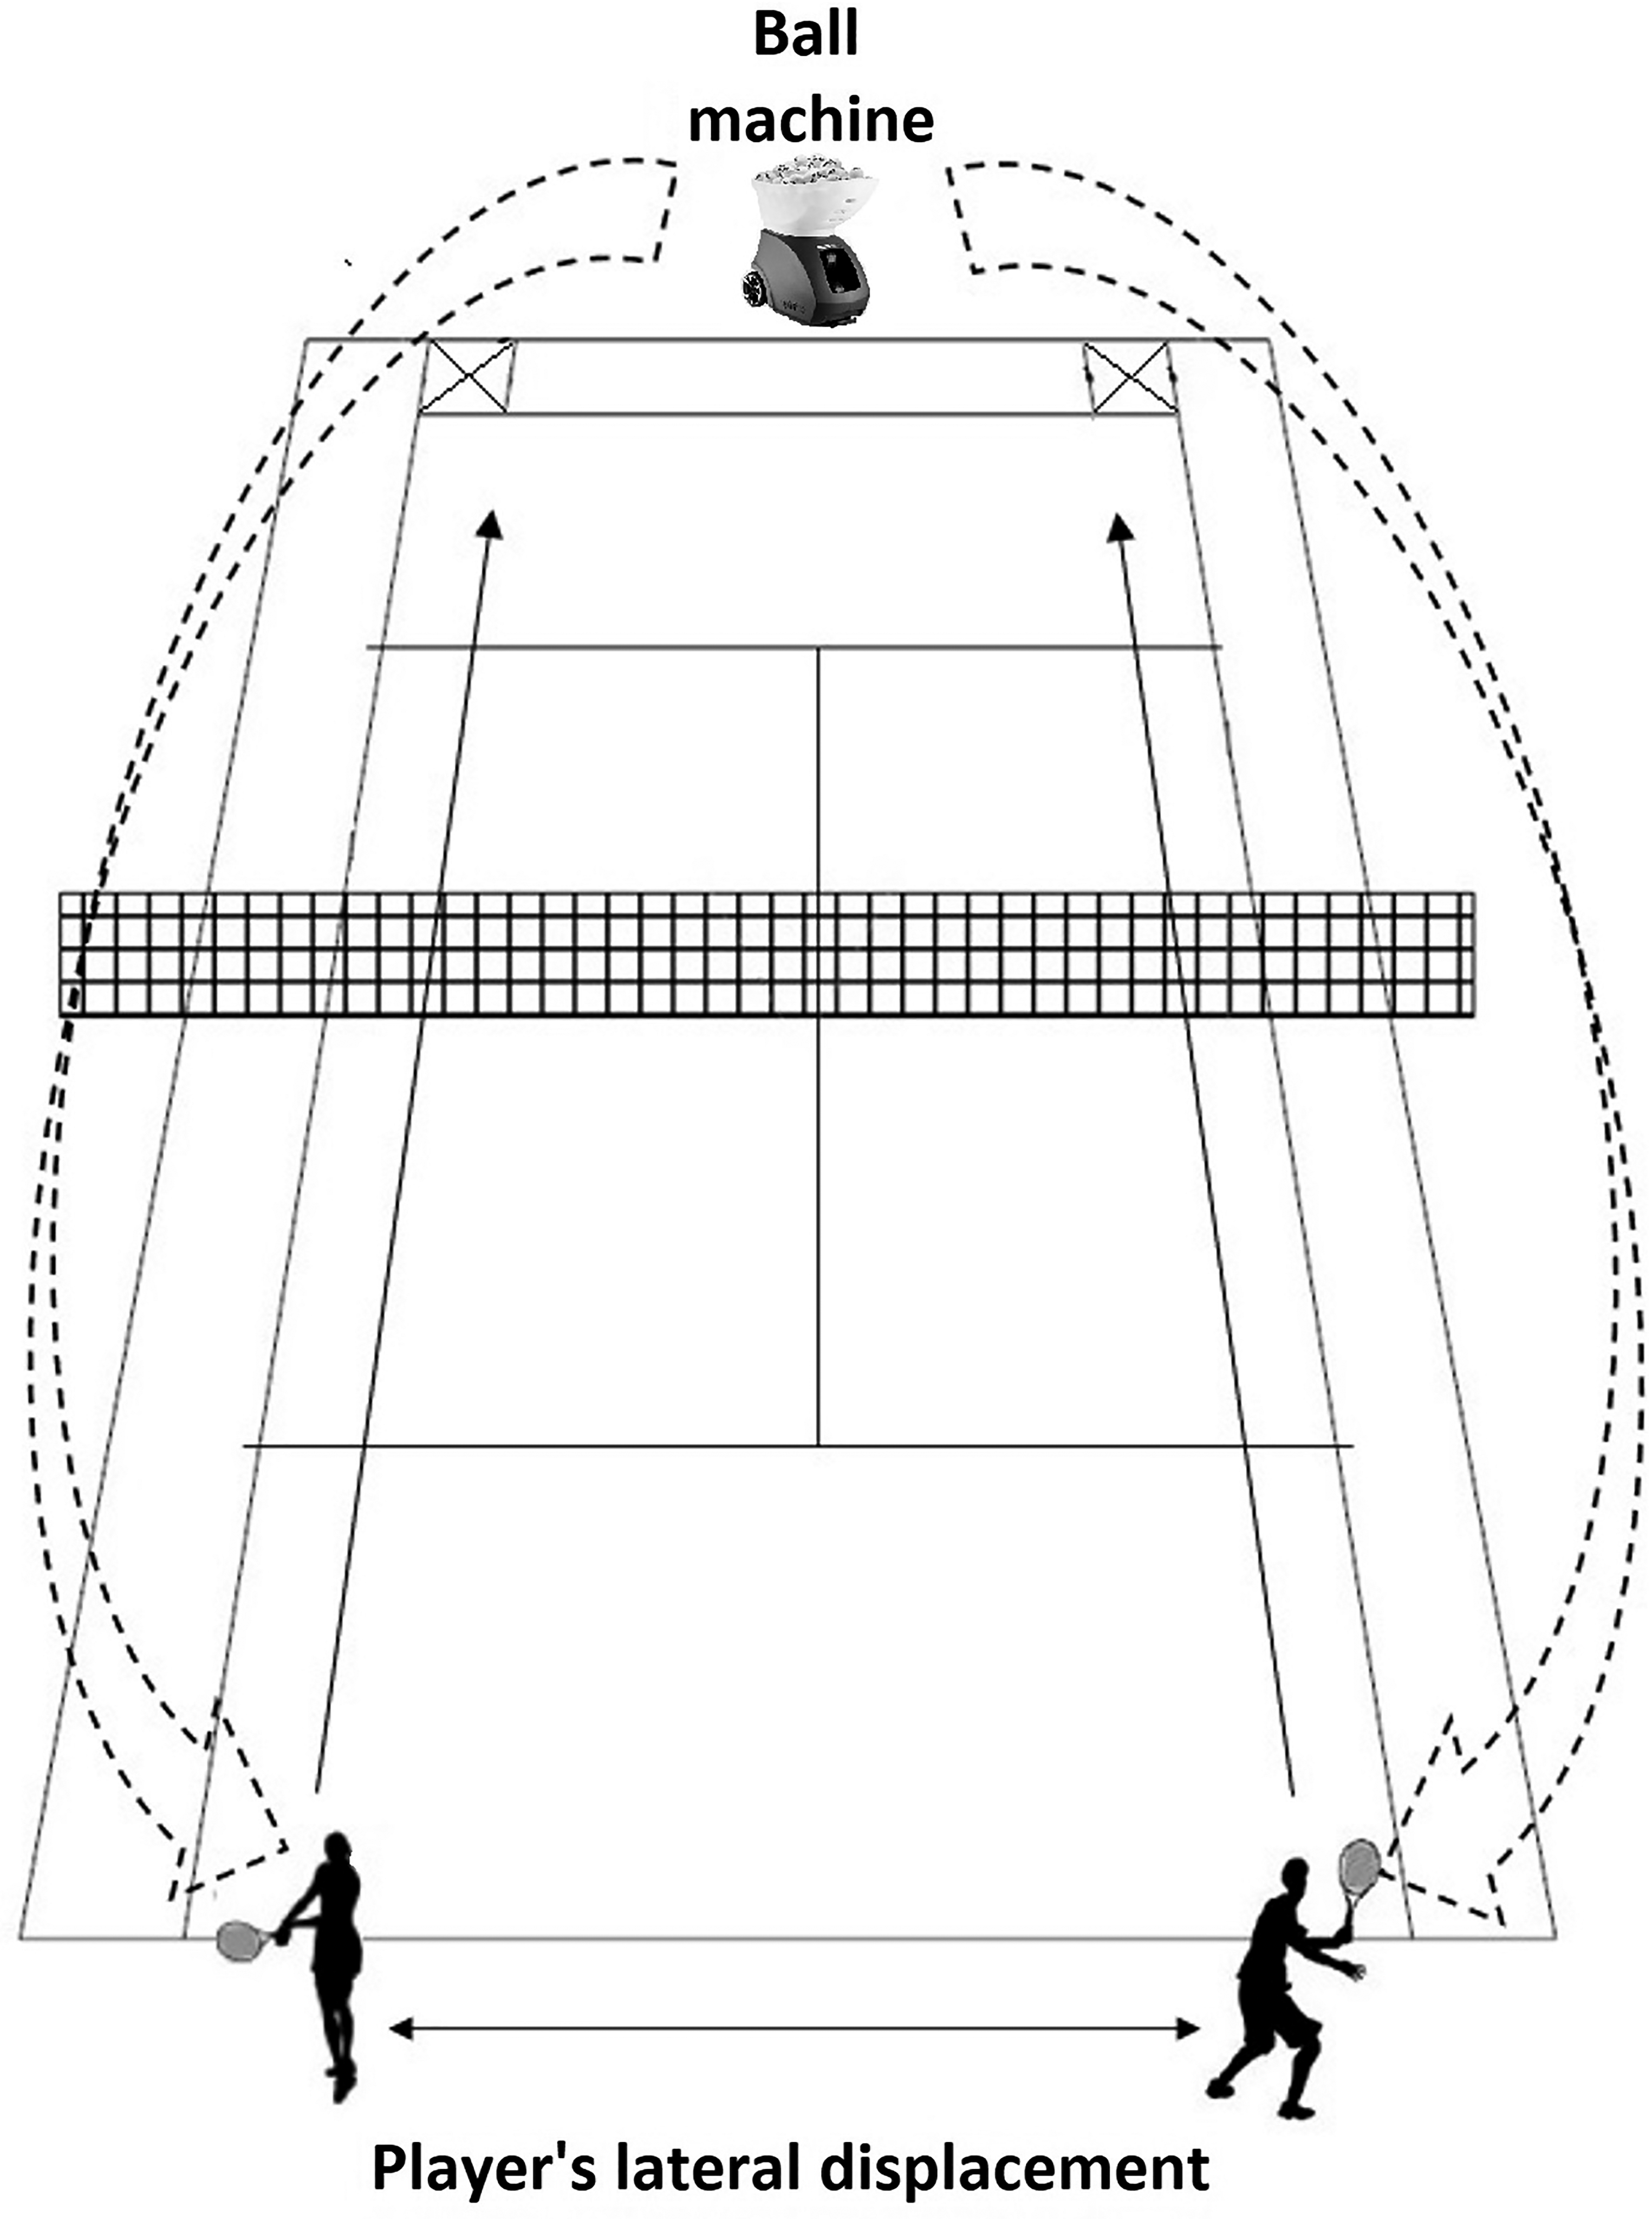
Schematic of the test drill performed. Dash arrows represent the throwing balls from the machine. One ball to the right side of the court, another to the left side. Solid arrows represent the down-the-line topspin strokes performed by the players. On the right side of the court the players performed forehands, and on the left side back backhands. The square marked with a cross served as a reference for the stroke.
An incremental test with five stages was used. In all stages, the ball machine setting was the same. The throwing interval of the ball was used to control the incremental test. The ball throwing was set at: (i) first stage – 12 balls/min; (ii) second stage – 14 balls/min; (iii) third stage – 16 balls/min; (iv) fourth stage – 18 balls/min, and; (v) fifth stage – 20 balls/min. Thus, a higher number of balls per minute promoted a greater energy demand. Each stage was performed for two minutes. After each stage, players were instructed to perform a 75-s passive recovery (standing still). The drill test ended when the players’ fulfilled all stages and in the final stage the HR was higher than 95% of the maximum HR (see Physiological assessments section). In all players, this criterion was accomplished. The drill test could also end with the players’ voluntary exhaustion or interrupted by the researchers if: (i) the players felt exhausted or failed to hit the ball twice in a row, or; (ii) the players was no longer able to perform strokes with an acceptable execution technique and a demise in velocity/precision, as determined by experienced coaches through subjective observation. 20 Those were the players personal coaches. They had experience in personal coaching and with their country’s national squad (under-14 and elite national squad). All tests were conducted in an indoor hard court and under the same conditions to ensure standardized playing conditions. Players performed the drill test with Wilson W Team Trainers balls.
Physiological assessments
Before the drill test, the HR at rest was measured for 10 min while the players were sitting in silence. The V̇O2 at rest was considered to be 1 MET (metabolic equivalent of task; 1 MET = 3.5 mL/kg/min). 21 During the entire drill test, the player’s HR was monitored with a HR monitor (Polar H9, Kempele, Finland). Immediately after each stage, athletes were instructed to hold their breath until the mask was placed. During recovery, breath-to-breath gas exchange ventilatory values were continuously being recorded using the Metalyzer 3B system (Cortex Biophysik, Leipzing, Germany). The V̇O2 was measured for 65 s. Gas and volume calibration of the equipment were performed before each test according to the manufacturer’s instructions. The HR was measured during the entire protocol (drill test and recovery time). The V̇O2 was measured only during the recovery time. Thus, the V̇O2 at the end of each stage was estimated through backwards extrapolation through individual linear regression based on the HR–V̇O2 relationship. Mean records of the first 25 s and every additional 10 s were measured and registered (until a 65-s limit). Linear regression R2 ranged between 0.654 and 0.982 in stage #1, between 0.773 and 0.998 in stage #2, between 0.820 and 0.991 in stage #3, between 0.661 and 0.999 in stage #4, and between 0.867 and 0.997 in stage #5.
As aforementioned, the V̇O2 during the drill test was measured by backwards extrapolation. Thus, based on the HR criteria, one can consider that all players reached the maximum V̇O2 in the last stage of the drill test. All players reached more than 95% of the age-related maximum HR. 22 The two most used criteria were applied: (i) maximum HR = 220 – age, 21 and; (ii) maximum HR = 208–0.7 * age. 23 Additionally, the fatigue scale was also applied. 24 In the last stage of the drill test, all players indicated that they were 99% fatigued according to the scale. Afterwards, the players’ data were grouped into levels based on their HR reserve (HRreserve) and V̇O2 reserve (V̇O2reserve) percentages, respectively. Three levels were used: (i) <80% (level 1); (ii) from 81% to 93% (level 2), and; (iii) > 93% (level 3). 25 For each target percentage, the following equation was used: HRreserve or V̇O2reserve = ((maximum – resting) * target percentage) + resting. This was done to normalize the players’ intensity in relation to their HRreserve and V̇O2reserve during each stage of the drill test.
Data analysis
The Shapiro–Wilk and Levene tests were used to test the assumptions of normality and homoscedasticity, respectively. The mean plus one standard deviation was computed as descriptive statistics.
Recovery, for both HR and V̇O2 independently, was assessed with the repeated measures ANOVA. A level effect was tested with the LSD correction to understand whether there were significant (p < .05) differences between level intensities. The variance effect size (eta square – η2) was computed and interpreted as: (i) without effect if 0 < η2 < 0.04; (ii) minimum if 0.04 ≤ η2 < 0.25; (iii) moderate if 0.25 ≤ η2 < 0.64; and (iv) strong if η2 ≥ 0.64. 26 For each level, the Bonferroni post-hoc test was used to verify significant differences between each pairwise (p < .05). The mean difference (MD) with 95% confidence intervals (95CI) was calculated. The Cohen’s d was computed to verify the magnitude of the effect size, and it was interpreted as: (i) small if 0.20 ≤ d < 0.49; (ii) moderate if 0.5 ≤ d < 0.79; and (iii) large if d ≥ 0.80. 27
For each intensity level, the curve fitting was used to model the HR–time and V̇O2–time data spread by assigning the “best fit” function through the recovery period. This was performed based on the HR and V̇O2 estimated during the drill test, the initial 25 s of recovery, and afterwards by each 10 s until the 65-s limit. Linear, quadratic, and cubic fits were tested. Trendline, 95CI, 95% of prediction interval (95PI), and standard error of estimation (SEE) were calculated. The SEE was used as a goodness-of-fit indicator to compare the models (i.e. linear, quadratic, and cubic), as it demonstrates how precise model predictions are by using the units of the dependent variable (i.e. it indicates how far the data points are from the regression line on average). Lower values of SEE denote that the distances between the data points and the fitted values are narrower.
Results
Players presented an average maximum HR of 195.65 ± 9.43 beats/min and a V̇O2max of 42.22 ± 5.09 mL/kg/min. A significance level effect was observed for the HRreserve (F = 8.34, p < .001, η2 = 0.22) and V̇O2reserve (F = 4.91, p < .001, η2 = 0.02). Moreover, post-hoc tests indicated significant differences between all levels (p < .001) for both HRreserve and V̇O2reserve. At the end of the first level, players reached 71.96 ± 6.34% and 69.00 ± 7.67% of their maximum HRreserve and V̇O2reserve, respectively. At the end of the second level, players reached 86.49 ± 4.20% and 87.04 ± 4.10% of their maximum HRreserve and V̇O2reserve, respectively. At the end of the third level, players reached 97.47 ± 2.87% and 97.34 ± 3.29% of their maximum HRreserve and V̇O2reserve, respectively.
Table 1 and Figure 2 present the response of the HRreserve (Figure 2 – panel A) and V̇O2reserve (Figure 2 – panel E) by level, and respective pairwise comparisons. For both HRreserve and V̇O2reserve, the third level (highest intensity) was the one presenting the highest variance. In all three levels of intensity, the first 25 s were enough to significantly (p < .001) recover the HRreserve and V̇O2reserve. For every additional 10 s, the trend remained the same in both HRreserve and V̇O2reserve. That is, by each 10 s of recovery and until the 65th second, players still significantly recover but with a lower magnitude over time.
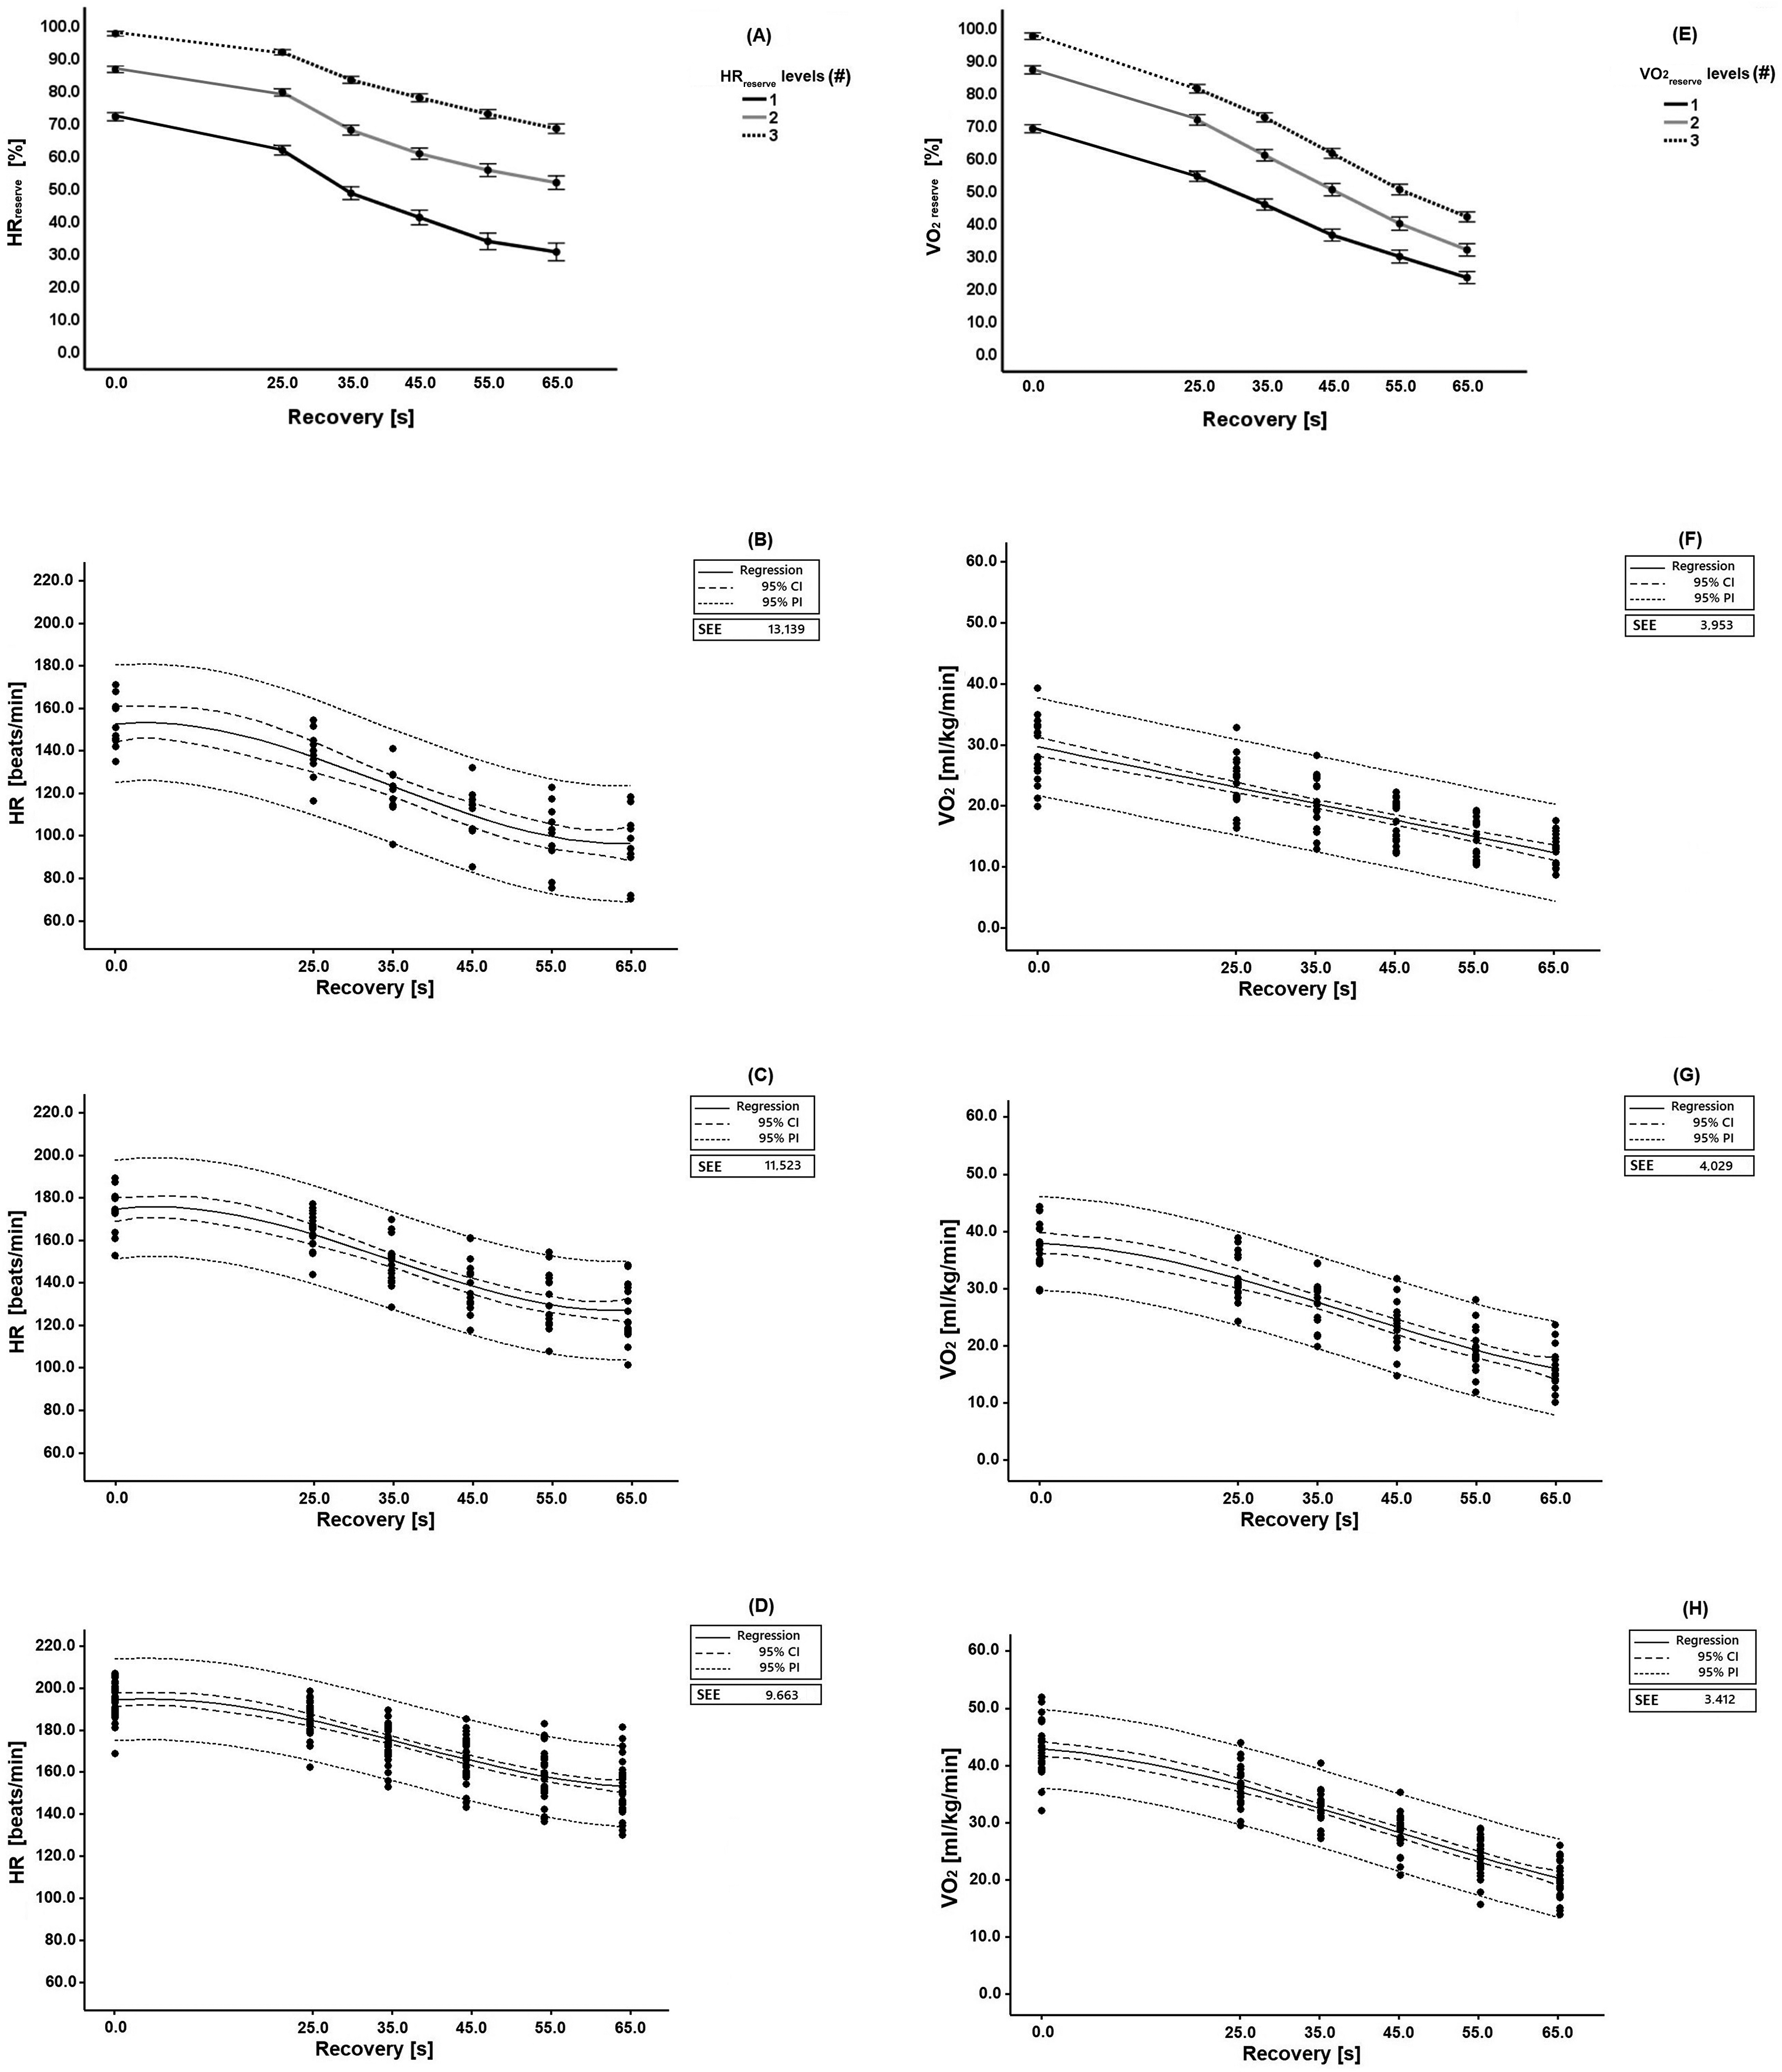
Panels A and E represent the heart rate reserve (HRreserve) and oxygen uptake reserve (V̇O2reserve) response across the intensity levels. It is also presented the curve fitting models for the heart rate (HR) (panel B – level 1; panel C – level 2; panel D – level 3) and oxygen uptake (V̇O2) (panel F – level 1; panel G – level 2; panel H – level 3) for each level. Abbreviations: 95CI = 95 confidence intervals; 95 PI = 95 prediction intervals; SEE = standard error of estimation.
Variance effect of the HRreserve and V̇O2 reserve during the recovery, and pairwise comparison during the specified recovery intervals.
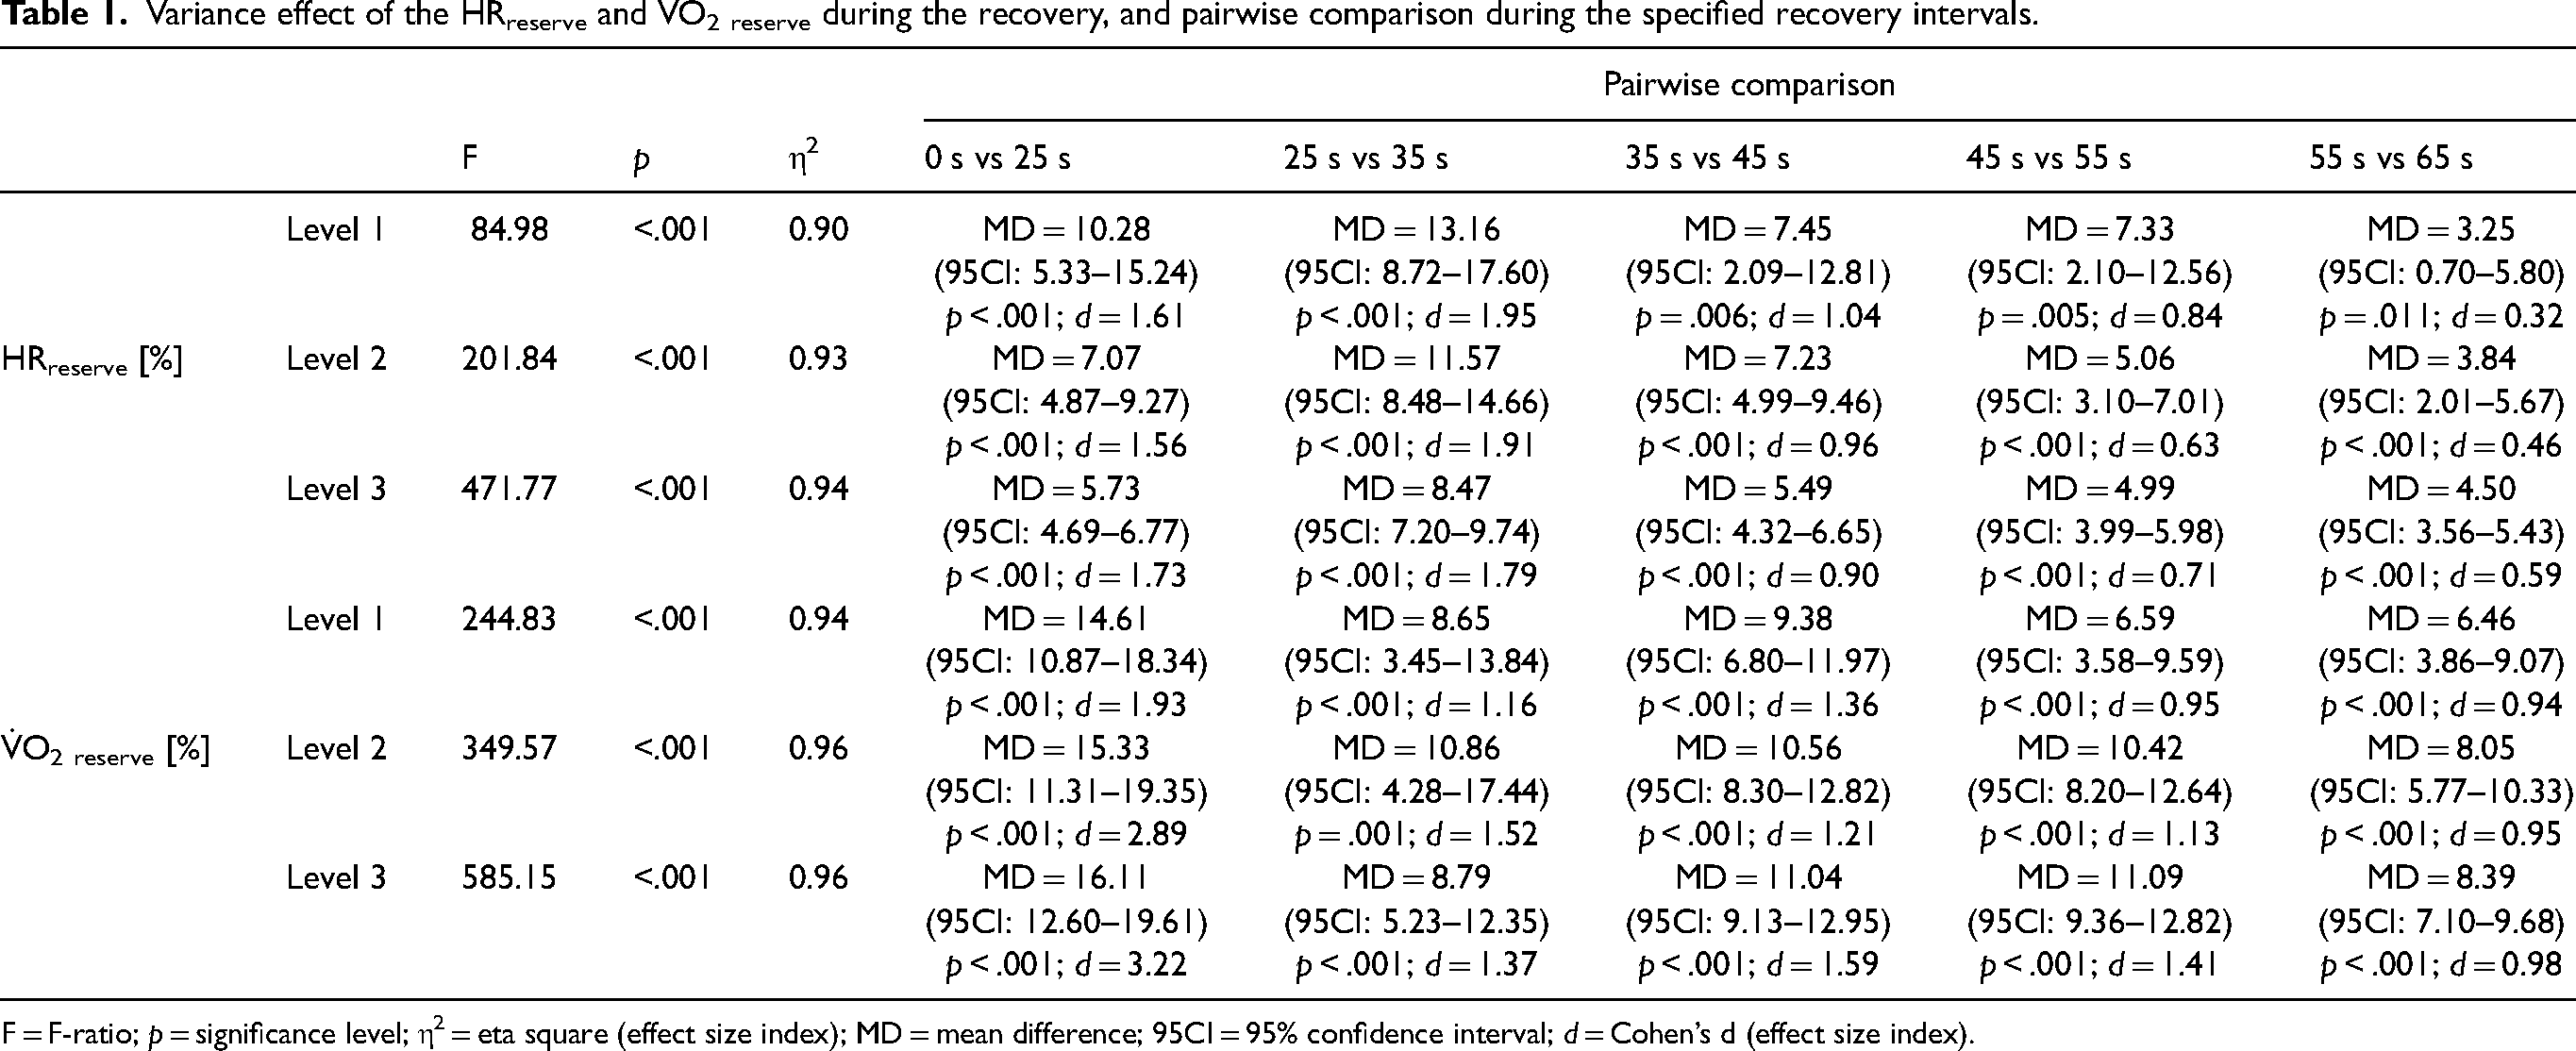
F = F-ratio; p = significance level; η2 = eta square (effect size index); MD = mean difference; 95CI = 95% confidence interval; d = Cohen’s d (effect size index).
Figure 2 also presents the absolute HR–time and absolute V̇O2–time curve fitting by level. In the first level (lowest intensity: <80%), the HR indicated a cubic fitting (SEE = 13.139) and the V̇O2 a linear fitting (SEE = 3.953). In the second level (from 81% to 93% of intensity), both the HR (SEE = 11.523) and V̇O2 (SEE = 4.029) indicated a cubic fitting. In the third level (>93% of intensity), the HR (SEE = 9.663) and V̇O2 (SEE = 3.412) also presented a cubic fitting. Overall, visual observation shows that near the 25-s mark, the players’ HR and V̇O2 began to decline sharply across all three levels. The HR–time curve demonstrated a decrease in recovery after the 55-s mark at all three levels. Regarding the V̇O2–time curve at the first level, the recovery “pace” maintained the magnitude from the end of the drill until the 65-s mark. At levels two and three, the trend was like the HR (decrease in the recovery “pace” from the 55-s mark onwards), but not as sharp.
Discussion
This study aimed to verify HR and V̇O2 recovery in young tennis players from the end of a standardized tennis drill until the 25-s mark and onwards (65-s limit) at various intensities. We also tested the curve fitting that better characterized the players’ HR and V̇O2 recovery, from the end of the drill until the 65-s mark, at the same intensities. Main results indicate that at all three levels of intensity, the players significantly recovered after the first 25 s and this trend was maintained until the 65th second (both HRreserve and V̇O2reserve). Overall, the HR–time and V̇O2–time curve fitting indicated a cubic relationship at all three levels of intensity, except for the V̇O2 at the lowest intensity level (linear relationship).
The topic of recovery in tennis has solid information on several techniques that tennis players can use to recover from tennis practices, matches or tournaments.28,29 As already mentioned, it is not possible to find information on how tennis players recover between points. Nonetheless, Seiler et al. 30 indicated that highly trained athletes may recover faster (i.e. short-term recovery) than their less trained counterparts, regardless of the exercise intensity. Our data showed that young tennis players were able to significantly recover their HR and V̇O2 after 25 s when performing at all three levels of intensity. The most comparable study about this topic aimed to understand how a typical intermittent drill used by elite tennis players affected the recovery duration of metabolic demands and their stroke and running performance. 17 The authors indicated that running speed and stroke quality are highly dependent on recovery time. That is, when the recovery time is too short, the running speed for stroke preparation and the stroke speed decrease, while stroke accuracy is maintained. To maintain optimal running speed and stroke skill, players should be able to rest at least 15 s. 17 Thus, it seems that the 25-s rule is enough to elicit a significant recovery in the players’ HR and V̇O2 at various exercise levels or training intensity.
Nevertheless, it should be noted that from the initial 25 s, players were able to significantly recover their HR and V̇O2 every 10 additional seconds at the three intensity levels. However, after the 35-s mark, a lower magnitude over time was observed, that is, the number of beats or oxygen uptake recovered every 10 s decreased over time. This trend was also noted in endurance trained male adults. 31 The authors showed that during one minute of recovery, the athletes recovered on average 31.0 beats/min during the first 30 s of recovery and 21.0 beats/min during the second set of 30 s. Conversely, for the same 30-s sets, others indicated that elite athletes recovered 16 and 20 beats/min in the first and second 30-s set, respectively. 32 This distinct trend can be related to differences in age or exercise/sport type.33,34 Thus, one can indicate that HR recovery can be highly dependent of the type of exercise/sport performed. In the specific case of tennis, and despite the magnitude of recovery observed, players still significantly recovered their HRreserve and V̇O2reserve every 10 additional seconds. This was remarkably noticed by the HRreserve in the first 10 additional seconds (i.e. between the 25th and 35th second). Indeed, at all three levels, the magnitude of recovery of the HRreserve was higher between the 25th and 35th second than in the initial 25 s after the drill. Thus, whenever tennis players overcome the 25-s rule between points, they are significantly eliciting their physiological profile. Moreover, failing to keep the 25-s rule gives an advantage also to the opponent. In the professional tournaments, the 25-s limit starts: (i) when the chair umpire announces the score (usually waiting for the spectators to stop applauding after long rallies), or; (ii) if the player was at the net at the end of the rally, then the countdown starts when the player reaches the baseline (this adds more time to recover, additionally to the 25-s rule). 10 Therefore, this procedure limits the 25-s rule and not many time violations are issued.
Fitting data indicated an overall cubic trend in both absolute HR and V̇O2 at all three levels of intensity. Immediately after the drill, tennis players began to slowly recover their HR and V̇O2 until the initial 10–15 s. From that moment until the 25-s mark, a sharp and fast recovery was noted. This trend was maintained until the ∼50-s mark. Afterwards, there was a tendency for the HR rate recovery to decrease over time (but not the V̇O2, which maintained the previous rate of recovery). A study by Baiget et al. 35 demonstrated the actual HR and V̇O2 profile of elite-level tennis players during simulated tennis matches. Despite noticing ups and downs in both variables, one cannot rigorously indicate the recovery time between points. However, in other sports (specifically soccer and hockey) that are also characterized by short-term recovery, athletes have shown to recover their HR quite similarly as our tennis players until the 30-s mark. 36 After the initial 30 s, these athletes were able to maintain their rate of recovery until the one-minute mark (the deflection point is maintained until the one-minute mark). Conversely, the athletes analyzed in the present study are not under the initial deflection point nearly after the 45-s mark. This can be due to: (i) differences in age (our sample consisted of younger players); (ii) sport-specific physiological demands, and; (iii) differences in the physiological profile (our sample had a meaningfully lower maximum V̇O2). Indeed, it was observed that athletes with a higher maximum V̇O2 recovered their HR faster at the 10-s and 30-s mark than those with a lower one. 36 Thus, it is possible to confirm that in a sport that allows a 25-s recovery time between points, a higher V̇O2max can be determinant for a faster recovery within such time.
Overall, it must be highlighted that tennis players significantly recover their HR and V̇O2 after 25 s, and even with a larger magnitude until the 35th second. After that moment, recovery starts to decrease. Thus, whenever the 25-s rule is broken, they are significantly enhancing their physiological profile. It was also observed that until the 65th second of rest, players recovered their HRreserve and V̇O2reserve in 41.47% and 45.69% (level 1), 34.77% and 55.22% (level 2), and 29.18% and 55.42% (level 3), respectively. As mentioned above, the tennis officials should enforce this rule not providing an advantage to one player if he/she is delaying the time between the points. Additionally, this can also give insights about the recovery profile of tennis players between matches where a 90-s rest is allowed. Coaches and players should be aware of the importance of this data for the periodization of their training. Training sets that elicit an increase in V̇O2max may be helpful to increase the rate of recovery based on a higher aerobic fitness.37,38 As the main limitations, it can be considered that the duration of points during an official game may be substantially lower than the duration simulated in this study to increase and stabilize HR and V̇O2. Players may reach such specific values of HR and V̇O2 after the long rallies only. The average rally time is about 5–7 s, and more than 60% of rallies are finished within four to five shots.13,39 Moreover, accumulated fatigue was not considered in the present study. Thus, future studies may be conducted where: (i) players’ fatigue is considered, and testing the players’ recovery after a set of exercises at different intensities, and; (ii) understand this recovery phenomenon in several competitive levels and categories in both sexes.
Conclusion
Junior tennis players were able to significantly recover their HR and V̇O2 in the initial 25 s of recovery. From the 25-s mark onwards, players were still able to significantly recover their HR and V̇O2 every 10 additional seconds at all three levels of intensity. Moreover, the first 35-s mark seems to be crucial, that is, the first 10 s after the 25-s mark allowed. From this mark onwards, the recovery rate tends to decrease. At least in junior players, exceeding the 25-s mark allows them to elicit (consciously or not) their physiological profile. Tennis officials should be aware of this phenomenon, because during a tennis match, players try to have some extra time for recovery. This is a situation that happens in all tennis levels and categories. Allowing tennis players to get extra time has a direct and positive effect on their recovery, which can indicate an advantage.
Footnotes
Acknowledgements
This work is supported by national funds (FCT - Portuguese Foundation for Science and Technology) under the project UIDB/DTP/04045/2020.
Declaration of conflicting interests
The author(s) declared no potential conflicts of interest with respect to the research, authorship, and/or publication of this article.
Funding
The author(s) disclosed receipt of the following financial support for the research, authorship, and/or publication of this article: This work was supported by the Fundação para a Ciência e a Tecnologia (grant number UIDB/DTP/04045/2020).