
Abstract
The aim of this study was to model the cycling displacement under uncontrolled outdoor conditions with a wearable sensor and different meteorological measurement methods. One participant completed eight courses of a distance of 9.2 ± 2.4 km with varied profiles and directions. Data were recorded every second with a power meter, a GPS and a speed sensor. The aerodynamic drag coefficient, measured by a Notio wearable sensor, and the meteorological variables provided by the Notio, a Kestrel fixed meteorological station and the OpenWeather website were integrated into the Martin mathematical model to calculate the theoretical power output. The power calculated by the model on the basis of data from Notio, Kestrel and OpenWeather were, respectively, 1 ± 4 W higher, 7 ± 15 W lower and 67 ± 111 W higher than the power measured by the sensor. The overall RMSE and R2, including 7325 data points, were 12.8 W and 0.77 (p < 0.001), respectively, between the power output measured by the sensor and the power output modelled with the data from Notio. The use of the model with the wearable sensor was more precise mainly due to the relative wind measures at all points of the course. Therefore, the Notio can be useful for coaches to follow the evolution of the CdA of athletes on the field. Moreover, the model has the potential to predict the time of a cyclist just before a time trial in order to optimise his pacing strategy taking into account actual weather conditions.
Introduction
In cycling, a performance is generally characterised by the ability to cover a certain distance in a minimum amount of time in order to be faster than other competitors. The cycling speed depends on the mechanical power output and on resistive forces opposed to the displacement of the individual.1–5 These resistive forces include the aerodynamic drag (Fair), the rolling resistance (Froll), the frictional resistance (Ffriction), the braking force (Fbrake), and the changes in kinetic (Faccel) and potential (Fslope) energies to accelerate or raise the cyclist's centre of mass, respectively (Figure 1).1,3,5 The relative importance of each resistance depends on the individual, the bike configuration and the conditions of practice. The Fair is related to the coefficient of aerodynamic drag (CdA) and of the wind.6,7 The Froll, which represents the contact forces between the ground and the tyres of the wheels, is affected by the road surface, 8 the vertical force applied to the tyres and the tyre inflation pressure. 9 The Ffriction corresponds to the frictional losses at the bearing and transmission chain and is generally considered negligible. 4 The Fslope is caused by the force of gravity and depends on the road gradient and the total mass of the rider, bike and material. Finally, the Fbrake and Faccel are due to variations in speed during displacement, in particular slowing down before and accelerating after bends.
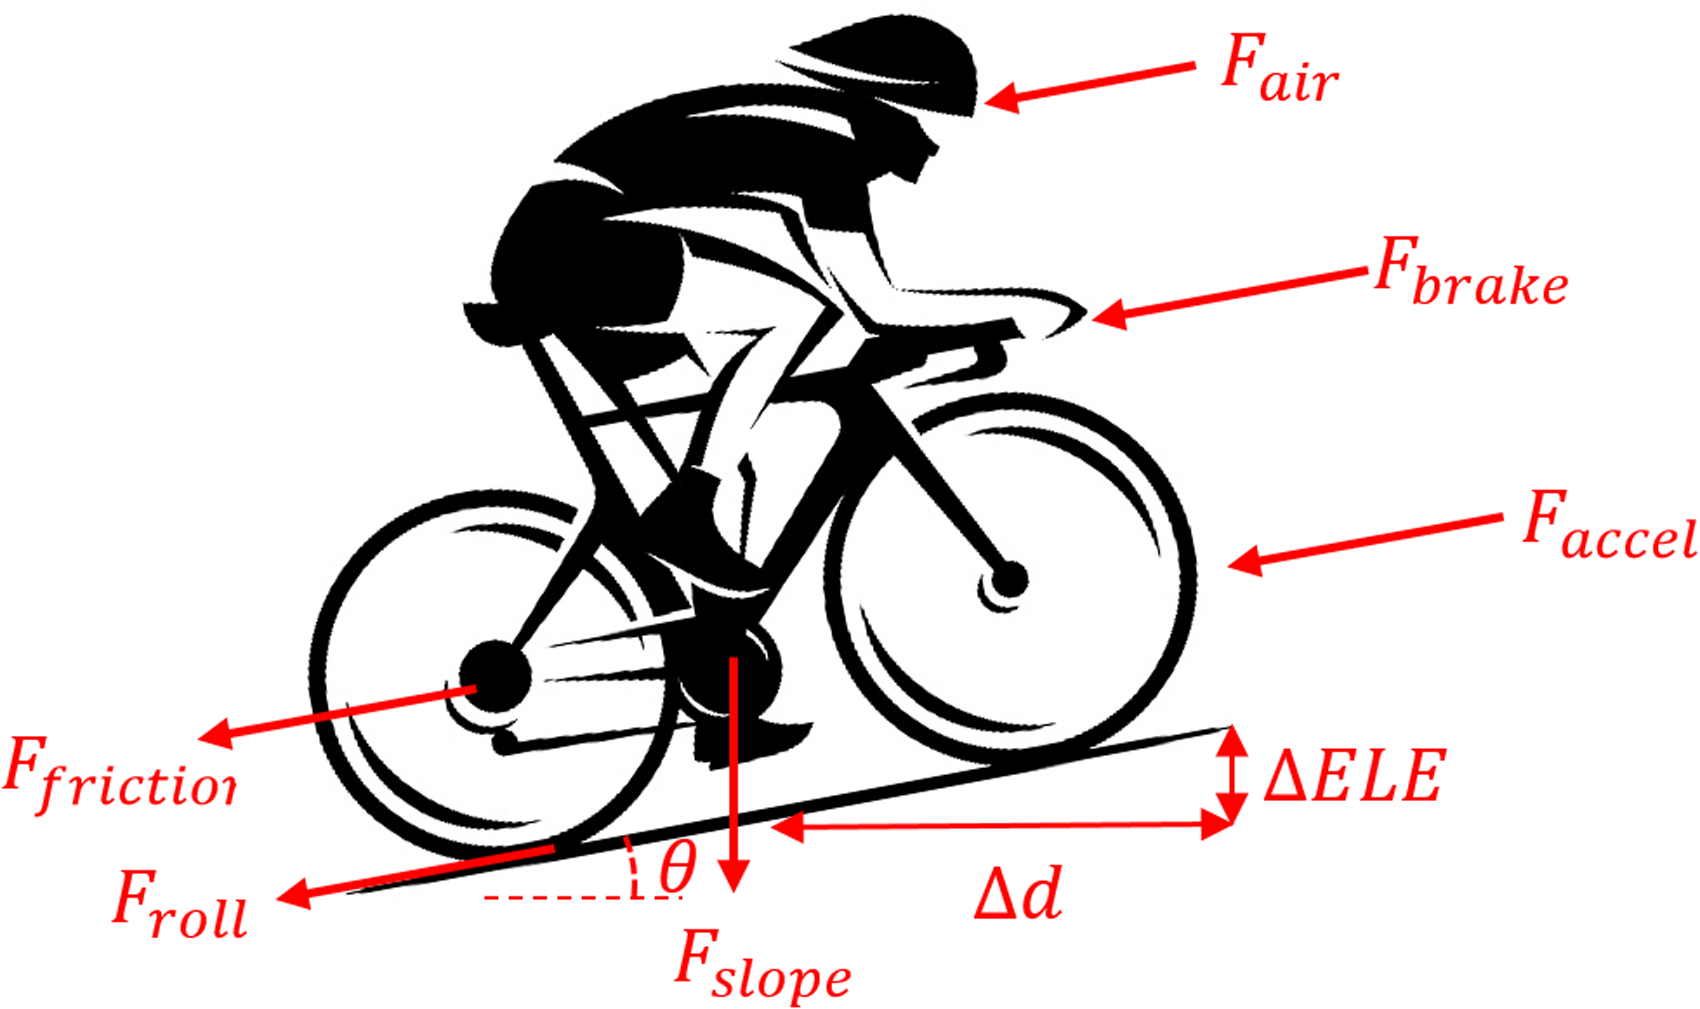
Resistive forces opposed to the advancement of the cyclist.
All these variables can be measured in different ways and be included in a mathematical model to obtain the relationship between power output, speed and resistance, or to determine the extent to which alterations can influence performance.1,2 Thus, authors have proposed a model to predict power output based on fundamental engineering and physical principles, and have demonstrated its accuracy in submaximal 1 and sprint 2 conditions. In the first study, the model was tested on a straight taxiway of an airport road and the participants performed a distance of around 500 m with a road gradient of 0.3% at different cycling speeds (7, 9, 11 and 12 m/s). The second study was carried out on an indoor track and participants performed a maximal standing-start time trial of 500 or 1000 m.
The mathematical model is often used in velodromes to evaluate cycling aerodynamics while considering the natural posture used by the individual during training and competition. 6 This indirect method is also more easily accessible for cyclists and bike fitting professionals compared to wind tunnel or computational fluid dynamics (CFD).7,10 The use of the model in indoor velodromes (without wind and changes in kinetic and potential energy) is valid, reliable and sensitive to detect small changes in aerodynamic drag. 11 Based on this type of calculation, a system has been developed to display the aerodynamic drag coefficient in real time (one value per lap) in velodromes (Garmin Track Aero System, Garmin, Olathe, USA). This system is valuable and relevant to measure aerodynamic drag in indoor track with high validity and sensitivity 12 but does not take into account the influence of wind in outdoor conditions. In recent years, companies have proposed technologies, which can be used in outdoor conditions, to provide real-time measurements of meteorological data and analysis of CdA by using a wearable sensor mounted on the front of the bicycle (e.g. Notio, Notio Technologies Inc., Montréal, Canada; Velocomp Aeropod, Stuart, USA). These sensors are composed of a pitot tube, a barometer, a hygrometer and a thermometer, and need to be paired with a power meter, a speed sensor and a GPS sensor. Authors have recently shown a good reliability and a strong correlation between the mathematical model, the Track Aero System and the Notio to measure CdA in an indoor velodrome. 13 A subsequent study has confirmed the reliability of the Notio in an indoor velodrome and has shown that this technology can detect small changes in CdA (1.2%). 14 In addition, the CdA calculated during field tests on a straight and flat road of 400 m with the mathematical model integrating meteorological data of a Velocomp Aeropod would be consistent with the values from wind tunnel testing. 5 However, none of these studies tested the validity of this type of device under real and uncontrolled conditions when the cyclist must face the force of the wind and ride at different speeds on varied courses made up of turns, climbs and descents.
In outdoor conditions, a study has shown that the model can estimate uphill power output with a bias less than 1% but with a random error between 6% and 10%. 15 These authors observed that the CdA (estimated without accurate data) and the wind (measured with an anemometer at the middle of the trial) are the most confounding factors to estimate power output. Despite the complexity of validating the CdA measured in outdoor conditions with a gold standard (wind tunnel), it is possible to use the CdA and meteorological variables measured with a wearable sensor in the model and to identify if the power output can be modelled with precision.
The aim of this study was therefore to model cycling using a wearable sensor and two other meteorological measurement methods under uncontrolled outdoor conditions. We support the hypothesis that real-time data from a wearable sensor can accurately model the cycling displacement and that the accuracy of this modelling is highly dependent on the meteorological measurement technique.
Materials and methods
Participant
One male cyclist of recreational level, based on the categorisation of Priego Quesada et al., 16 volunteered to participate in this study (21 years old, 65 kg, and 1.80 m). Before the experiment, he was informed of the risks and benefits of the study, and provided written informed consent. The study was approved by the ethics committee for research involving humans of the local institution in accordance with the Declaration of Helsinki and was conducted in agreement with the ethical guidelines. 17
Protocol
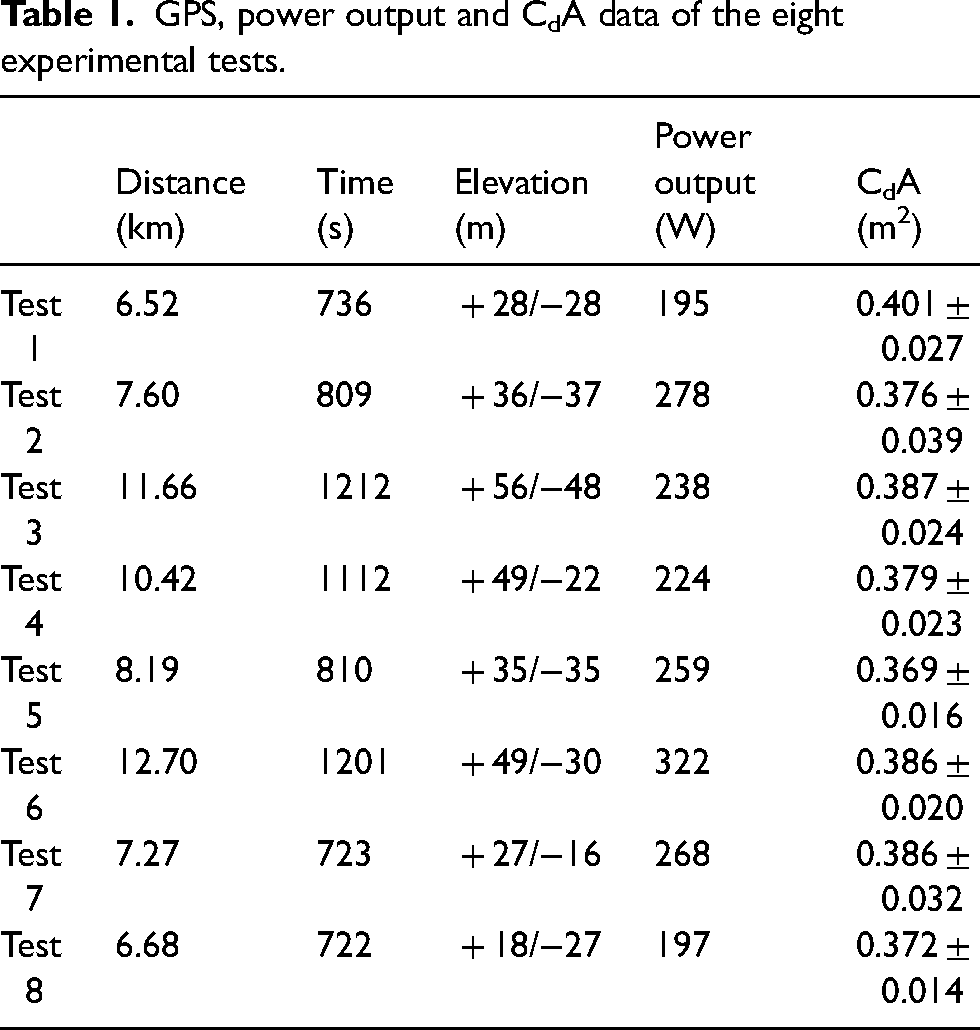
Eight different routes of a distance between 6 and 13 km, and with various profiles and directions, were chosen (Table 1). The roads had a good quality surface (homogeneous asphalt) and were located approximately 60 m above sea level. The participant completed eight trials on the selected courses on different days and at different times. During the rides, he was not forced to brake because of turns or obstacles. The tests were carried out on the participant's personal road bike with a tyre inflation pressure of 700 kPa. The total mass of the cyclist (with clothes) and his road bike was 73 kg. The participant was instructed to ride in the position he generally used for training (hands on the brake hoods) for the duration of the tests. Only one cyclist participated because the aim of the study was to assess the effect of the meteorological measurement method (not athlete-related parameters) on cycling modelling.
GPS, power output and CdA data of the eight experimental tests.
Material and measures
The bike was equipped with a GPS (Garmin Edge 520, Software Version 13.00 and GPS Version 3.30), which was paired with a speed sensor (Garmin) and a power meter (Pioneer SGX-CA500, Firmware 20180531.02.59, Pioneer, Tokyo, Japan). The validity of the power meter was tested before the experiment using a standard load of 14 kg (137 N) (Troemner Metric Weight, Troemner, Thorofare, USA). The load was applied on each pedal when the crank arm was at 0°, 90°, 180° and 270° and the radial and tangential forces were measured when the crank arm was in the vertical and the horizontal positions, respectively. The mean percentage of error was 0.2% for the tangential force and 4.9% for the radial force. However, only tangential force is effective and participates in the production of power output, and therefore the power meter was considered as valid and accurate. It was then calibrated before each use, following the manufacturer's recommendations. A Notio (Firmware V6.0.99), also calibrated according to the manufacturer's instructions, was installed at the front of the bicycle and was paired with the Garmin GPS and speed sensors so that the device had access to power output and speed data throughout the tests. During each ride, meteorological variables (temperature, pressure, wind speed and wind direction) and an average value of CdA were measured by the Notio sensor at a sampling frequency of 4 Hz. A portable meteorological station (Kestrel 5500 Weather Meter, Kestrel, Boothwyn, USA) was placed at the starting point and recorded the same meteorological variables with a sampling frequency of 0.20 Hz. The manufacturer states that the Kestrel station has been validated against standards traceable to the National Institute of Standards and Technology or other calibrated standards. Thus, the various sensors have:
- Uncertainty of ± 1.04% within an airspeed range of 3.59–19.93 m/s and ± 1.66% within an airspeed range of 0.85–3.59 m/s, - Compass output accuracy of ± 5°, - Temperature uncertainty of ± 0.40 °C, - Relative humidity uncertainty of ± 1.0%, - Barometric pressure uncertainty of ± 0.3 hPa.
In addition, the data were collected from the OpenWeather website (London, United Kingdom), using the weather data closest to the tests (averaged every 30 min). This website uses the nearest airport station based on a METeorological Aerodrome Report (METAR), which was located within 10 km of the various routes taken.
Theoretical model
General equation
The model was based on the relationship between power output, speed and resistive forces, which were expressed through
Analysis of GPS routes and speed data
The use of the model in outdoor conditions required GPS data containing information on latitude, longitude and elevation for each coordinate point of a course. The distance between two points represented a segment. The direction of the segments was used to calculate the wind velocity relative to the direction of the cyclist (equation (14)). The speed of each segment was measured with the speed sensor. Then the distance (equation (5)) and, subsequently, the road gradient (equation (9)) were calculated. The speed was used to calculate Fair (equation (10)) and Faccel (equation (18)), and the slope to determine Froll (equation (16)) and Fslope (equation (17)).
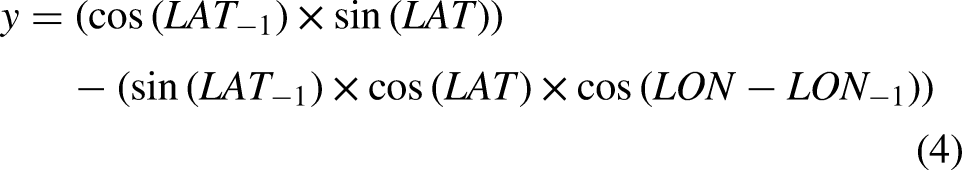
The direction of a segment (Figure 2) was obtained by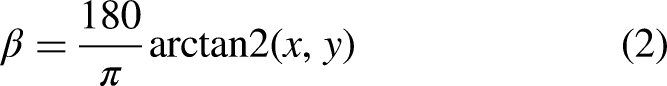

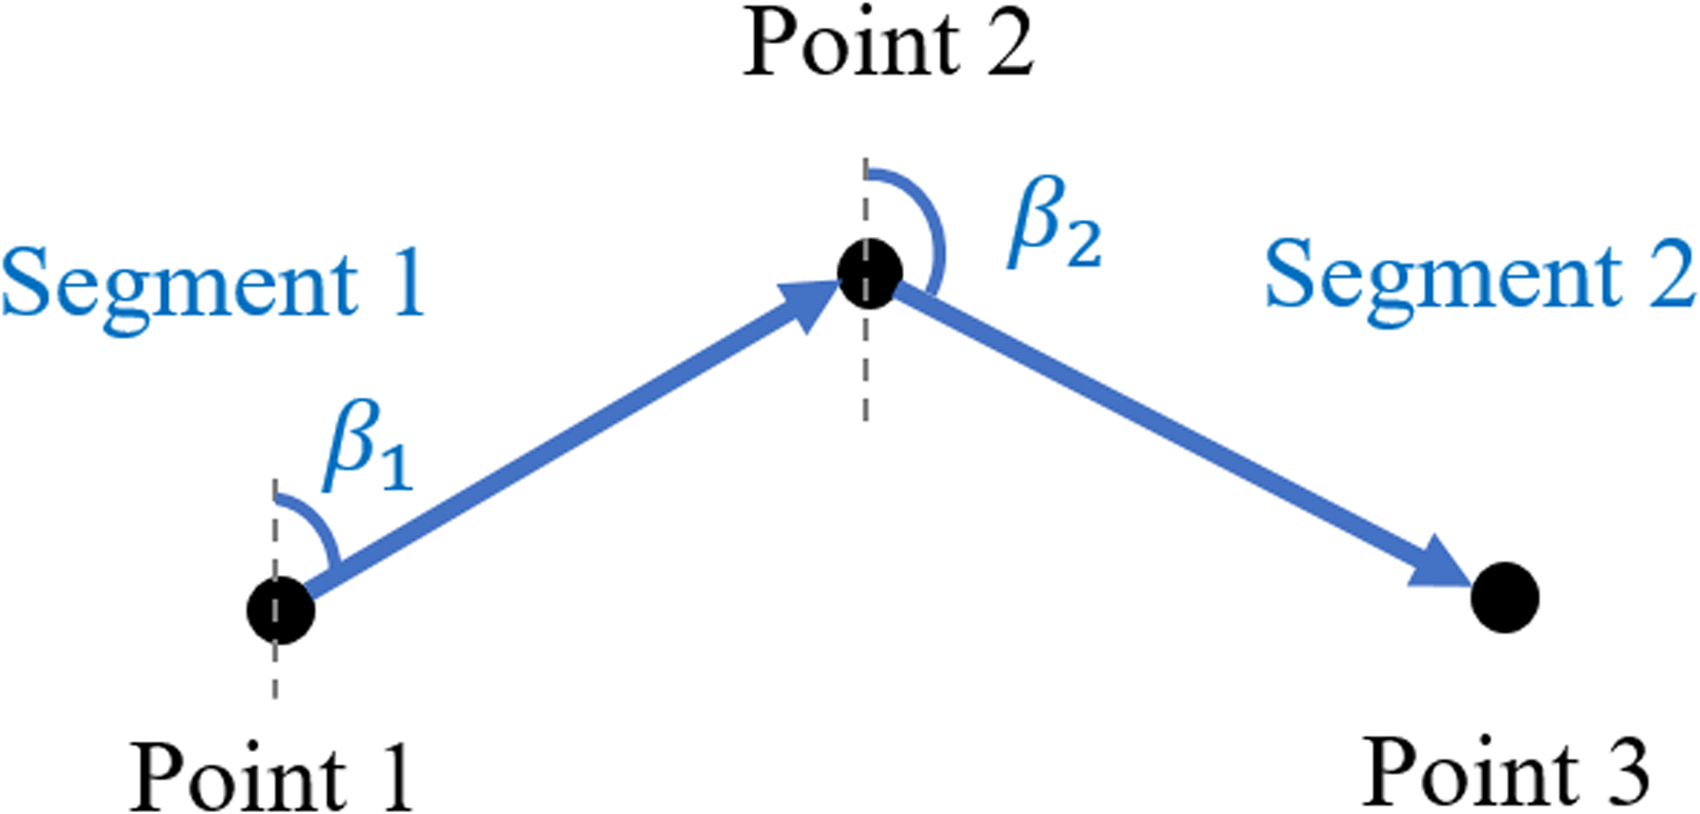
Direction of a segment.
In the current study, the velocity of each segment (m/s) was obtained with the Garmin speed sensor. The distance of a segment (m) was then calculated with the following equation:
In a predictive context, the distance of a segment can be obtained using the latitude and longitude coordinates of two points using the following equation: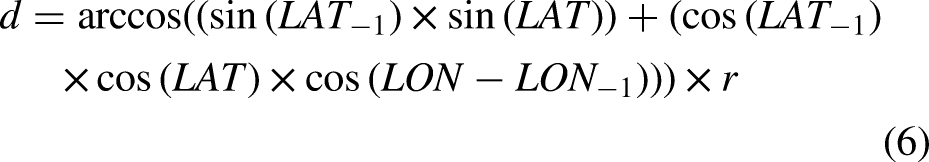
The speed between two points can then be obtained using the following equation: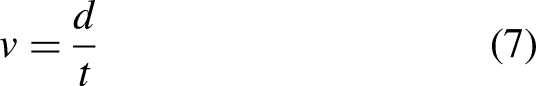
The slope between two points was found from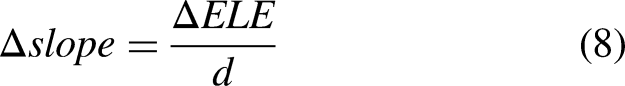
The angle of inclination was determined by
Determination of Fair
The Fair was determined from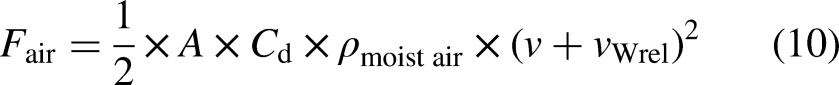
The CdA was experimentally measured with a wearable sensor (Notio) during each ride.
The density of moist air was obtained using the following equation: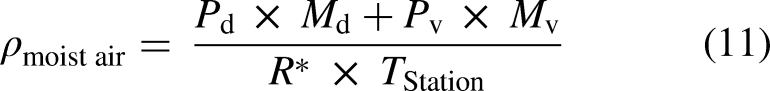
The pressure of water vapour was obtained from
The partial pressure of dry air was then found from
The OpenWeather station provided the barometric pressure (adjusted to the mean sea level). Therefore, a correction was applied through the following formula: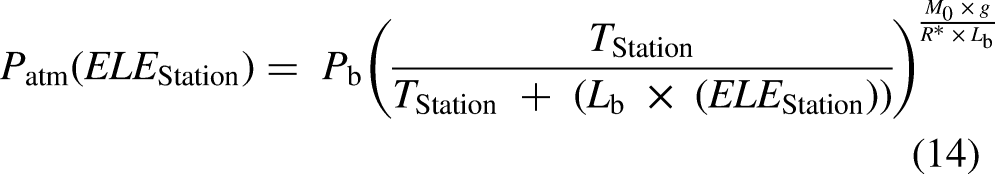
The relative wind velocity (Figure 3) was calculated with the data from the Kestrel and OpenWeather stations with the following equation:
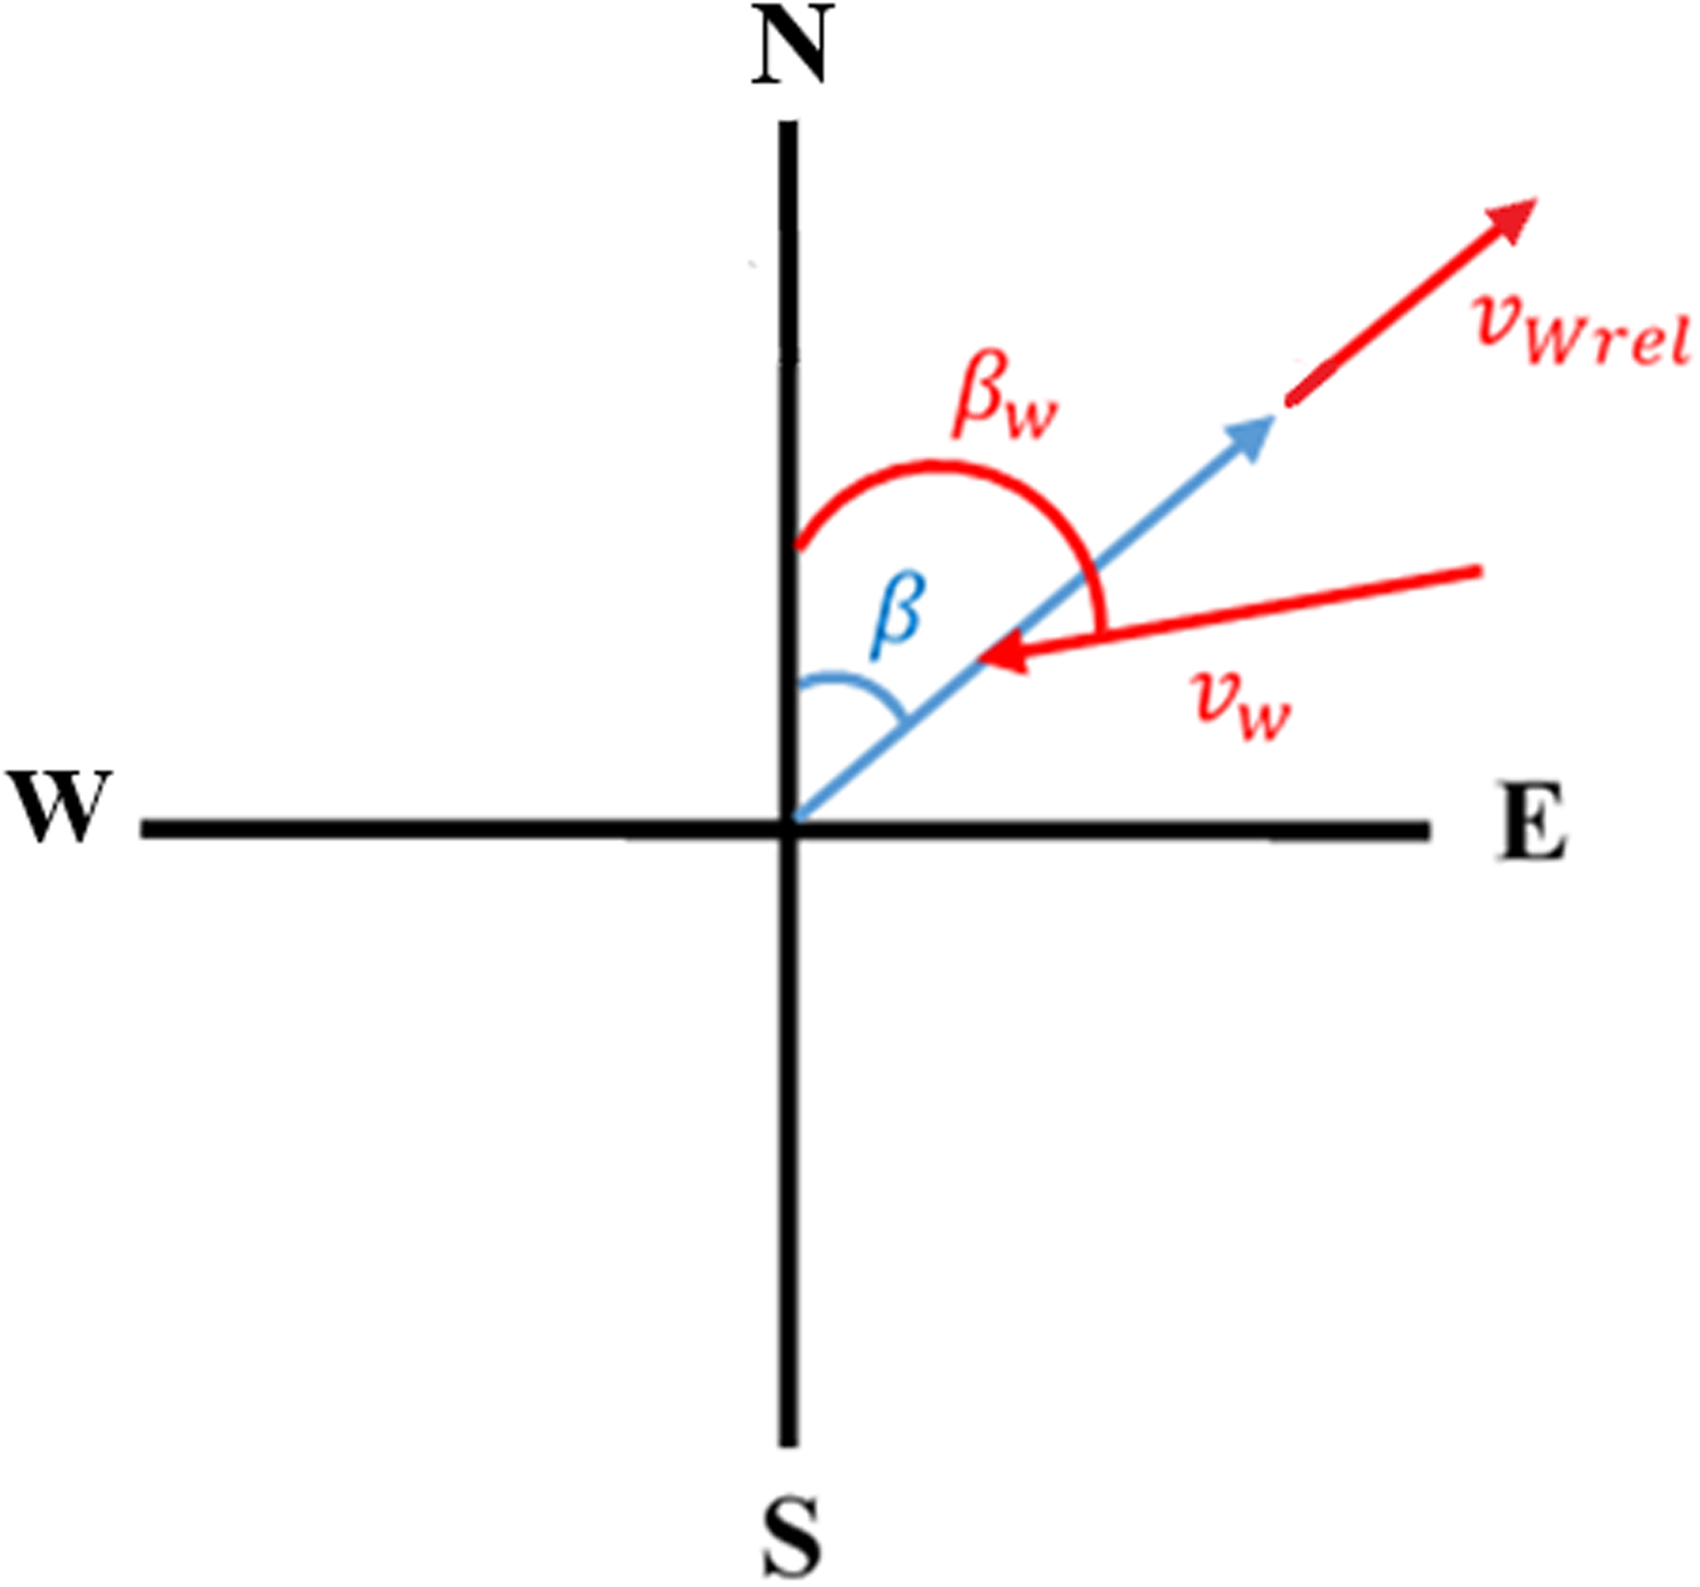
Angles and vectors used to calculate the relative wind velocity.
Determination of Froll
The Froll was determined by
Prior to the experiment, several tests were performed on the roads taken in the study and we identified that the coefficient of 0.004 was the most appropriate. During the study, we have then confirmed that the rolling coefficient of 0.004 minimised the model error by calculating the root mean square error (RMSE). This coefficient is in agreement with the literature 9 and was therefore used in the model.
Determination of Fslope
The Fslope was determined by
Determination of Faccel
Changes in kinetic energy were determined by
The acceleration of the cyclist between two points of a given segment was obtained with the following equation:
where Δv is the variation of velocity between two coordinate points (m/s), and Δt is the duration of the segment (1 s).
Model resolution
All of these variables were integrated into the model and the equation was rearranged to obtain a cubic equation.
Statistical analysis and simulation
The data in the text and figures are presented as mean ± standard deviation (SD). To measure the discrepancy between power output measured by the power sensor and power output calculated with the model based on the data from Notio, Kestrel and OpenWeather, Bland and Altman tests were performed by calculating the biases and limits of agreement. 21 Then, Bland and Altman tests were carried out to measure the discrepancies between meteorological variables (relative wind, temperature, pressure, humidity and air density) from the Notio wearable sensor and from the two other meteorological sources (Kestrel and OpenWeather). Simulations were carried out with test 2 to identify the extent to which the different input variable measurements can affect the model. Relative wind, temperature, pressure and humidity were modified by, respectively, ± 8 m/s, ± 4 °C, ± 800 Pa and ± 20%. Finally, the measured power output was compared to the power output modelled with the data from Notio throughout the eight rides after filtering the power with a moving-average filter over a 30 s window. The quality of the regression analysis was evaluated with the coefficient of determination (R2) and RMSE. The implementation of the model and the resolution of equations were performed in Matlab (MathWork, Natick, USA), and statistical analysis was carried out in Matlab and Excel (Microsoft, Redmond, USA).
Results
Table 1 shows the characteristics of the eight selected rides and the time, power output and CdA of the participant during each test. The total distance and time were, respectively, 71.4 km and 7325 s, which means 7325 data points of analysis.
Figure 4 presents the discrepancy between the power output measured with the power meter and power output calculated with the model based on Notio, Kestrel and OpenWeather data. The modelled power output was 1 ± 4 W higher with the Notio (range: −4 to 7 W) (
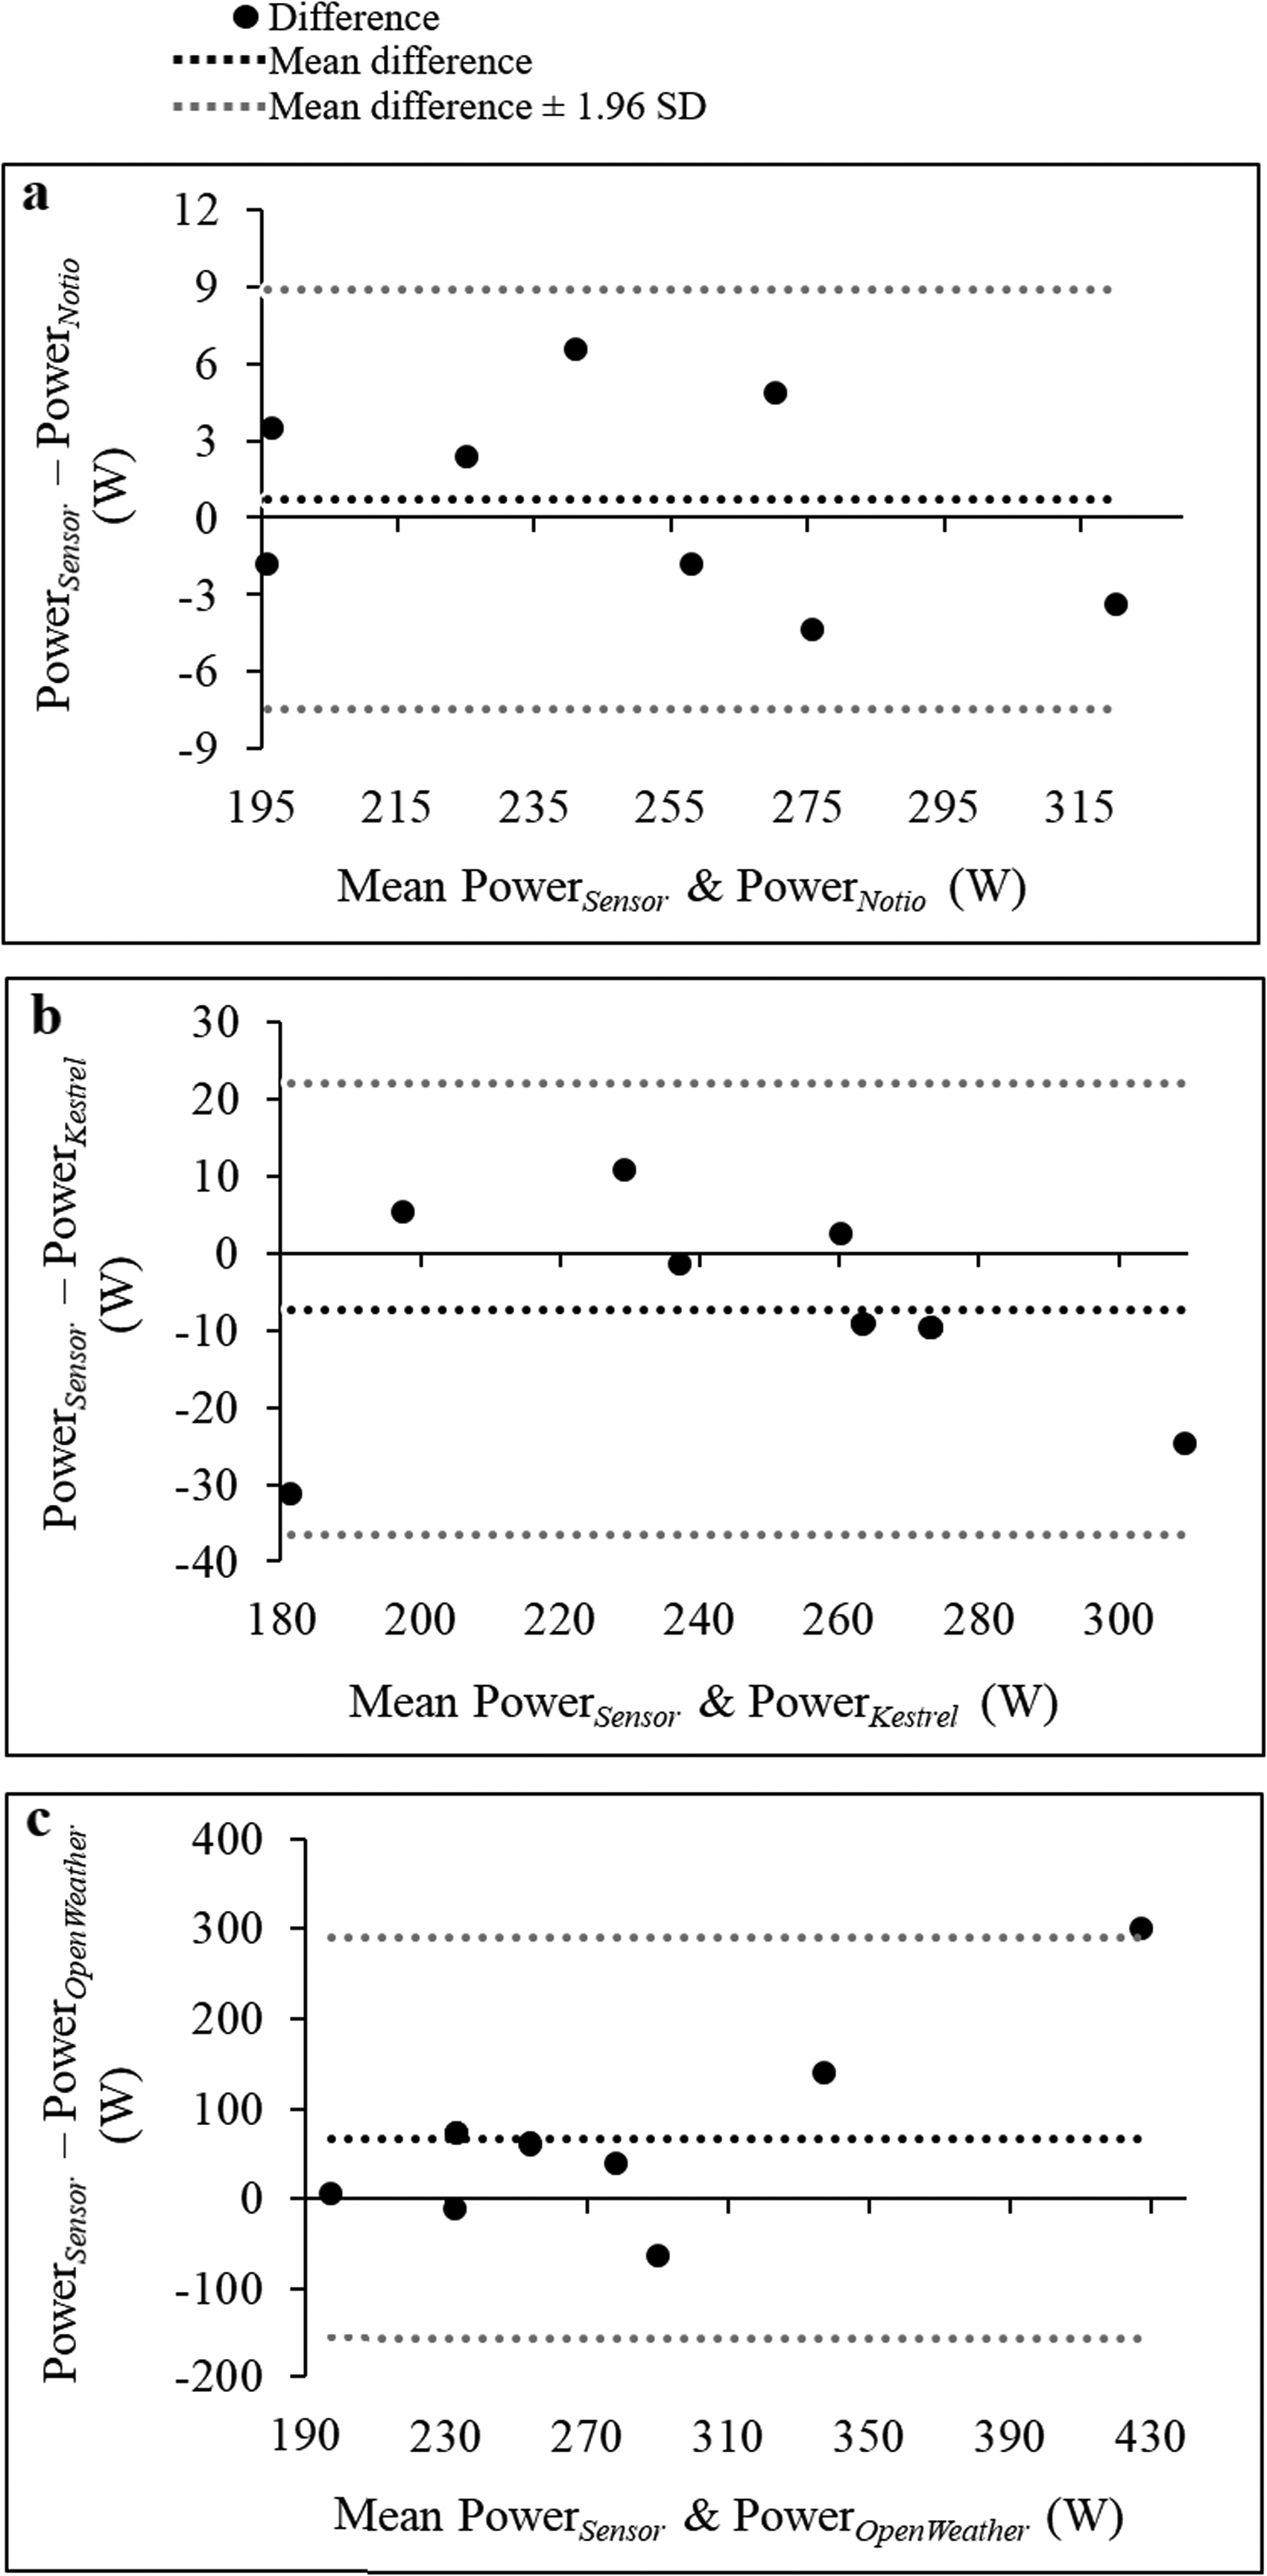
Bland and Altman box plot illustrating the discrepancy between the power output measured with the power meter and the power output calculated with the model based on (
Figure 5 shows the discrepancy between the relative wind measured with the Notio and that calculated with the Kestrel and OpenWeather data. The relative wind coming from Kestrel was 0.2 ± 0.3 m/s lower (range: −0.9 to 0.2 m/s) (
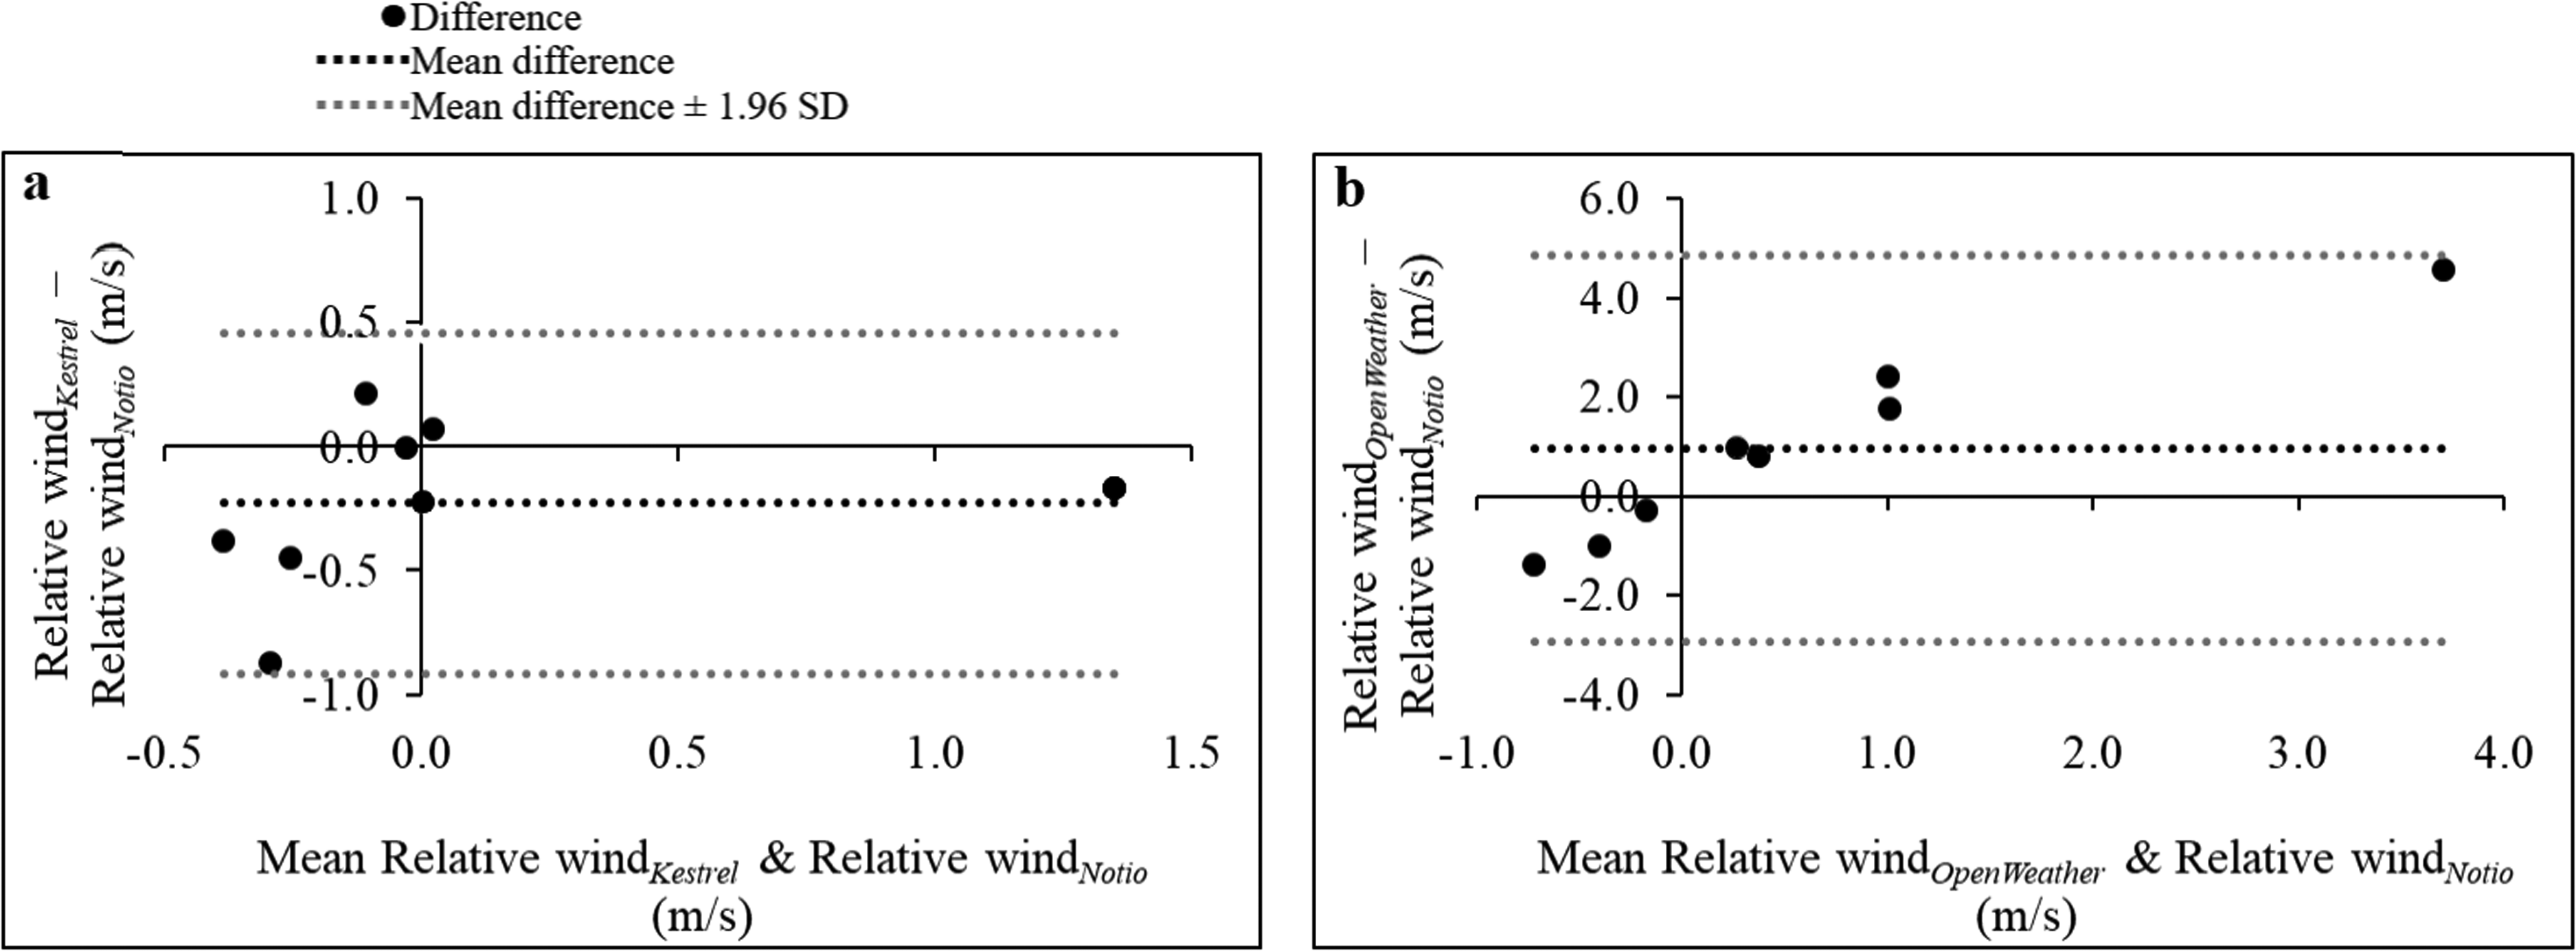
Bland and Altman box plot illustrating the discrepancy between the relative wind measured with the Notio and the Kestrel data (
Figure 6(a) and (b) presents the discrepancies between the temperature measured with the Notio and that obtained with the Kestrel station and the OpenWeather website. The temperatures from Kestrel and OpenWeather were lower by, respectively, 1.7 ± 0.4 °C (range: −2.2 to −1.1 °C) (
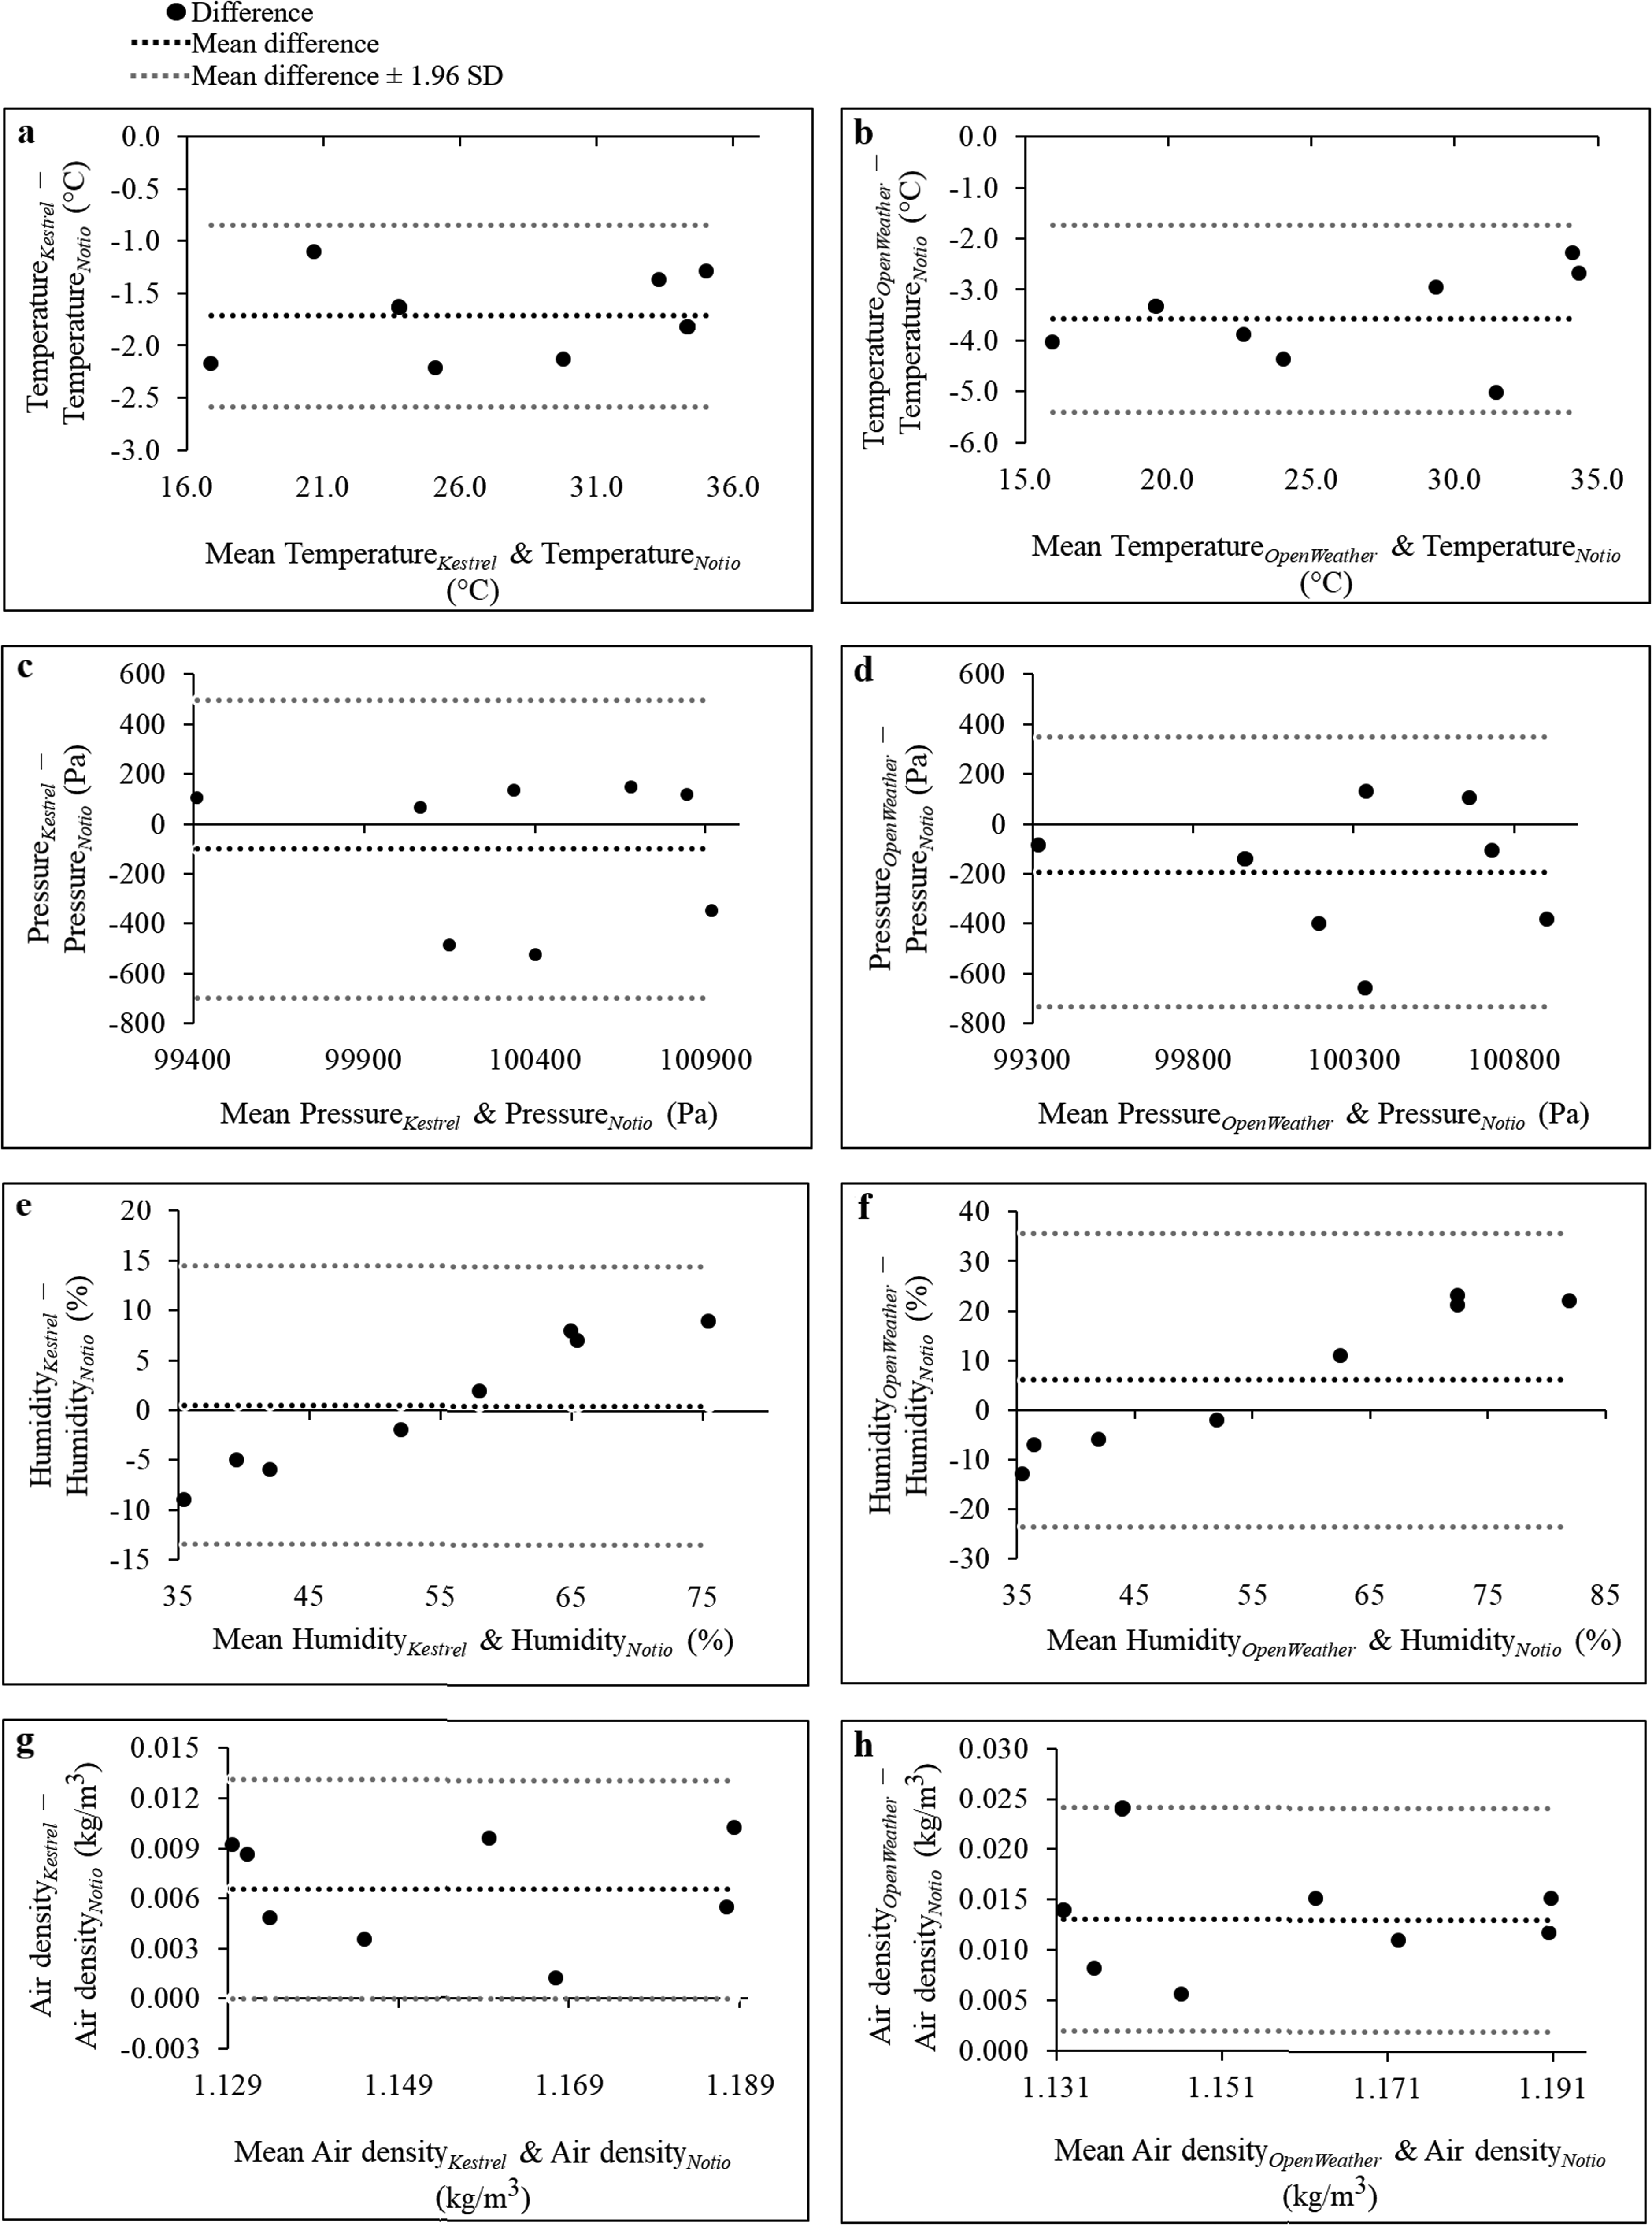
Bland and Altman box plots illustrating the discrepancies between the temperature, the air pressure, the humidity and the air density measured with the Notio and the Kestrel station (
Figure 7 presents different simulations performed with the Notio values of test 2 in order to determine to what extent the error on meteorological parameter measurements during each segment can affect the modelled power output. Relative wind has a large impact on the power output. Indeed, power output increases of 210 W when relative wind increases of 4 m/s. In addition, the power output increases linearly when the pressure increases, and decreases linearly when the temperature decreases for extreme temperature and pressure in the testing conditions (2–3 W). The relative humidity has a trivial impact on the modelled power output (maximum 1 W).
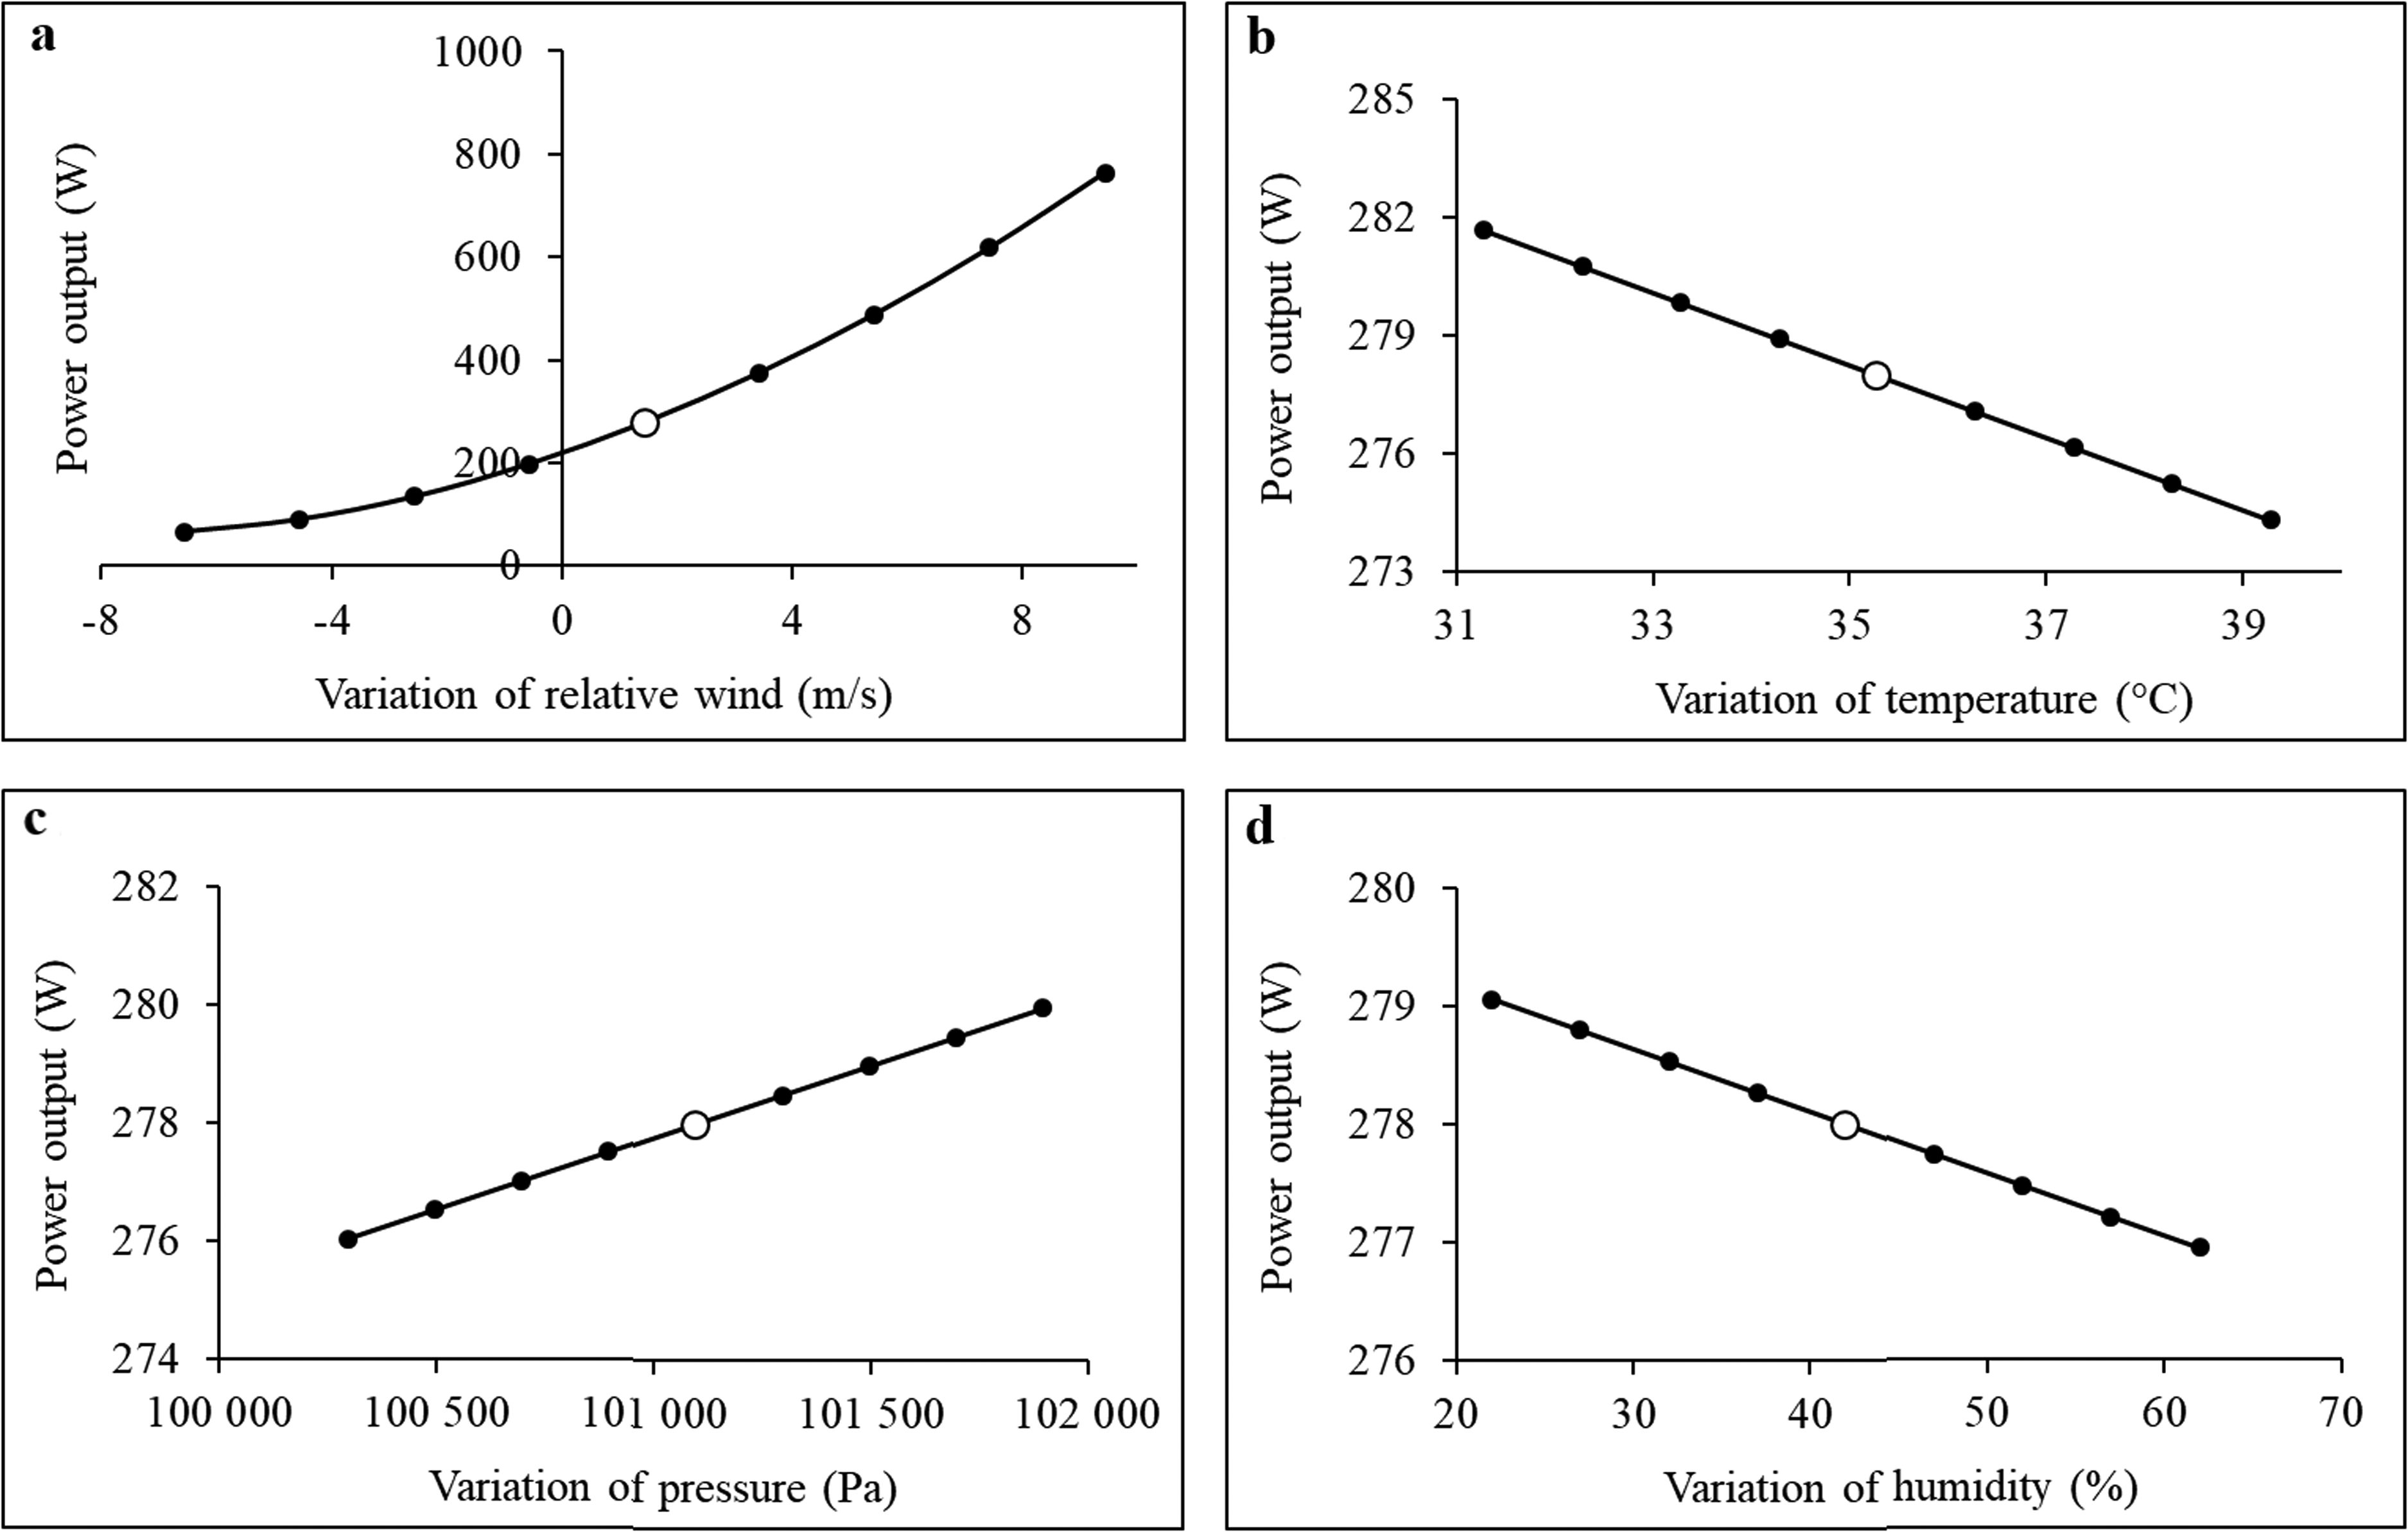
Impact of variation of relative wind (± 8 m/s) (
Figure 8 shows the measured power output and the modelled power output based on the data of Notio throughout the eight rides. The weighted averages of the RMSE and R2, including the 7325 data points from the eight rides, were 12.8 W and 0.77 (p < 0.001).
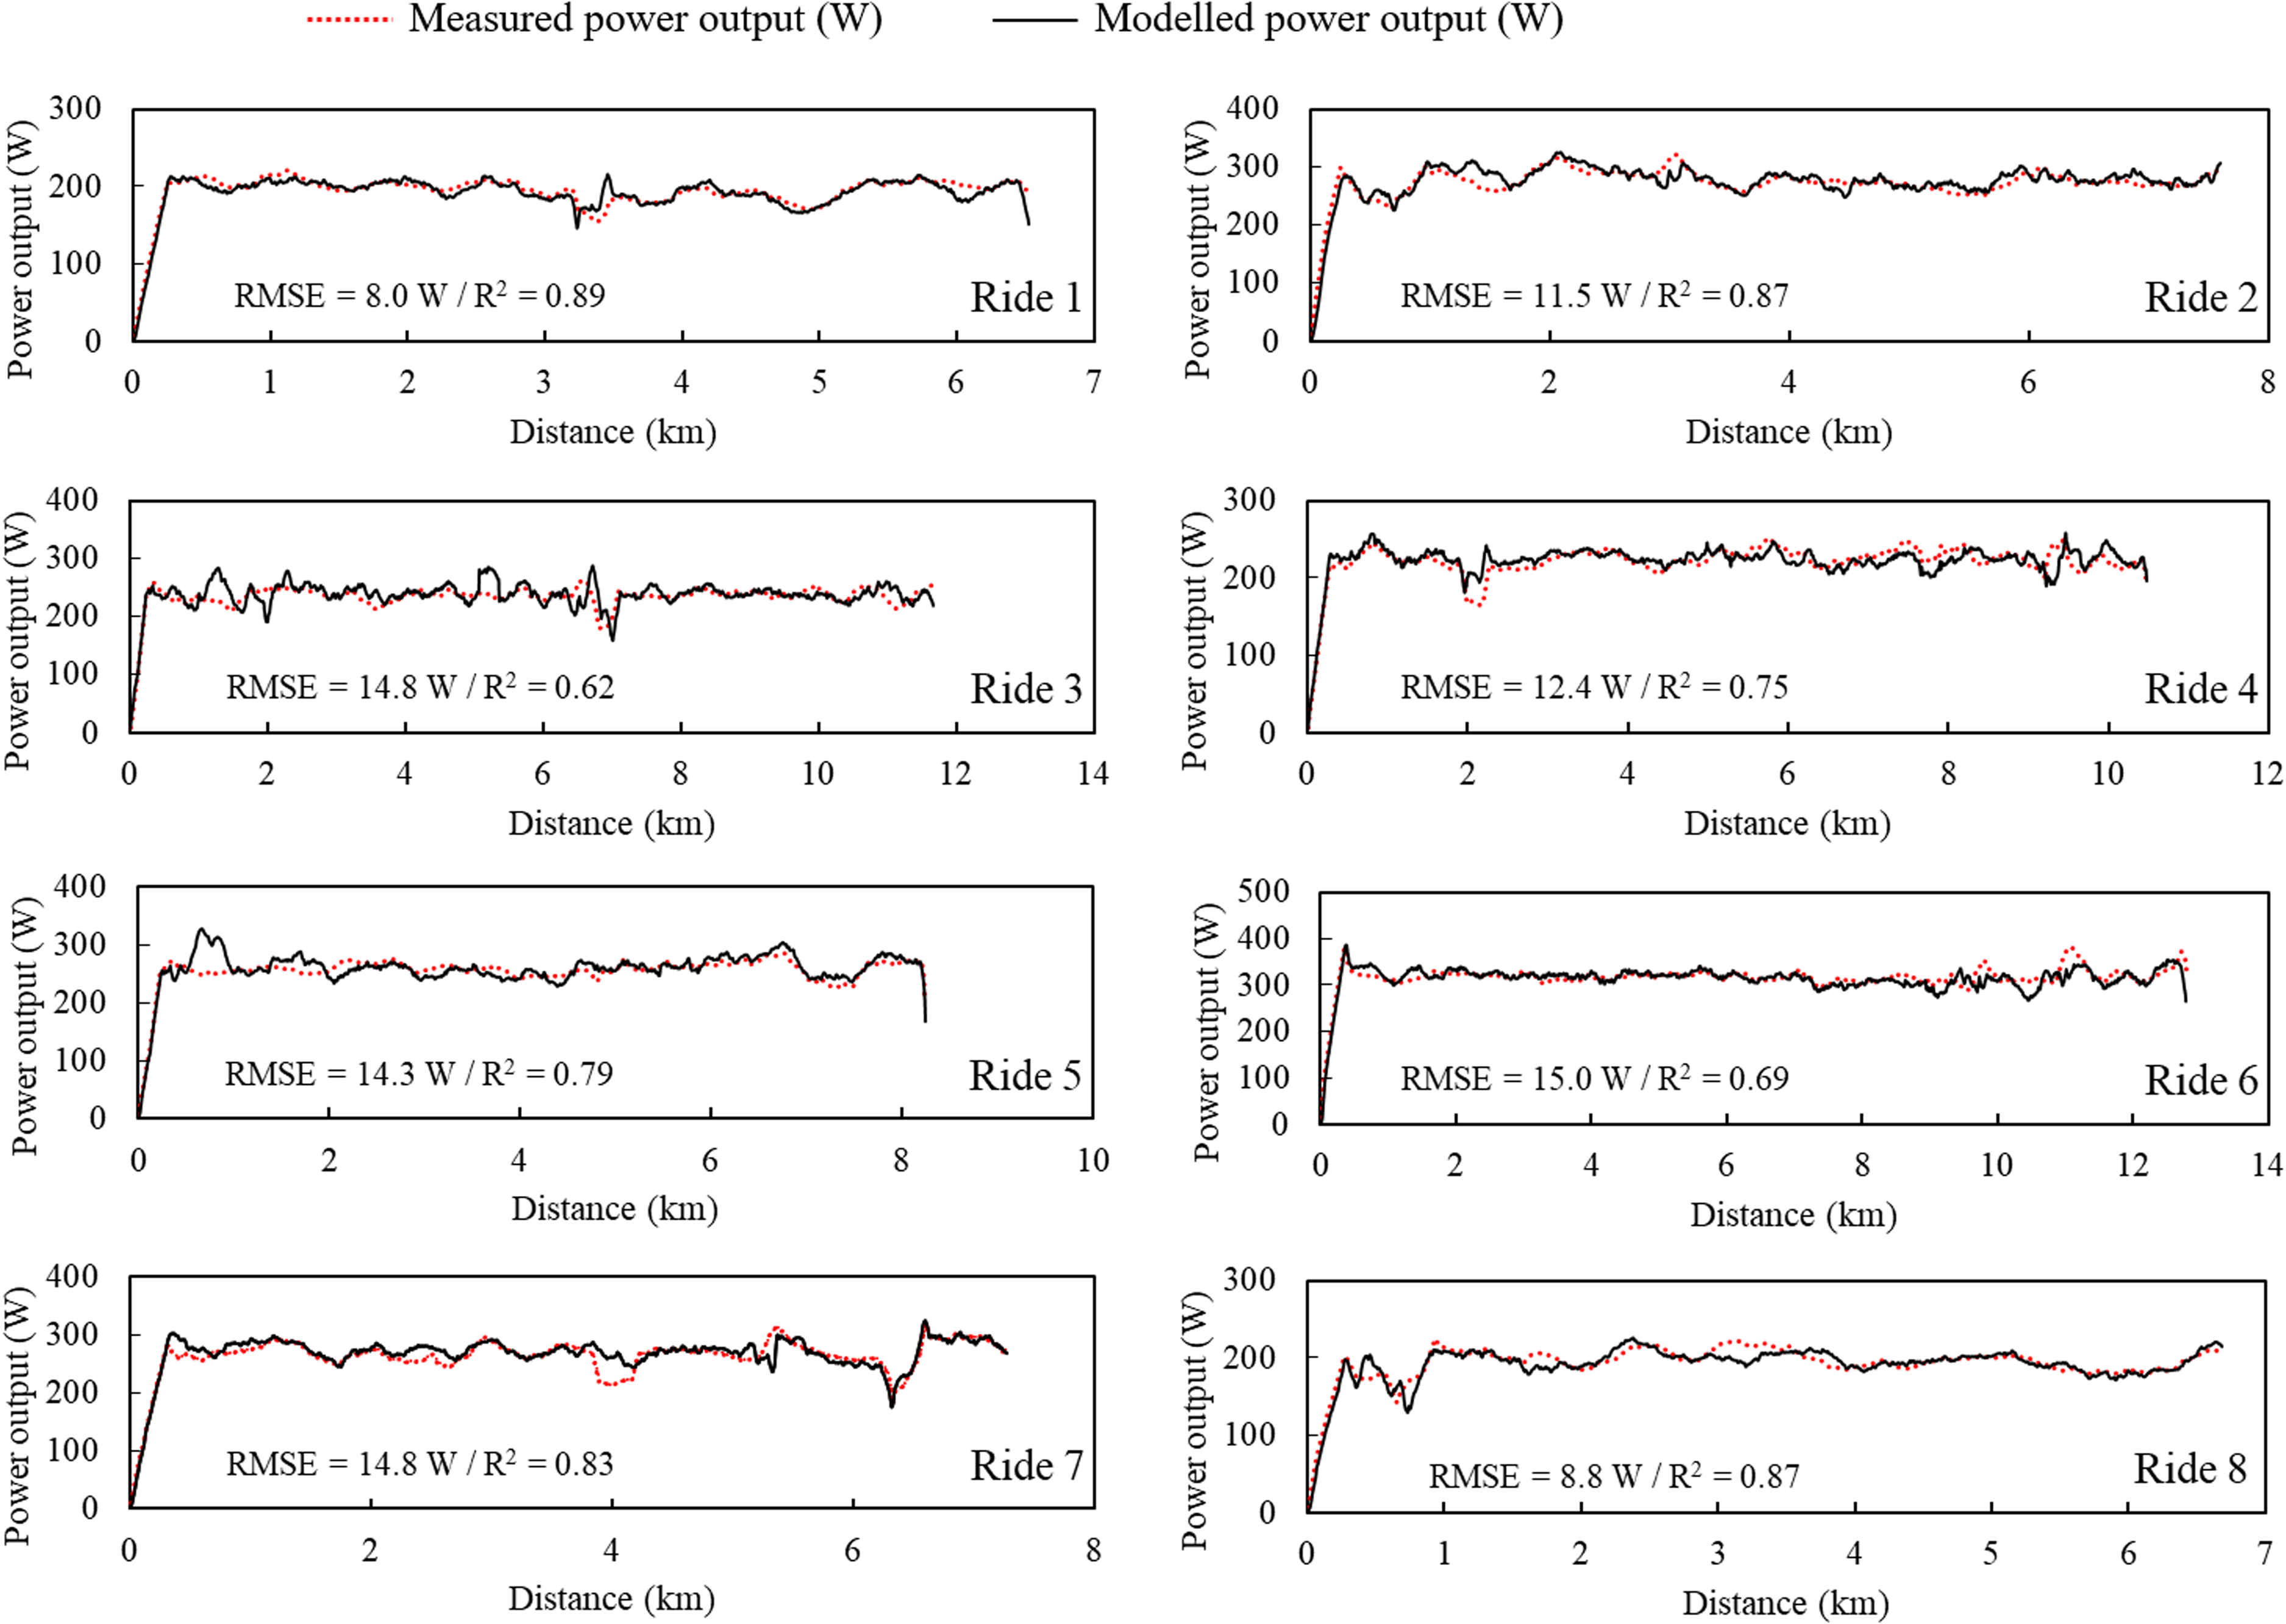
Comparison between the measured power output and the modelled power output with the data from Notio throughout the eight rides. The quality of the regression was assessed with the root mean square errors (RMSE) and the coefficients of determination (R2).
Discussion
The aim of this study was to model the relationship between power output, speed and resistance forces under uncontrolled outdoor conditions with the data of a Notio wearable sensor, a Kestrel portable station and the OpenWeather website. The results support the hypothesis that the embedded technology is more precise, mainly due to the measurement of the relative wind at all points of the ride.
The current study has highlighted that the integration of the CdA measured by the Notio and of the meteorological parameters in the mathematical model can predict power output on different courses with various profiles and directions. Two studies have demonstrated the validity and reliability of the Notio in indoor velodromes to measure CdA and argued in favour of the need to continue research in outdoor conditions to take into account the wind and altitude.13,14 The mathematical model 1 is often used to measure the CdA in indoor tracks in order to avoid the influence of the wind and changes in potential and kinetic energies.10,11 However, neglecting Fslope, Faccel and outdoor meteorological variables amounts to not taking into account the reality of the field when the cyclist should modulate his speed due to the slope of the road, changes in direction or variation of wind force and intensity. Although the current study does not confirm the validity and reliability of the CdA measured by Notio in comparison to a gold standard (wind tunnel), it shows that this technology allows the power output to be accurately modelled. The RMSE of 12.8 W and the R2 of 0.77 show the ability of the model to follow the power output despite the randomness of the chosen courses and the different weather conditions. The integration of weather data from the Kestrel station led to a slight underestimation of the output power, probably because this station did not take into account the variation in wind relative to the terrain on which the cyclist was riding (e.g. absence of shelter from houses and forest). Conversely, the OpenWeather website greatly overestimated power output notably because the METAR indicated the measure of the wind 10 m above the ground. In this context, mathematical models should be applied to estimate the wind at the height of the cyclist, considering the surface roughness. 22 Additionally, the Kestrel station and the OpenWeather website provided lower temperature and pressure and higher humidity than the Notio, each of these variables entering into the air density calculation. 19
Simulations were performed with test 2 by modifying relative wind, temperature, pressure and humidity in proportions representative of the differences observed depending on the measurement tool used. The relative wind measurement had a large impact on the modelled power output, which confirms the findings of Millet et al. 15 The difference between the Notio and OpenWeather wind was 4.5 m/s during test 2, which subsequently induced a difference of nearly 300 W for the modelled power output. Therefore, an accurate measurement of the relative wind seems to be the main challenge for using the model in outdoor conditions. An increase of temperature and humidity and a decrease of pressure have an effect on decreasing air density, inducing a decrease of modelled power output. 19 However, the differences observed between the Notio and OpenWeather led to variations of maximum 4, 2 and < 1 W for the temperature, pressure and humidity, respectively, which appears negligible in comparison to the relative wind impact.
The Notio measures a new value of CdA at 4 Hz in real condition of practice, which is a strength compared to traditional methods restricted to the laboratory (i.e. wind tunnel and CFD). However, future studies are required to assess the reliability and validity of the CdA in comparison with wind tunnel in different wind conditions. Nevertheless, the precise power modelling with this wearable sensor suggests that this tool can be useful for coaches to follow the evolution of the CdA of athletes on the field. Moreover, the positioning of a portable station in a representative place of the ride (totally uncovered or sheltered by houses or trees, depending on the type of route) could be a good option to analyse the performance of a cyclist or to simulate different training and racing conditions. Thus, field experiments could be performed to complete studies that used wind tunnel measurements and CFD to determine the power economy of drafting behind other cyclists or a motorcycle, or to optimise the cyclist sequence in team time trial.23–26 Unlike these different studies, cyclists would be in real conditions and would have to take into account their environment (crosswind, headwind or tailwind) and interact with other individuals. The model can also be used to predict the time of a cyclist just before a time trial and to optimise his pacing strategy considering actual weather conditions. 27
It is important to note that the results of the current study are limited to the experimental conditions. The cyclist used a road position with hands on the brake hoods and rode between 32 and 38 km/h and between 200 and 320 W on courses with small changes in altitude. Additionally, the ranges of weather variables reported by the Notio were as follows: relative wind (−0.2 to 1.4 m/s], temperature (18.0–35.7 °C), pressure (99,362–101,096 hPa) and humidity (40–71%). Further studies could be conducted to increase the range of weather conditions and to test different CdA and environments.
The variability between measured and modelled power output can be explained by different reasons: the integration in the model of an average CdA while the CdA constantly varies (head movement, standing position in climbs, etc.); the use of a fixed rolling coefficient; and not having taken into account the frictional resistance. In addition, the kinetic energy can also include the wheel inertia. However, in the current study, the speed was relatively constant and the mean wheel inertia effect during the eight rides was only 0.0 ± 0.1 W. Moreover, the maximum instantaneous value obtained during the eight rides was on average 6.7 ± 3.0 W. Therefore, wheel inertia was considered negligible and not included in the model. Nevertheless, this study is the first to show that the power output can be modelled with precision in uncontrolled outdoor conditions using a wearable sensor, and to a lesser extent, with a weather station positioned at a point close to the road on which the cyclist is riding.
In conclusion, this study has shown that the cycling displacement can be accurately modelled using the CdA and meteorological data of a Notio wearable sensor under uncontrolled outdoor conditions. These results imply that the Notio can be useful for coaches to follow the CdA of a cyclist on the field. The meteorological measurement method significantly affects the cycling modelling, and, in this context, an accurate measure of the relative wind is essential. To optimise the pacing strategy in a time trial, the model can be used with a weather station positioned at a point close to the route on which the cyclist is riding in order to predict his time a few minutes before the start. However, the use of local meteorological data from websites can generate significant errors.
Footnotes
Declaration of conflicting interests
The authors declared no potential conflicts of interest with respect to the research, authorship, and/or publication of this article.
Funding
The authors received no financial support for the research, authorship, and/or publication of this article.