
Abstract
To date, no studies have investigated the loads undertaken by elite youth footballers outside of their academy commitments. This study aimed to understand the load of English male academy football players' activity both inside and outside of the academy, as well as, how this load varies between age groups and days. Fifty-two male academy footballers were asked to record the duration, intensity and mode of moderate to vigorous physical activity undertaken outside of their academy training. These data were then combined with session Rating of Perceived Exertion load undertaken inside the academy over the corresponding period. Data were analysed using linear mixed models. The coefficient of variation (CV) was the between-subject standard deviation as a percentage of the mean. The variation of activity types players undertake outside the academy reduced with age. There was no significant difference in the ‘outside of academy’ load between age groups, but there was a significantly greater CV in the Under 15/16 (U15/16) group (CV = 164%) compared to the U12 (CV = 107%) and U13/14 (CV = 119%) age groups (P = 0.001). For the U12 group, there were no significant between-day differences in load outside of the academy or the combined (inside and outside) load. For the U13/14 and U15/16 groups, there were significant between-day differences in load outside of the academy, as well as, significant between-day differences in the combined load. Practitioners should consider how activities undertaken by players outside of the academy setting contribute to the weekly load periodisation and should modify their training schedules accordingly.
Introduction
Football academies aim to produce elite-level players through specialised training. There is a considerable investment of both time and money into academy players with the hope that they achieve an elite level of performance and get contracted to the senior squad. A key barrier to potential footballing success is time lost due to injuries, as these can significantly affect both training and match time. 1 Injuries can also influence player development, including technical, tactical, physical and psychological factors.2,3 Youth academies often have players from 8 to 23 years old, however, injury risk is not equivalent across age groups. During adolescence, the period of peak height velocity has been associated with an increased risk of injury in youth football players.4–6 Peak height velocity generally occurs at 14.1 years in English boys, 7 although, it is important to remember the age of peak height velocity has a substantial variation (±2 years) in healthy children. 8
It is common for youth academy players to experience injury, with 50% of high-level youth football players sustaining a time-loss injury during a competitive season. 1 One commonly suggested method to reduce the number of non-contact injuries is the appropriate management of training load, with a recent survey of academy football practitioners suggesting injury prevention was perceived to be of the most important reasons for monitoring training load within academies. 9 Participation in an elite academy may be put players at increased risk of injury, 10 due to the high training loads and greater variation in this load. The quantification of training and competition loads in children is important as evidence suggests a relationship between high volumes of training in adolescent years with injury and subsequent early retirement. 11 The relationship between training load and injury is complex and multi-dimensional. The load-injury relationship has been questioned recently, with Kalkhoven et al. 12 noting that a clear aetiology between athletic injuries and training load is yet to be established. Yet, the physiological implications of putting adolescent footballers through structured, intense training regimens remain largely unknown. 13
In English academy football there is a systematic increase in training exposure of 20–50% with age in adolescent players.9,14 Training load can be described as a higher-order construct reflecting the amount of physical training that is done and experienced by the athletes and not what was planned, which is training prescription. 15 Studies of training load in academy footballers have shown age-related increases in the intensity and volume of training.16,17 Moreover, differences in the weekly periodisation of the daily training load between age groups were due to how the club scheduled training sessions. 16 What remains unclear, however, is how much academy players are doing outside of the academy setting. This question is of particular importance as it is common practice for young athletes to participate in multiple sports, as well as represent multiple teams in a chosen sport (e.g. school, club, region and nation). It is possible that load management strategies in youth athletes that only focus on the training they are responsible for could be limited by the unknown demands experiences in different domains. Subsequently, this study aims to understand the load of academy football players physical activity both inside and outside of the academy, as well as, how this load varies between three age groups (U12, U13/14 and U15/16) and across each day of the week.
Method
Ethical approval was gained from the University of Bath's Research Ethics Approval Committee for Health (EP 18/19 038). Fifty-two male participants (age = 13.4 ± 1.3, stature = 162.1 ± 12.0, mass = 50.0 ± 11.9) with a total of 78 complete weekly observations (1.50 ± 0.64 weeks per participant) were included in the final analyses. Players from academy age groups U12s to U16s were used for analysis, no a priori sample size calculation was conducted. These participants and age groups were selected for analysis using a convenience sampling approach. These age groups were of particular importance because this is the stage at which training time increases but participants remain on a part-time programme where it is possible to continue to do outside of academy activities.
The players’ outside of academy activity data were collected using the activity diaries. Players were presented with a paper form that had space for four activities each day for the last seven days. The form had columns for each day and rows for activities 1 to 4, each box had space to collect information on the duration, activity type, and intensity of each activity they participated in (see Appendix). Players were instructed on how to complete the activity diary and the importance of providing honest information. Players were asked to retrospectively record activities of either moderate or vigorous intensity. The first two data collection time points were in October and November 2019, with the second two-week block occurring in February 2020.
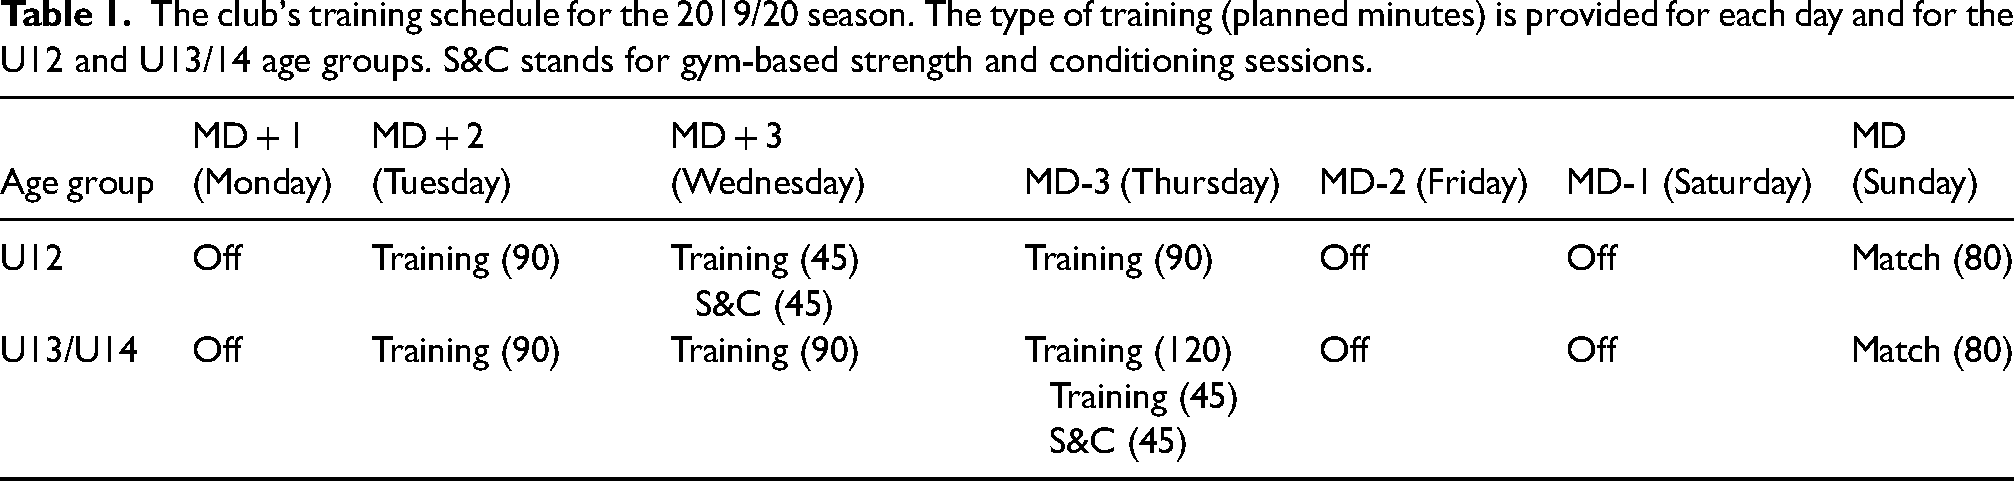
Players were excluded from data collection if they had a current injury, as defined by the medical department. In the weeks of data collection, the training schedule inside the club was described as ‘typical’, in terms of the training schedule, frequency, volume and intended intensity by the coaches and sports science department who plan interdisciplinary the microcycle. Information on the club's training schedule can be found in Tables 1 and 2. It is important to note that the neither training nor match practices were altered or interfered with by the researchers at any time during the data collection 18 (Tables 1 and 2).
The club's training schedule for the 2019/20 season. The type of training (planned minutes) is provided for each day and for the U12 and U13/14 age groups. S&C stands for gym-based strength and conditioning sessions.
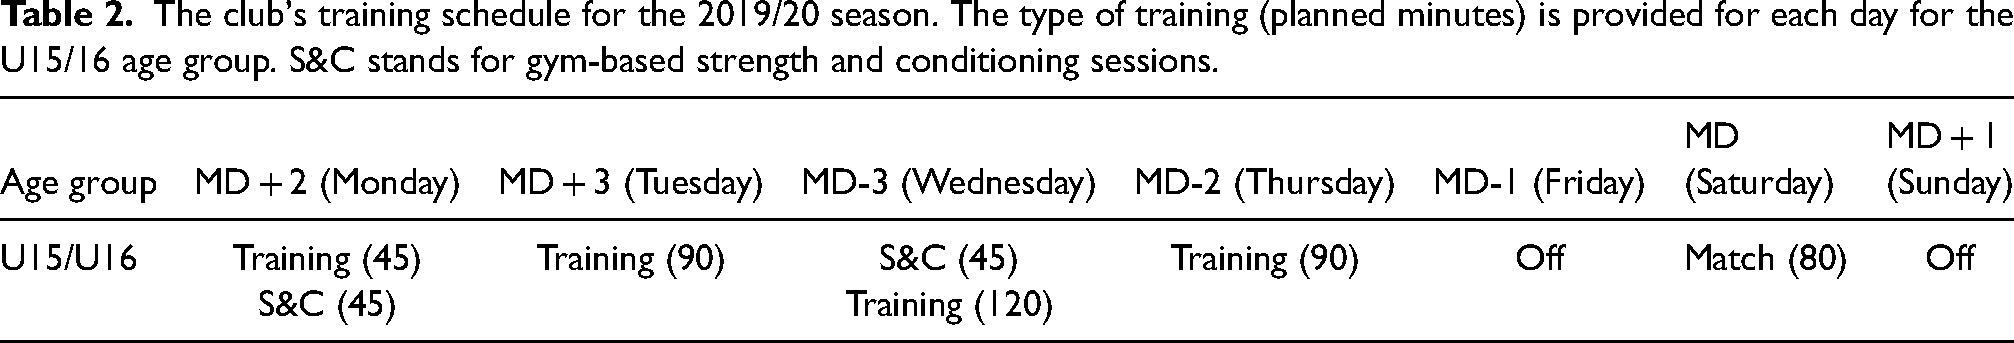
The club's training schedule for the 2019/20 season. The type of training (planned minutes) is provided for each day for the U15/16 age group. S&C stands for gym-based strength and conditioning sessions.
Data were also collected for players’ activity within the club. This information is routinely collected by coaching and sports science staff. Training, match and gym load information were recorded throughout the season, and for this study, a subset of training load variables from the same corresponding days to the activity diaries was collected. Training duration was recorded to the nearest minute, which was subsequently multiplied by the corresponding RPE to provide session Rating of Perceived Exertion (sRPE) load values. Players’ ratings of perceived exertion were collected using the same scale for both activities inside and outside the club. For the training and matches within the academy, the RPE selection was made non-verbally, by pointing to the desired text descriptor on a modified Borg category ratio-10 (CR-10) scale, 19 in isolation from other subjects to avoid external influence on selection. The players' ratings of perceived exertion were collected by each of the relevant age group coaches. Measures were taken at the end of a session, ∼5–10 min after the end of the last activity aimed to avoid any influence the activities completed towards the end of each training session may have had on RPE. This time period is shorter than the normal advised 15–30 min, 19 however, due to the contextual factors of academy football it is not possible to wait any longer and appropriately collect RPEs as players have to leave the venue to return home. For the activity diaries, the RPE selection was written down after viewing the modified Borg CR-10 scale, 19 again, in isolation from other subjects to avoid external influence on selection. All players had undergone multiple education and familiarisation sessions using this scale before being involved with this project.
Data analysis
R (version 3.5.1, R Foundation for Statistical Computing, Vienna, Austria) was used for all statistical calculations. Statistical significance was set at P < 0.05 and Cohen's D effect sizes (ESs) are presented for all effects. The coefficient of variation was calculated by presenting the between-subject standard deviation as a percentage of the mean. This was calculated for each age group to compare the variation in load on a given day. Linear mixed-effects models were used to compare between days and between age groups (fixed effects) using the lme4 package, 20 with player identity included as a random intercept to account for repeated observations within players. The performance package was used to check model assumptions. 21 The U13 and U14 age groups, and the U15 and U16 age groups, were combined for analysis into U13/14 and U15/16 groups, respectively, to increase the numbers in each group and because these age groups followed the same training schedules.
Results
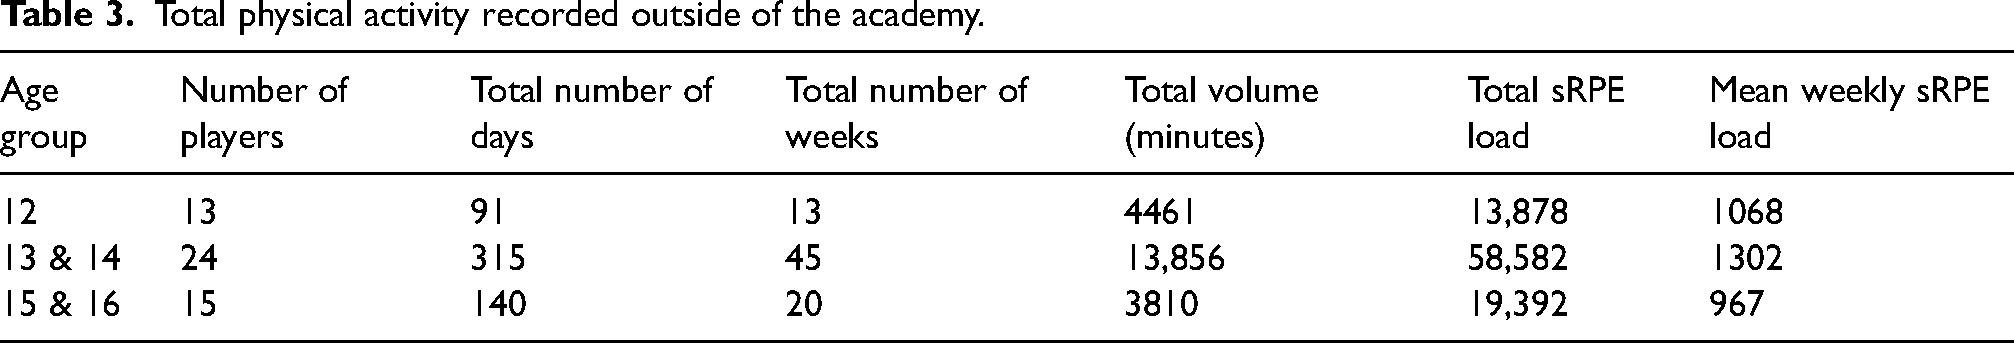
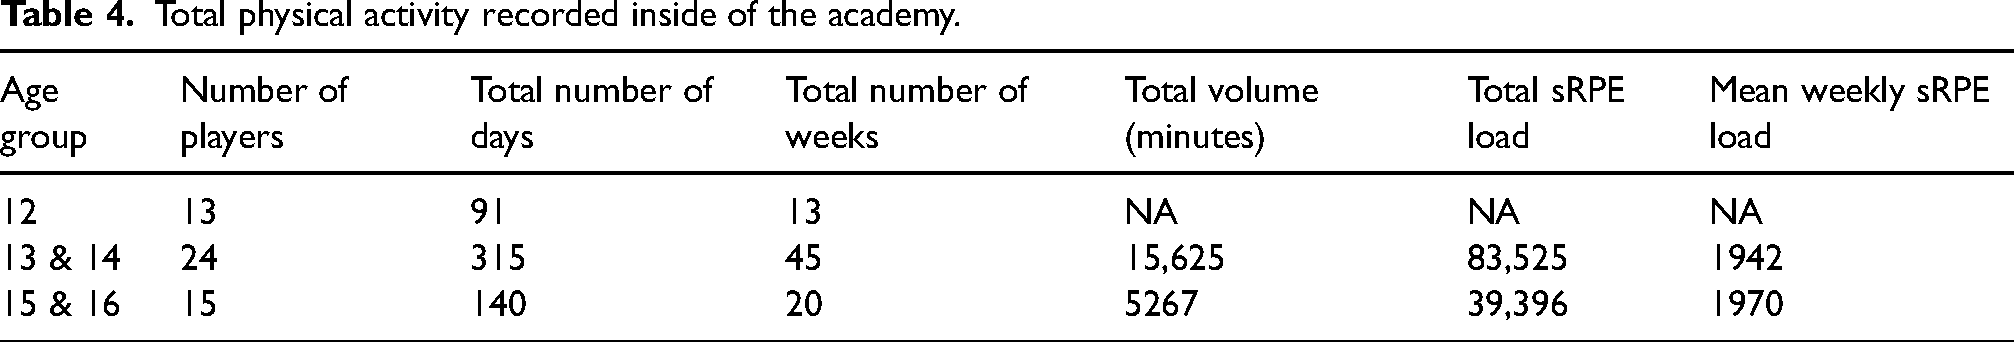
Overall descriptive data are presented in Tables 3 and 4, which shows the total amount of data collected for activity ‘outside’ and ‘inside’ the academy. For outside academy sRPE load, there were no significant differences between U12 and U13/14 (ES = 0.31), U12 and U15/16 (ES = 0.20), and 13/14 and 15/16 (ES = 0.11) (Figure 1). There was, however, a significantly greater coefficient of variation in outside academy sRPE load for the U15/16 (CV = 164%) compared to both the U12 (CV = 107%, ES = 1.16) and U13/14 (CV = 119%, ES = 0.95) group, P = 0.001 (Figure 2). For the U12 group, there was no significant difference between the outside academy load for each day of the week (P < 0.05), with effect sizes ranging from 0.01 to 0.46 (Figure 3). For the U13/14 group, the outside academy sRPE load on MD-3 was significantly less than MD-2 (ES = 0.54), MD + 1 (ES = 0.50) and MD + 3 (ES = 0.21). The outside academy sRPE load on MD-2 was significantly less than MD-1 (ES = 0.82) and MD (ES = 1.12). The outside academy sRPE load on MD was significantly less than MD + 1 (ES = 0.44), MD + 2 (ES = 0.31) and MD + 3 (ES = 0.16). For the U15/16 group, the outside academy sRPE load on MD + 1 was significantly less than MD-3 (ES = 1.21) and MD + 3 (ES = 0.28) (Figure 3).
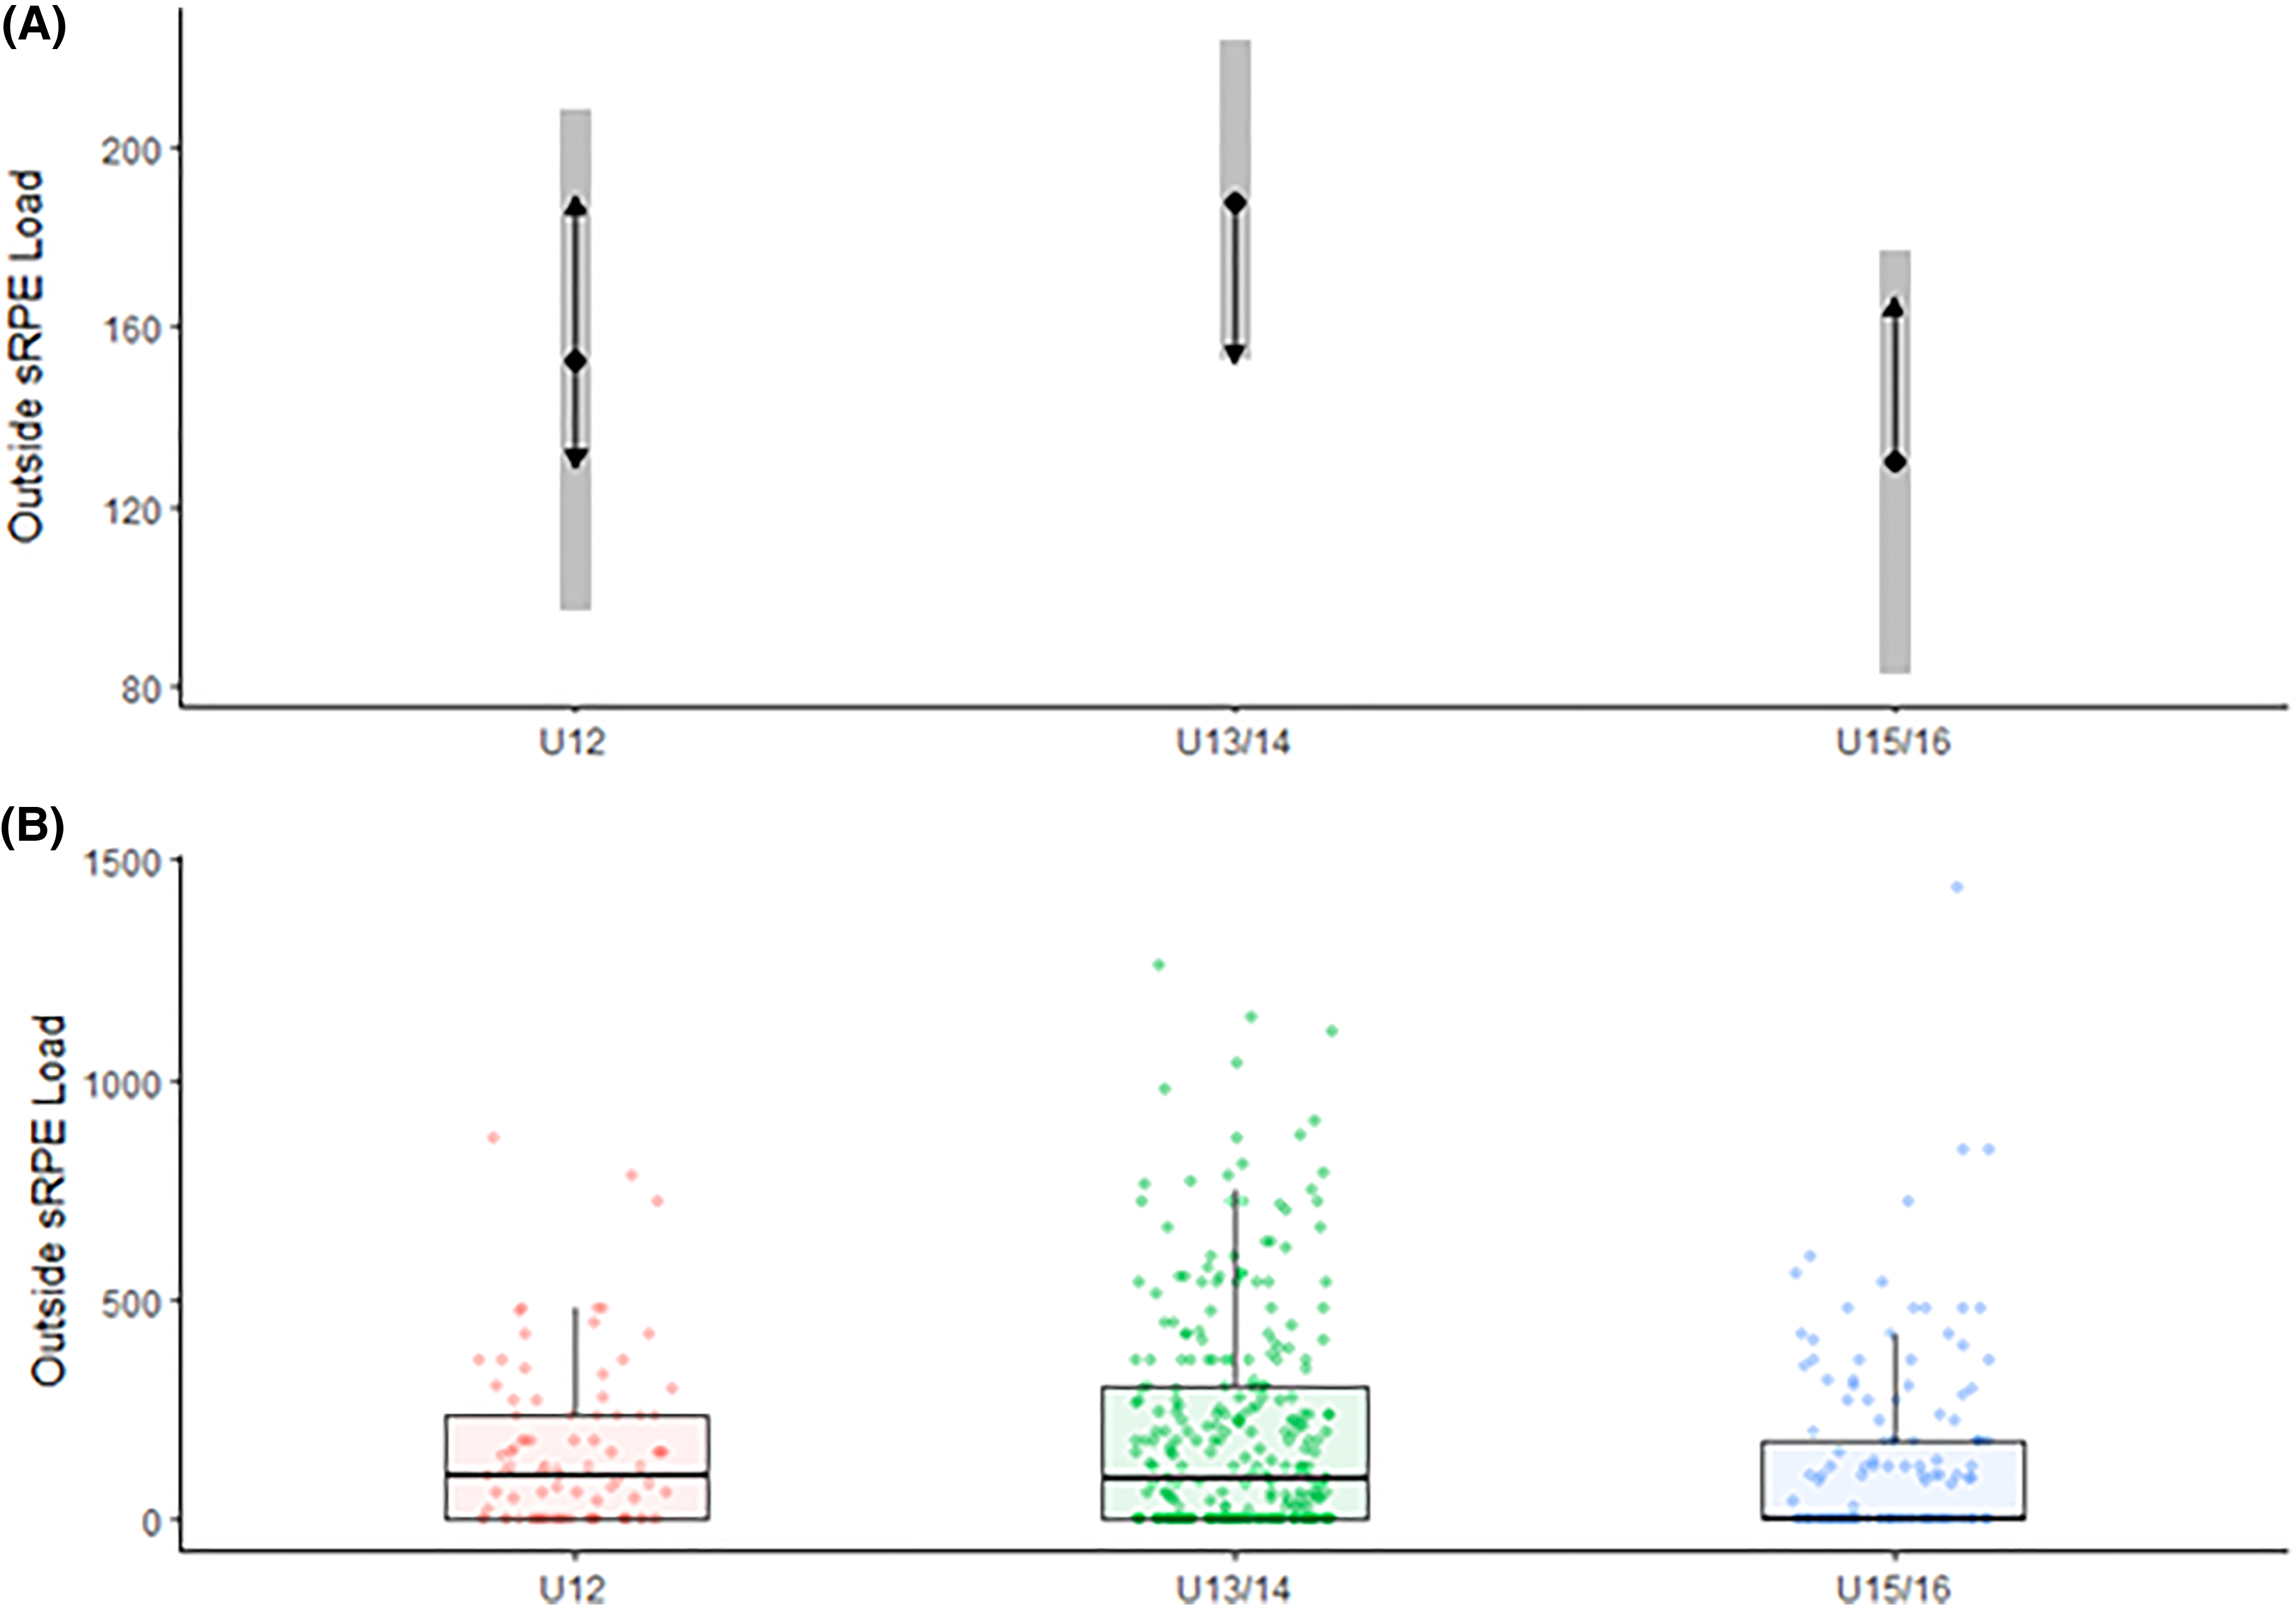
Outside academy session Rating of Perceived Exertion (sRPE) load for each player compared between age groups. (A) The black point represents the mean daily estimate for outside academy sRPE. The grey shaded area represents the 95% confidence interval. The black arrow enables pairwise comparisons between age phases (clear effects are evident when the arrows do not overlap, with the lowest and highest effect arrow truncated). (B) Box plot for outside academy sRPE Load for player grouped by age phase, with each point representing a measurement.
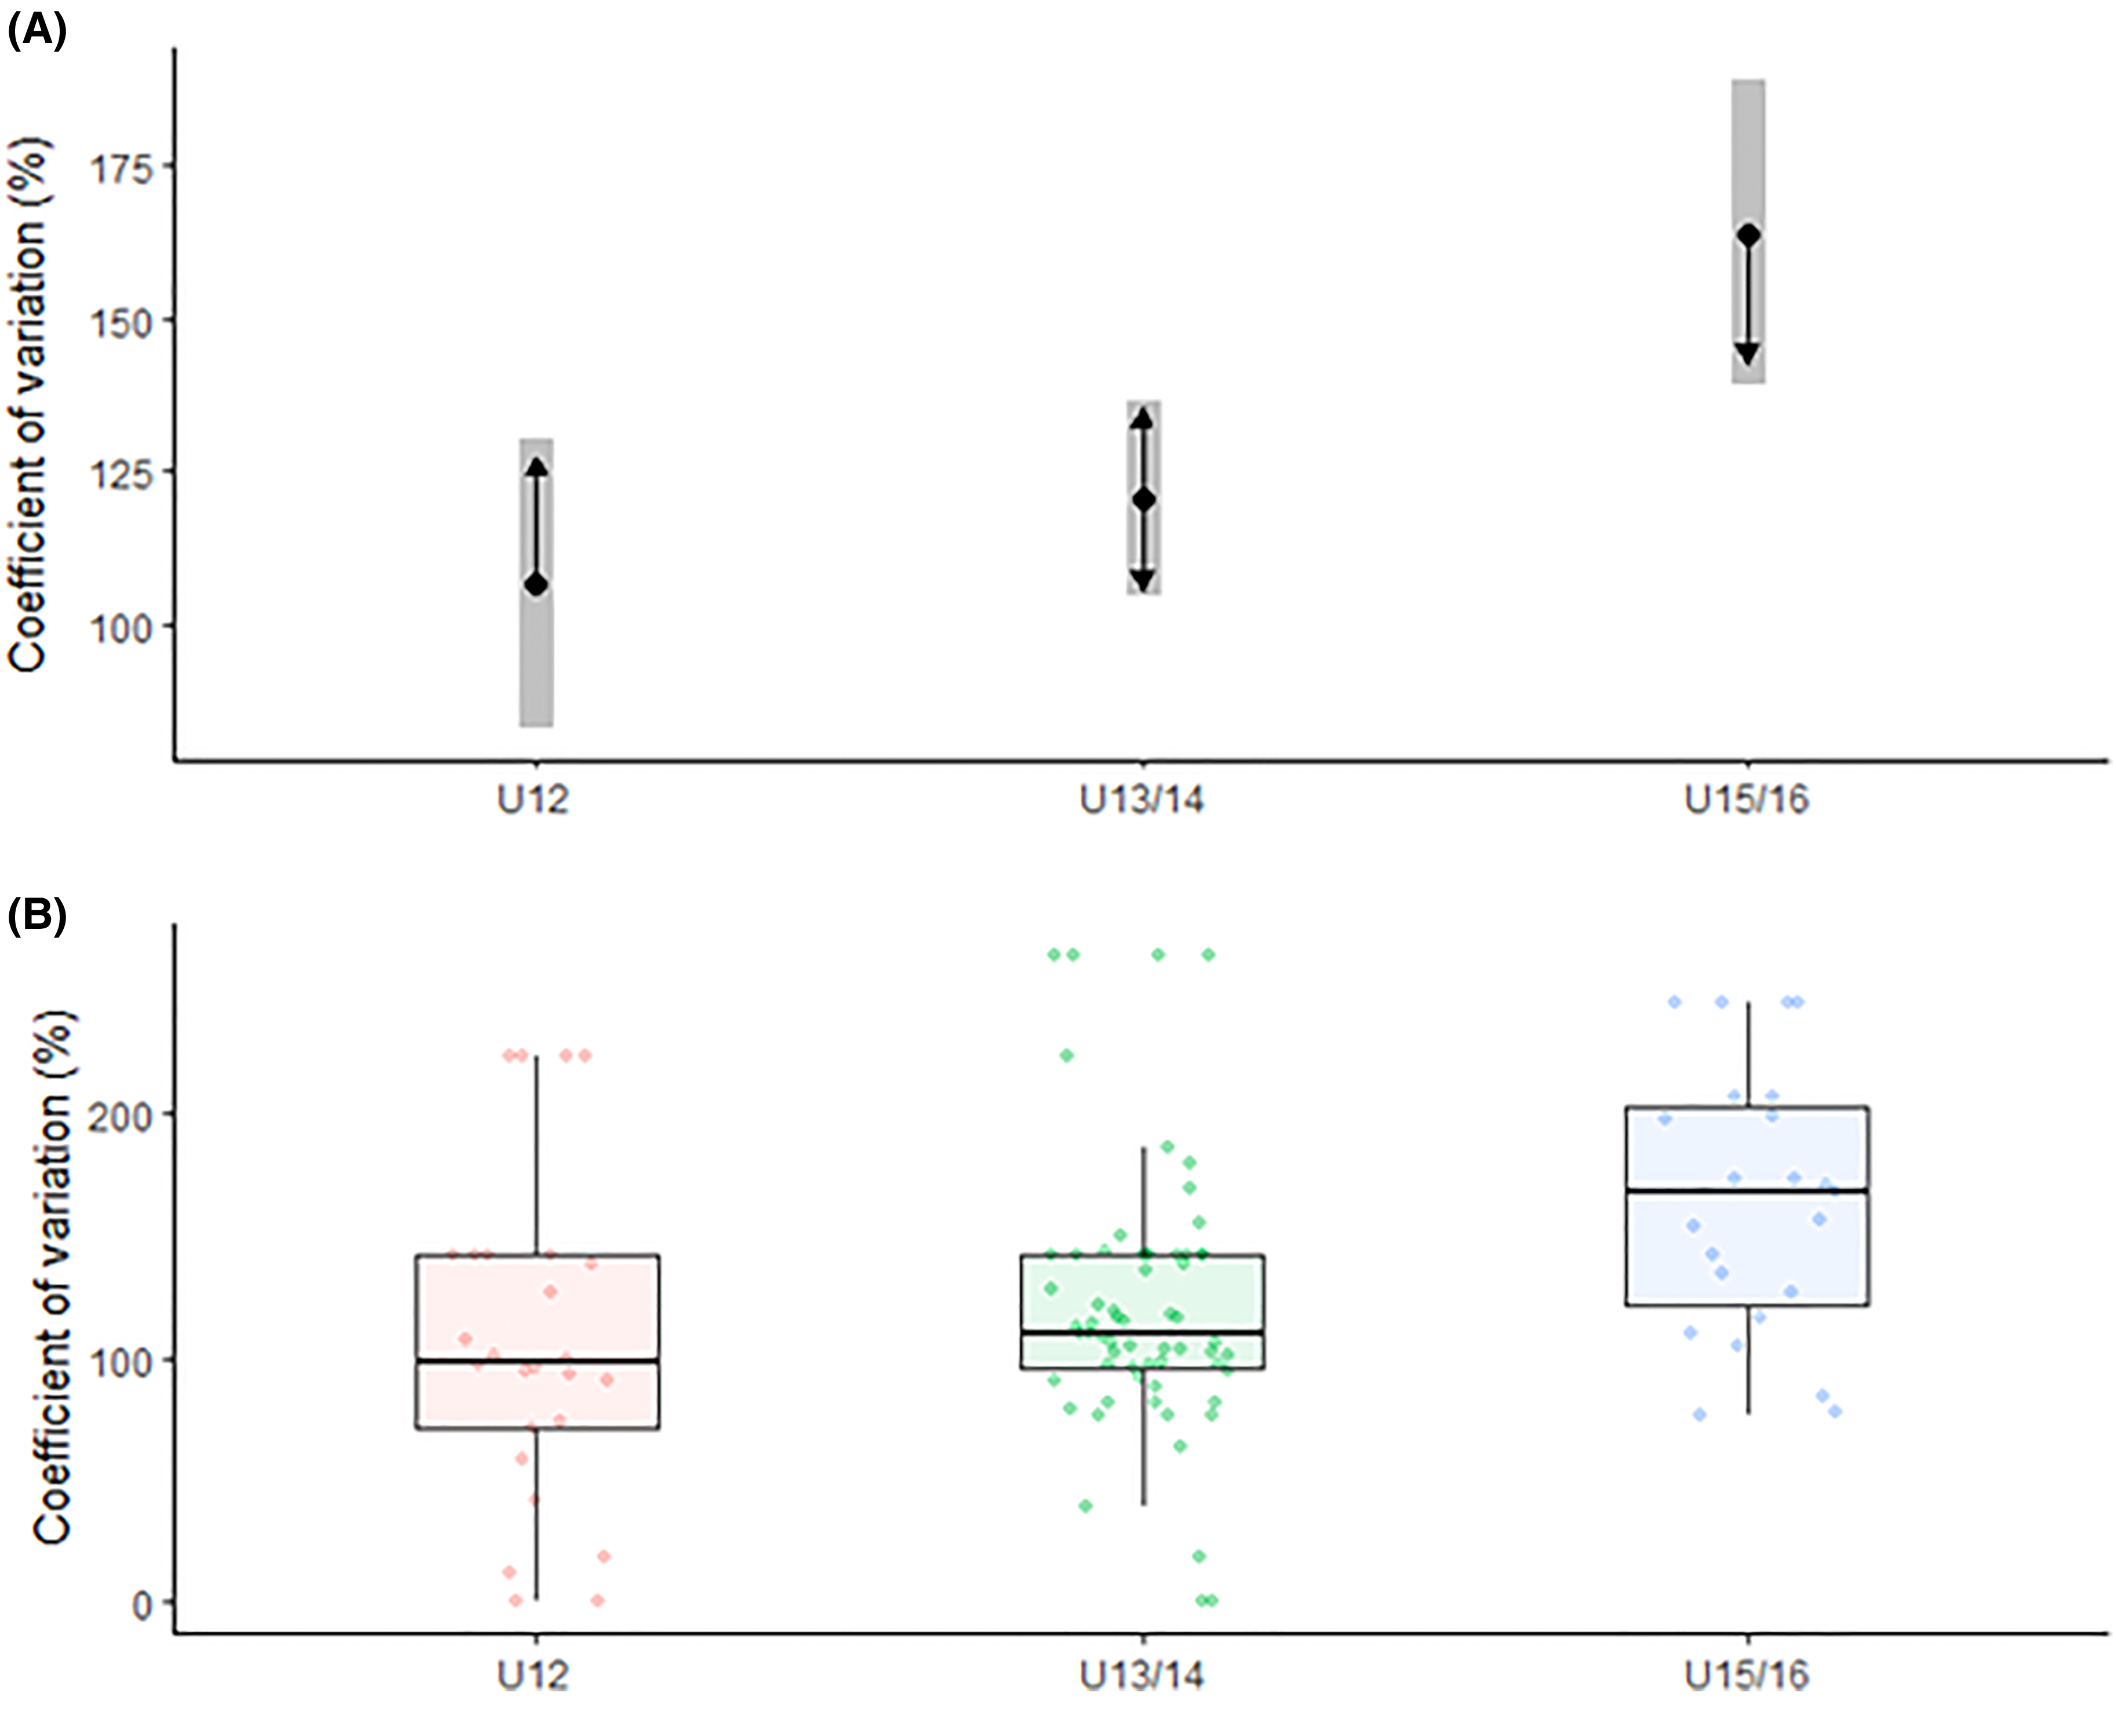
Coefficient of variation for outside academy session Rating of Perceived Exertion (sRPE) load for each age phase. (A) The black point represents the coefficient of variation outside academy sRPE for each day. The grey shaded area represents the 95% confidence interval. The black arrow enables pairwise comparisons between age phases (clear effects are evident when the arrows do not overlap, with the lowest and highest effect arrow truncated). (B) Boxplot of coefficient of variation values grouped by age group.
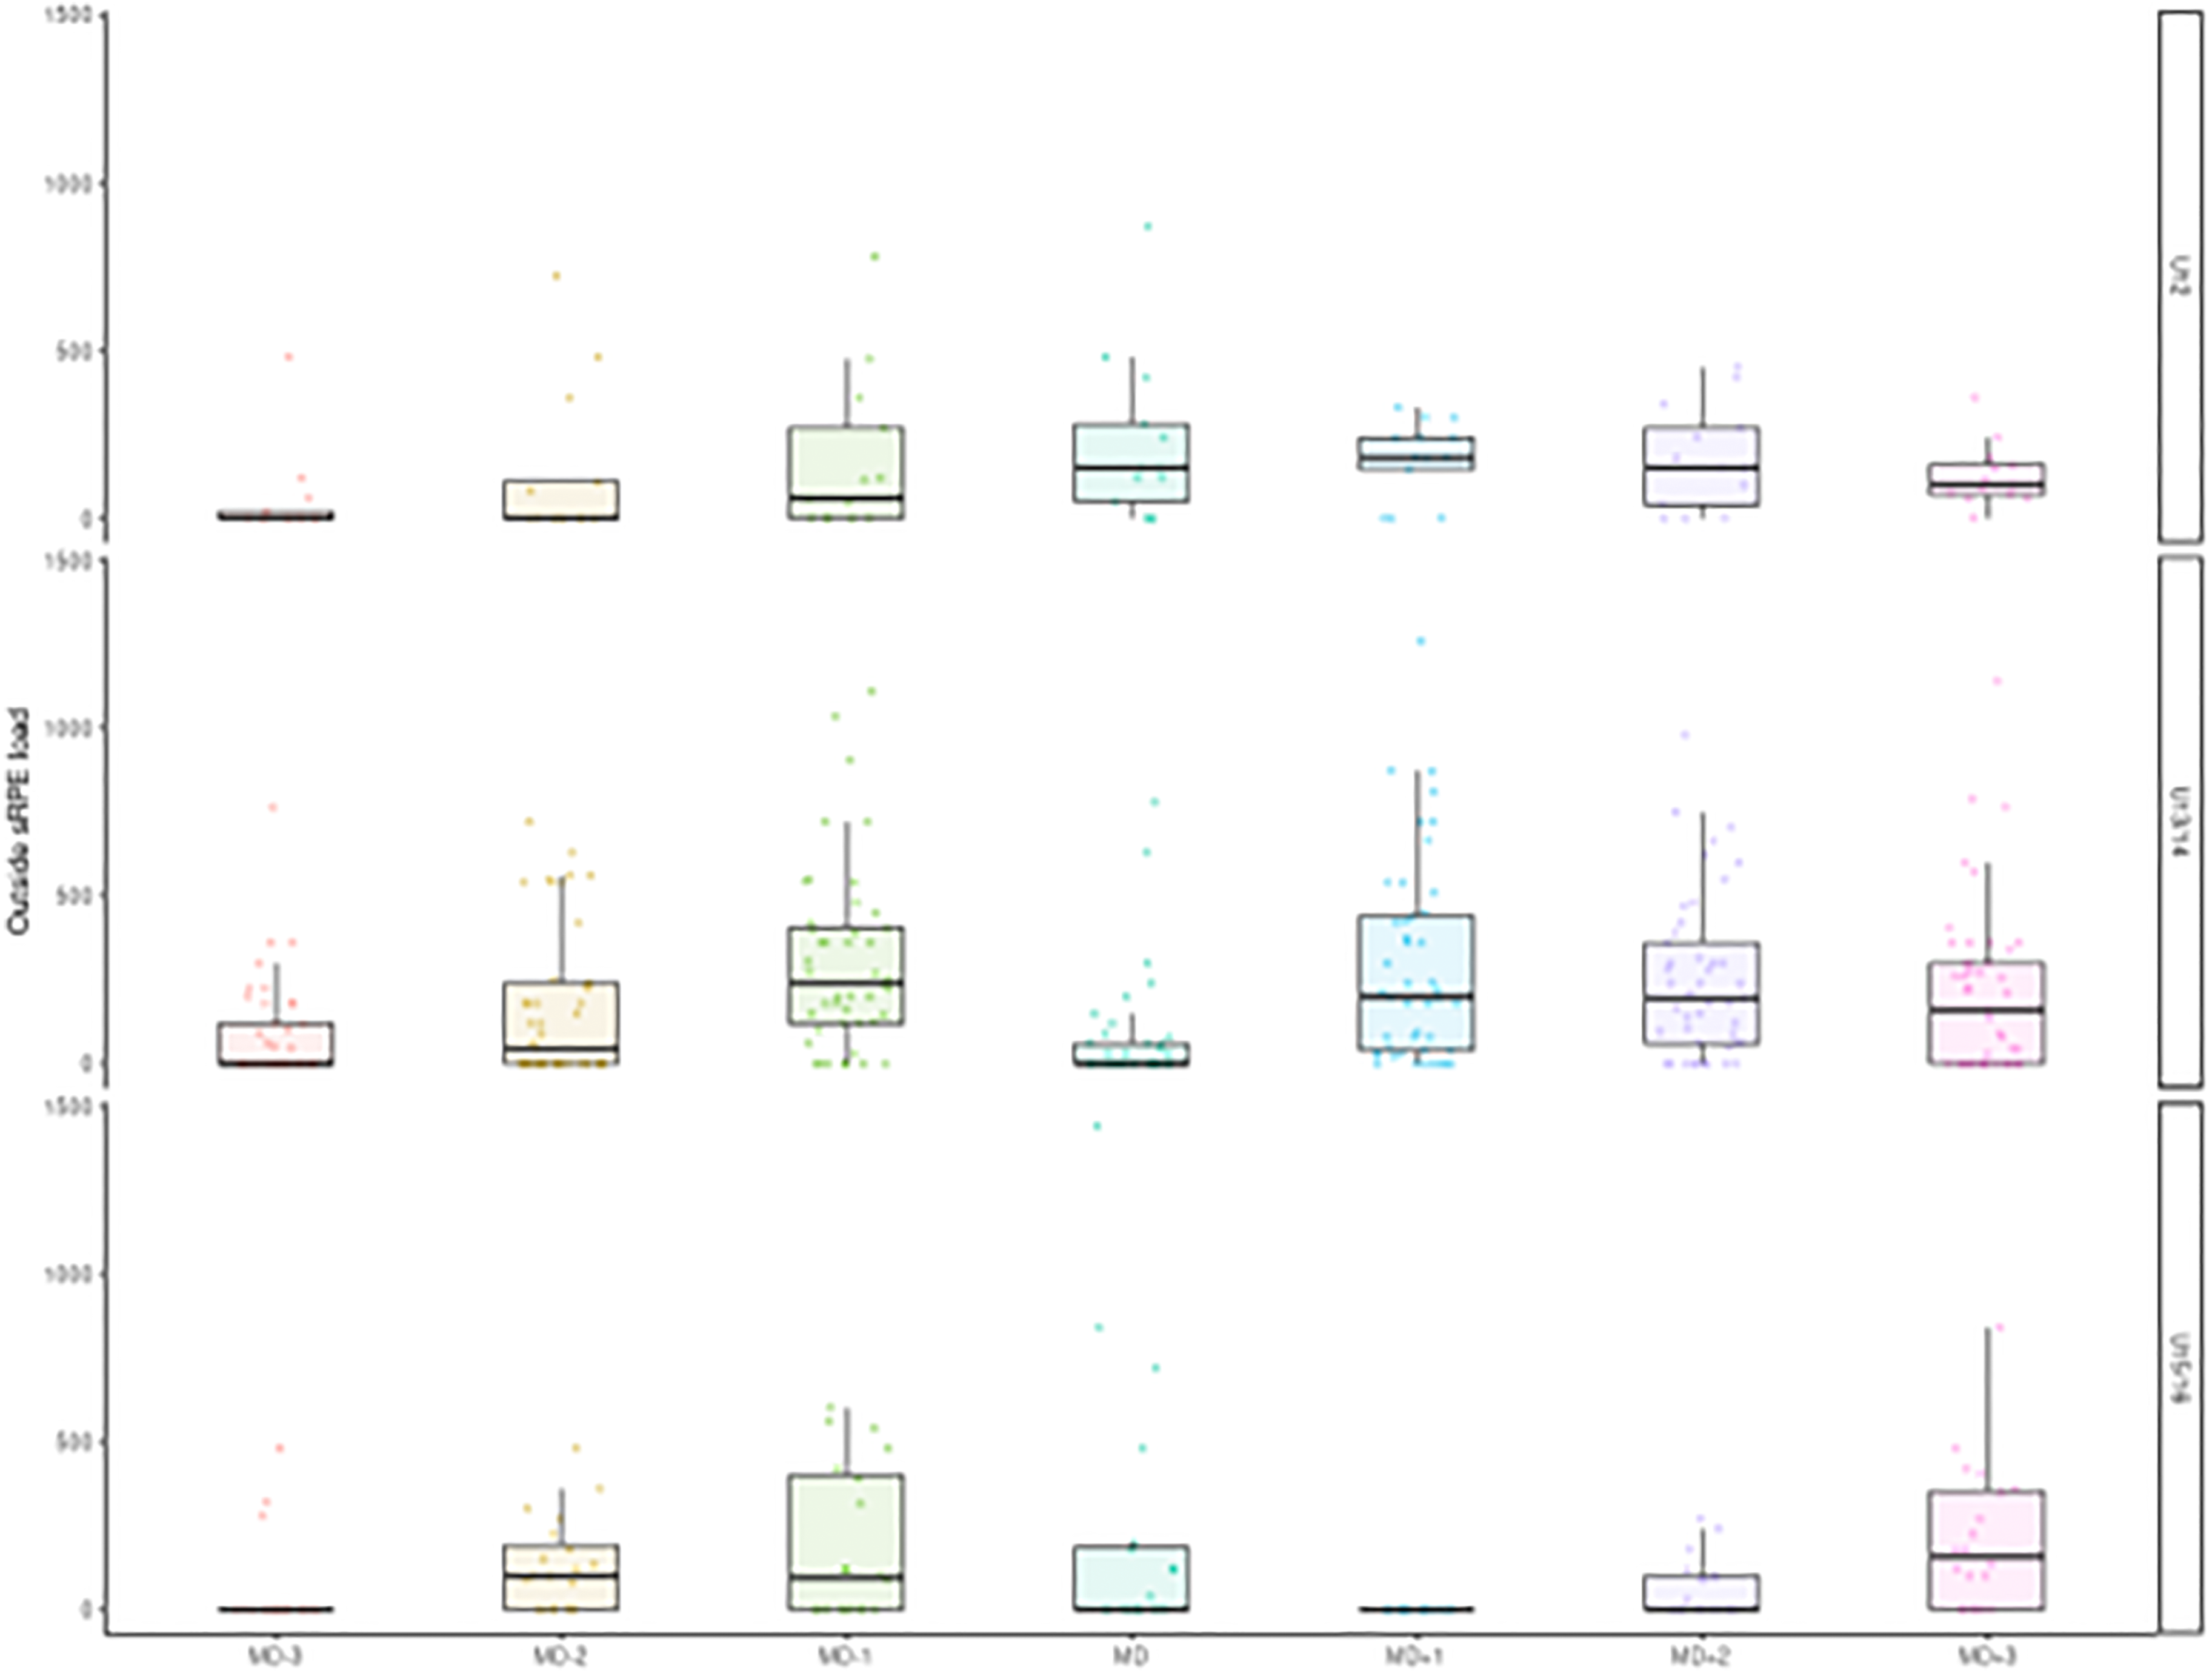
Total session Rating of Perceived Exertion (sRPE) load of activities outside the academy, where ‘MD-1’, ‘MD + 1’, ‘MD + 2’ and ‘MD + 3’ represent that day being significantly less than the corresponding label.
Total physical activity recorded outside of the academy.
Total physical activity recorded inside of the academy.
The combined inside and outside loads across days are represented in Figure 4. For the U13/14 group, the combined (inside and outside) load of MD-3 was significantly greater than MD-2 (ES = 1.08), MD-1 (ES = 0.87), MD (ES = 1.09) and MD + 1 (ES = 1.11) (Figure 4). Moreover, the combined (inside and outside) load of MD + 2 was significantly greater than MD-2 (ES = 0.37), MD-1 (ES = 0.16), MD (ES = 0.38) and MD + 1 (ES = 0.40). Moreover, the combined (inside and outside) load of MD + 3 was significantly greater than MD-2 (ES = 0.17), MD (ES = 0.31) and MD + 1 (ES = 0.20). For the U15/16 group, the combined (inside and outside) load of MD-1 was significantly less than MD-3 (ES = 1.33), MD-2 (ES = 1.22), MD + 3 (ES = 0.64). The combined (inside and outside) load of MD + 1 was significantly less than MD-3 (ES = 1.54), MD-2 (ES = 1.43), MD (ES = 1.15), MD + 2 (ES = 0.35) and MD + 3 (ES = 0.84) (Figure 4).
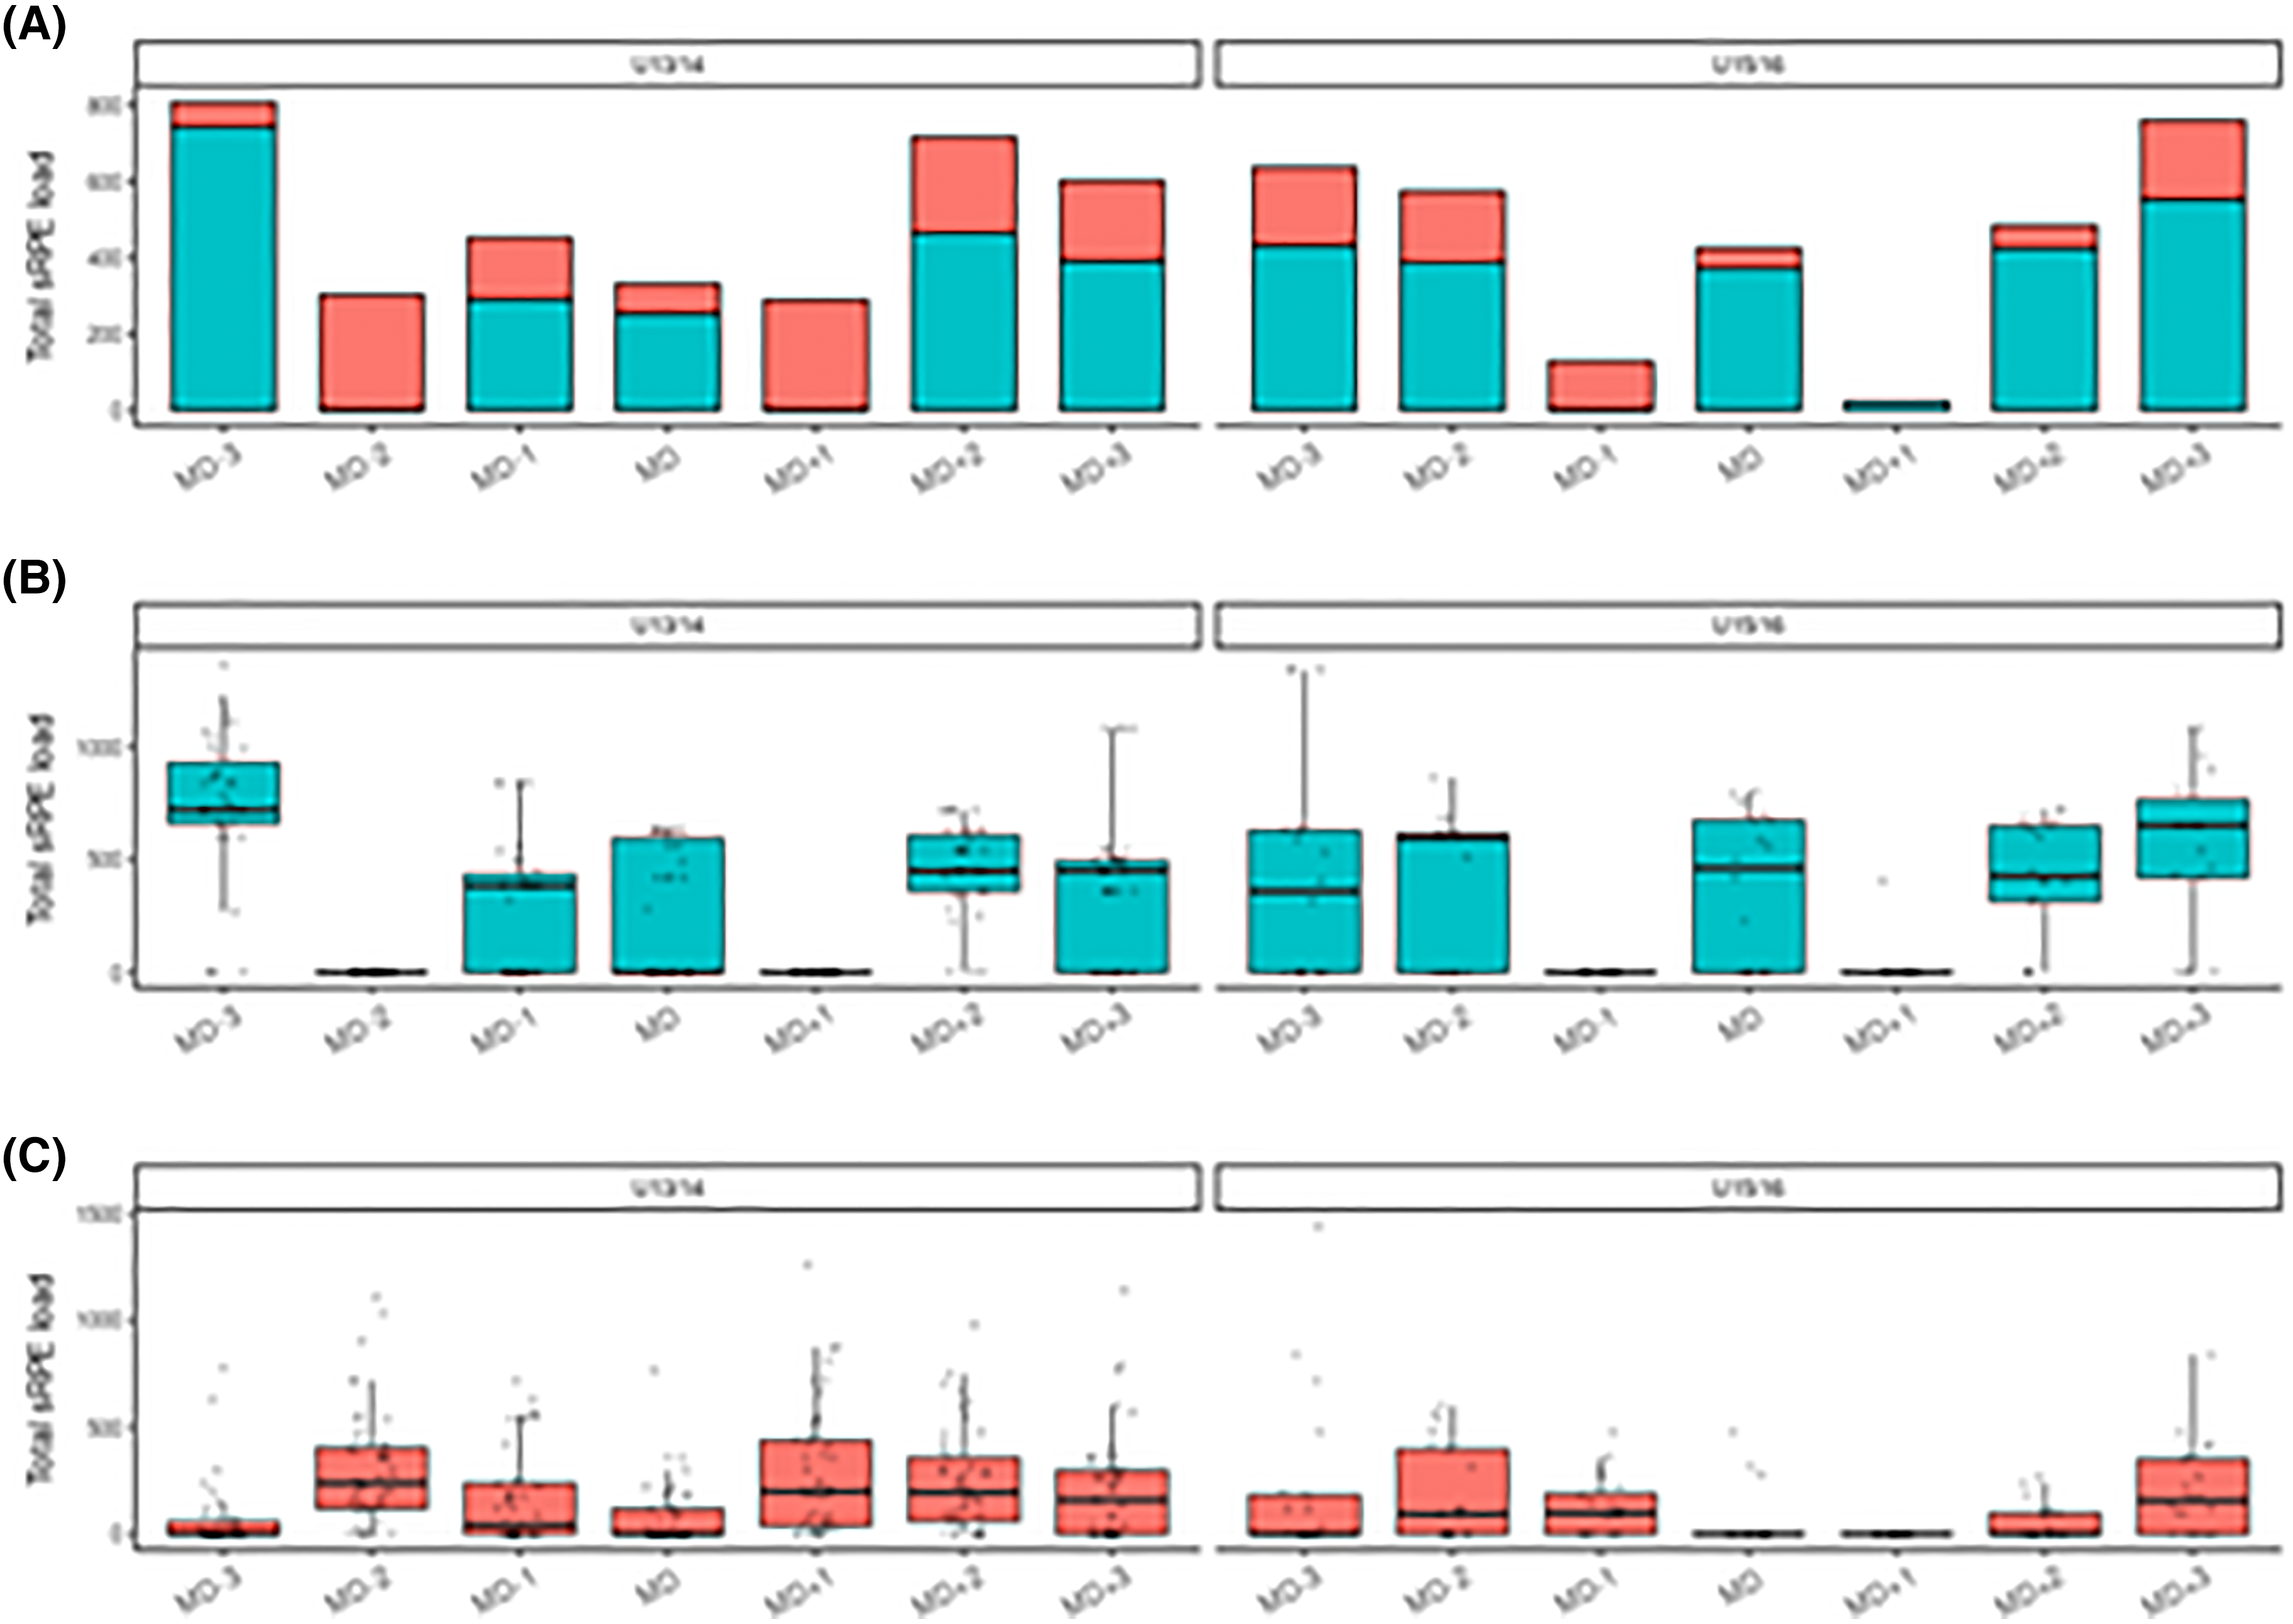
Total session Rating of Perceived Exertion (sRPE) load for activities both inside and outside the academy, for the U13/14 (left) and U15/16 (right), where (A) is a stacked bar chart showing inside the academy total sRPE load (blue) and outside the academy sRPE load (red) (B) shows the inside academy sRPE load for each player (C) shows the outside academy sRPE load for each player.
The players participated in 21 different types of activities outside of the football club. The most common activities were: football 28.3%, physical education (PE) 28.4%, physical training 8.3%, cycling 6.4% and free play 5.8% (Figure 5). At U12, U13/14 and U15/16 there were 14, 17 and 9 different types of activities undertaken outside of the academy, respectively.
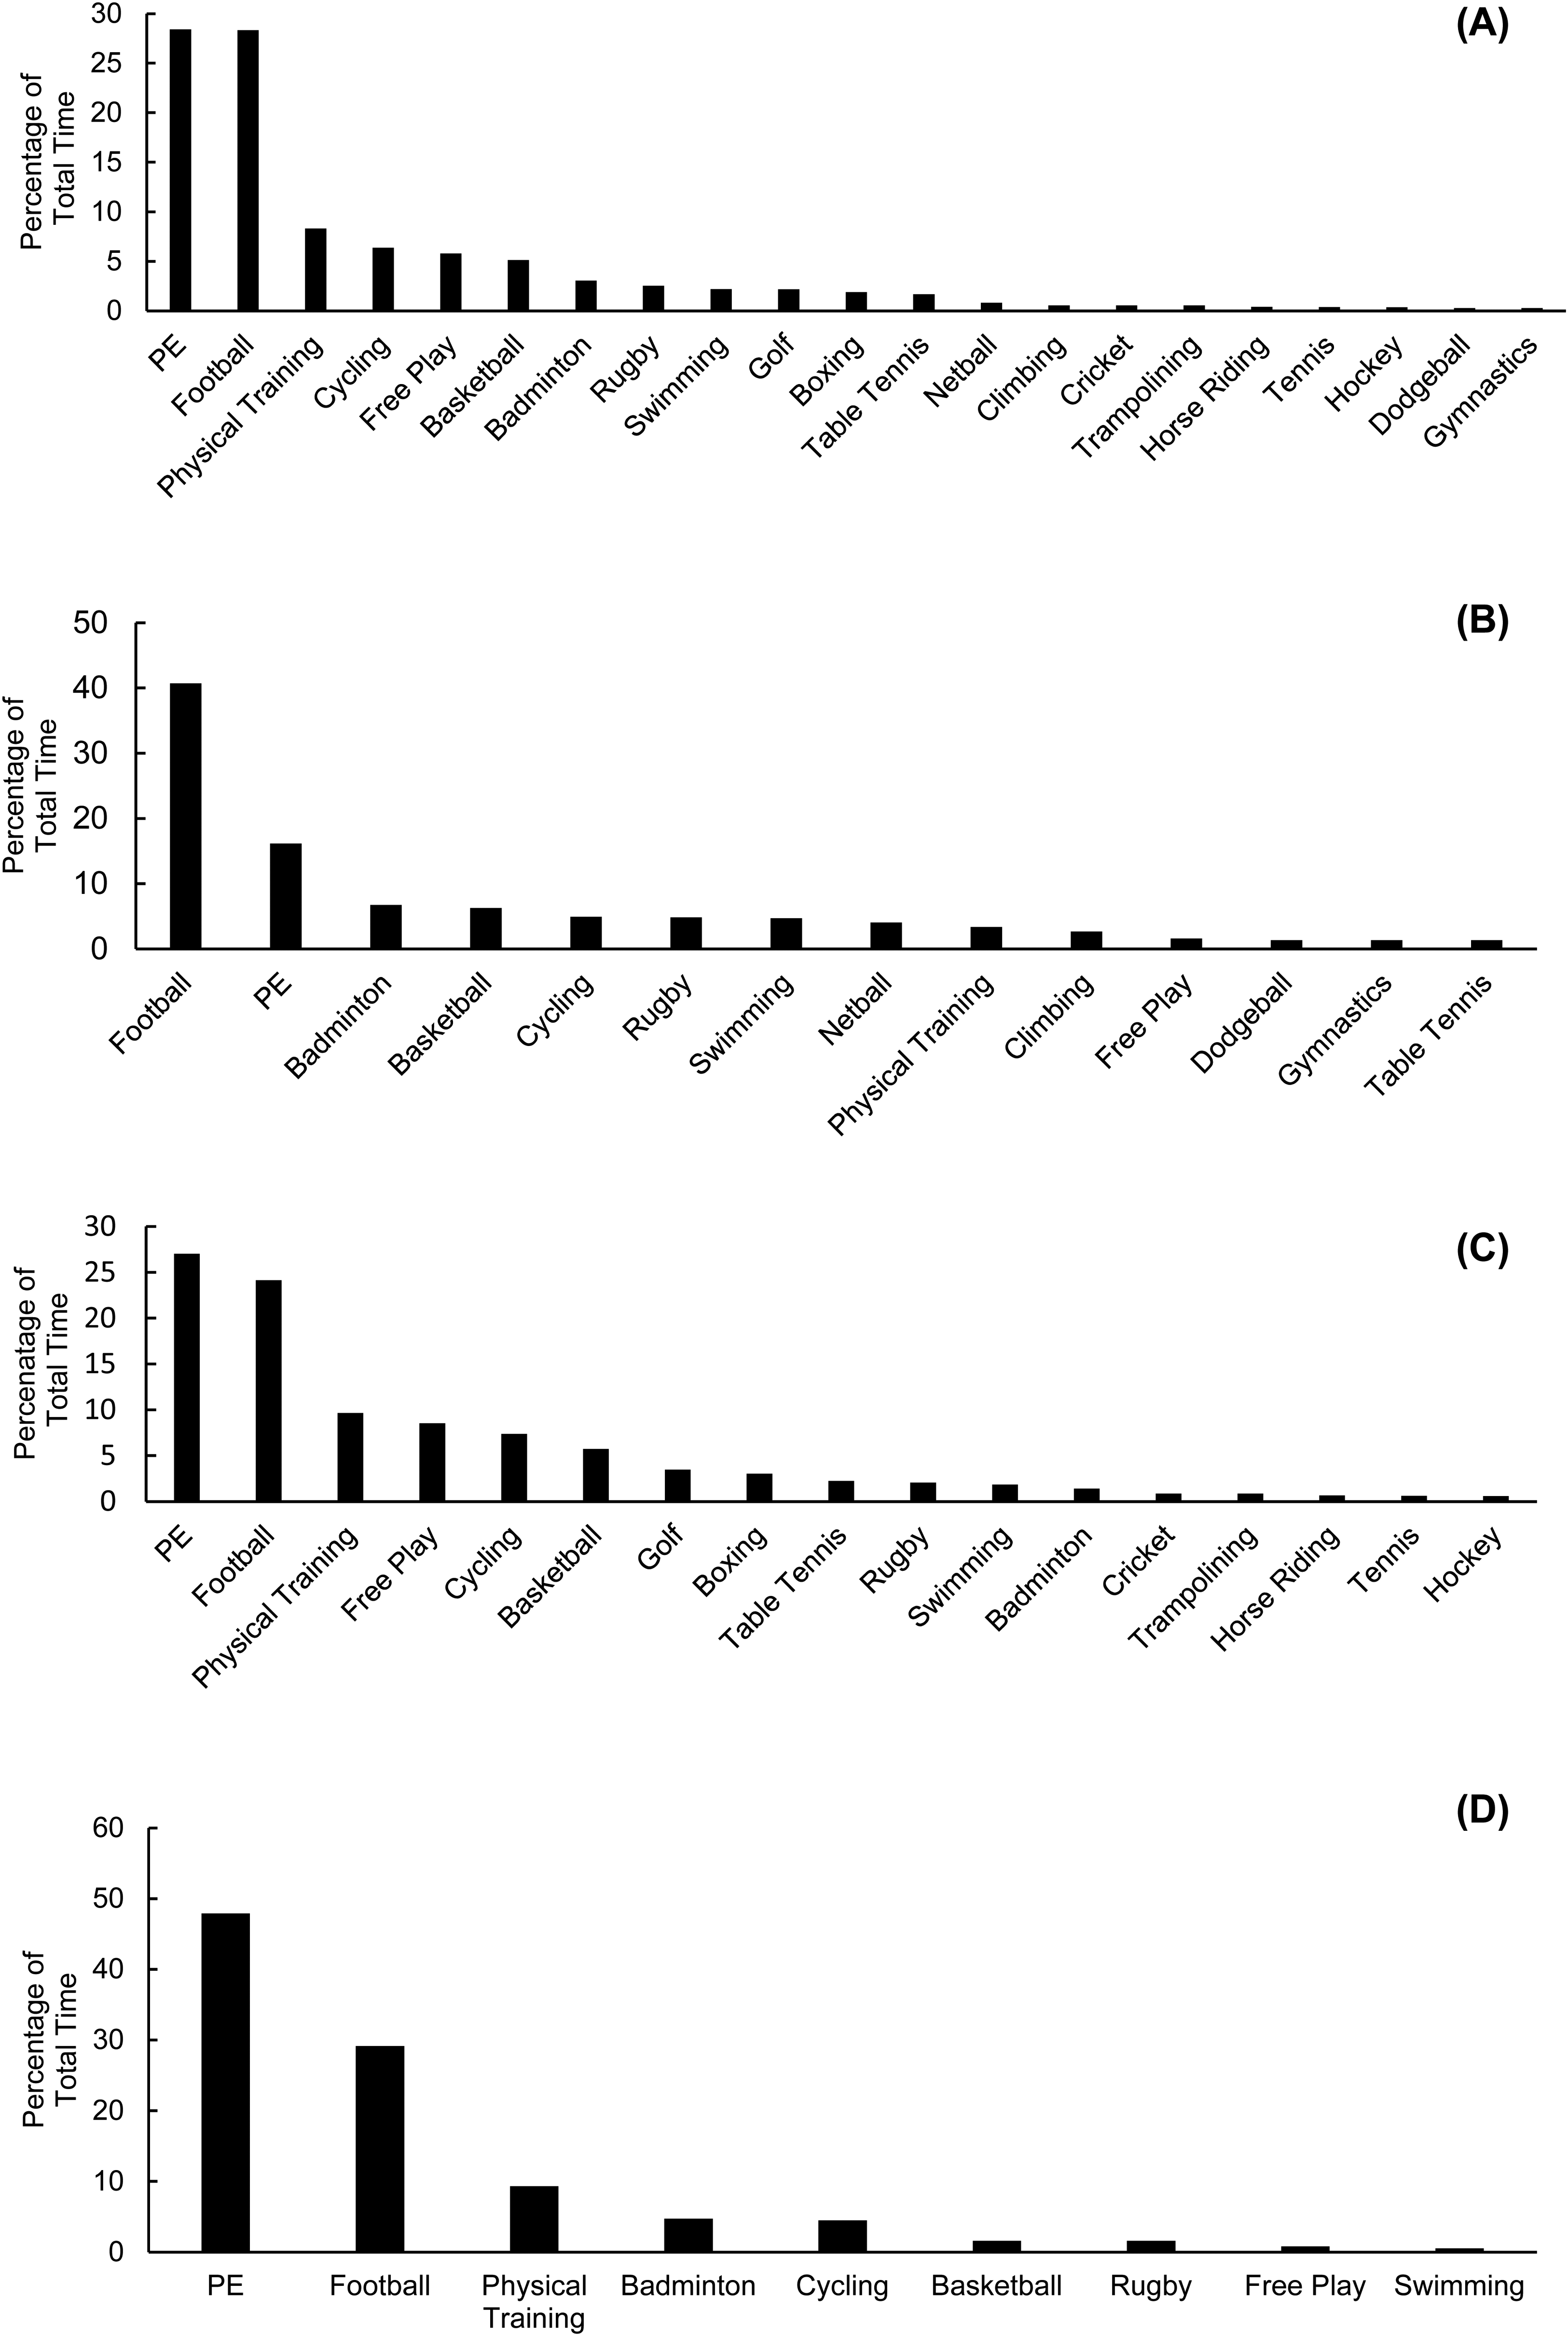
Types of activities that players participated in for (A) all age groups, (B) U12, (C) U13 & U14, (D) U15 & U16 (PE = physical education).
Discussion
This study aimed to understand the loads undertaken by academy football players both inside and outside of the academy, as well as how this load varies between age groups and across weekdays. The key findings of this study were that there was no significant difference in the load undertaken outside of the academy between age groups, but there was a significantly greater coefficient of variation in the U15/16 group. Additionally, there was a significant increase in the load outside of the academy on particular days of the week depending on the age group. Finally, the range of activities players do outside of the academy reduces with age.
There were no significant differences between age groups for total sRPE load, showing that the total load undertaken outside of the academy setting does not change significantly with age. This is an important finding in relation to other studies,17,22 that show an increased total weekly training volume conducted within an academy increases with age. 17 This increase in overall training load could contribute to the age-related increases in injury and injury burden seen in academy football, 22 although further research into the association between training load and injury in these populations is required. There was, however, a significantly greater coefficient of variation for the U15/16 compared to both the U12 and U13/14 groups. This means that the between player variation increases with age, therefore, academies should increase efforts to individually monitor the outside training load at older age groups.
Another key finding of this study is the interaction between daily outside academy activity load and age phase. For the U12 group, there was no significant difference between the outside the academy load across days. For the U13/14 group, the outside academy sRPE load on MD-3 was significantly less than MD-2, MD + 1 and MD + 3. This is likely due to the largest planned academy training load being on an MD-3 (Thursday), where players had up to two pitch sessions and one S&C session. The outside academy sRPE load on MD-2 was significantly less than on MD-1. Furthermore, the outside academy sRPE load on MD was significantly less than MD-1, MD + 1, MD + 2 and MD + 3 (Figure 3). The outside academy sRPE load on MD-2 was significantly more than MD-1 and MD, as well as the outside academy sRPE load on MD was significantly less than MD + 1. This shows that the U13/14 age group does the most outside of academy activity on days with no planned sessions. Another key finding in this group was that on match days (MD) the outside activity was significantly less than MD + 2 and MD + 3. This could be for a multitude of reasons including, the time and travel burden associated with match days. For the U15/16 group, the outside academy sRPE load on MD + 1 was significantly less than MD-3 (ES = 1.21) and MD + 3 (ES = 0.28) (Figure 3). It seems that players in this age group utilise Sunday to rest and recover from the MD. These findings show that when considering both the inside and outside the academy training loads, the weekly periodisation can look different from intended or expected when just considering the load inside the academy.
For the U13/14 group, the combined (inside and outside) load of MD-3 was significantly greater than MD-2, MD-1, MD and MD + 1 (Figure 4). This is likely due to the high volume of training on this day, where players complete a double training session and S&C session. The combined (inside and outside) load of MD + 2 was significantly greater than MD-2, MD-1, MD and MD + 1. As well as, Moreover, the combined (inside and outside) load of MD + 3 was significantly greater than MD-2, MD and MD + 1. This shows that the weekday with training MD-3, MD + 2 and MD + 3 were of the greatest overall physical demand, this is likely due to the combined effects of school-based physical activity and the inside club training sessions. For the U15/16 group, the combined (inside and outside) load of MD-1 was significantly less than MD-3, MD-2 and MD + 3. In addition, the combined (inside and outside) load of MD + 1 was significantly less than MD-3, MD-2, MD, MD + 2 and MD + 3 (Figure 4). This shows that in the 2 days without inside club activity players would often rest and recover in preparation for further sessions.
For the outside activity, these findings fit with more broad physical activity literature showing that the volume of physical activity decreases with age. 23 Regarding activity type, there were 21 different types of activities outside of the football club, the main activities were football (28.3%) and PE (28.4%). The most noticeable difference between age groups was the variation in free play, which at U12 was 1.6%. at U13/14 was 8.5% and at U15/16 free play was 0.8%. The reduction in free play from U13/14 to U15/16 fits with the existing literature showing that in active adolescents the amount of free play decreases with age. 24
The main practical application of this study is that practitioners should consider how activities outside of the academy contribute to the weekly periodisation and training prescription. More specifically, practitioners should strive to collect information on habitual physical activity patterns and communicate changes in overall physical demands between parents and academy staff. Furthermore, practitioners should consider how activities outside the academy could impact both development and rest and recovery, with potential connotations for injury. This does raise an ethical dilemma, as academies want to cater for individual variance in training loads, but it may be unethical to obstruct players from doing activities outside of the academy and this subject should be considered in future investigations.
The main limitation of this study is the ability to generalise these findings to other contexts (clubs, countries, and biological sexes of footballers); the data are specific to the academy in which they were recorded and the training philosophy and schedule in place. Caution should be taken when using these findings to change practice in other contexts, as the findings might not be generalisable to other clubs, countries, age groups or populations. Another limitation of this study is the use of subjective measures for a load. Future studies could use objective measures of activity (e.g. Global Positioning Systems); however, a consideration of using the same method to quantify both activities inside and outside the academy should be taken. An objective measure could potentially reduce player biases associated with self-reported measures due to social desirability. Furthermore, this study did not conduct an a priori sample size calculation.
Overall, this study found that there was no significant difference in the load outside of the academy but there was a significantly greater coefficient of variation in the U15/16 group. There was a significant increase in the load outside of the academy on particular days of the week depending on the age group. Finally, the range of activities players do outside of the academy reduces with age. Practitioners should, therefore, consider how activities outside of the academy contribute to the weekly periodisation and overall load management strategies.
Footnotes
Disclosure Statement
The authors report no conflict of interest.
Declaration of conflicting interests
The authors declared no potential conflicts of interest with respect to the research, authorship, and/or publication of this article.
Funding
The authors received no financial support for the research, authorship, and/or publication of this article.