
Abstract
This study quantified the activities of interchange players during the 15 min before and 20 min after initial pitch-entry (INTentry) or re-entry (INTre−entry) for substitutes and starters, respectively, and identified relationships between pre- and post-pitch-entry responses. Fourteen semi-professional rugby league players wore Microelectromechanical Systems and were filmed throughout 10 matches in which they were interchanged (68 observations). Twelve physical and technical variables were analyzed for the pre-match warm-up, five, 10, and 15 min before INTentry or INTre−entry (physical variables only), and five min epochs following match-introduction. Linear mixed models indicated that during the 0–5 min following INTentry, physical and technical responses were typically greater (∼7.1% to 66.3%) than subsequent epochs while total (∼6.2%) and high-speed (37.1%) distance also exceeded the 0–5 min after INTre−entry (p < 0.05). Edge forwards reached higher peak speeds (11.4% to 11.7%) than hookers and middle forwards, but hookers completed more passes (87.4% to 90.5%). Pre-pitch-entry movements were positively associated with post-pitch-entry tackles (r = 0.43 to 0.49) and high-speed distance (r = 0.46), but negatively associated with total distance (r = −0.32 to −0.68). Within tolerable limits, increasing the activity performed during the ∼15 min before pitch-entry could benefit high-speed match-play performance indicators. Transient changes in post-pitch-entry physical and technical responses could reflect self-pacing strategies, contextual factors, or perceived preparedness. The apparent absence of progressive performance-limiting fatigue, characterized by a plateau in responses after the initial five min following INTentry or INTre−entry, may suggest a role for interchange players to provide a more sustained impact and thus achieve interchange objectives.
Introduction
Progressive and transient declines in indices of physical and technical performance are typically observed during rugby league match-play,1–3 responses that have been attributed largely to the effects of increasing physical and mental fatigue alongside self-pacing strategies.2,4 In addition to the 13 players who start a match on the pitch, rugby league match-day squads include four interchange players who may be introduced to replace other team members on a ‘rolling’ basis following kick-off. At professional and semi-professional levels, each team is currently permitted to make a maximum of eight interchanges per match. Acknowledging that other motivations could at times be influential, the strategic use of such interchanges often represents a means by which coaches and management staff seek to maintain or enhance a team's physical, technical, and tactical performance outputs.4–6
Interchange players typically record greater relative total (TD) and high-speed running (HSR; typically defined as distance covered at a speed >5 m·s−1) distances during their initial on-pitch rotation compared with individuals who complete an entire match.1,6,7 In relative terms, interchange players may also perform more running at a speed >3.9 m·s−1 during the opening quartile of their initial playing bout compared with the equivalent period of their second bout following pitch-re-entry. 1 Whilst such observations provide potentially useful information regarding the match-play movement responses of interchange rugby league players, existing studies have typically considered all players involved in interchanges (i.e. irrespective of whether they started on or off the pitch) together. It therefore remains unclear whether movement responses differ for interchange players who enter the pitch for the first time once a match is already underway compared with starting team members returning for their second playing bout. In addition, limited data exists in relation to the crucial rugby league-specific technical responses of interchange players.
Despite the benefits of prior activity such as an active pre-match warm-up to help team sports players smooth the transition from a state of rest to a state of exercise,8,9 many of the prominent ergogenic effects of warming-up begin to dissipate shortly after the cessation of this prior exercise. In thermoneutral conditions, pronounced declines in body temperature and concomitant reductions in explosive physical performance are typically observed within ∼15 min of inactivity,10–12 with further declines when this timeframe is extended.13,14 In the absence of strategies (e.g. active rewarm-ups) designed to attenuate such responses, the period prior to an interchange player's pitch-entry may allow dissipation of ergogenic benefits via physiological processes such as returns to body temperature homeostasis before a player is introduced or re-introduced into a match. 15 Conversely, if preparatory activity is too long in duration, too intense, or placed too close to subsequent exercise, there is the potential for subsequent performance capacity to be negatively influenced by the presence of acute physical fatigue at the time of pitch-entry. Any activities performed during the ∼15 min period before match-introduction or re-introduction could therefore directly influence a player's preparedness for pitch-entry.10,11,16
When teams were permitted to make up to 12 interchanges per match, a study of European Super League players indicated that pitch-entry for interchange players’ first and second bouts of match-play occurred ∼12 min and ∼10 min into the first- and second-halves, respectively. 1 Considering that ≥10–15 min typically elapses between warm-up cessation and the match kick-off, and that a ∼10 min half-time interval also exists, it is likely that prolonged periods (i.e. 20–30 min) often separate an interchange player's previous exercise period (i.e. whether prior exercise was the pre-match warm-up or a player's initial on-pitch rotation) and pitch-entry. This study aimed to quantify the activities performed by rugby league interchange players before and after initial pitch-entry or subsequent re-entry, while identifying relationships between pre- and post-pitch-entry activities. Transient changes in physical and technical performance responses were also profiled following match-introduction, and contextual influences were assessed.
Methods
Participants and study design
Following receipt of ethics approval from the Australian Catholic University Ethics Board, 14 semi-professional rugby league players (age: 23 ± 3 years, body mass 105.1 ± 9.2 kg, stature: 1.88 ± 0.06 m) from a single club were monitored during 10 Intrust Super Cup matches in which they were interchanged onto the pitch (for their initial or subsequent playing bout) whilst the match was underway. Participants were fully briefed about the risks and benefits of participation before providing their written informed consent prior to data-collection. Whilst data-collection took place over 10 matches, not all players 14 players provided data for each match (i.e. players only provided data from matches in which they entered or re-entered the pitch by means of an interchange). The sample consisted of 10 middle forwards (50 observations), three hookers (12 observations), and one edge forward (six observations), from whom 68 match-day player observations were yielded (5 ± 3 observations−1·player−1, range: 1–10 observations−1·player−1). Training practices and between-fixture recovery times remained consistent between matches throughout the study.
Individual players were classified as ‘starters’ or ‘non-starters’ according to team selection on a match-by-match basis. The responses of ‘non-starters’ (i.e. players who entered the pitch for the first time via an interchange and thus did not start the match on the pitch) were profiled in relation to their initial playing period (i.e. ‘INTentry’). For interchange players who started the match on the pitch before leaving and subsequently re-entering the match, data were recorded in relation to their second match-playing period only (i.e. ‘INTre−entry’). As this study focused on interchange players entering or re-entering the pitch whilst the match was underway, data were not included from whole-match players or other members of the starting team who did not re-enter the pitch having previously been replaced.
Monitoring procedures
Interchange players’ movements were captured by Microelectromechanical Systems (MEMS; Apex 10 Hz, StatSports, Newry, Northern Ireland) which were worn between the scapulae and harnessed within the playing jersey inside a pocket designed to minimize movement artefacts. This technology has demonstrated acceptable validity and reliability for measuring rugby-specific activities,17–19 including detecting collisions. 18 In addition to Global Positioning Systems (GPS), the MEMS units contained accelerometers sampling at 100 Hz. Such accelerometers have shown good intra- (coefficient of variation; CV = 0.9–1.1%) and inter- (CV = 1.0–1.1%) unit reliability when assessed in laboratory and field test conditions. 20 Players wore the same units throughout the study period to avoid inter-unit variation.
The MEMS were activated according to the manufacturer's guidelines before the pre-match team warm-up, whilst data were downloaded and processed post-match using proprietary software (Apex Rugby, Team Series, STATSports). Data files were processed on an individual player basis to allow pre-pitch-entry data to be organized into standardized periods reflecting the initial pre-match warm-up, and each of the five min, 10 min, and 15 min immediately preceding INTentry or INTre−entry. Match-play data were grouped into discrete five min epochs that represented the 0–5 min, 5–10 min, 10–15 min, and 15–20 min from the moment of a player's INTentry or INTre−entry. 21 All matches were filmed by the official statistics partner of the competition (Red Corner Video, Queensland Australia), which allowed subsequent manual coding of technical performance indicators according to pre-determined classification criteria (Table 1) to quantify the frequency with which they occurred during each of the same five min post-pitch-entry epochs. No attempt was made to influence players’ activities in this observational study.
Operational definitions for the physical and technical dependent variables profiled.
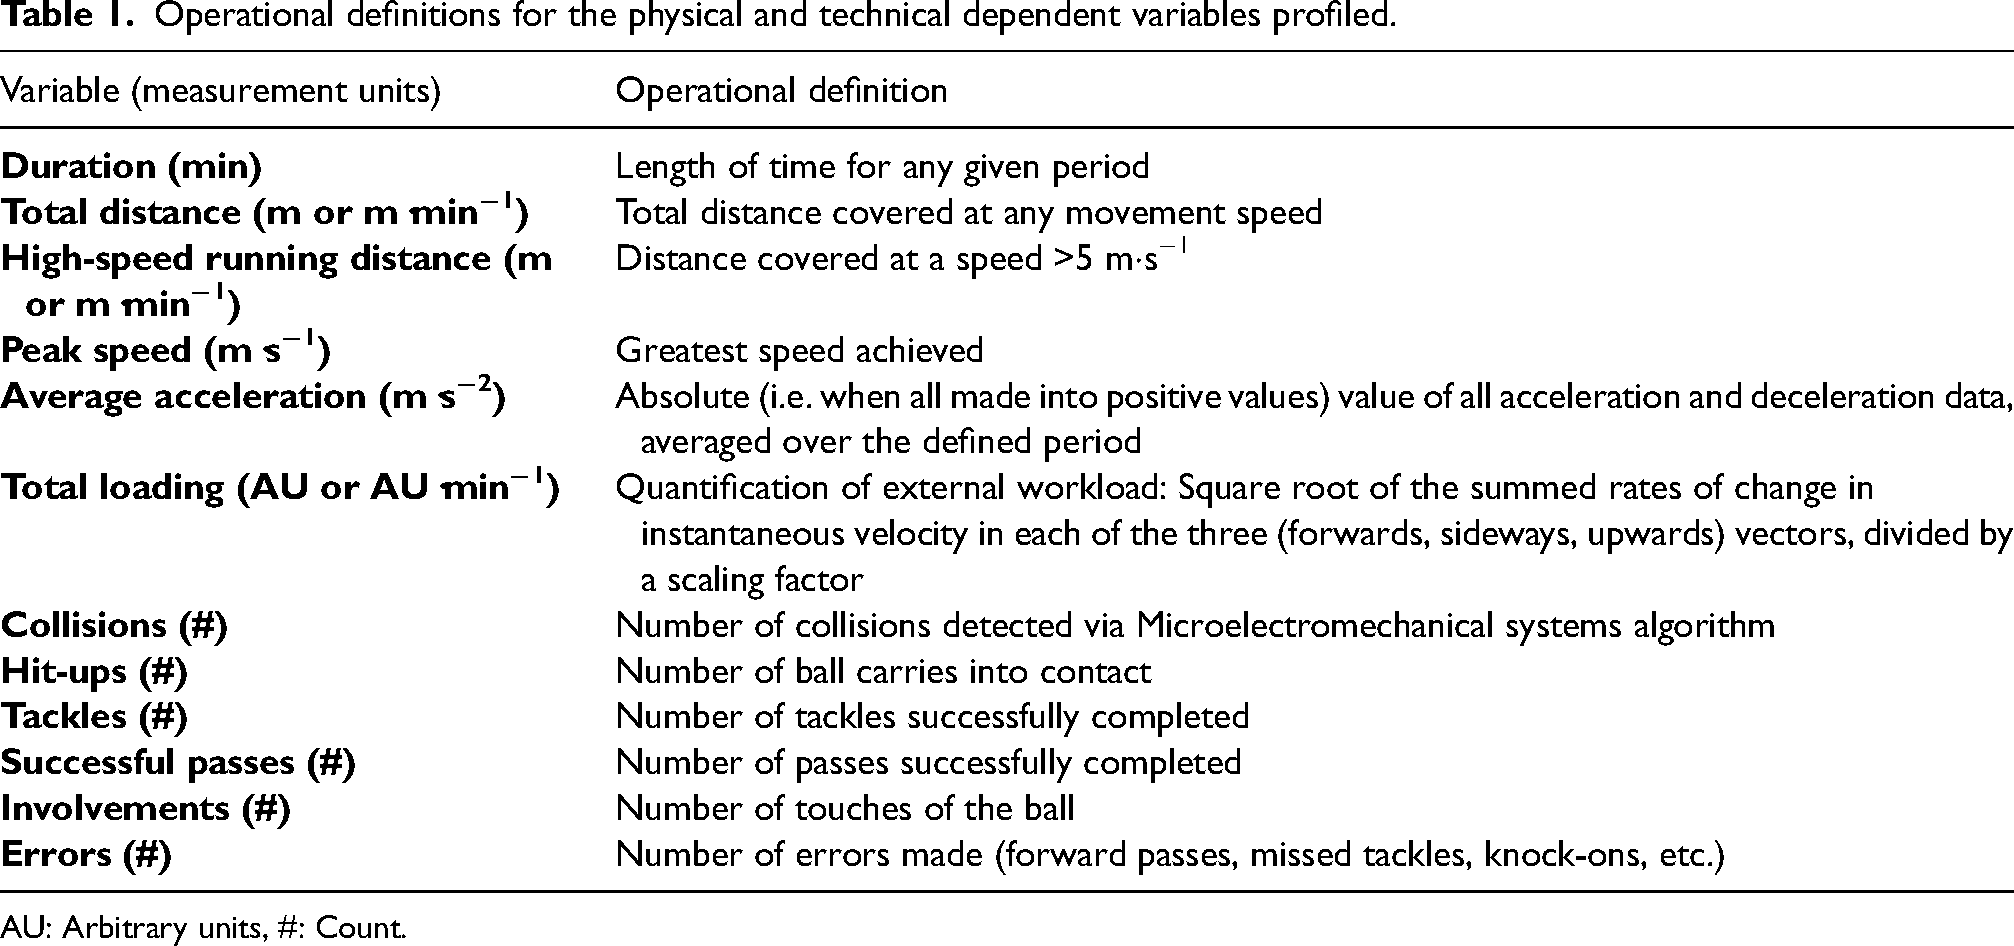
AU: Arbitrary units, #: Count.
Only completed post-pitch-entry epochs were included, therefore data from any players who were introduced for less than five min of match-play on any given occasion were not considered. Where a single playing bout spanned both first- and second-halves of a match (i.e. a player was introduced during the first-half and remained on the pitch immediately after half-time; 18 instances), only pre-half-time data were included to allow representative assessments of transient within-bout changes. Due to issues with MEMS unit activation and/or to ensure adequate signal quality (number of satellite connections >6 and horizontal dilution of position <1), pre-pitch-entry data were omitted from 4 of the 68 observations, whilst warm-up data were omitted from 12 observations. Table 1 outlines the physical and technical dependent variables profiled, which were chosen to reflect key performance indicators that have been reported in existing rugby league research4,7,22 and that club staff deemed important for interchange players as a whole. Playing position, alongside contextual information relating to the match scoreline at the time of INTentry or INTre−entry (i.e. ‘winning, ‘drawing’, ‘losing’) and the match location (i.e. ‘home’, ‘away’) were also recorded for each interchange bout.
Statistical analyses
Linear mixed models were used to assess temporal and contextual influences on the dependent variables profiled following INTentry or INTre−entry while accounting for data nesting within matches and players. For non-continuous ‘count’ variables, data were analyzed via mixed effects Poisson regression. ‘Player’ and ‘match’ were entered as random effects throughout, whilst post-pitch-entry models considered the categorical fixed effects of ‘epoch’ (i.e. the ‘0–5 min’, ‘5–10 min’, ‘10–15 min’, ‘15–20 min’ after a player entered the pitch), ‘position’ (i.e. ‘middle forwards’, ‘hookers’, ‘edge forwards’), ‘match scoreline’ (i.e. ‘winning’, ‘drawing’, ‘losing’) and ‘match location’ (i.e. ‘home’, ‘away’). For the fixed effect of epoch, different levels were also specified to denote non-starters (i.e. INTentry) and starters (i.e. INTre−entry). A step-up approach to model selection was taken, whereby a null model was initially specified before fixed effects were entered in the order they are mentioned above.23,24 Each fixed effect was retained in subsequent models if it demonstrated statistically significant improvements (p <0.05) to the model fit based on likelihood ratio tests.23,24 Pairwise comparisons assessed differences between each level of a fixed effect using Bonferroni-corrected least squares means tests and standardized effect sizes (ES), which were interpreted as: 0.00–0.19, trivial; 0.20–0.59, small; 0.60–1.19, moderate; 1.20–1.99, large, and ≥2.00, very large effects. 25 Analyses were performed using the lme4 and emmeans packages in R Studio (v R-3.6.1.).
For pre-pitch-entry data, linear mixed models were used to compare movement responses for each time period (i.e. pre-match warm-up, and each of the five min, 10 min, and 15 min immediately preceding INTentry or INTre−entry) between INTentry and INTre−entry. Moreover, to assess relationships between the amount of activity performed immediately prior to pitch-entry and a player's physical or technical outputs during the first five min following INTentry or INTre−entry, within-participant repeated measures correlations were calculated using the rmcorr package within R Studio.26,27 Separate analyses were conducted to determine whether the amount of activity (i.e. TD, HSR, total loading, or peak speed) recorded during the five min, 10 min, or 15 min prior to INTentry or INTre−entry demonstrated a relationship with the TD, HSR, or individual technical responses during the 0–5 min following INTentry or INTre−entry. Repeated measures correlations were assessed for the whole sample and then separately for INTentry and INTre−entry. Correlation coefficients (r) of 0.10–0.29, 0.3–0.49, and ≥0.50 were interpreted as representing small, moderate, and large correlations, respectively. 25 Descriptive statistics are presented as mean ± standard deviation, whereas ES and r values are presented with 95% confidence intervals (CI).
Results
Pre-match warm-up responses and movements during the five min, 10 min, and 15 min before pitch-entry were similar between INTentry and INTre−entry (Table 2).
Movement responses of interchange players prior to pitch-entry (non-starters) or re-entry (starters).
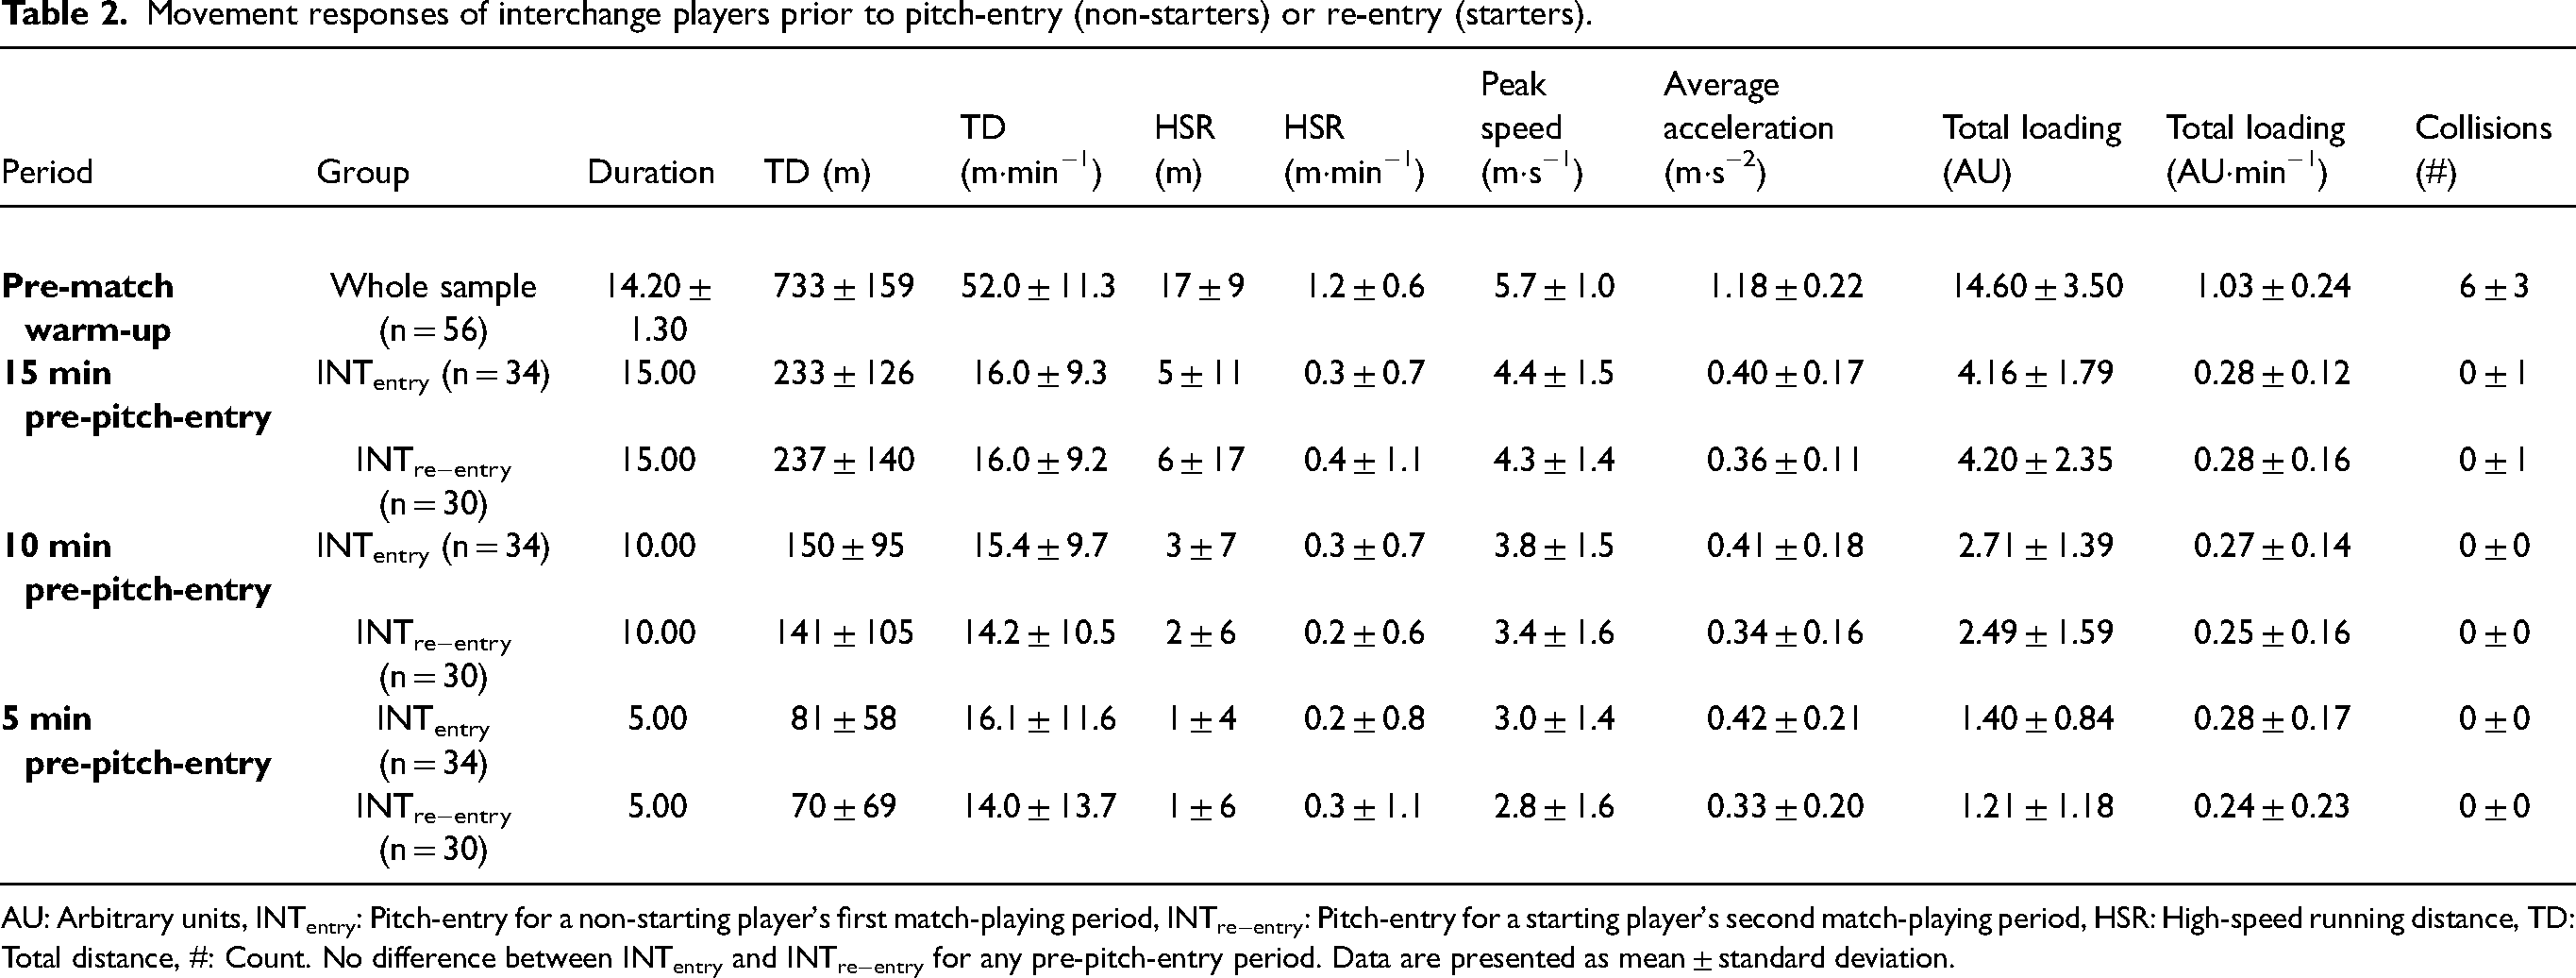
AU: Arbitrary units, INTentry: Pitch-entry for a non-starting player's first match-playing period, INTre−entry: Pitch-entry for a starting player's second match-playing period, HSR: High-speed running distance, TD: Total distance, #: Count. No difference between INTentry and INTre−entry for any pre-pitch-entry period. Data are presented as mean ± standard deviation.
Match-play responses: comparisons between epochs of playing time
Table 3 shows that values for TD, HSR, average acceleration, total loading, peak speed alongside the number of hit-ups and collisions were reduced during the 5–10 min epoch compared with the 0–5 min following INTentry (all p <0.05, ES: 0.50 to 1.05, small to moderate). Both the 10–15 min (all p <0.05, ES: 0.72 to 1.47, moderate to large) and 15–20 min (all p <0.05, ES: 0.76 to 1.61, moderate to large) epochs elicited lower TD, HSR, total loading, and peak speed responses than the 0–5 min post-INTentry, whilst average acceleration responses were also reduced from 0–5 min values during the 15–20 min following INTentry (p ≤0.001, ES: 1.23 [95% CI: 0.47 to 1.99], large).
Physical and technical performance indicators of interchange players after pitch-entry (non-starters) or re-entry (starters).
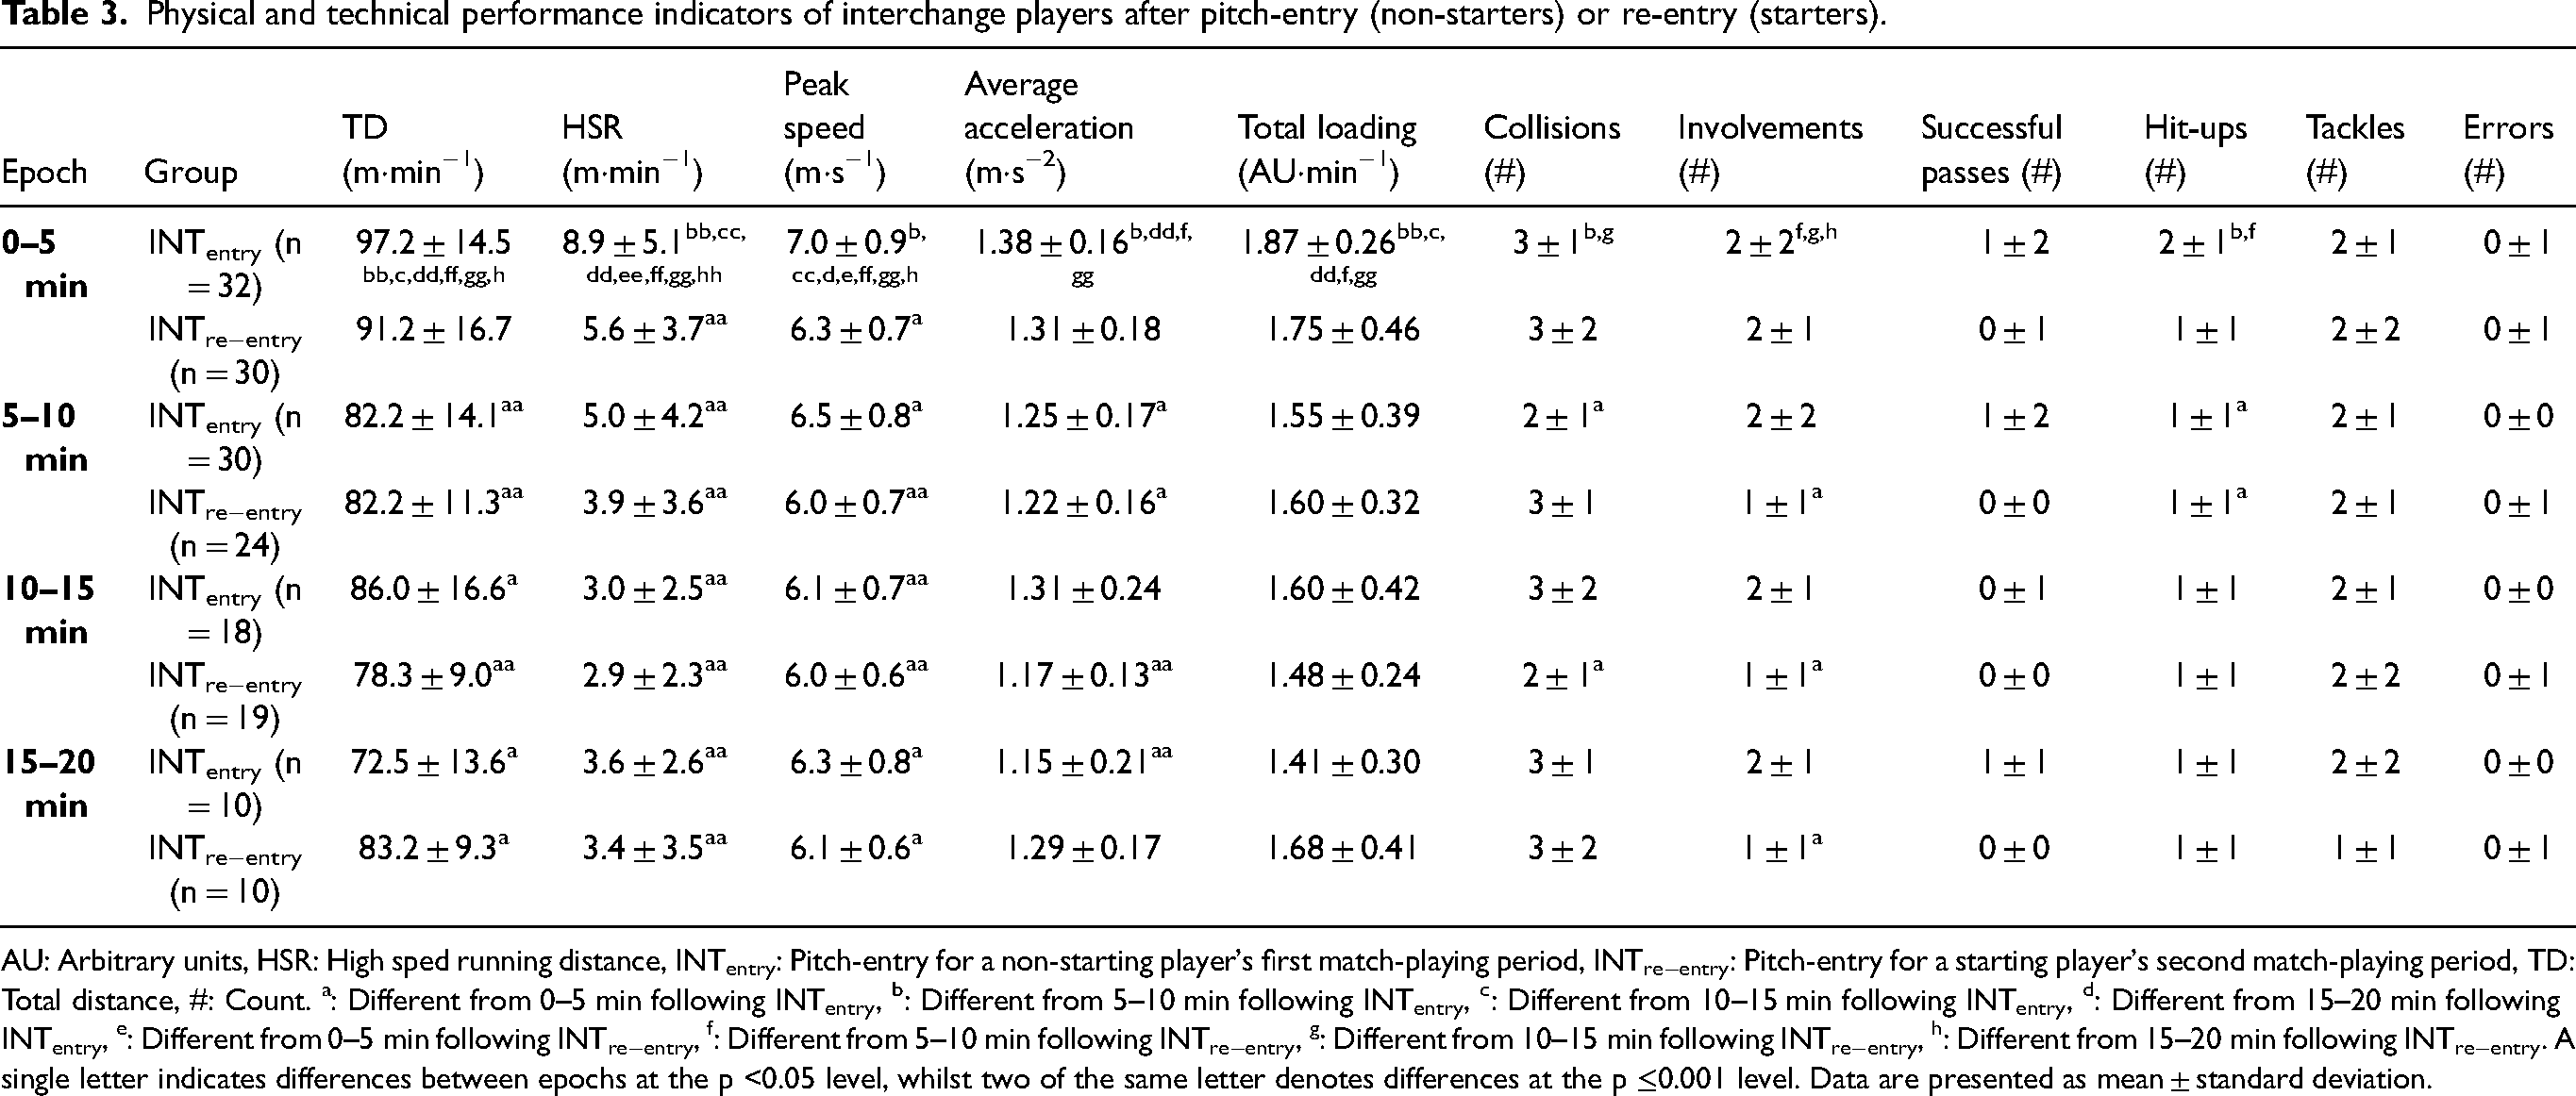
AU: Arbitrary units, HSR: High sped running distance, INTentry: Pitch-entry for a non-starting player's first match-playing period, INTre−entry: Pitch-entry for a starting player's second match-playing period, TD: Total distance, #: Count. a: Different from 0–5 min following INTentry, b: Different from 5–10 min following INTentry, c: Different from 10–15 min following INTentry, d: Different from 15–20 min following INTentry, e: Different from 0–5 min following INTre−entry, f: Different from 5–10 min following INTre−entry, g: Different from 10–15 min following INTre−entry, h: Different from 15–20 min following INTre−entry. A single letter indicates differences between epochs at the p <0.05 level, whilst two of the same letter denotes differences at the p ≤0.001 level. Data are presented as mean ± standard deviation.
Peak speed (p = 0.003, ES: 0.76 [0.22 to 1.25], moderate) and HSR (p ≤0.001, ES: 0.75 [0.24 to 1.27], moderate) responses were both greater during the 0–5 min epoch following INTentry when compared with the 0–5 min after INTre−entry. Moreover, TD, HSR, and peak speed responses, alongside the number of involvements, were greater during the 0–5 min after INTentry when compared with the 5–10 min, 10–15 min, and 15–20 min following INTre−entry (all p <0.05, ES: 0.62 to 1.57, moderate to large). Total loading and average acceleration were also greater during the 0–5 min following INTentry compared with both the 5–10 min and 10–15 min epochs following INTre−entry (all p <0.05, ES: 0.93 to 1.54, moderate to large), whilst the 0–5 min following INTentry elicited more hit-ups than the 5–10 min post-INTre−entry epoch (p = 0.010, ES: 0.88 [0.33 to 1.44], moderate) and more collisions than the 10–15 min epoch following INTre−entry (p = 0.020, ES: 0.91 [0.31 to 1.50], moderate).
Greater TD was recorded during the 0–5 min following INTre−entry compared with responses recorded during the 10–15 min of the same playing bout (p = 0.044, ES: 1.22 [0.46 to 1.99], large), with 0–5 min post-INTre−entry values also exceeding TD covered during the 15–20 min after INTentry (p = 0.011, ES: 0.96 [0.35 to 1.56], moderate). Figure 1 shows individual TD responses per epoch following INTentry and INTre−entry, whilst Figure 2 shows HSR.
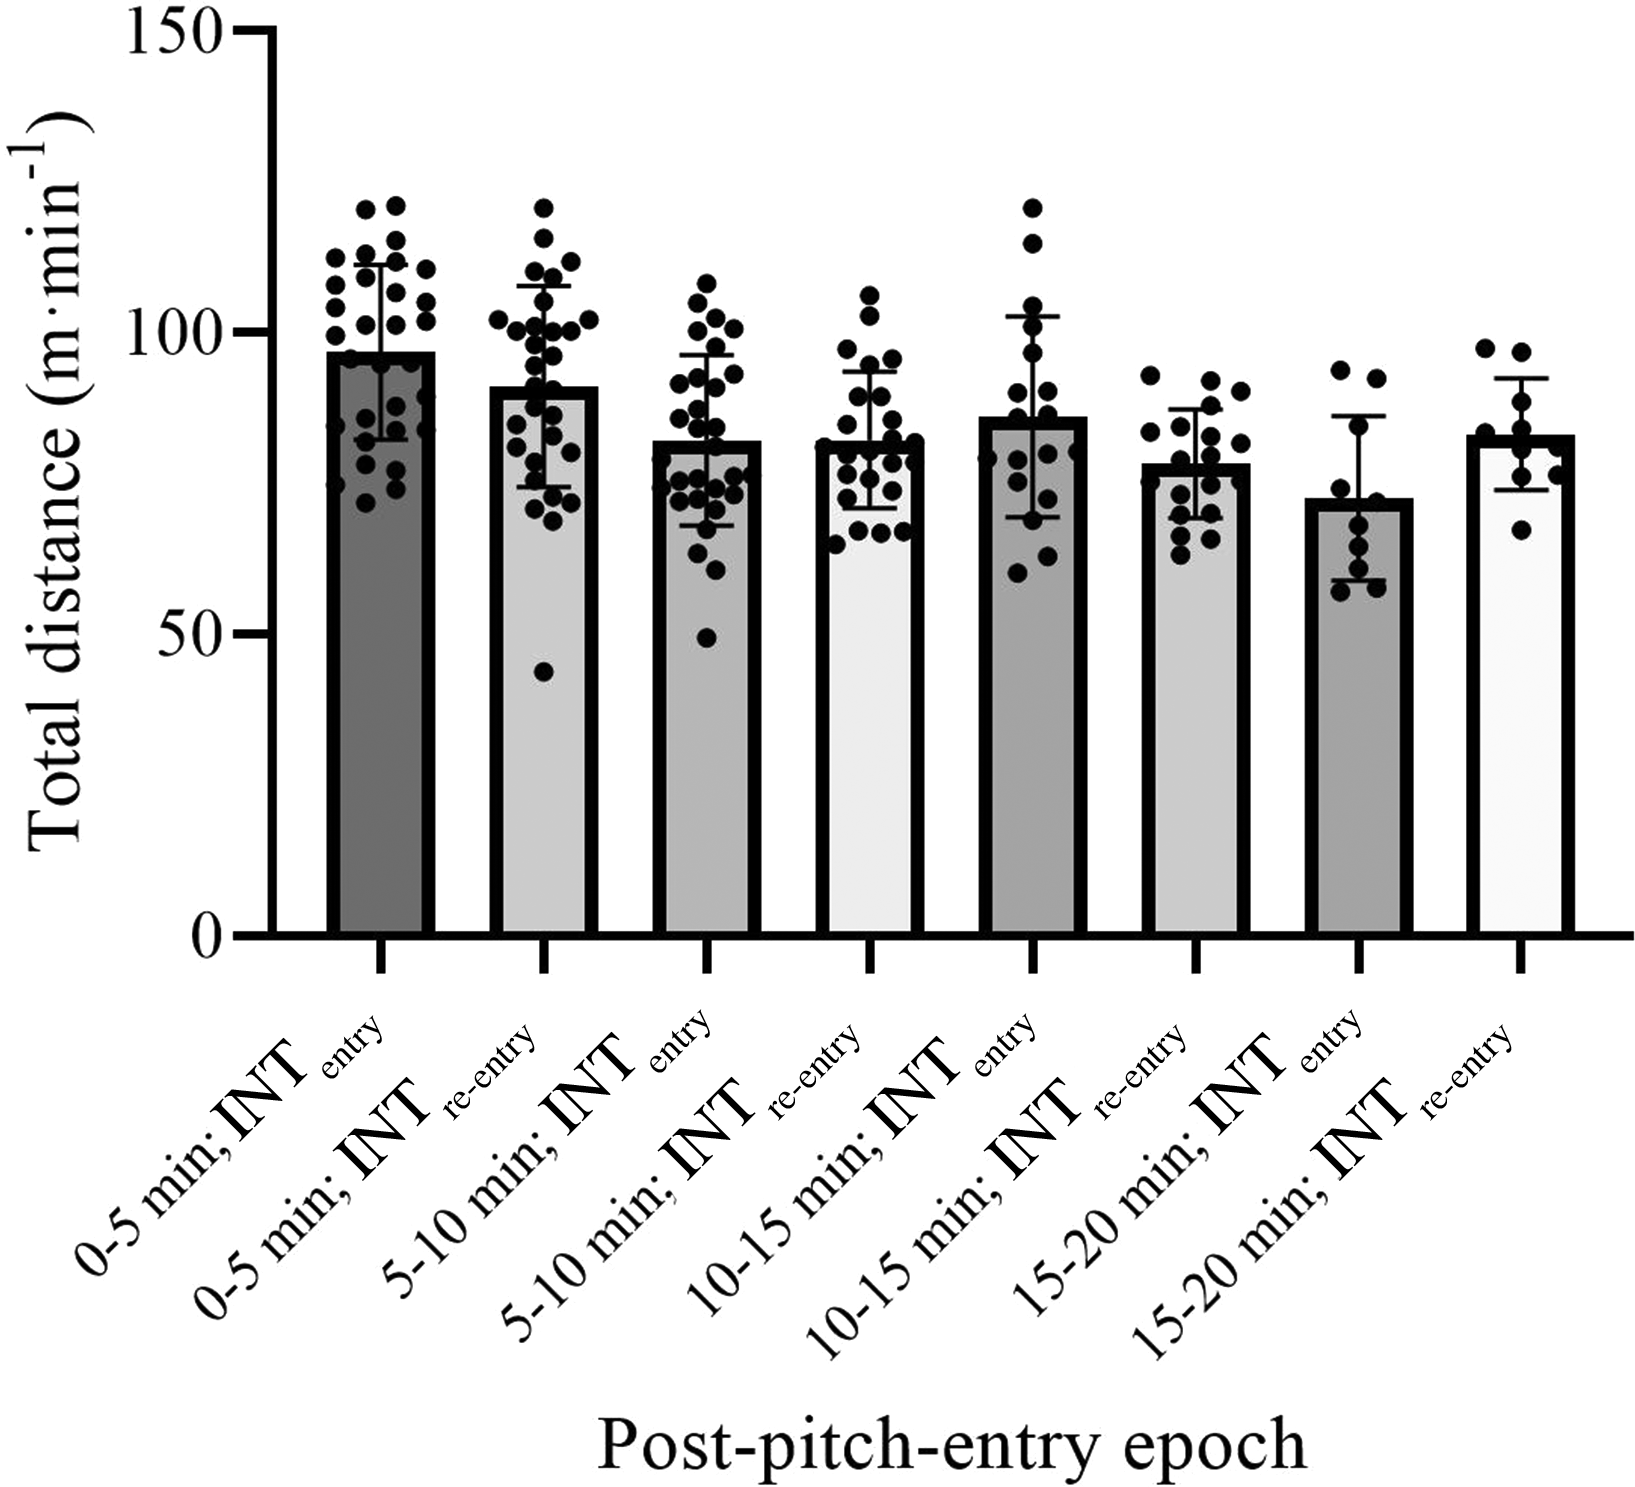
Relative total distance per epoch after pitch-entry (non-starters) or re-entry (starters). INTentry: Pitch-entry for a non-starting player's first match-playing period, INTre–entry: Pitch-entry for a starting player's second match-playing period.
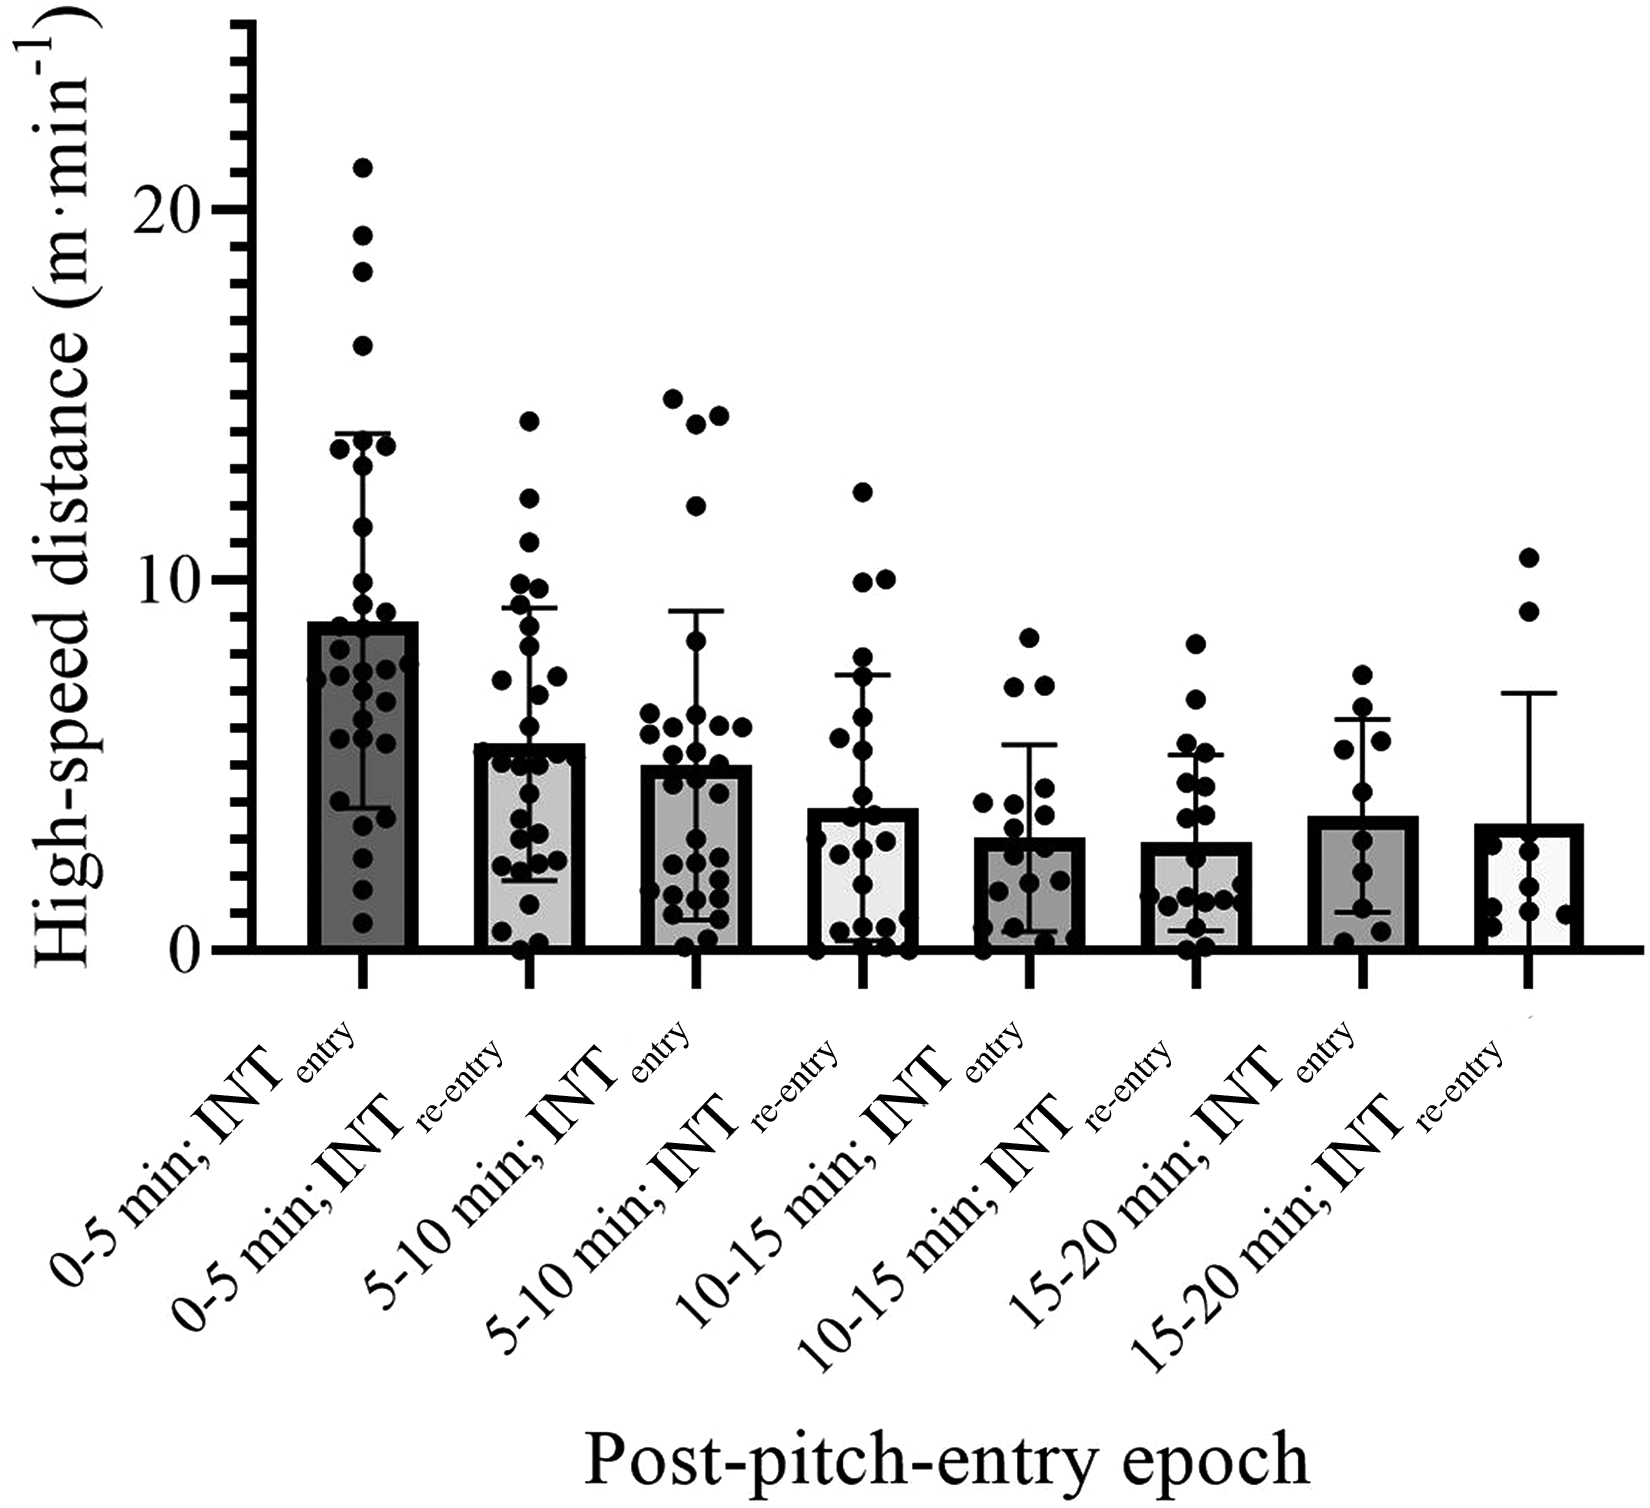
Relative high-speed distance per epoch after pitch-entry (non-starters) or re-entry (starters). INTentry: Pitch-entry for a non-starting player's first match-playing period, INTre–entry: Pitch-entry for a starting player's second match-playing period.
Post-pitch-entry responses: positional and contextual influences
On a per epoch basis (i.e. when epoch was held constant), higher peak speeds were recorded by edge forwards compared with hookers and middle forwards (both p <0.05, ES: 1.05 to 1.06, moderate). Hookers completed more successful passes than both other positions (both p <0.05, ES: 1.05 to 1.09, moderate) and had more involvements than middle forwards (p ≤0.001, ES: 0.48 [0.09 to 0.88], small). Neither the match scoreline nor location represented significant fixed effects for any dependent variable profiled and these factors were omitted from the final models to maximize the goodness of fit.
Correlations between pre- and post-pitch-entry responses (whole sample)
Total loading (p = 0.025, r = −0.32 [-0.55 to −0.04], moderate) and TD (p = 0.017, r = −0.34 [-0.57 to −0.06], moderate) values recorded during the 15 min immediately prior to INTentry or INTre−entry were negatively associated with TD responses during the first five min following INTentry or INTre−entry. Conversely, total loading during the 15 min before INTentry or INTre−entry was positively associated with the number of tackles completed during the initial five min of an individual's subsequent playing bout (p = 0.009, r = 0.43 [0.11 to 0.66], moderate).
Correlations between pre- and post-pitch-entry responses (INTentry)
For INTentry, maximum speed attained during the 10 min (p = 0.010, r = −0.56 [-0.82 to −0.13], large) and 15 min (p = 0.032, r = −0.48 [-0.77 to −0.02], moderate) prior to INTentry was negatively associated with TD covered during a player's first five min after INTentry whilst HSR during the 15 min pre-INTentry was positively related to the number of tackles performed during the 0–5 min after match-introduction (p = 0.049, r = 0.51 [-0.05 to 0.83], large).
Correlations between pre- and post-pitch-entry responses (INTre−entry)
Total loading (p = 0.004, r = −0.60 [-0.83 to −0.19], large) and TD (p ≤0.001, r = −0.68 [-0.87 to −0.33], large) recorded during the 15 min before INTre−entry were negatively correlated with TD covered during the 0–5 min immediately after INTre−entry. However, TD covered during the preceding five min was positively correlated with HSR responses during the 0–5 min after INTre−entry (p = 0.035, r = 0.46 [0.01 to 0.76], moderate).
Discussion
This study quantified the pre- and post-pitch-entry movement profiles and post-pitch-entry technical activities of interchange players during semi-professional rugby league match-play, while assessing transient changes, contextual influences, and the relationship between pre- and post-pitch-entry responses. Players covered ∼14–16 m·min−1 during the 15 min prior to pitch-entry, with similar responses between INTentry and INTre−entry. Locomotor outputs were generally greater during the initial five min following INTentry compared with subsequent five min epochs of the same playing period, with key physical performance indicators and the number of ball involvements during the 0–5 min following INTentry also typically exceeding the per epoch values recorded following INTre−entry. Notably, certain movement variables during the ∼5–15 min prior to INTentry or INTre−entry were positively correlated with the number of tackles and HSR responses during the first five min of the subsequent playing bout, but negatively associated with TD. These data provide novel insights into the physical and technical responses of interchange players in rugby league, indicating transient fluctuations during match-play and apparent differences in pre- and post-pitch-entry correlations for high- (i.e. HSR, tackles) compared with low-speed (i.e. TD) actions. Such information may assist players and coaches seeking to optimize preparatory and recovery practices for this population of rugby league players, while potentially also helping to inform interchange strategies designed to maximize a player's impact on the match.
Players covered ≤16 m·min−1 during the 5–15 min prior to INTentry or INTre−entry, with <0.5 m·min−1 of HSR and reaching peak speeds of ∼2.8–4.4 m·s−1. As interchange players enter the pitch whilst the match is underway, whether or not they have already participated in the earlier stages of a match, they may experience a substantial period (i.e. likely ≥20–30 min) between the end of any previous exercise bout (e.g. the pre-match warm-up or a previous on-pitch rotation) and INTentry or INTre−entry. 1 Notably, acknowledging that excessive pre-pitch-entry activity could impair physical performance via the negative effects of fatigue and resultant lower pacing strategies,1,28 completing an active rewarm-up during the intervening period when ≥15 min separates exercise bouts has typically benefitted body temperature maintenance and subsequent physical performance in explosive team sports-specific tasks compared with passive rest11,12,29 Whilst the physiological responses to the observed activity patterns remain unclear, existing recommendations emphasize the value of rewarm-up intensity (i.e. reaching ∼90% of maximum heart rate) for maximizing subsequent explosive performance. 9 Such recommendations may indicate the potential value in players in the current study increasing the volume and/or speed of activities performed shortly before pitch-entry or re-entry.
Transient fluctuations in indices of physical and technical performance were observed after INTentry or INTre−entry. Published observations have indicated that interchange players in professional rugby league covered their greatest running distances at speeds >3.9 m·s−1 during the first quartile of their initial playing bout, with declines during each subsequent quartile. 1 Although such responses may have been elevated by the inclusion of bout one data from interchange players who started a match on the pitch,3,7 the current study also highlights substantial declines in all physical variables between the first and second five min epochs following INTentry even for players who entered the pitch for the first time while the match was already underway. Unlike the stepwise decline in relative running responses that has previously been reported throughout an interchange player's initial on-pitch rotation, 1 values remained unchanged for the next three five min epochs (i.e. from 5–20 min post-pitch-entry) for all dependent variables assessed following INTentry. Whilst such findings may appear difficult to reconcile, it is possible that these discrepancies are at least partly attributable to differences in match analysis techniques between the current study and previous research that has investigated the physical responses of rugby league players. Whereas Waldron et al. 1 partitioned an individual's playing bout into quartiles (i.e. the length of which varied according to the length of the overall bout duration), this investigation used five min epochs irrespective of bout duration. It is also possible that a reduction in the number of interchanges permitted per match (i.e. from 12 interchanges permitted in the aforementioned study 1 to eight interchanges now allowed) may have influenced the tactics and responses associated with interchange players. For example, players entering the pitch knowing that fewer interchanges are available for their team may consciously or subconsciously regulate their physical outputs to a greater extent than if more frequent interchanges can be made.
The heightened physical outputs observed during the five min immediately post-INTentry relative to subsequent epochs may largely reflect the tactics of the reference team. For example, the increased number of hit-ups and collisions during the initial epoch after INTentry could indicate a deliberate team strategy to ensure that individuals perceived to have ‘fresh legs’ are frequently used as ball-carriers. This suggestion appears to be supported by observations that the first five min following INTentry elicited more ball involvements compared with the 5–10 min, 10–15 min, and 15–20 min after INTre−entry, whilst also eliciting more hit-ups than the 5–10 min epoch and more collisions than the 10–15 min epoch following INTre−entry. Alongside a likely decrease in the overall pace of play as a match progresses and potentially greater levels of fatigue amongst players returning for their second on-pitch rotation,3,4,7 a tactical decision to make use of incoming players to perform crucial technical and physical actions may therefore have contributed to non-starters during the first five min after INTentry generally exceeding the relative physical outputs of starters after INTre−entry.
Although a limited number of positions are typically involved in interchanges and the current sample consisted primarily of middle forwards, edge forwards during match-play reached higher peak speeds than both hookers and middle forwards. Moreover, hookers completed more passes per epoch than both other positions and had more involvements than middle forwards. Whilst between-position differences in the typical availability of space within which to run may potentially explain edge forwards’ greater peak speeds, 30 hookers play a primary role in ball-distribution and have previously recorded the most touches of the ball per unit of playing time. 31 The strategic interchanging of hookers may plausibly represent a means by which to help maintain team technical/tactical performance throughout a match.
The TD covered during the five min prior to INTre−entry positively correlated with HSR responses during the first five min of the subsequent playing bout, while positive associations were also observed between a) total loading (both INTentry and INTre−entry) and HSR (INTentry) during the 15 min before, and b) the number of tackles completed during the five min after INTentry or INTre−entry. It has been proposed that rugby league and other team sports players may consciously or subconsciously regulate their physical outputs based on not only on a priori knowledge of the task constraints but also ongoing sensory feedback.1,2 Although not possible to determine, positive relationships between pre- and post-pitch-entry responses could at least partly reflect feelings of greater preparedness to contribute to high-speed match activities (e.g. tackles) when players had performed more preparatory activity prior to pitch-entry. Notably, increasing the activity performed by professional soccer substitutes prior to pitch-entry appeared to benefit key movement-related performance indicators after match-play introduction, while potentially contributing to improved match scoreline responses. 16 The current data could also indicate that players expecting to be involved in more high-speed actions following pitch-entry may prepare by performing more match-specific activities such as tackling or changing direction (i.e. activities that accumulate greater accelerometer loading) before entering the match. 32
Conversely, negative correlations were observed between the amount of activity completed during the 15 min prior to INTentry or INTre−entry (i.e. as indicated by TD, total loading, or peak speed) and TD responses during the first five min of subsequent match-play. Whilst a lack of physiological data limits the ability to definitely comment on the reasons underlying these findings, it seems unlikely that the volume and intensity of movements observed shortly prior to INTentry or INTre−entry (e.g. TD ≤16 m·min−1) would be sufficient to elicit substantial or performance-limiting physical fatigue in semi-professional standard players. As such, it may be speculated that these negative correlations may indicate movement patterns that were partly informed by a player's own conscious or subconscious desire to ‘warm-up’ (i.e. to elicit the ergogenic physiological responses typically desired from a pre-performance active warm-up) having already entered or re-entered the pitch when minimal prior activity had been performed.
Whilst physical and technical responses represent crucial components of rugby league match-play performance, 4 these variables alone do not elucidate a player's overall contribution to their team. Future research investigating an interchange player's role from a more holistic perspective (e.g. using player and manager subjective performance ratings, or performance algorithms) while also considering a broader range of contextual factors could enable firmer conclusions to be drawn. That said, interchanges are often used in an attempt to offset declines in physical and technical outputs across a team,4–6 and many of the variables quantified in the current study are considered to be key performance indicators. 4 Finally, whilst movement data provide valuable information relating to the volume and speed of activity completed prior to INTentry or INTre−entry, they do not definitively indicate the physiological responses or the specific types of activities being performed during this time. However, the current study provides novel insights into the pre-pitch-entry movement profiles of semi-professional rugby league players whilst assessing physical and technical performance responses following INTentry or INTre−entry.
Conclusion
Increased activity in the ∼5–15 min prior to INTentry or INTre−entry was associated with more tackles and increased HSR responses during the first five minutes of an interchange player's bout, potentially indicating a match-play performance benefit. Transient fluctuations in physical and technical responses were observed during match-play, but a plateau in physical outputs from 5–10 min post-pitch-entry onwards could suggest that factors other than fatigue may largely explain transient fluctuations in interchange players’ match-play responses.
Increasing the activity performed during the ∼15 min before pitch-entry could benefit high-speed match-play performance indicators and allow interchange players to be used during crucial actions (e.g. ball carries, tackles) to provide a sustained physical and technical impact in line with interchange objectives. Relationships between increased accelerometer load prior to pitch-entry and tackle responses during the five min after entering the match could indicate a high-speed performance benefit to incorporating match-specific activities such as tackling and changing direction shortly before pitch-entry.
Footnotes
Acknowledgements
The authors would like to thank players and staff at Norths Devils Rugby League Club for their participation and cooperation with data-collection.
Declaration of conflicting interests
The author(s) declared no potential conflicts of interest with respect to the research, authorship, and/or publication of this article.
Funding
The author(s) received no financial support for the research, authorship, and/or publication of this article.