
Abstract
This study compared the Yo-Yo intermittent recovery level 1 (YYIR1) and Bronco tests among amateur rugby referees and examined whether the results of these tests were associated with actual match demands. Sixty-seven (65 male, 2 female; 30 ± 11 years; 77.4 ± 13.1 kg; 175 ± 8 cm) amateur rugby referees participated. Match demands were assessed using Global Navigation Satellite System technology and heart rate (HR) recordings. Significant correlations (all p < 0.05) were found between the YYIR1 and Bronco test results (r: −0.88). The YYIR1 test was significantly correlated with match demands including total (r: 0.56) and high-intensity (r: 0.70) distance covered, maximal speed reached (r: 0.73), and the number of high-intensity accelerations (r: 0.54) and sprints (r: 0.68) completed. Furthermore, YYIR1 test maximum HR was significantly correlated with maximum HR (r: 0.72), average HR (r: 0.54), and internal load (r: 0.55) during match play. In contrast, the Bronco test was only significantly correlated with match demands including maximal speed reached (r: −0.68) and the number of high-intensity accelerations (r: −0.61). Moreover, Bronco test maximum HR was significantly correlated with maximal (r: 0.84) and average HR (r: 0.73) during match play. The results suggest that while the YYIR1 and Bronco tests might both be efficient tools to guide training prescription, the YYIR1 test might be as the more valuable test to assess match fitness in rugby referees.
Keywords
Introduction
Rugby union (“rugby”) is a highly demanding intermittent contact sport, consisting of high-intensity efforts interspersed with low-intensity activity played over two 40-min halves.1,2 During match play, rugby referees combine high-intensity running actions, with low-intensity activity, covering six to eight kilometres per match, with a corresponding mean heart rate of 80% of their maximum.2–6 On average, during semi-professional and professional matches, a referee covers 11% of the total match distance in high intensity (> 18. 4 km.h−1) running,4,6 and it has been reported that there is a small to moderate decrease in high-intensity running during the middle period of a match (i.e. 30–70 min), with no differences reported between 0–10 and 70–80 min. 4 It is important that rugby referees can maintain their physical performance throughout a match, and their ability to meet the physical (i.e. high-intensity running) and physiological (i.e. heart rate) demands imposed on them during match play is crucial for optimal positioning and decision-making.2,4,7,8
Therefore, minimum mandatory fitness requirements have been established for rugby referees by governing bodies using field tests, with referees who achieve these standards deemed fit enough to cope with the match demands of officiating. However, how the results of these fitness tests relate to the demands placed on rugby referees during actual match play (i.e. direct validity) is unclear. Indeed, studies with soccer referees have reported poor correlations between field tests measures (e.g. mean heart rate during the high-intensity 150-m interval test) and match demands (e.g. total distance covered and high speed running). 9 However, these results contrast with one study that reported large significant correlations between heart rate during the high-intensity 150-m interval test and match high-intensity running. 10 Therefore, given the mixed results in the literature and the nonspecific nature of the field tests used to assess the fitness of rugby referees, it is important that the relationships between field test results and actual match demands are examined.
The Yo-Yo intermittent recovery level 1 (YYIR1) 11 is regularly used to provide an indirect indication of the physical capacity of intermittent team sport athletes.12,13 When the standards for the YYIR1 test were established, they were used globally to evaluate the capacity to repeatedly perform and recover from intense activity.11–13 It is within this context that this test is used for rugby referees. For instance, acceptable YYIR1 test levels have been suggested for elite male and female rugby referees (i.e. levels 18 and 15, respectively), 13 as they can officiate any rugby match, regardless of the gender of the players (i.e. men or women). However, to date, no empirical research has supported these fitness standards, and applied practitioners have started to use other more expedient test with referees. Indeed, recently, the 1.2 km shuttle run test (1.2SRT), 14 also known as the Bronco test, is gaining popularity in applied rugby contexts.15,16 It has been used to assess rugby referees’ fitness levels and has been shown to strongly correlate with the YYIR1 (r = −0.87) among elite youth rugby players. 15 Both tests (i.e. YYIR1 and Bronco) are used for rugby referees as they incorporate repeated high-intensity sprints as well as periods of acceleration, deceleration and change in direction, which are characteristics of intermittent activities, such as refereeing. 17 Additionally, the YYIR1 is regularly used to assess aerobic power (i.e. oxygen uptake during dynamic exercise), providing an indirect indication of the physical capacity of intermittent team sport athletes,12,13 and the Bronco test can be used to determine maximal aerobic running speed.15,16 The information provided from these tests enables practitioners to monitor individual development and can be used for training prescription and to evaluate the impact of training interventions.18,19 However, the relationship between the results of these field tests and the actual match demands placed on rugby referees has not yet been investigated. This information is important because direct validity is considered an essential pre-requisite of an accurate sport-specific field test. 20
To extend previous research, this study aimed to: (1) directly compare the YYIR1 and Bronco tests, by correlating the final results of (e.g. distance, completion time), and physiological responses during (e.g. heart rate [HR] and internal load), the two tests; and (2) verify the direct validity of the YYIR1 and Bronco tests by examining how the results of these tests relate to the physical (e.g. high-intensity distance) and physiological (e.g. internal load) demands placed on rugby referees during actual match play.
Methods
Participants
Overall, 67 referees (65 male, 2 female; age: 30 ± 11 years [range: 18–57 years]; body mass: 77.4 ± 13.1 kg; height: 175 ± 8 cm), with at least two years’ officiating experience (7 ± 5 years), participated in the study. Referees could not participate if they had not been refereeing in the previous six months or more due to injury. This study received institutional ethical approval and informed consent was obtained from each referee.
Field test analysis: YYIR1 test data was collected from 48 referees (46 male, 2 female; age: 27 ± 8 years; body mass: 76.6 ± 13.9 kg, height: 175 ± 8 cm; experience: 6 ± 4 years), and Bronco test data was collected from 35 referees (34 male, 1 female; age: 29 ± 11 years; body mass: 75.7 ± 12.5 kg; height: 174 ± 9 cm; experience: 7 ± 6 years). Of these referees, 32 completed both field tests (31 male, 1 female; age: 27 ± 8 years; body mass: 74.3 ± 11.9 kg; height: 174 ± 9 cm; experience: 6 ± 4 years).
Match demands analysis: Match demand data was collected from 16 referees (15 male, 1 female; age: 24 ± 5 years; body mass: 76.6 ± 10.3 kg; height: 177 ± 8 cm; experience: 6 ± 4 years) over 27 matches, ranging from two to six matches per referee (1.7 ± 1.5 matches per referee). While all 16 of these referees completed the YYIR1 test, only 11 performed the Bronco test (11 male, age: 23 ± 5 years; body mass: 79.3 ± 7.3 kg; height: 180 ± 7 cm; experience: 6 ± 3 years).
The sample size justification was resource constraint based 21 in that we were constrained by the referees’ availability to voluntary attend both tests and matches. All referees were amateur and actively officiating in South Africa at either the residence “Koshuis” tournament at Stellenbosch University, or the Western Province Rugby Union Super League competition, played across the Western Cape Province. The “Koshuis” tournament includes ∼200 matches over seven months, divided into first-, second-, third-, and fourth- league matches, played on weeknights. Except for one “private-residence” team, all teams comprised Stellenbosch University students and could be described as recreational, with some semi-professional players. The total match duration was 60 min for leagues one to three, and 50 min for the fourth league. 22 The Western Province Super League is organised by the Western Province Rugby Union (i.e. one of the fourteen provincial unions in South Africa), and is played by amateur clubs, sub-divided into A, B, C, and Under 20 teams. It follows a single round format where each team plays every other team in their league once a season (April to September), and total match duration was 80 min for league A, 70 min for leagues B and Under 20, and 60 min for league C. 23
Study protocol
An observational research design was used. During the field tests and rugby matches, referees wore an elasticated vest with an augmented concurrent multi-GNSS receiver unit (Apex, 10 Hz, STATSports, Belfast, UK), located between their shoulder blades. The validity and reliability of this GNSS unit has been reported previously. 24 The GNSS unit was switched on ∼15 min before, and turned off immediately after, each field test and match. HR data was collected during the field tests and matches through a HR sensor (Polar T31, Polar Electro, Kempele, Finland) worn around each referee's chest, which transmitted real-time data via Bluetooth to the GNSS unit. All measurements were obtained at the end of the competitive season, and field testing was performed by the same assessors.
Testing procedures
Both field tests were performed on a rugby field on dry and firm conditions, and a minimum of 48 h and a maximum of six days rest between tests. As the field tests were scheduled by the research team based on the referee's availability, it was not possible to counterbalance the order in which the referees completed the two field tests (i.e. 28 referees performed the YYIR1 test first, while four referees performed the Bronco test first). All referees were familiar with both testing protocols as they complete them regularly throughout the season. The referees were requested not to undertake vigorous physical activity and to maintain normal dietary intake and sleeping patterns in the preceding 24 h, and avoid consuming a heavy meal and caffeinated beverages in the preceding two hours. Finally, referees were allowed to do their own warm-up for 10 min before each test, with activation exercises and one high-intensity running shuttle (i.e. 20-m and back) advised before the YYIR1 test, and one practice repetition (i.e. 20-m-40-m-60-m) recommended before the Bronco test
The YYIR1 test was performed according to standard procedures,11,12 comprising repeated 2 × 20-m shuttles at a progressively increasing speed controlled by audio signals with an active 10-s rest between each shuttle, which consisted of jogging 2 × 5-m. When the referees failed twice to reach the finish line before the audio signal, the test was ended and the final distance (m) and level were recorded.11,12 The test lasted ∼20 min.
For the Bronco test, cones were placed at the 0-m, 20-m, 40-m, and 60-m lines and marked using a 50-m measuring tape (Richer 50-meter steel). Referees were asked to run from the 0-m line to the 20-m line and back, then run from the 0-m line to the 40-m line and back, and finally run from the 0-m line to the 60-m line and back. Completion of these 20-m-40-m-60-m shuttles was considered one repetition, with referees completing five repetitions to achieve a distance of 1200 m as quickly as possible.14,16,25 A hand-held stop watch (Casio HS-80TW-1EF) was used to record completion time in seconds. 16 The test lasted ∼6 min.
In line with previous research, 10 the physical demands assessed during both field tests and actual match play included: total, relative (m.min−1), and high-intensity (> 18.4 km.h−1) distance covered (m), maximal speed (km.h−1), and number of high-intensity (> 2.79 m.s−2) accelerations (n) and sprints (20 km.h−1 or greater sustained for at least one second) (n)6,26 and the frequency (n) of repeated high-intensity efforts (RHIE) bouts was analysed. A RHIE bout was defined as a minimum of three high-intensity efforts (i.e. sprints or high-intensity accelerations) with less than 21 s of recovery between efforts.6,26,27 The single longest period of a RHIE bout from each match was identified and analysed as the “Worst Case Scenario” (WCS).6,26,28,29 A bout duration was defined as the time the referee first performed a high-intensity activity (i.e. sprint or acceleration) and repeated a minimum of two other efforts with less than 21 s between those efforts.6,26 For each WCS, the total duration (s), total distance (m), and total distance relative to the bout duration (m.min−1) was analysed. Additionally, high metabolic load (HML) distance (m) (i.e. distance covered > 18.1 km.h−1 and accelerating and decelerating over 2 m.s−2), and HML efforts (n) (i.e. number of separate efforts undertaken in producing HML distance) were analysed. 30 Accelerations and decelerations were calculated from a single derivation of the speed during a period of 0.5 s. 31 These speed zones were selected as they have previously been used in the analysis of rugby referees,3,4,6 and are in accordance with training programmes guidelines for rugby referees. 13
HR data was assessed during both field tests and actual match play, with maximal HR (HRmax) determined as the highest of either: (1) HRmax estimated thorough the formula: 208 – (0.7 × age), 32 or (2) HRmax values obtained during the field tests33,34 or match. 4 HR data was classified based on the percentage of total time spent in six HR zones 4 : zone 1 (< 60% HRmax), zone 2 (61–70% HRmax), zone 3 (71–80% HRmax), zone 4 (81–90% HRmax), zone 5 (91–95% HRmax), and zone 6 (> 96% HRmax). Internal load was calculated by multiplying the time spent (in mins) in the five HR zones by a coefficient assigned to each zone (i.e. 50–60% HRmax = 1, 60–70% HRmax = 2, 70–80% HRmax = 3, 80–90% HRmax = 4, and 90–100% HRmax = 5). 35
Statistical analysis
The sample size in all analysis was comparable to previous research, 9 and deemed adequate (software G*Power 3.1.9.7; Heinrich-Heine-Universität Düsseldorf, Düsseldorf, Germany) assuming statistical power of 80% and α error probability of 0.05. 36 After collection, data from each GNSS unit was downloaded to analysis software (STATSports Apex software, v. 3.0.02011), and then exported to statistical analysis software (IBM SPSS v. 26.0; IBM Corp., Armonk, NY, USA). Kolmogorov-Smirnov tests revealed that data was normally distributed. Next, means, standard deviations, and 95% confidence intervals were calculated. Subsequently, a series of Pearson's product-moment tests were conducted to assess the correlations between: (1) the YYIR1 final level and distance versus the Bronco test final time, (2) HR and internal load from the YYIR1 test versus HR and internal load from the Bronco test, and (3) the aforementioned field test data and physical (i.e. total, relative and high-intensity distance, maximal speed, high-intensity accelerations, sprints, RHIE, WCS distance, WCS duration, and WCS relative distance, and HML efforts and distance) and physiological (i.e. HR and internal load) demands during actual match play. Given the different number of matches officiated by each referee, the average match demands were calculated for each referee and used throughout the third step. Correlation coefficients (r) of 0.1–0.3, 0.3–0.5, and > 0.5 were interpreted as small, medium, and large, respectively. 37
Next, a single two-way repeated measure analysis of variance (ANOVA) with follow-up paired samples t-tests was used to determine the differences between the six HR zones for the YYIR1 and Bronco tests. Effect sizes were calculated as partial eta squared (ηp2), and values of ≥ 0.01, ≥ 0.06, and ≥ 0.14 were interpreted as small, medium, and large, respectively. 38 Additionally, differences in HR and internal load between the YYIR1 and Bronco tests were assessed via a dependent t-test, with Cohen's d effect sizes of 0.2, 0.5, and 0.8 interpreted as small, medium, and large, respectively. 38
Finally, since the YYIR1 test final distance was significantly correlated with the time taken to complete the Bronco test, a separate linear regression equation was generated to estimate the YYIR1 test final distance. The YYIR1 test final distance was entered as the dependent variable, and the time taken to complete the Bronco test was entered as independent variable. The adequacy of the results generated by the equation was investigated through Bland-Altman's graphical analysis between true and estimated values, and concomitant analysis of result significance through: (1) simple Student's t-test between “0” and the difference in results between true and estimated values of YYIR1 test final distance, and (2) linear regression analysis of agreement values.
39
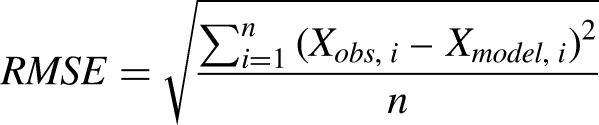
The bias (mean difference between true and estimated values), accuracy (overall distance between true and estimated values), and precision (statistical variance) of the equation were calculated by the scaled mean error (SME), the root mean square error (RMSE), and the coefficient of variance (CV), respectively
40
:


The reliability between true and estimated values (YYIR1 test final distance) generated by Equation 1 was also analysed using an absolute-agreement, two-way mixed model, intraclass correlation coefficient (ICC), and values of < 0.5, 0.5–0.75, 0.75–0.9, and > 0.90 were interpreted as poor, moderate, good, and excellent reliability, respectively. 41 An α of 0.05 was used in all analyses.
Results
Field tests results
Compared to the Bronco test, HRmax was significantly higher in the YYIR1 test both in terms of bpm−1, t(26) = 5.16, p < 0.001, d = 0.74, and percentage, t(27) = 5.35, p < 0.001, d = 1.27. Additionally, internal load was significantly greater in the YYIR1 test compared to the Bronco test, t(26) = 6.72, p < 0.001, d = 1.89. Average HR did not differ significantly (p = 0.764) (Table 1).
Mean ± SD (CI95%) results, HR, and internal load data during the YYIR1 (n = 48) and Bronco (n = 35) tests.
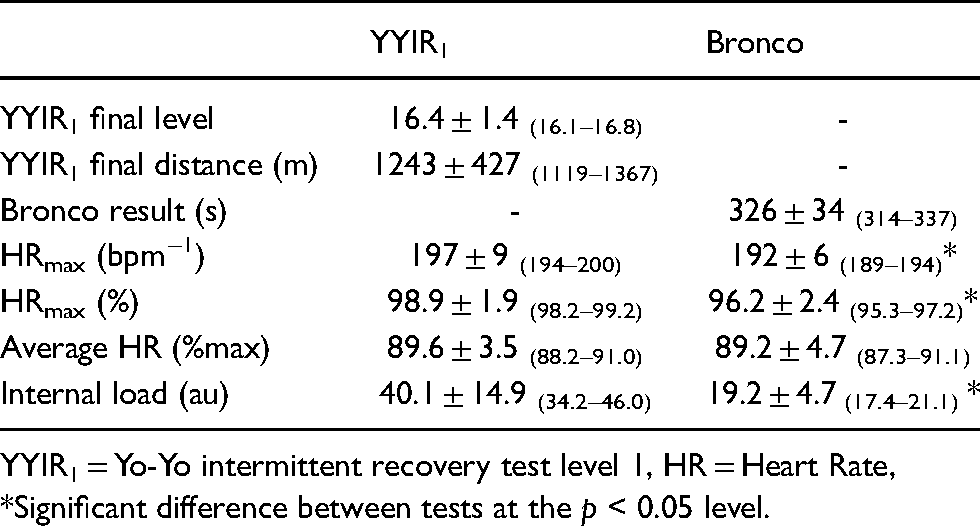
YYIR1 = Yo-Yo intermittent recovery test level 1, HR = Heart Rate, *Significant difference between tests at the p < 0.05 level.
Relationships between YYIR1 and Bronco test data
There was a significant negative correlation between total distance covered in the YYIR1 test and the time taken to complete the Bronco test (p < 0.001), and a significant positive correlation between average HR in the YYIR1 and Bronco tests (p = 0.034). Finally, there was a significant negative correlation between internal load during the YYIR1 test and the time taken to complete the Bronco test (p < 0.001) (Table 2).
Correlations coefficients between performance, HR, and internal load from the YYIR1 and Bronco tests (n = 32).
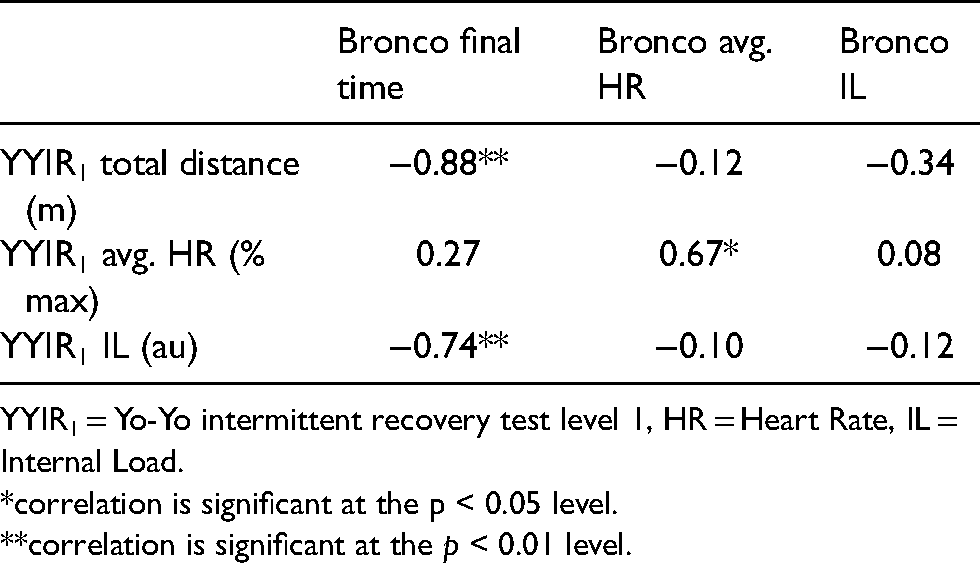
YYIR1 = Yo-Yo intermittent recovery test level 1, HR = Heart Rate, IL = Internal Load. *correlation is significant at the p < 0.05 level. **correlation is significant at the p < 0.01 level.
Comparisons between HR zone data during the YYIR1 and Bronco tests
There was no significant main effect for Test, F(1, 307) = 0.44, p = 0.509, ηp2 = 0.00. However, there was a significant main effect for HR Zone, F(5, 307) = 40.90, p < 0.001, ηp2 = 0.40, and a significant interaction effect, F(5, 307) = 3.24, p = 0.007, ηp2 = 0.05. Follow up t-tests revealed that referees spent significantly less time in HR zone 5 (91–95 HRmax, p = 0.040), and more time in HR zone 6 (> 96% HRmax, p = 0.049), during the YYIR1 test compared to the Bronco test Furthermore, during the YYIR1 test, referees spent longer in HR zone 6 (> 96% HRmax) compared to HR zones 1 (< 60% HRmax, p < 0.001), 2 (61–70% HRmax, p < 0.001), 3 (71–80% HRmax, p < 0.001), and 4 (80–90% HRmax, p = 0.021). Finally, during the Bronco test, referees spent longer in HR zones 4 (81–90% HRmax), 5 (91–95% HRmax) and 6 (> 96% HRmax) compared to HR zones 1 (< 60% HRmax, ps < 0.001), 2 (61–70% HRmax, ps < 0.002), and 3 (71–80% HRmax, ps < 0.018), and longer in HR zone 3 (71–80% HRmax) compared to HR zones 1 (< 60% HRmax, p = 0.003) and 2 (61–70% HRmax, p = 0.008) (Figure 1).
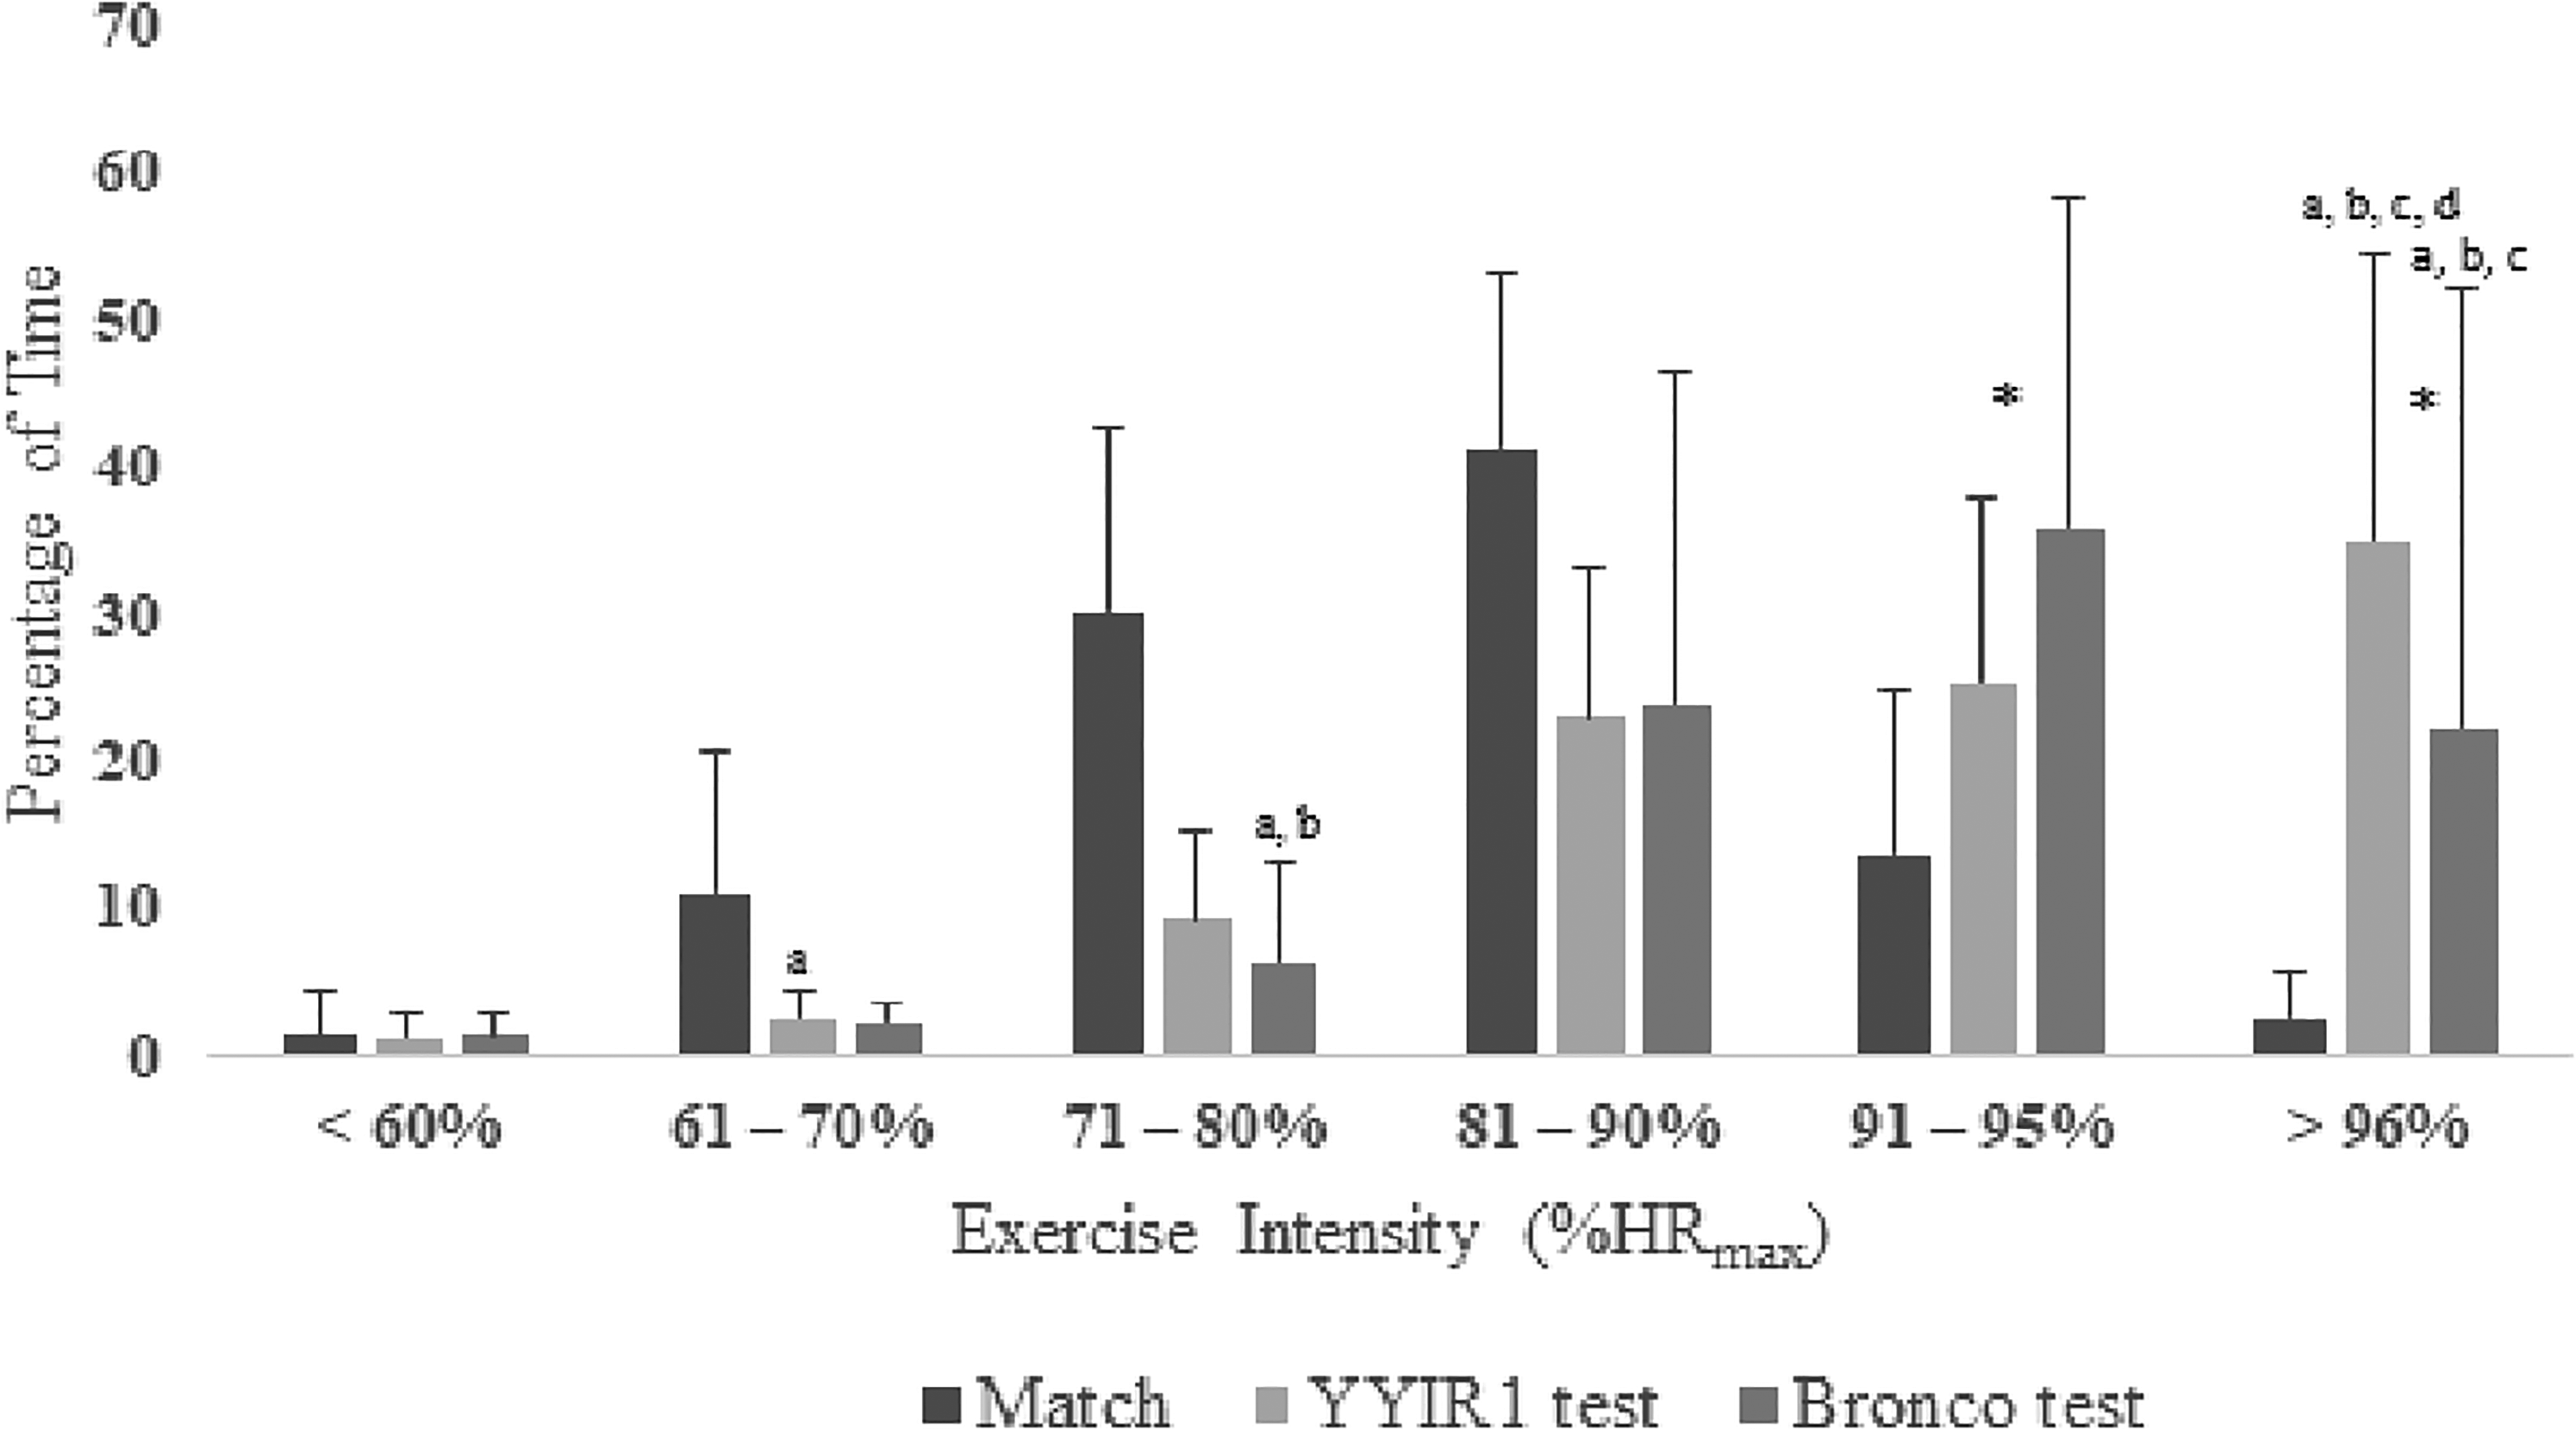
Percentage of time spent in each HR zone during matches, as well as the YYIR1 and bronco tests. Notes: Differences between the six HR zones for the YYIR1 and Bronco tests = *Significant difference between tests at the p < 0.05 level; a Significantly different from < 60% HRmax, b Significantly different from 61–70% HRmax, c Significantly different from 71–80% HRmax, and d Significantly different from 81–90% HRmax.
Relationships between field tests results and match demands
The average descriptive match demand data from 16 referees for between one and six matches per referee, with a total of 27 matches (mean 1.7 ± 1.5 matches per referee) are presented in Table 3. There were significant positive correlations between YYIR1 test final distance and match demands including: total (p = 0.023) and high-intensity (p = 0.002) distance, maximal speed (p = 0.001), number of high-intensity accelerations (p = 0.022) and sprints (p = 0.004), and number of repeated high-intensity efforts (p = 0.019), WCS duration (p = 0.035), distance covered during the WCS (p = 0.047), number of HML efforts (p = 0.002) and HML distance (p = 0.003). Additionally, there were significant negative correlations between the final time taken to complete the Bronco test and match demands including: maximal speed (p = 0.022), number of high-intensity accelerations (p = 0.048), and relative distance covered during the WCS (p = 0.030) (Table 4). Finally, additional correlation analyses were conducted with a sample of 11 referees who undertook both tests. There were significant positive correlations between YYIR1 test final distance and match demands including total (p = 0.037) and high-intensity (p = 0.006) distance, maximal speed (p = 0.003), number of high-intensity accelerations (p = 0.036) and sprints (p = 0.007), and number of repeated high-intensity efforts (p = 0.046), distance covered during the WCS (p = 0.034), relative distance covered during the WCS (p = 0.031), number of HML efforts (p = 0.005), and HML distance (p = 0.007). Additionally, there were significant negative correlations between the final time taken to complete the Bronco test and match demands including maximal speed (p = 0.022), number of high-intensity accelerations (p = 0.048), and relative distance covered during the WCS (p = 0.030) (Table 5).
Mean ± SD (CI95%) match (i.e. physical and physiological) demand data per match.
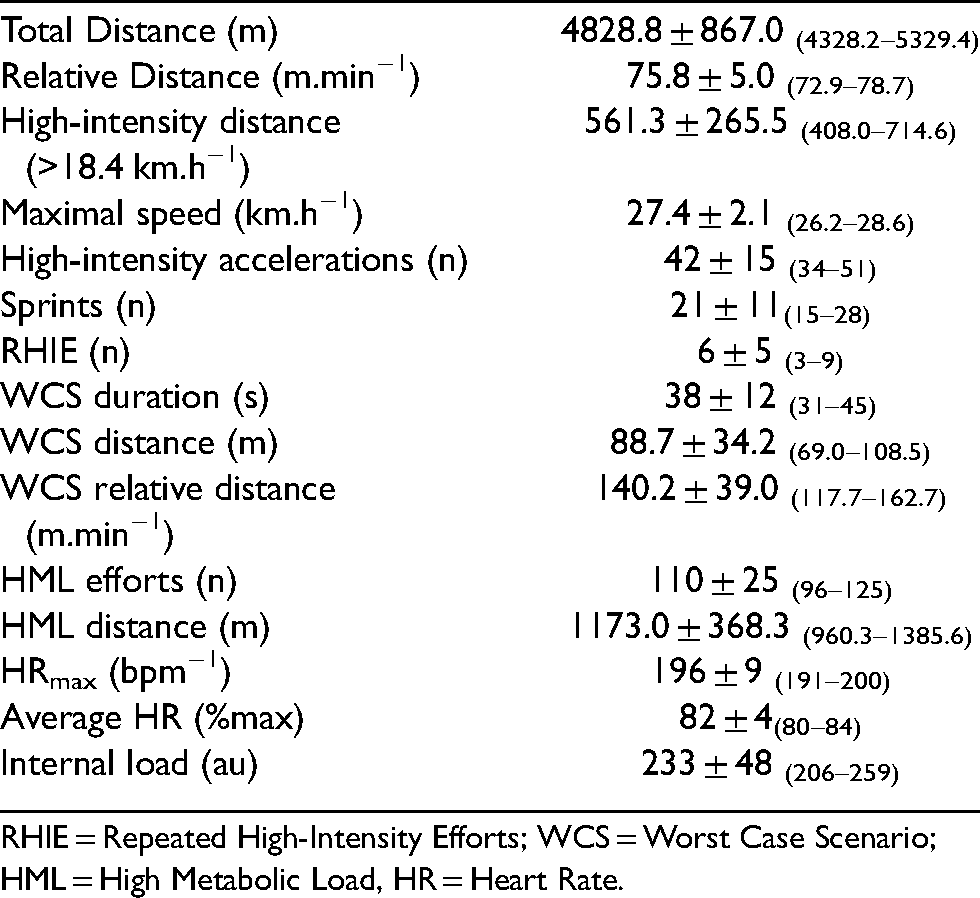
RHIE = Repeated High-Intensity Efforts; WCS = Worst Case Scenario; HML = High Metabolic Load, HR = Heart Rate.
Correlation coefficients (CI95%) between YYIR1 (n = 16) and bronco (n = 11) test results and physical and physiological demands during actual match play.
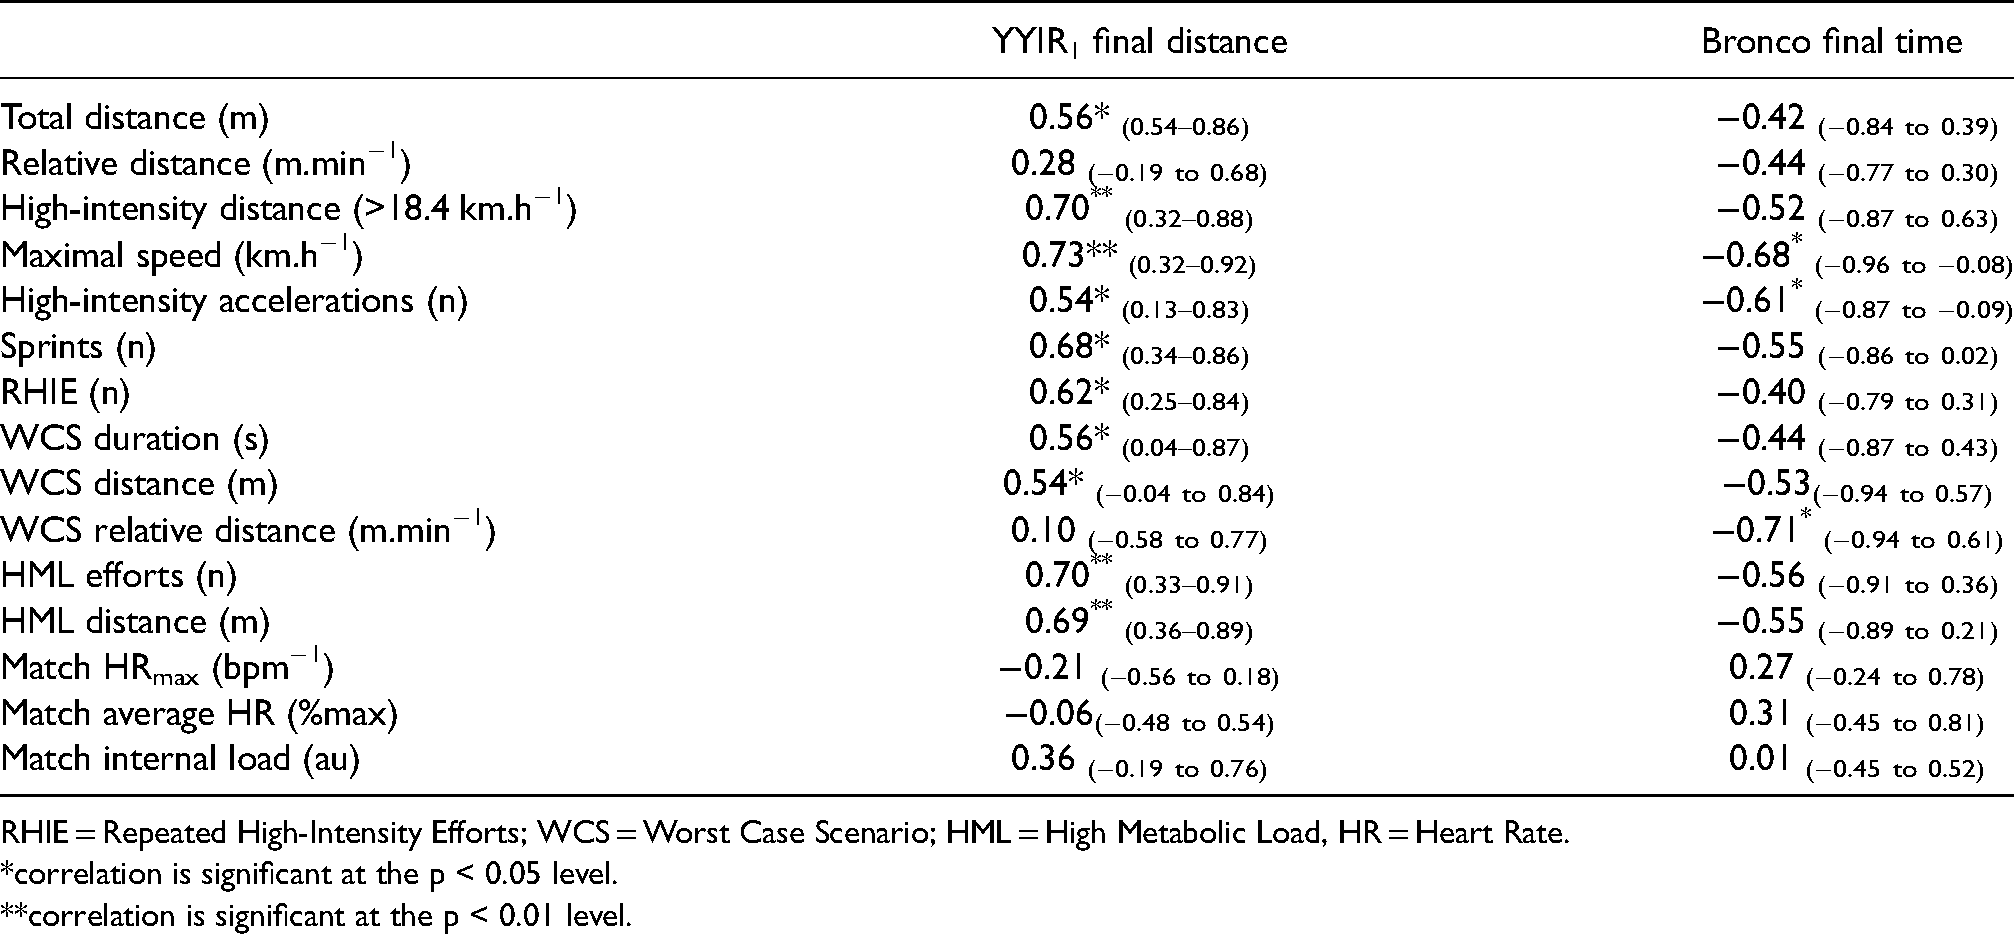
RHIE = Repeated High-Intensity Efforts; WCS = Worst Case Scenario; HML = High Metabolic Load, HR = Heart Rate. *correlation is significant at the p < 0.05 level. **correlation is significant at the p < 0.01 level.
Correlation coefficients (CI95%) between YYIR1 and Bronco test results and physical and physiological demands during actual match play (n = 11).
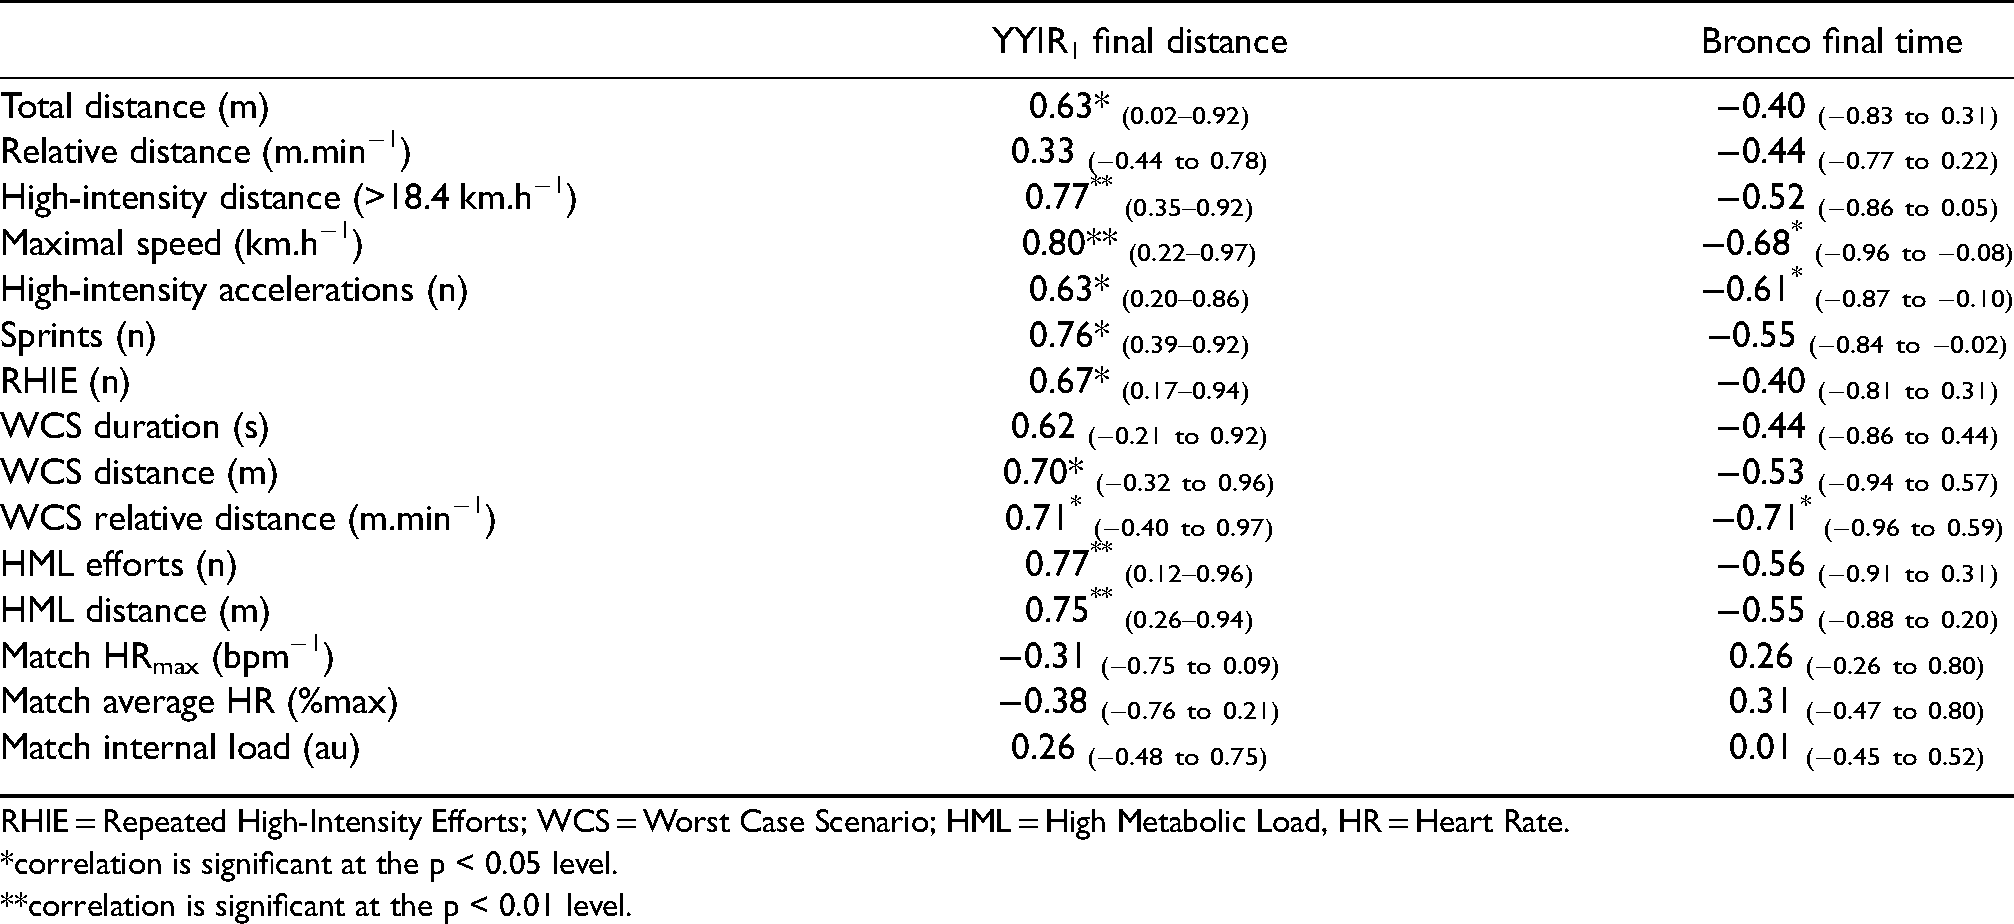
RHIE = Repeated High-Intensity Efforts; WCS = Worst Case Scenario; HML = High Metabolic Load, HR = Heart Rate. *correlation is significant at the p < 0.05 level. **correlation is significant at the p < 0.01 level.
Relationships between field test physiological demands and match demands
There was a significant negative correlation between YYIR1 test HRmax and relative distance covered in match play (p = 0.038), and significant positive correlations between YYIR1 test HRmax and HRmax (p = 0.004), average HR (p = 0.046), and internal load (p = 0.043) during match play. The average HR in the YYIR1 test was significantly and positively correlated with the number of high-intensity accelerations per match (p = 0.013), and significantly and negatively correlated with the relative distance covered during the WCS (p = 0.010). Significant positive correlations were found between the YYIR1 test internal load and high-intensity distance (p = 0.023), maximal speed (p = 0.022), number of high-intensity accelerations (p = 0.008) and sprints (p = 0.018), RHIE (p = 0.004), total (p = 0.016) and relative (p = 0.042) distance covered during the WCS, and number of HML efforts (p = 0.011) and distance (p = 0.014) during match play. Finally, there were significant positive correlations between the Bronco test HRmax and HRmax (p = 0.001) and average HR (p = 0.010) during match play, and there was a significant positive correlation between average HR during the Bronco test and average HR during match play (p = 0.025) (Table 6).
Correlation coefficients (CI95%) between physiological response data during the YYIR1 (n = 16) and Bronco (n = 11) tests and physical and physiological demands during actual match play.
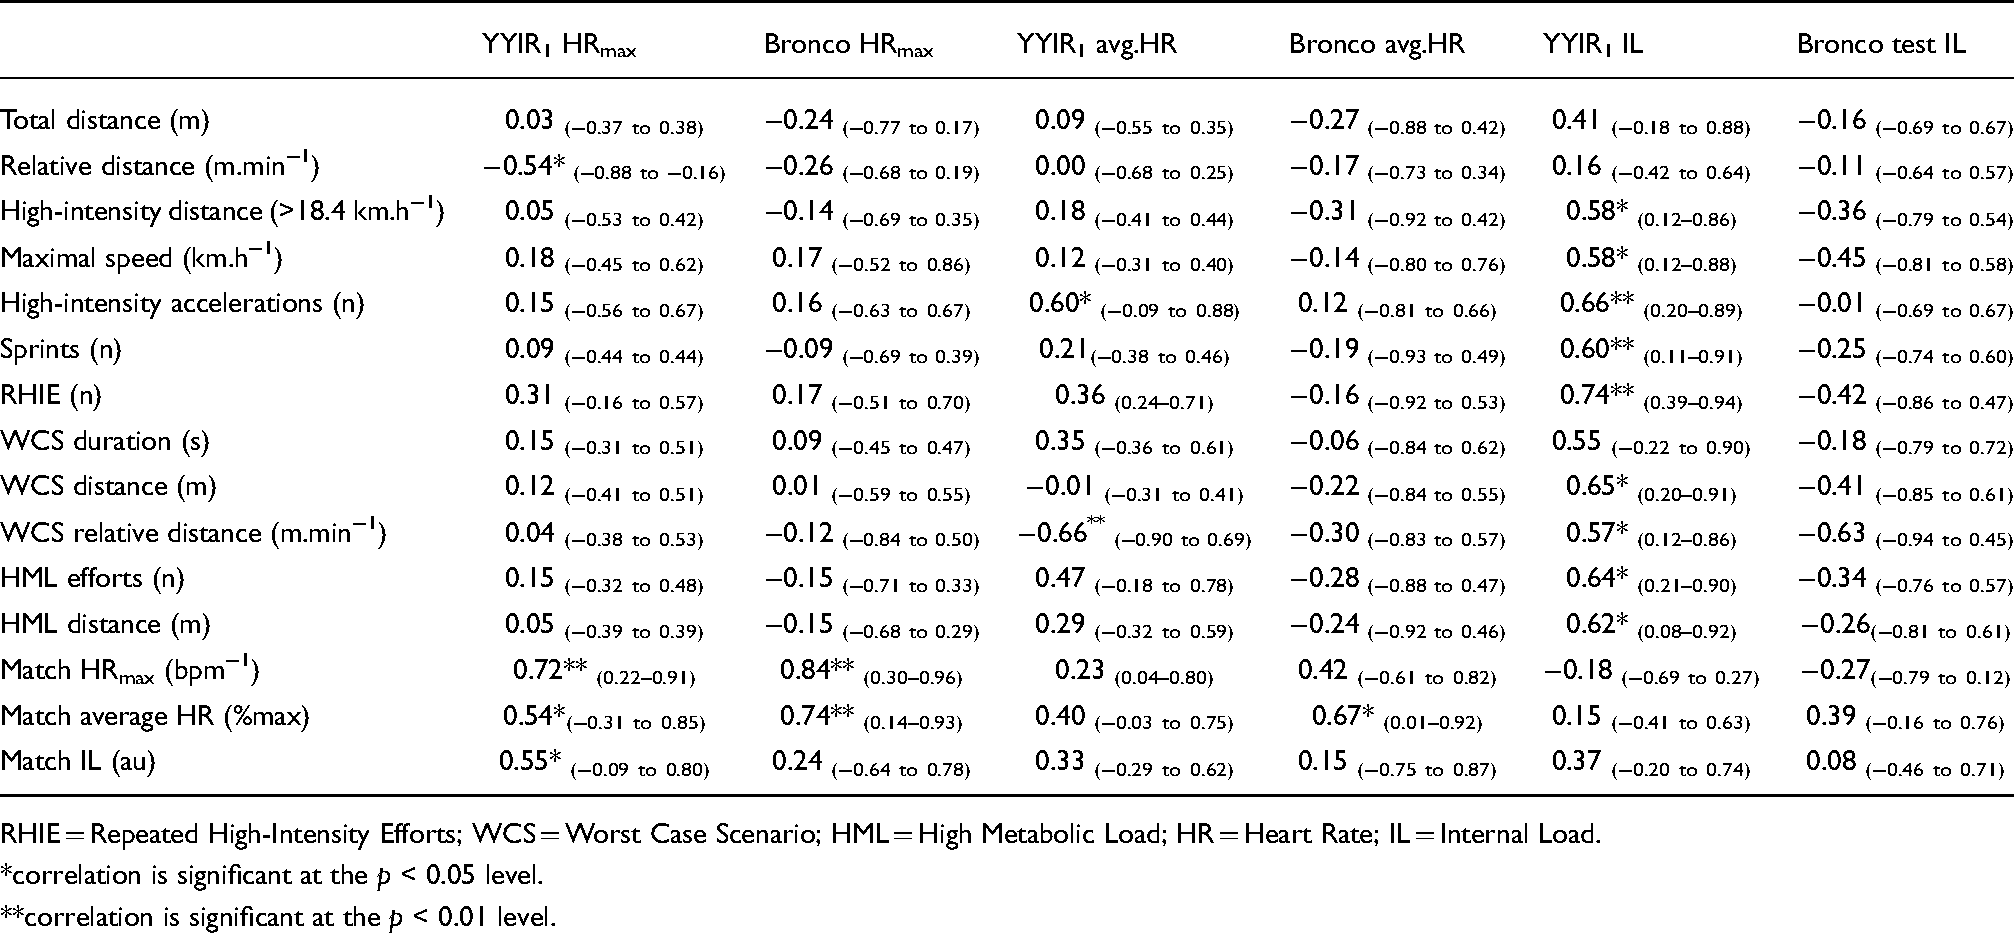
RHIE = Repeated High-Intensity Efforts; WCS = Worst Case Scenario; HML = High Metabolic Load; HR = Heart Rate; IL = Internal Load. *correlation is significant at the p < 0.05 level. **correlation is significant at the p < 0.01 level.
Field-test results regression analysis
A linear regression model was applied between the YYIR1 test final distance and the time taken to complete the Bronco test, which was statistically significant (R2 = 0.78, F(1, 30) = 104.46, p < 0.001), and had an explanatory power of 76.9% for YYIR1 test distance. Hence, the following equation estimates the distance covered in the YYIR1 test while taking into consideration the time taken in seconds to complete the Bronco test: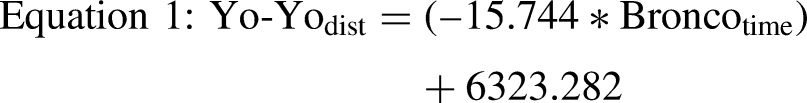
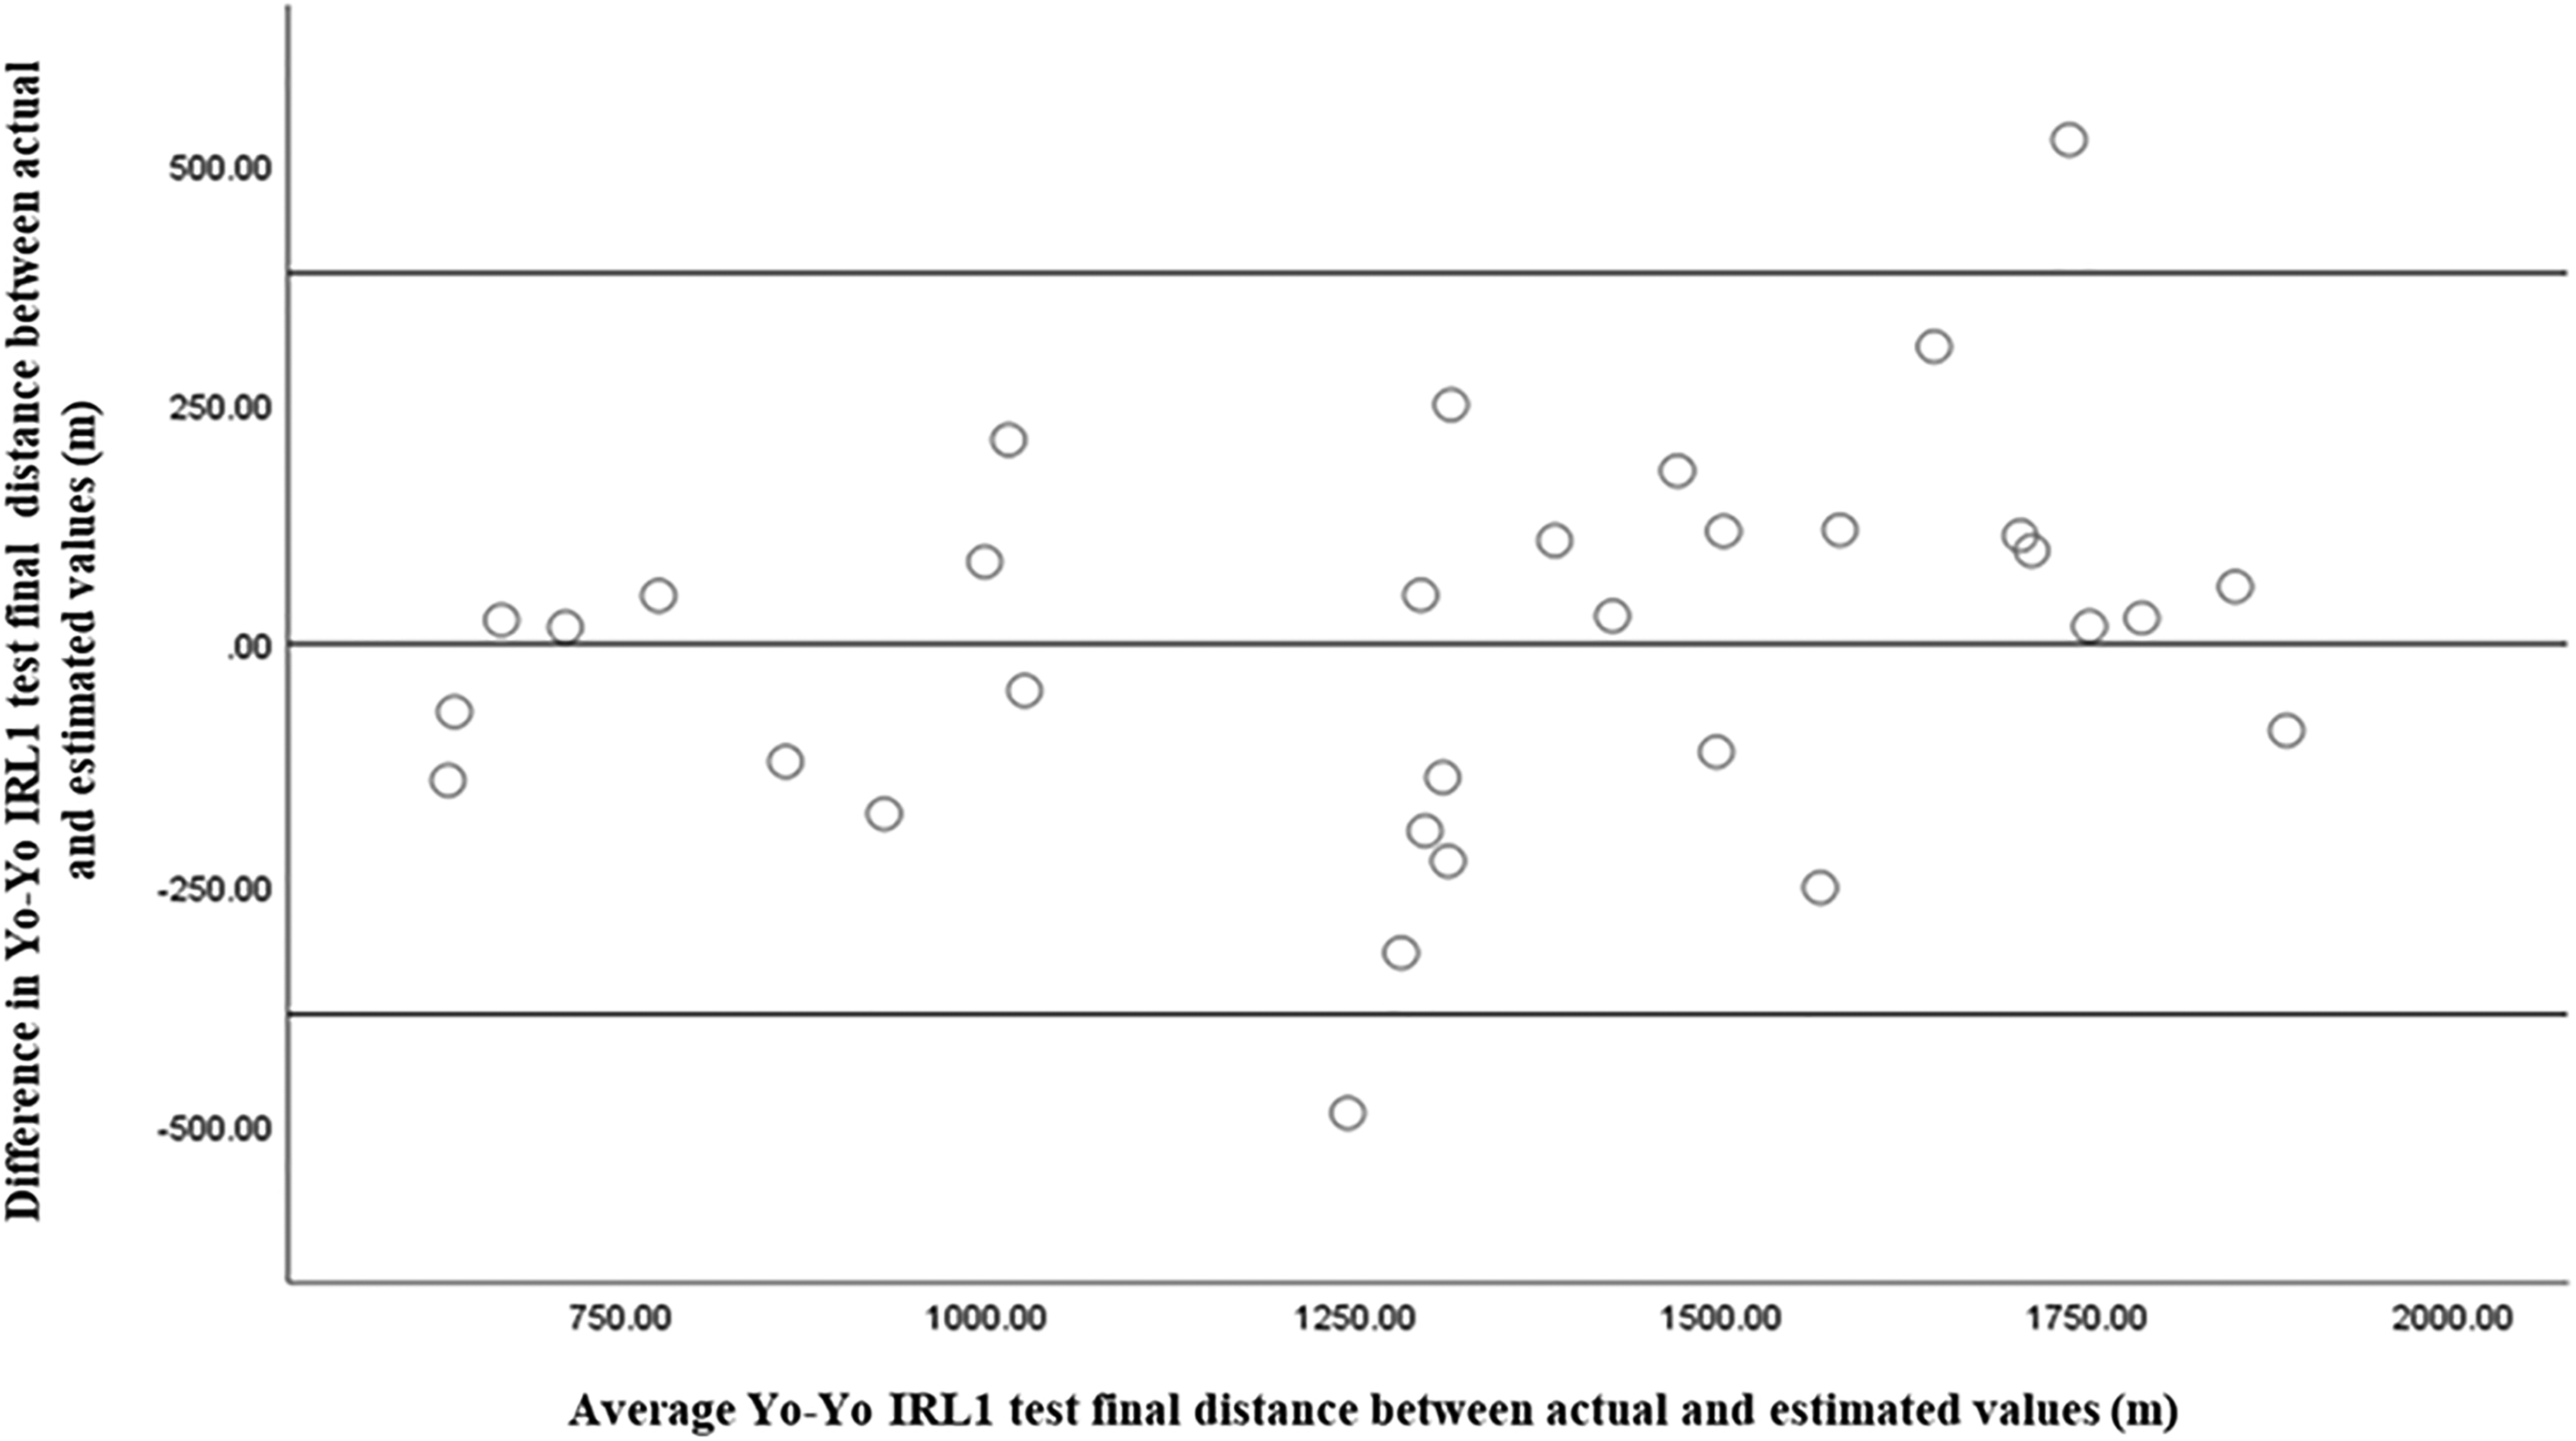
Bland-Altmann plot analysis of differences and means for YYIR1 final distance between actual values and estimated values from equation 1. The centre line is the mean difference, while the lines below and above the centre are the respective 95% of limits of agreement (1.96 × SD of Differences): −386.74 to 386.52-m.
Discussion
This study aimed to compare the YYIR1 and Bronco tests in amateur rugby referees and verify the direct validity of these tests in relation to the physical and physiological demands placed on referees during actual match play. The results revealed a large significant correlation between the YYIR1 and Bronco test results. Furthermore, significant medium correlations were found between the YYIR1 test result and physical and physiological demands during actual match play, including total and high-intensity distance covered, maximal speed, number of high-intensity accelerations and sprints, number of RHIEs, WCS duration, distance covered during the WCS, number of HML efforts, and match HML distance. Finally, the time taken to complete the Bronco test was significant medium correlated with physical match demands including maximal speed, number of high-intensity accelerations, and relative distance covered within the WCS.
The large significant correlation found in this study between the distance covered in the YYIR1 test and time taken to complete the Bronco test is similar to the results found for elite youth rugby players. 15 Although the nature of the two field tests differ (e.g. continuous self-paced Bronco test and an intermittent externally-paced YYIR1, 15 ) the average HR reported by rugby referees during both tests was around 90% of their maximum. 34 Additionally, the strength of the correlation between the YYIR1 and Bronco test results might indicate that the tests measure similar characteristics (e.g. ability to perform intermittent high-intensity exercise) and are therefore potentially interchangeable. However, the greatest percentage of time (∼36%) was spent in the 91–95% HRmax zone during the Bronco test, whereas the largest percentage of time (∼35%) was spent in the > 96% HRmax zone during the YYIR1 test This might be explained by the differences in pacing between the tests, with the externally-paced nature of the YYIR1 test allowing referees to perform at a greater percentage of their maximum HR. Moreover, compared with the Bronco test, the maximum HR reached during the YYIR1 test was significantly higher. Thus, in comparison with the Bronco test, the YYIR1 test might better determine the maximal HR of rugby referees, 9 , 34 information that is critical for training prescription.
A field test cannot be considered sufficiently sport-specific until a direct association has been observed between the field test result and the most relevant aspects of match performance. 20 Taking that into consideration, the YYIR1 test result and internal load was significantly correlated with referees’ physical match demands. Furthermore, the YYIR1 test maximum HR was significantly correlated with referees’ physiological match demands, supporting the direct validity of the test Collectively, the significant correlations found between the YYIR1 test result and the high-intensity demands (i.e. high-intensity distance covered, maximal speed, high-intensity accelerations, sprints, RHIE, WCS duration, WCS distance, HML efforts, HML distance) placed on referees in a match, implies that the test is a good tool to evaluate if the referee is fit enough to cope with match demands, since it is the amount of high-intensity exercise that best predicts the development of fatigue. 43 Additionally, the significant correlation found between the YYIR1 test results and number of sprints and RHIEs performed per match is an interesting finding, suggesting that the physical and physiological attributes required to perform the YYIR1 test are similar to those required to maintain RHIEs and sprinting during a match. Further, the number of HML efforts performed by the referees was significantly correlated with YYIR1 test result, which is in agreement with a study performed with elite soccer referees, 43 suggesting that the YYIR1 test might provide a valid measure of physical performance in intermittent activities. Finally, the significant correlation found between the YYIR1 test results and the WCS, might suggest that the better the rugby referee performed in the YYIR1 test, the better they coped with the most demanding period in a match. Since, the YYIR1 test elicits maximal aerobic responses and is focused on evaluating the ability to perform and recover from high-intensity exercise, which are essential components during the most intense periods in a match,11,12 it seems logical to be performed by referees, because if a rugby referee can recover more quickly from maximal or near-maximal efforts, the referee would be most likely to complete more of these efforts during a match. 44 However, the constant changes of direction in a set distance (i.e. 20-m) does not accurately replicate the movements during rugby officiating and should be considered as a limitation of using the YYIR1 test with rugby referees. Thus, alternative tests might be needed that incorporate more valid movement patterns while evaluating the ability to perform high-intensity exercise.
The Bronco test appears to have ecological validity for rugby referees as it includes shuttles across a variety of distances rather than a single fixed distance, as well as periods of acceleration, deceleration, and changes in direction, thus partially replicating the demands placed on rugby referees during actual match play. Indeed, the referee's maximal speed and number of high-intensity accelerations per match were significantly medium correlated with the Bronco test result. Additionally, maximum and average HR during the Bronco test and actual match play were significantly large correlated, which could provide an indicator of match fitness. However, the self-paced continuous nature of the Bronco test, unlike the intermittent nature of rugby refereeing, and the lack of correlations found between the Bronco test result and high-intensity match demands (e.g. high-intensity distance, number of sprints, and RHIEs), suggests that the Bronco test may not replicate the true metabolic demands placed on rugby referees during matches, which raises questions about the direct validity of the test, since the quantity of high-intensity exercise is a better indicator of match demands. 43 Based on that, it was not possible to establish the direct validity of the Bronco test for rugby referees in this study.
When analysing the results obtained by the Bland-Altman's graphical analysis, the findings demonstrate the possibility to use Equation 1 to estimate the YYIR1 test final distance. From a practical viewpoint, Equation 1 provides an estimation of which YYIR1 test final distance a referee would achieve considering the time taken to complete the Bronco test Although Equations 1 have excellent reliability, 41 it should be acknowledged that the outcome (i.e. YYIR1 test final distance) can have a variance of ∼15% compared to the true value. Also, the results generated by the Equation 1 may be considered a contrived variable when compared to the results generated when using the YYIR1 test directly. Thus, Equation 1 should only be used as an estimation of YYIR1 test performance and should not replace the actual test result.
This study uniquely adds to the literature regarding the fitness testing of rugby referees. However, some limitations should be noted. First, the correlation analyses were performed with a relatively small sample size, and so, similar studies with a larger sample size and from different levels (e.g. amateur, and elite referees) should be conducted in order to replicate the results of this study and to generate even more accurate estimating equation. Second, this study was conducted with southern hemisphere amateur rugby referees during a range of competitive 15-a-side matches of differing durations (i.e. 50 to 80 min), potentially limiting the generalizability of the findings, since no elite matches or referees were included in the sample. Finally, only observational data was collected during this study, and no laboratory-based tests were performed (e.g. VO2max), thus preventing a more detailed analysis against a “gold standard” and ventilatory threshold zones. 12 Future research is therefore encouraged to include laboratory-based tests (e.g. VO2max) and more physiological variables (e.g. blood lactate) to further investigate the relationships between field test results and actual match demands.
In conclusion, this study has shown that the YYIR1 and Bronco tests are strongly correlated, therefore both tests might be useful in prescribing individualised fitness training for rugby referees. Additionally, this study has shown that the results of the YYIR1 test are significantly correlated with the physical and physiological demands placed on rugby referees during actual match play and may therefore be considered a valuable tool for assessing the fitness of rugby referees. Moreover, given the relevance of high-intensity running for a rugby referee's physical match performance, 43 this study offers empirical support for the direct validity 20 of the YYIR1 test for the physical assessment of rugby referees. However, the direct validity of the Bronco test could not be confirmed by the findings of this study. Overall, the results imply that while the field tests assessed in this study could be useful in providing information on rugby referees’ fitness, they should never be used to predict the referee's overall on-field performance because of the multitude of factors (e.g. positioning, psychological stress) impacting referee decision-making. 45
Practical applications
The findings of this study highlight the importance of selecting tests that accurately reflect sport-specific requirements. In this regard, the findings indicate that the YYIR1 test better correlates with actual match demands than the Bronco test Thus, the use of the YYIR1 test in high-intensity training sessions is recommended. 43 Additionally, for the purpose of evaluating if a referee is fit enough to cope with the match demands, the YYIR1 test should be used over the Bronco test Moreover, this study showed that the YYIR1 and Bronco tests are strongly correlated. Thus, the Bronco test might be a reasonable alternative to use in referees’ training sessions under time-constraints, as it provides a less disruptive option for practitioners to incorporate into training, and to measure intermittent sport performance. 15 Finally, should a practitioner or referee want to estimate the equivalent YYIR1 test result from the Bronco test, then the regression Equation 1 outlined in this study could be used as a guide to such comparison. However, since the Bronco test requires 60-m length on a field and is designed for outdoor use, caution must be advised when comparing seasonal changes or using the test to monitor fitness changes when environmental test conditions are not comparable.
Footnotes
Acknowledgements
The authors would like to thank the referees who took part. Further, we would like to thank the Western Province Referees Society, SARefs Academy, and Linston Manuels for allowing access to the referees. Also, the authors would like to thank STATSports for providing the GNSS units. Finally, the authors would like to thank Stephanie Kruger, Tayla Van Heerden, Hannah Bevis, Joshua Schenck, and Cameron Donkin for their help during the data collection. The authors report no conflicts of interest This study was partially supported by a Santander Mobility Award given to the lead author.
Declaration of conflicting interests
The author(s) declared no potential conflicts of interest with respect to the research, authorship, and/or publication of this article.
Funding
The author(s) received no financial support for the research, authorship, and/or publication of this article.