
Abstract
Purpose
Force-velocity-power (F-v-P) profiling can illustrate an individual’s sprinting capabilities, but no study has explored the effect of different running surfaces on F-v-P outcomes.
Method
Twelve elite youth football players (age 16.3 ± 0.5 years, mass 67.3 ± 5.4 kg, height 176.2 ± 4.6 cm) performed two 30 m sprints on concrete and artificial turf in a randomised order on two testing days. Differences between surfaces were determined using repeated-measures ANOVA (P < 0.05), whilst the coefficient of variation (CV), smallest worthwhile change and standard error of measurement were calculated to quantify reliability.
Results
No significant differences were found between surfaces over the average of two days. High reliability was evident for 30 m sprint time, theoretical maximum horizontal velocity and ratio of force on both surfaces (CV≤∼5%), while the remaining outputs were not reliable (CV >10%).
Conclusion
These findings show that F-v-P profiling does not differ between concrete and artificial turf. However, higher variability on the more unfamiliar concrete surface suggests that the testing surface should match the playing surface. Since the standard error of measurement is larger than the smallest worthwhile change, the ability of this method to monitor seasonal changes may be limited in youth elite soccer players.
Introduction
Sprinting is a common action in football, with sprints under 5 seconds in duration constituting over 90% of sprints recorded in-game, irrespective of position. 1 Straight sprinting is also the most common actions displayed by both the goal-scorer and assisting player immediately prior to scoring. 2 Optimising sprinting capabilities over short distances is therefore crucial to maximise match performance.
Sprinting performance is highly dependent on the mechanical power output resulting from muscle and tendon actions; 3 consequently, assessing the capability to produce mechanical power may be of interest to practitioners seeking to improve sprinting performance. Force and velocity are considered to be the underlying factors behind mechanical power output. 3 By utilising calculations derived from the inverse linear force-velocity and parabolic power-velocity relationships, 4 it is possible to determine an individual’s force-velocity-power (F-v-P) profile. Outputs extracted from the F-v-P profile include the athlete’s theoretical maximum horizontal force (HZT-F0) and velocity (HZT-V0) at a macroscopic (whole body) level. The maximum mechanical power output in the horizontal direction (HZT-Pmax), the ratio of force (RF), and the decline in the ratio of force production (DRF) can also be computed. These outputs are often used to provide more detailed insight in an individual’s sprinting capabilities. Morin and Samozino 5 for example found that the relationship between sprinting performance and HZT-F0 production becomes greater as distance decreases. Conversely, RF and DRF are key in distinguishing between sprinters of different abilities over longer distances. 6 Depending on the target distance, personalised training programs can therefore be designed to target different aspects of the F-v-P profile, according to the individual athlete’s needs.
Mechanical power output is heavily reliant on effective force transfer to the ground as dictated by leg stiffness. 5 Compliant surfaces deform during the ground contact of sprinting, thereby allowing energy to be transferred from the athlete to the ground, with part of this energy being returned back to the athlete during the subsequent propulsive phase. 7 The amount of energy stored by the surface increases with compliance, 8 while the amount of energy returned depends on the spring stiffness/viscosity of the surface. 9 The spring stiffness is typically assessed by determining the energy restitution and has been reported to be >90% in concrete and 39-44% in artificial turf.10,11 This higher energy restitution of concrete may contribute to a better forward propulsion and hence better sprint performance. However, variations in surface stiffness can also influence leg stiffness, with increases in surface stiffness for example typically being accompanied by decreases in leg stiffness as achieved by having higher joint flexion angles at initial contact and larger joint ranges of motion during stance.12,13 These alterations in joint angles can in turn lead to mechanical (dis)advantages at the muscle-tendon level, hereby influencing force production and hence performance. A larger knee or ankle joint range of motion (and hence faster change in joint angles) may for example increase muscle fiber shortening velocity, leading to lower muscle force production.14–16 Collectively, the greater energy restitution, but simultaneous potential detrimental alterations in leg stiffness may impact sprint performance and therefore the F-v-P profile. Despite these differences, running surface has not been factored into F-v-P profiling studies to date. Specifically, Simperingham, Cronin 17 and Runacres, Bezodis 18 both performed reliability studies and found high reliability (ICC ≥0.75, CV ≤10%) for the majority of outputs in both youth and adult populations. However, in one study amateur rugby players familiar with playing on grass were tested on an indoor running track, whilst the second study assessed athletes from a range of sports and allowed them to run on the surface of their choice. As no study has compared the impact of testing the same athletes over different surfaces, the importance of running surface when implementing F-v-P monitoring remains undetermined.
Since it is unknown if and how variations in surface stiffness affect F-v-P profiling outputs, the aim of this study was to investigate the effects of running surface on sprint performance and F-v-P profiling outcomes. To this purpose, two surfaces were tested; 1) an artificial turf (AT) surface commonly used by the participants for training, and 2) a substantially less compliant surface (concrete). Based on the higher energy restitution found on concrete, we hypothesised that sprinting on concrete would lead to faster sprint performances and higher F-v-P outputs. We also hypothesised that the AT surface would generate higher reliability due to the familiarity of the playing surface to the players.
Methods
Participants
Nineteen elite, male football players (mean ± SD age 16.3 ± 0.5 years, mass 67.3 ± 5.4 kg, height 176.2 ± 4.6 cm) were recruited from a German U-17 youth academy. Only players with no recent history of musculoskeletal injuries over the last 6 months and who were otherwise fit and healthy were included in the study. All participants had a minimum of 5 years of experience with football-specific conditioning and were familiar with sprint testing. At the time of the study, all participants had 4-5 training sessions and one match per week. Each training session lasted around 2 hours and matches were approximately 80 minutes.
Ethical approval was obtained from the ethics committee of the Faculty of Humanities and Economic Science at Saarland University in accordance with the Declaration of Helsinki. All participants received informed consent from their legal guardians and were informed that they could halt their involvement in the study at any time with no consequences. Participants were instructed to not eat anything at least 90 minutes prior to testing, and avoid caffeine 3 hours before testing. Plain water was permitted throughout the experiments to prevent dehydration and any subsequent performance impairments. 19 Participants wore their own running shoes for the concrete surface and their own football shoes for the artificial turf (all participants wore rubber blades as opposed to metal studs). Participants were instructed to wear the same footwear for both testing days and for the full duration of testing.
Equipment
A radar gun (Stalker ATS II, Plano, Texas, USA) with a sampling rate of 47 Hz was used to record sprinting velocity. The radar gun was placed in accordance with the manufacturer’s guidelines and operated on the Car setting, as this was specified as the most appropriate setting for moving people. In line with previous research,, 20 the radar gun was placed 10 m behind the participant and 1 m above the ground, with the radar gun aligned with the estimated center of mass (assumed to be at the hips) of the sprinter. Radar capture commenced once participants were in the starting stance (split stance with one foot directly behind the start line). The radar gun was connected to a laptop running the Stalker ATS II data collection software (Version 5.0.2.1, Applied Concepts, Inc., Texas, USA). The horizontal velocity data from the radar gun was instantaneously uploaded and checked, allowing any compromised trials to be repeated such as those derived from equipment failure or measurement error. No trials required repeating on either day of testing.
Surface stiffness testing
Two surfaces were utilised for this experiment: a concrete level walking path, and a third generation (3 G) artificial pitch used by the team for training. Surface stiffness was quantitatively analysed through the use of a rebound test (ASTM F2117-10 - American Society for Testing Materials) utilised by earlier studies.21,22 For this test, a standard sized basketball (size #7, pressure 0.06 Mpa) was dropped from a height of 2 m and rebound height measured using video analysis. Five trials were performed per surface (on the same location) and the average rebound height was calculated. The concrete surface resulted in statistically higher (p < 0.05) rebound heights (130.2 ± 1.2 cm) than the artificial turf (94.8 ± 3.4 cm) and can therefore be considered to be stiffer.
Experimental protocol
The protocol for the sprint tests was based on similar studies17,18 to allow cross-study comparison. Participants ran four sprints per testing day, with two sprints allocated to each running surface. Although the intended distance for each sprint was 30 m, the start and finish markers were placed 35 m apart to ensure that participants did not slow down as they approached the 30 m distance, in line with previous recommendations. 18 After the warm-up (see below), a signal was given to the participant instructing them to stand still in the split stance. From this moment, radar gun data collection was started. After a short interval, the go signal was delivered at which point the participant was instructed to sprint as fast as possible to the end of the running lane. The participant was then permitted 5 minutes of rest before the next sprint so the effects of any fatigue could be diminished. After the participant concluded the trial and moved away from the testing site, the next participant was tested immediately after. The order of participants was retained for the entirety of testing.
The second session was performed seven days later. To ensure as little variability as possible between testing days, all sprints were carried out on the same day of the week with as little time difference as possible. The order of the surfaces tested on the first day were determined using randomizer.org, but due to logistical reasons, the two sprints performed on each surface were conducted consecutively before moving on to the other surface. The order was reversed on day two to nullify the effects of fatigue as well as any learning effects. Training load was kept consistent the week before each trial; moreover, heavy weight training and sprinting was avoided the day before each testing session. Wind direction, wind speed, air pressure, temperature and humidity were measured to detect variation between testing days (Online supplementary file II; available from https://doi.org/10.6084/m9.figshare.12645275.v1).
A standardised 15-minute warm-up consisting of dynamic stretches, movement preparation and sprinting drills was delivered before both testing days (Table 1). The warm-up protocol was adapted from Taylor, Sheppard, 23 who found that a dynamic warm-up was more effective than static stretching in improving performance in football players. The players were given a 5-minute break between the warm-up and the first sprint of the testing session. The warmup for each day took place on the first running surface of the day (concrete on Day 1, AT on Day 2).
Warm-up protocol.
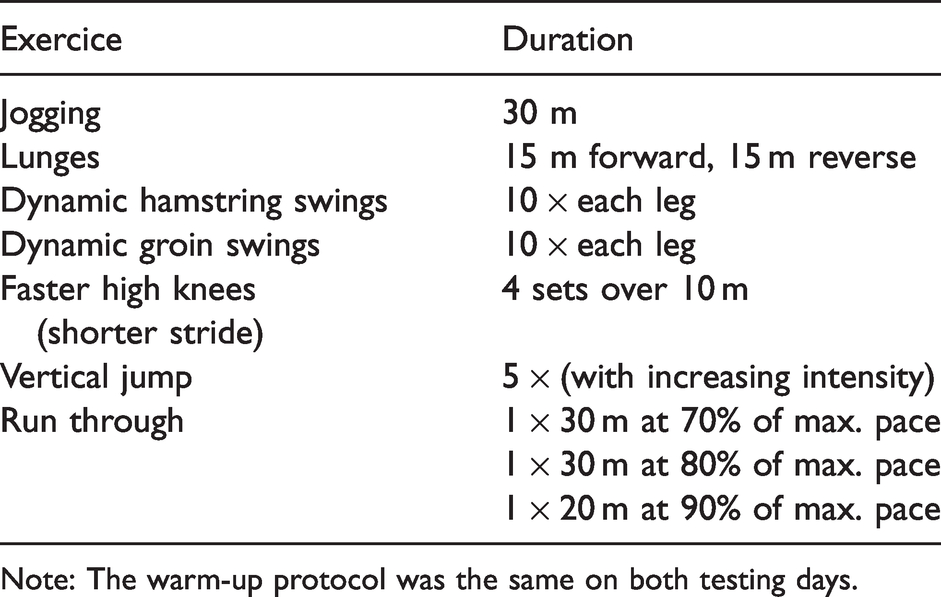
Note: The warm-up protocol was the same on both testing days.
Calculation of F-v-P outputs
F-v-P outcome variables were computed as described by Samozino, Rabita. 4 Briefly, the raw velocity-time data was fitted with a mono-exponential curve to transform the data into horizontal velocity-time, in accordance with earlier studies. 18 The raw data files for each trial were classified as acceleration runs within the ATS Stalker II software, which ensured that the velocity-time curves for each trial started through the zero point. In accordance with prior recommendations, 4 data recorded prior to the start of the trial and after the trial had concluded were discarded, whilst any unexpectedly high or low data points (defined as values > 2 standard deviations away from the mean velocity) that may have been caused by segmental movements of participants whilst sprinting were manually removed. All recorded data were processed by the same researcher to minimize observation bias and to ensure consistency in processing. After processing, the ATS Stalker II software yielded an overall sprint time for each trial. The software was then configured to provide 6 split times for each trial (measured at 5 m increments) as required in the method for calculating F-v-P outputs specified by Samozino, Rabita. 4 The split times were entered into a custom-made spreadsheet utilizing these calculations 24 alongside measurements of athlete height and body mass, temperature and air pressure. Using this information, the spreadsheet automatically calculated individual HZT-F0, HZT-V0, HZT-Pmax, RF and DRF using calculations from the single-run method as detailed previously. 4
Statistical analysis
Anonymized data was entered in the Statistical Package for the Social Sciences for Windows (SPSS, version 23.0, IBM, SPSS Inc., Chicago, IL, USA). Mean ± standard deviation was recorded for all radar-derived values.
The primary outcome for this study was the effect of changing running surface on F-v-P output variables (sprint time, HZT-F0, HZT-V0, HZT-Pmax, RF and DRF). To this purpose, a Shapiro-Wilk test was used to check whether data was normally distributed. Once confirmed, a repeated measures ANOVA with Bonferroni post-hoc contrasts was used to check for significant differences (p < 0.05) between the average values of the two sprints per surface. Assessment of intra-day and inter-day reliability were secondary outcomes. To test inter-day reliability, mean coefficient of variation (CV) and standard error of measurement (SEM) was calculated, forming an assessment of absolute reliability. For intra-day reliability data, the four sprints per testing day will be used. CV and SEM were calculated using a freely available online spreadsheet designed to test validity and reliability. 25 A CV of ≤5% was considered reflecting high reliability. We used this cut-off because seasonal changes in performance can be small, 26 implying that trial-to-trial variability should be low.
95% confidence intervals were determined for all reliability outcomes. The smallest worthwhile change (SWC) was calculated using the formula (0.2*between-subject standard deviation). The SWC was compared to the SEM to assess any meaningful changes in performance; an SWC higher than the SEM for a calculated output indicated that the change was more likely caused by real change as opposed to error. 27 We did not compute the inter-class correlation coefficient (ICC) to test relative reliability because our sample was relatively homogenous, which would therefore have resulted in low ICC values, irrespective of the levels of trial to trial variation. 28
Results
A total of 12 participants (age 16.1 ± 0.3 years, mass 66.9 ± 5.3 kg, height 177.1 ± 3.8 cm) completed both testing sessions and were therefore eligible for analysis of the primary outcome. Three players were able to complete day one of testing but not day two; an additional four players were tested on day two but not day one. These players were subsequently included in the intra-day analysis but not the inter-day analysis. No statistically significant differences (p < 0.05) were recorded between participants who were included in the analysis verses those who were excluded, both for anthropometrics and sprint time.
The effect of running surface on F-v-P outcomes
Descriptive outcomes for all output variables acquired from both days of testing are provided in Table 2 and sprint times for both surfaces are shown in Figure 1. Further, anonymized sprint and F-v-P data for each individual is provided in Online Supplementary File I, available from https://doi.org/10.6084/m9.figshare.12545633.v1. No significant differences for any outputs were seen when comparing all sprint trials on concrete to artificial turf over two days of testing. However, significant differences were seen between concrete and artificial turf for 30 m sprint time, HZT-F0, HZT-Pmax and RF during the first day of testing.
Mean ± SD F-v-P outputs for the concrete and artificial turf surfaces per test session.
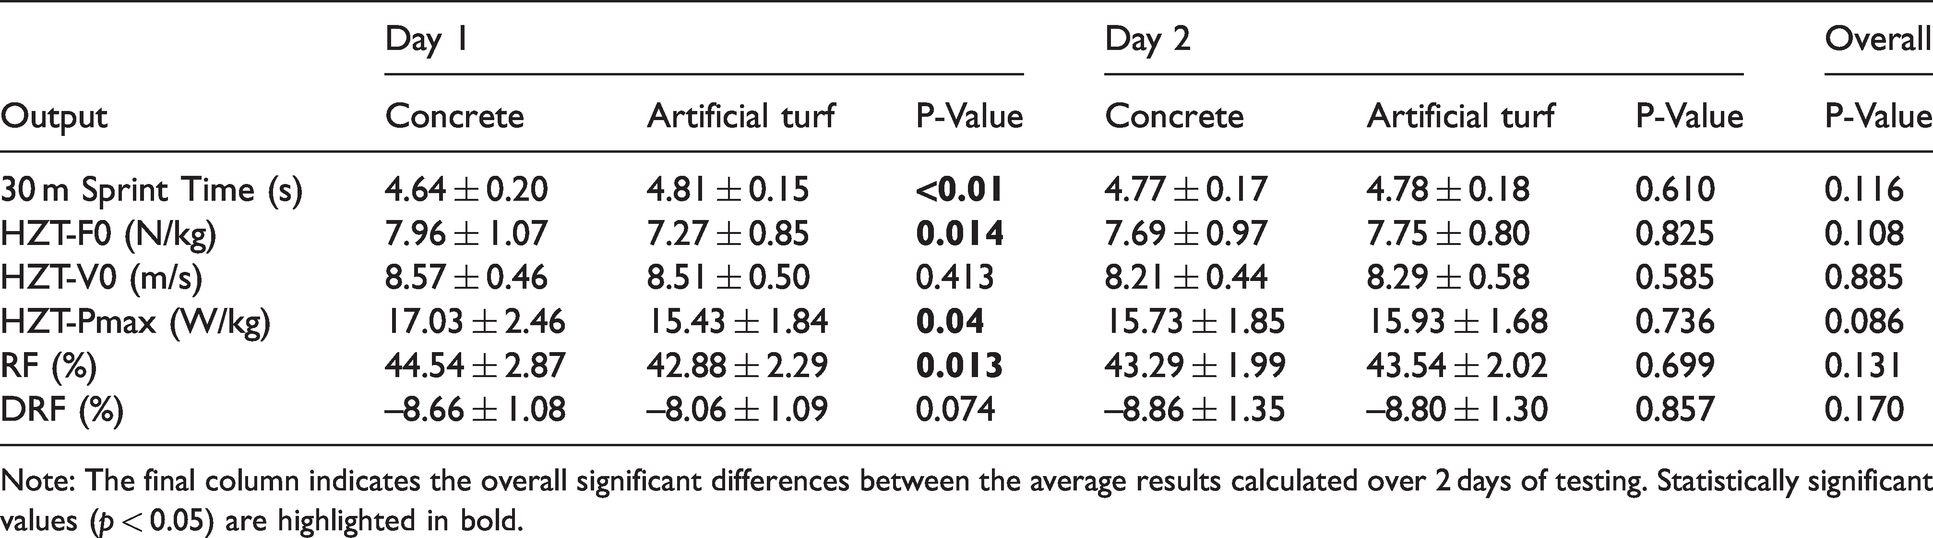
Note: The final column indicates the overall significant differences between the average results calculated over 2 days of testing. Statistically significant values (p < 0.05) are highlighted in bold.
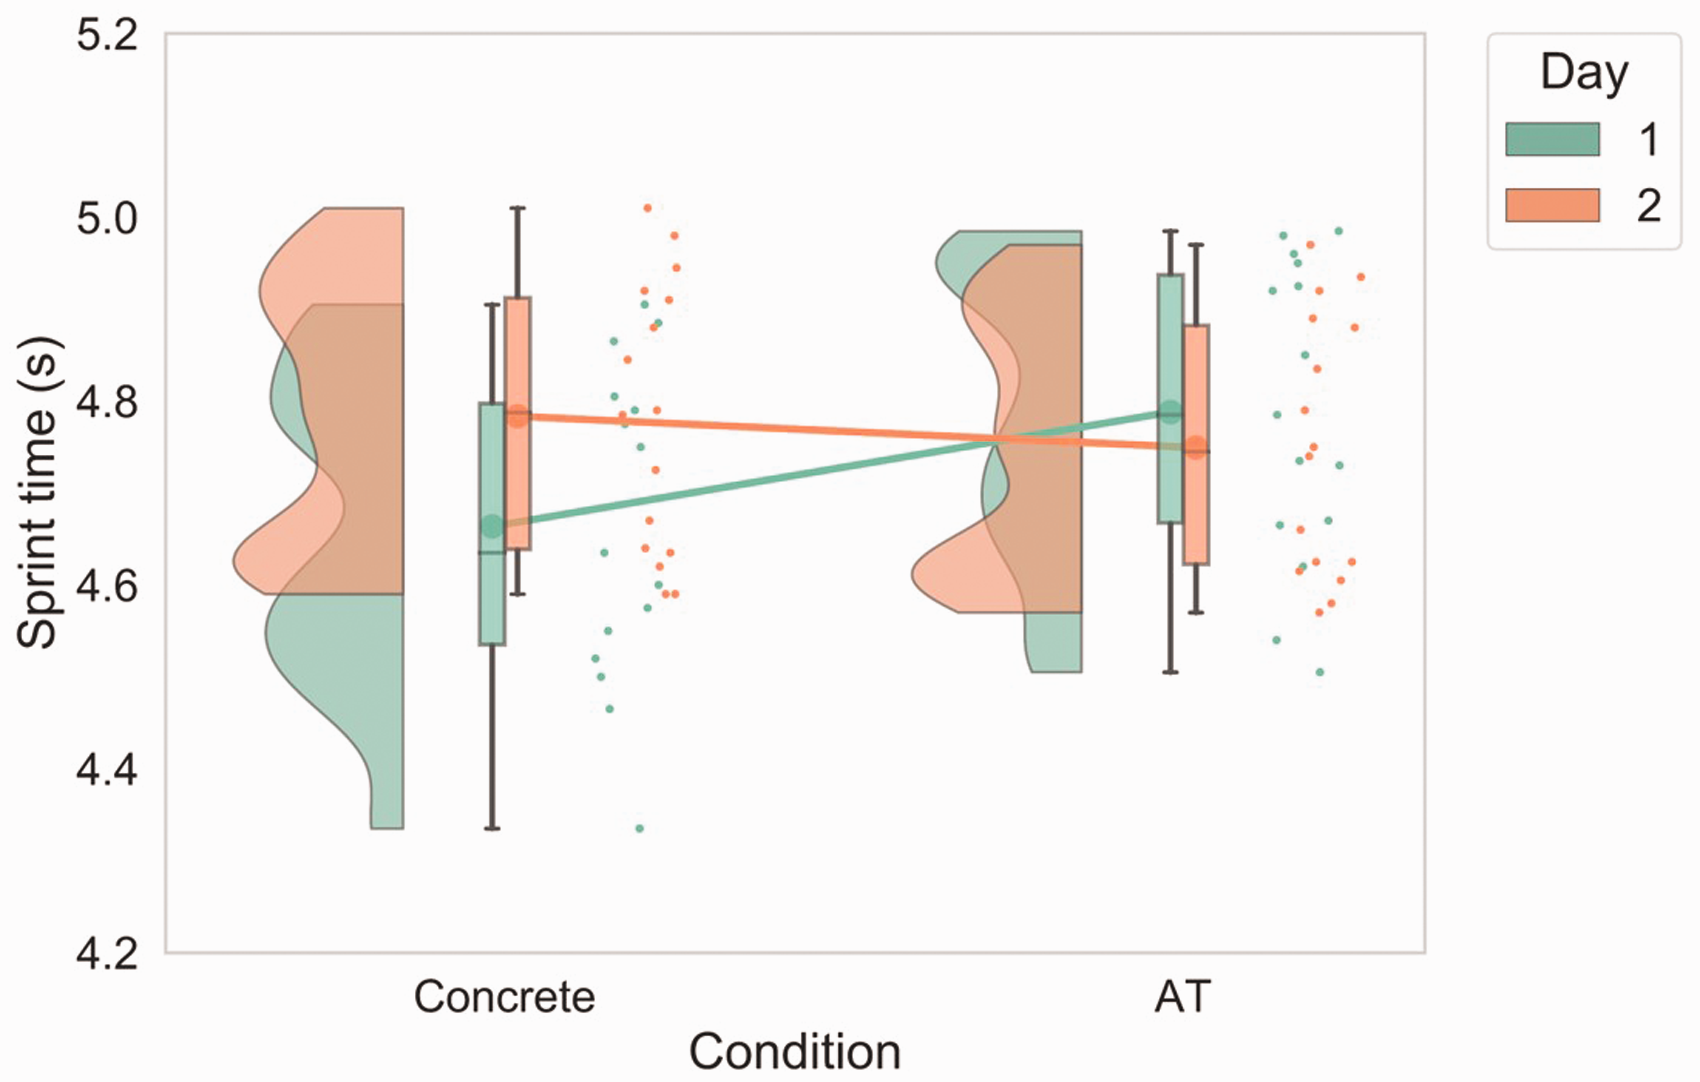
Average sprint times recorded over each surface. Individual dots represent the mean sprint time recorded over 2 trials per testing day. The median is indicated by the horizontal line through the central box of the boxplot, with the edge of the boxes reporting the interquartile range. The whiskers indicate the fast/slowest sprint times. The cloud on the left side of the plot indicates the distribution of sprint times. AT = artificial turf.
Intra-day reliability
Intra-day reliability was determined for all four sprints conducted for both surfaces on each day of testing (Table 3). An overall assessment of reliability for each output was also determined. CV was low (≤5%) for sprint time, HZT-V0 and RF. All remaining values were >10% aside from HZT-F0 day 2. The SEM was higher than the SWC for all outputs.
Intra-day reliability for each day of testing.
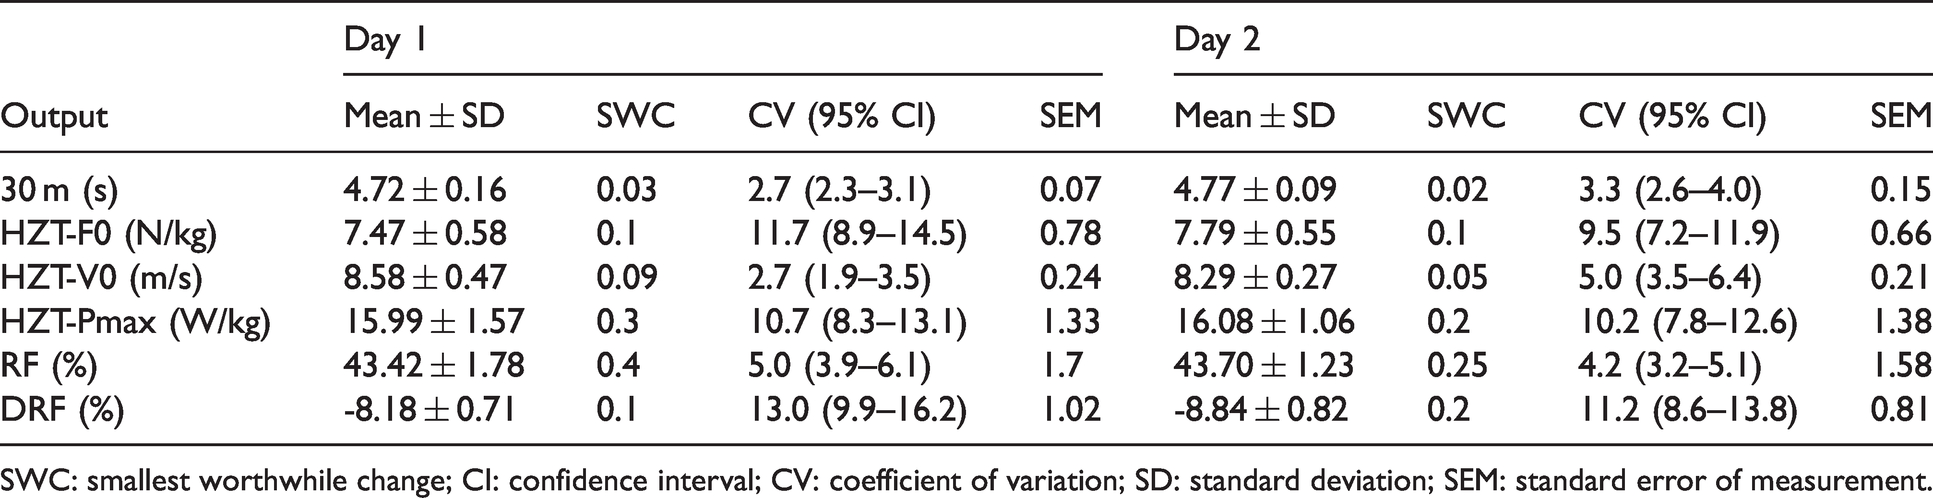
SWC: smallest worthwhile change; CI: confidence interval; CV: coefficient of variation; SD: standard deviation; SEM: standard error of measurement.
Inter-day reliability
Reliability outcomes calculated for all sprints carried out on both surfaces for each day of testing are provided in Table 4. The CV was low (<5%) for sprint time, concrete HZT-V0, artificial RF and overall RF. Artificial HZT-V0, overall HZT-V0 and concrete RF were narrowly above the threshold (<6%). The remaining values demonstrated higher variation (often >10%). The inter-day SEM was again higher than the SWC for all values.
Inter-day reliability for all sprints conducted on each running surface.
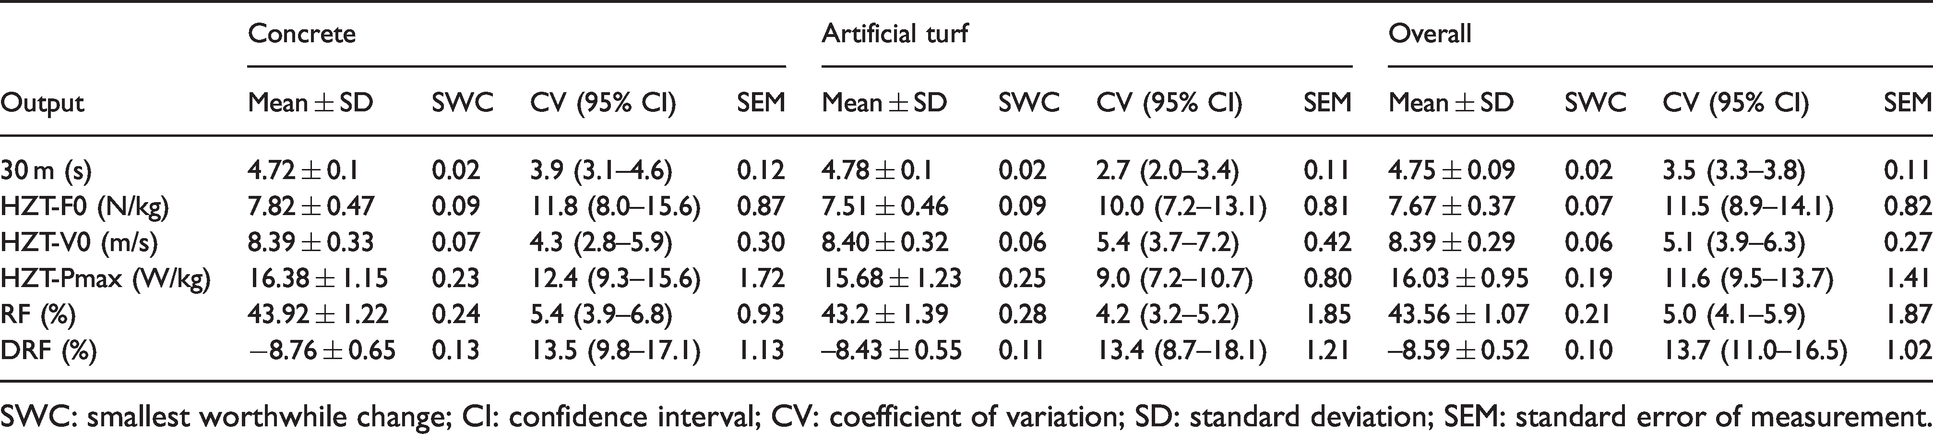
SWC: smallest worthwhile change; CI: confidence interval; CV: coefficient of variation; SD: standard deviation; SEM: standard error of measurement.
Discussion
The goal of this study was to investigate surface effects on F-v-P outputs during sprinting and whether this carries any implications for using the technique in practice. Based on the existing literature, we hypothesised that changing running surface from concrete to artificial turf would lead to a significant decrease in sprint performance and all F-v-P outputs. In contrast to this hypothesis, our results show that there was no significant difference between the surfaces for sprint performance or any F-v-P outputs calculated over two days of testing. It is likely that the differences in surface stiffness between concrete and the artificial turf were not large enough to cause overall significant changes in performance.
A study by Stafilidis and Arampatzis 14 for example tested sprinting performance over tracks of different surface stiffnesses and found no differences in sprint performance among tracks with a surface stiffness ranging from 550-5500 kN·m−1. Similarly, a mathematical model indicates that whilst performance can vary depending on surface stiffness, significant performance impairments require a surface to be very compliant to substantially affect performance (i.e. a surface 0.15 times the vertical less stiffness of the athlete will lead to a reduction in performance of 30% compared to a hard surface 9 ) This model goes on to predict that running on a surface roughly equal to 3 times the athlete’s stiffness will maximise sprinting performance due to decreases in ground contact time and increases in step length. The vertical stiffness (calculated as the quotient of maximum ground reaction force and leg compression, with leg compression computed from the change of distance between the trochanter major and the point of force application) of athletes as calculated by Stafilidis and Arampatzis 14 was roughly 100 kN·m−1, meaning that a surface of 300 kN·m−1 would be expected to deliver peak performance. Although we did not measure surface stiffness, McMahon and Greene 9 estimated the stiffness of concrete to be 4376 kN·m−1. Their calculations also suggested that surfaces beyond 4–5 times the athlete’s vertical leg stiffness would not continue to affect ground reaction force, ground contact time or running velocity. Consequently, there is a broad range of stiffnesses where we would not expect sprinting performance to be altered. Whilst the results of previous research,10,11,29 and our rebound test suggest that the surfaces we tested were of considerably different stiffnesses, this difference may still have fallen within this range and subsequently not have been enough to impact performance. Consequently, it can be concluded that surfaces need to be considerably more compliant than artificial turf for significant performance impairments (and subsequently changes to the F-v-P profile) to be seen. Interestingly, significant differences were observed in several outcomes (sprint time, HZT-F0, HZT-Pmax and RF) during the first day of testing, with the artificial turf condition resulting in slower sprinting times. These findings therefore appear to lend some support to our hypothesis that running on the more compliant artificial turf surface would lead to a reduction in performance and therefore significantly lower F-v-P values. However, based on the discussed research investigating the effects of surface stiffness on sprinting performance, and since these results were not replicated on day two, the significant differences on day one are more likely due to other reasons than differences in surface stiffness such as random trial-to-trial variability, or some participants not participating in all tests. Nevertheless, when assessing inter-day reliability the concrete surface delivered 3 outputs with a CV >10% (HZT-F0, HZT-Pmax and DRF) as opposed to just one output on the artificial turf surface (DRF). This could indicate that the players were more consistent on a surface they were familiar playing on, providing some support for matching testing surface with playing surface when conducting F-v-P profiling.
Regarding intra-day reliability, we found high reliability (CV < 5%) for sprint time, HZT-V0 and RF with the remaining outputs demonstrating weaker reliability (HZT-F0, HZT-Pmax and DRF). These findings compare favorably to an earlier study measuring intra-day reliability 18 who likewise reported strong reliability for 30 m sprint time, HZT-V0 and DRF (CV <5%). In comparison to our study Runacres, Bezodis 18 found stronger reliability for HZT-F0 and HZT-Pmax (CV < 8%), although unlike our study, participants were allowed to run on a running surface of their choice which may have improved consistency. As our intra-day reliability calculation contains results from 2 different surfaces this could potentially explain the slightly higher levels of variation reported for these outputs (CV < 13%). With regard to assessing inter-day reliability of the outcomes, we found that sprint time, HZT-V0 and RF all displayed little variation between the two testing days (≤5.1%). These findings are in line with previous research.17,18 The remaining output variables (HZT-F0,HZT-Pmax and DRF) did however show higher variation (>10%) and this variation was also higher than reported by the previous study (≤10%;17,18) Similar to Simperingham, Cronin 17 we also found that the SEM was greater than the SWC for all outputs in both intra- and inter-day reliability assessments. Consequently, the ability of the F-v-P method to detect small changes in performance is limited. Indeed, the seasonal changes in F-v-P outputs among adult elite male soccer players reported by Jiménez-Reyes, Garcia-Ramos 26 were often smaller than the SEM reported for these outputs in our study, suggesting these changes could also reflect trial-to-trial variability rather than ‘real’ training induced changes. However, our participants were elite youth players and smaller variability may be present in adult elite players or trained sprinters.
Limitations
There are several limitations to the current study. First, although we used a radar gun and a freely available spreadsheet to both compute F-v-P outputs, practitioners could use other methods such as timing photocells, and the MySprint phone application. These may carry levels of accuracy and reliability different to the current study. Second, due to logistical reasons, we conducted the two sprints per surface together meaning that we were unable to completely randomise the order of sprints. Third, although we assessed surface stiffness using a rebound test, we did not assess the mechanical properties of the surfaces using dedicated tests, 30 meaning it is difficult to ascertain whether the stiffness of our surfaces fall within the ranges where we would expect to find differences in sprinting performance. 9 Fourth, footwear was not standardised between participants meaning that it was difficult to determine to what extent the differences recorded were solely due to running surface, with more damping shoes on the stiffer concrete surface and less damping shoes on the more compliant artificial turf potentially masking any surfaces effects. However, changing shoes does improve the ecological validity of the findings, where players are also likely to use different as well as their own unstandardized shoes when running on concrete or playing a football game. Finally, it is important to note that the F-v-P method computes a macroscopic F-v-P profile and this profile does not necessarily reflect the F-V curve at the muscle fiber level. Additionally, the F-v-P method relies on several assumptions, which may not necessarily be true. 31 The impact of such assumptions is however beyond the scope of this current paper.
Conclusions
Overall, there were no significant differences between concrete and artificial turf on F-v-P outputs recorded over two days of testing. However, significant differences were recorded on day one of testing and the variation was higher on the more unfamiliar surface. It is therefore recommended that practitioners match the testing surface with the playing surface wherever possible, and continue to use the same surface when retesting. Further, our findings show that the intra- and inter-day reliability of F-v-P outputs is high for some variables, but low for other variables and practitioners should preferably use reliable variables to monitor changes over a season. Since the standard error of measurement is larger than the smallest worthwhile change, the ability of this method to monitor seasonal changes may be limited in youth elite soccer players.
Footnotes
Acknowledgements
The authors would like to thank all participants and their parents/guardians for helping us with the research.
Authors’ contributions
SS, IBS and BVH conceived the research idea, SS, IBS and LR completed data collection and analysis. SS and BVH drafted and finalized the manuscript. All authors edited and revised the manuscript and approved the final version prior to submission.
Declaration of conflicting interests
The author(s) declared no potential conflicts of interest with respect to the research, authorship, and/or publication of this article.
Funding
The author(s) disclosed receipt of the following financial support for the research, authorship, and/or publication of this article: Ida Bo Steendahl is funded by the Deutscher Fussball Bund (DFB) Akademie through a scholarship for the international PhD program “Science and Health in Football” at Saarland University. The other authors did not receive any specific grant from funding agencies in the public, commercial, or not-for-profit sectors.