
Abstract
Analysis of 3926 shots from the 2019 Senior inter-county football championship aims to establish the impact of distance, angle, shot type, method and pressure on shot success. Findings demonstrate that shots from free kicks contribute 20.5% of the total attempts in Gaelic football, with a success rate of 75%, in contrast to 50% success of shots from open play. Moreover, the range from which free kick success is >57.6% accuracy extends to 40 m, while from open play this is passed at a range of 28 m. There were almost twice as many right foot shots (64.4%) compared with the left foot (32.4%), with right foot attempts marginally more accurate. Shots under low pressure were most successful, while those under medium pressure were less successful than those under high pressure, albeit taken from an average distance of 7.5 m closer to the target. A logistic regression model to explore the impact of all variables on shot outcome demonstrates the significance of shot distance, angle and pressure on the kicker, as well as whether shots are taken with the hand or foot. This research provides an important step in understanding the scale of the impact of a range of variables on shot success in Gaelic football while simultaneously providing an initial model to predict the shot outcome based on these variables.
Introduction
Gaelic football (GF) is a field invasion game native to Ireland. Scoring can take two forms – a goal, worth 3 points, is scored when the ball crosses the goal line, between the uprights and under the crossbar, while a point is awarded when the ball passes between the uprights and above the crossbar. Scores can be taken using either foot or by palming or punching a ball without taking it into possession, while points can also be scored using a fist pass motion. Free kicks in GF are awarded for a range of rules transgressions which are categorised into aggressive and technical fouls (www.gaa.ie, 2020. 1 ) A free kick is one of five set-piece situations in GF from which a team may elect to shoot, the others being a 45 m kick, a sideline, a mark, and a penalty. Sidelines and marks must be taken from the hand, while 45 m kicks and penalties must be taken from the ground and free kicks may be taken by either method. In all set-piece situations players can take the kick under no physical pressure, whereas when the ball is in play, variations of physical contact to include tackling and blocking, are permitted on the player in possession.
Effectiveness of shooting has been linked to match success2–4 while anecdotal evidence puts the success rate of free-kick attempts in GF at 72%. However, there remains a research gap specific to understanding how variables related to the shot situation can impact the probability of a successful shot. It is pertinent to consider similar research in other football codes that have observed the contribution of set-piece attempts to scoring (type), the relationship of footedness (method) to success, and the level of physical pressure (pressure) on the shooter.
In soccer, an analysis of goal scoring in the 2016–2017 UEFA Champions League, Gonzalez-Rodenas et al. 5 observed 75.9% of 380 goals scored were from open play, whereas 24.1% of the goals scored were from a set piece. However, when considering goals scored directly from set pieces there were only 13% (free kicks: 3.7%, penalties: 9.3%) of all goals scored in this classification. Similarly, Kubayi 6 observed 60.9% of 169 goals scored in the 2018 FIFA World Cup came from open play, with the remaining 39.1% from set-piece scenarios, albeit the study did not identify the quantity of goals that were scored directly from set pieces. Both included only successful shots in their analysis, meaning comparison of success rates between open play attempts and set-piece attempts was not feasible. Si Hang and Yang 7 analysed both shooting (n = 1330) and goal scoring (n = 146) in the 2019 Women's World Cup and reported 68.2% of shots and 65.9% of goals were from open play, whereas 31.8% of shots and 34.1% of goals were from set pieces. This research did not detail the exact nature of the set-piece attempts, thereby it is not feasible to understand the volume of shots and goals taken directly from the set-piece positions, nor was the success rates of each type of shot presented.
While the shot method in GF can include scoring with either foot, palmed or hand pass variations, across other football codes the only consistent scoring options are scoring off each foot. Several prior studies in soccer have identified that between 65% and 70% of goals scored were done using the right foot.8–10 In technical analysis of kicking mechanics Barbieri et al. 11 identified a higher ball velocity, foot velocity and accuracy when kicking with the dominant limb and proposed increased kicking practice with non-dominant limbs to affect improvement. While assessing snap kicking in Australian Football (AF) Cameron and Adams 12 determined left foot preference players demonstrated superior kicking ability to right foot preference players and suggested that players with a strong left side may be more desirable for recruitment. More recently in AF, Moore et al. 13 identified professional AF players were significantly less accurate when kicking with the non-preferred foot but did not extend the scope of this study to understand the ratio of right to left-footed kicking.
Physical pressure is a common feature in GF, and for shots taken from open play, a degree of physical contact is permitted. In basketball, Csataljay et al. 14 classified pressure into three levels, minimal, half and maximal, determined by the distance of the defender from the attacker at moment the ball was released for the shot. More recently, Francis et al. 15 measured the effect of defensive pressure on field goal success in wheelchair basketball through the classification of pressure based on the positioning of defensive players relative to the shooting player. Both studies demonstrated dropping shot success rates when faced with increasing levels of physical pressure. In soccer, Lago-Ballesteros et al. 16 assessed the impact of physical pressure on a player in possession of the ball using distance as the variable to classify pressure as loose or tight. While this research was focussed on possessional effectiveness and measured pressure as an ongoing and changeable variable for each possession, it remains pertinent to note that the mechanism chosen to determine pressure was the distance between the defensive player and the attacking player in possession of the ball. In AF Corbett et al. 17 described pressure as a dichotomous variable determined by the presence of an opponent within a 3 m area of the player disposing of the ball.
Shot success is a proven determinant of successful performance in elite GF2–4 while McGuigan and Collins 18 defined the scoring zone in GF as being within a 32 m arc of the goal, and not beyond an angle of 60° from the midline of the pitch. Despite this research, there is a lack of academic research to underpin coaching practices associated with the achievement of shot success in GF. As a result, this research aims to establish the relationship between shot type, method, and pressure and successful shooting in GF. Furthermore, shot pressure, method, type, distance, and angle will be considered as variables for the development of an exploratory logistic regression model for shooting in GF, with a view to developing a predictive model for shot outcome based on these variables.
Methods
Data collection
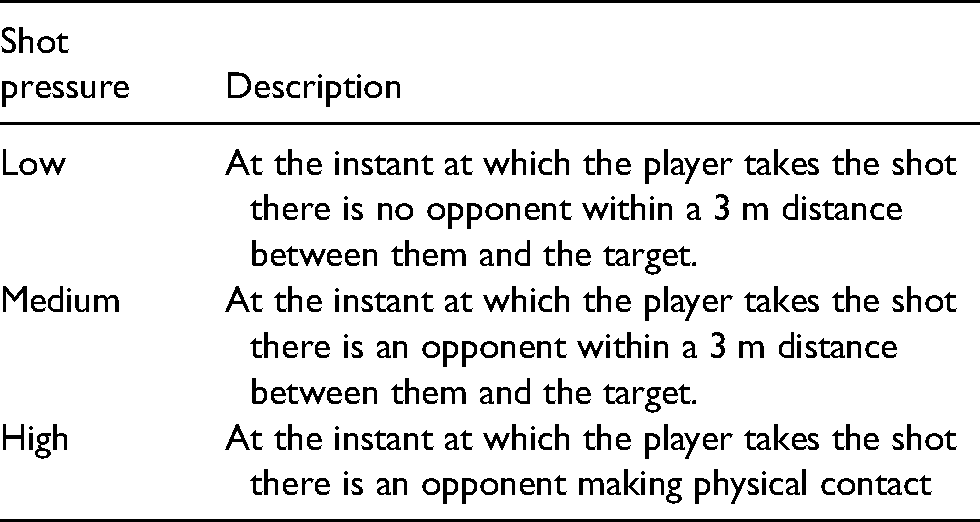
Data was generated using video analysis of full match footage during which shots were coded as key events. Each coded shot was labelled with a range of situational variables, including the type of shot, the shot method, and physical pressure applied to the player while executing the shot. Shot type categories were defined as open play, free kick, penalty, 45 m kick, sideline kick or a midfield mark, with free kicks sub-categorised into those taken from the hands, and those from the ground. Except for ‘open play’ all other categories outlined constitute the range of set-piece options which were features of the game in the 2019 championship. Shot method was categorised into left foot, right foot, fisted point and palmed, with shot pressure classified as low, medium and high. Operational definitions for key events were based upon previously validated operational definitions. 19 Prior to measuring shot pressure a review of previous GF related literature was carried out which established there was no precedent for classification of shot pressure in GF. When considering alternative sports, the method employed by Csataljay et al., 14 which categorised pressure as minimal, half and maximal was considered appropriate, subject to some clarifications specific to GF. Using the variable defined by Corbett et al. 17 in AF a distance of 3 m was considered an appropriate distance for differentiating between minimal and half pressure, with contact during execution considered as the threshold for maximal pressure in GF. The adapted operational definitions specific to physical pressure in GF were validated by an expert coaching panel with over 80 years of combined GF coaching experience, and defined as low, medium and high pressure (Table 1).
Expert coaching panel with over 80 years of combined Gaelic football (GF) coaching experience defined low, medium and high pressure
Analysis was carried out on full match video from 70 championship matches played in the 2019 championship series and was available through an online storage repository (Radio Telefis Eireann, Dublin, Ireland). All matches were downloaded onto a computer (Lenovo Intel Core IdeaPad S340) and analysed with a custom-built, multi-window coding panel configured in Dartfish Pro S (version 10) video analysis software (Dartfish Limited, Fribourg, Switzerland). All match footage, including normal time plus injury time was analysed while extra time in drawn games (n = 5) was excluded from the analysis. Subject games included 32 elite (inter-county) teams competing in the championship meaning every team was analysed across a minimum of two performances. One match from the 2019 championship fixtures (Mayo vs New York) was excluded since New York do not progress to compete in the All-Ireland series following their participation in the Connacht senior football championship. Shot data was exported to a Microsoft Excel spreadsheet (Microsoft, Washington, USA) where additional calculations 18 were performed to generate shot distance and angle from the software-generated x,y coordinate data. Data was connected to Tableau data analytics package (Tableau, Seattle, USA) for further analysis and visualisation, and imported to RStudio (RStudio, Boston, USA) for logistic regression modelling.
Reliability
Data collection in this research was undertaken by a single operator, however, to protect against observational errors, following coding of each match, 10 randomly selected shots were reviewed to ensure that variables were recorded accurately. If an error had occurred the variable was corrected, and a further 10 events were randomly selected for assessment of accuracy. Each game was considered complete when a full set of 10 randomly selected events were reviewed without observing an error. To ensure broader potential application of this methodology operational definitions used in this research had been previously validated 19 returning an inter-operator reliability testing returning an acceptable level of agreement (K = 0.973) between trials. Reliability of shot position data was also previously proven, 18 with inter-operator values for distance (p = 0.994) and angle (p = 0.835), and intra-operator values for distance (p = 0.873) and angle (p = 0.811) all considered to be within acceptable limits.
Data analysis
Summary data including descriptive statistics of shots and scores will be presented according to shot type, method and pressure. Furthermore, shots taken from open play and free kicks by each competing team in the 2019 Championship will be presented to include relative success rates of each shot type. A Chi-Square test of independence will be carried out on each variable to test the significance of the relationship with shot success while logistic regression modelling will be utilised to test the impact of each variable on the shot outcome and explore the potential of this model in predicting shot outcome based upon these variables.
Results
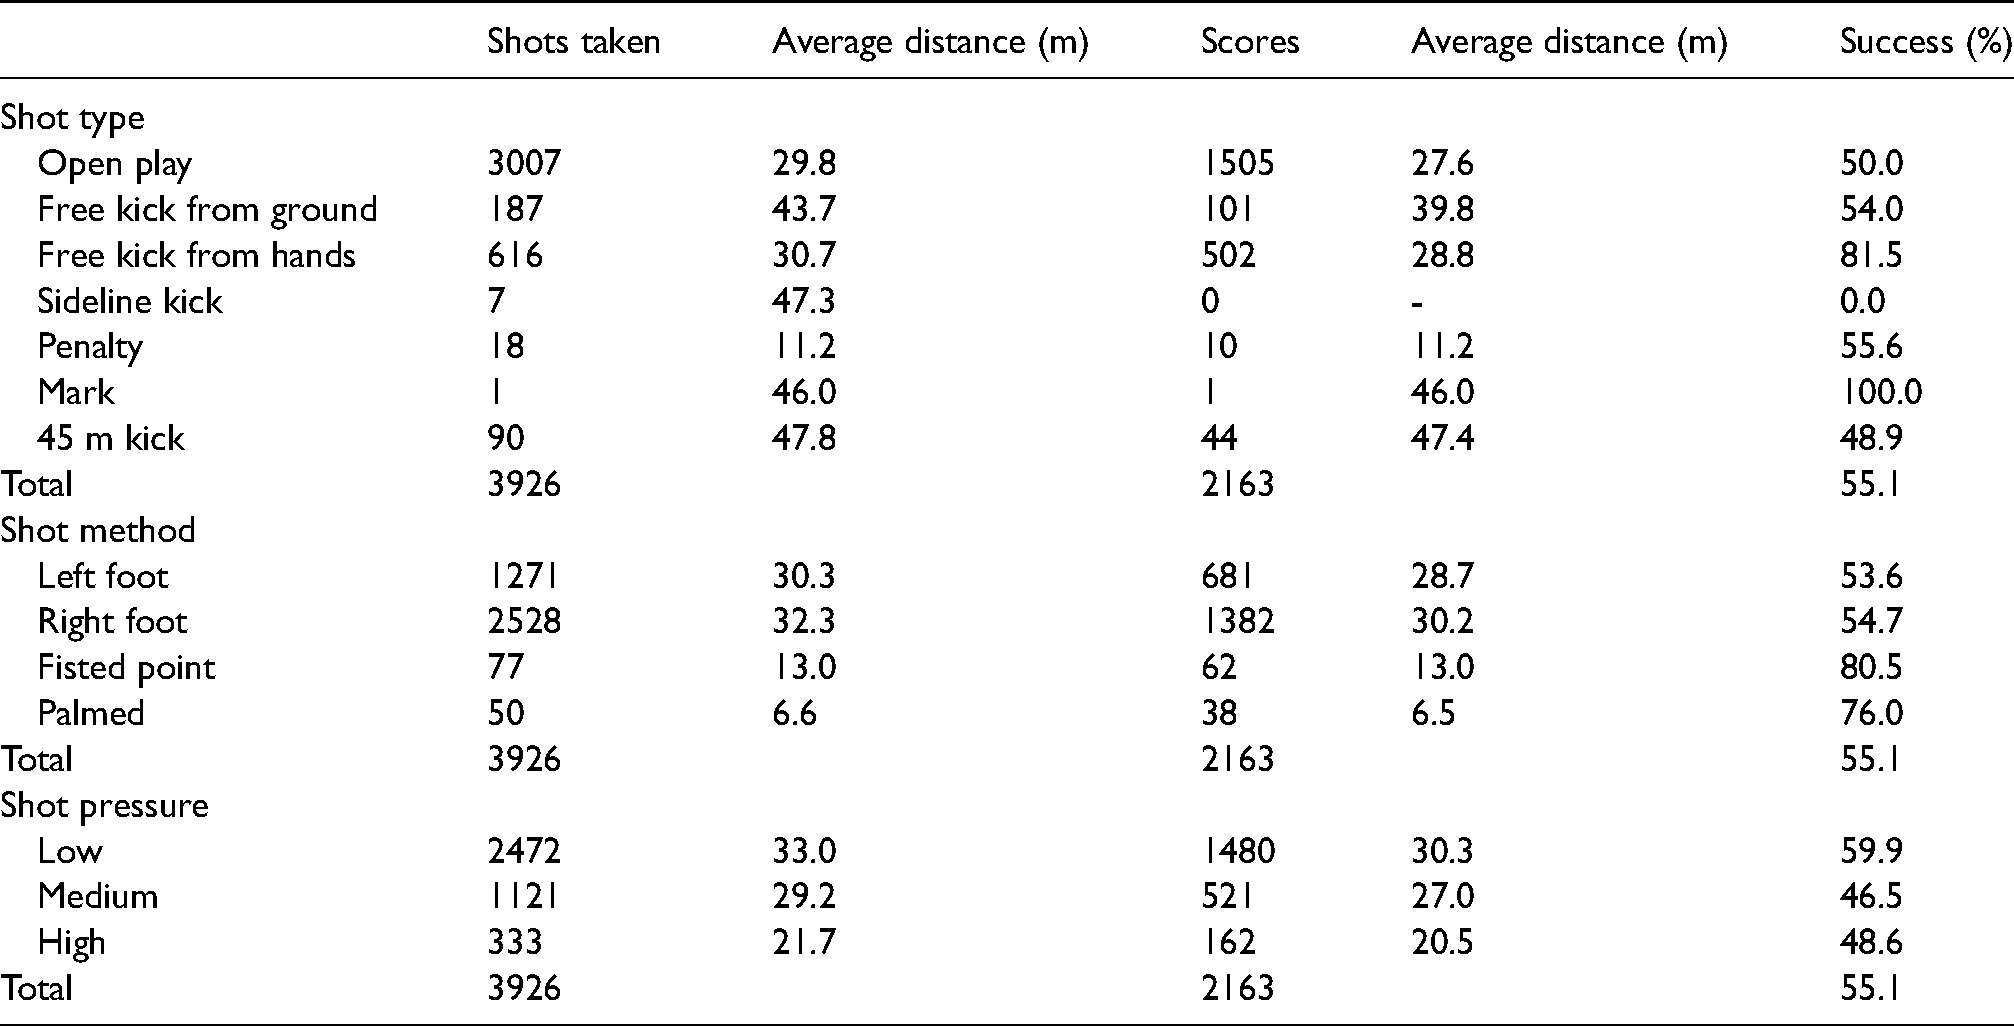
A total of 3926 shots from the GF championships of 2019 were analysed and assessed according to three situational variables: shot type, shot method and shot pressure (Table 2).
Summary of shot data categorised by shot type, shot method and shot pressure.
Shot type
Shots from open play were most common (3007/76.6%), with free kicks from the hands (616/15.7%), and the ground (187/4.8%) making up 20.5% of the total attempts. The remaining shots were 45 m kicks (90/2.3%), penalties (18/0.5%), sideline kicks (7/0.2%) and a single midfield mark (1/0.03%). Of the 3007 shots from open play, 1505 (50%) resulted in scores. Free kicks accounted for a total of 803 shots, from which there were 603 scores, a success rate of 75%. When considering free kicks in the two forms, those from the hands were more successful, with 502 scores from the 616 shots analysed (81.5%), while there were scores from 101 of the 187 (54%) taken from the ground. Of the remaining shots, there were 44 scores from 90 (48.9%) 45 m kicks analysed, and 10 successful penalties from 18 observed (55.6%). The remaining shots were from sideline kicks (0/7) and one solitary successful attempt from a midfield mark.
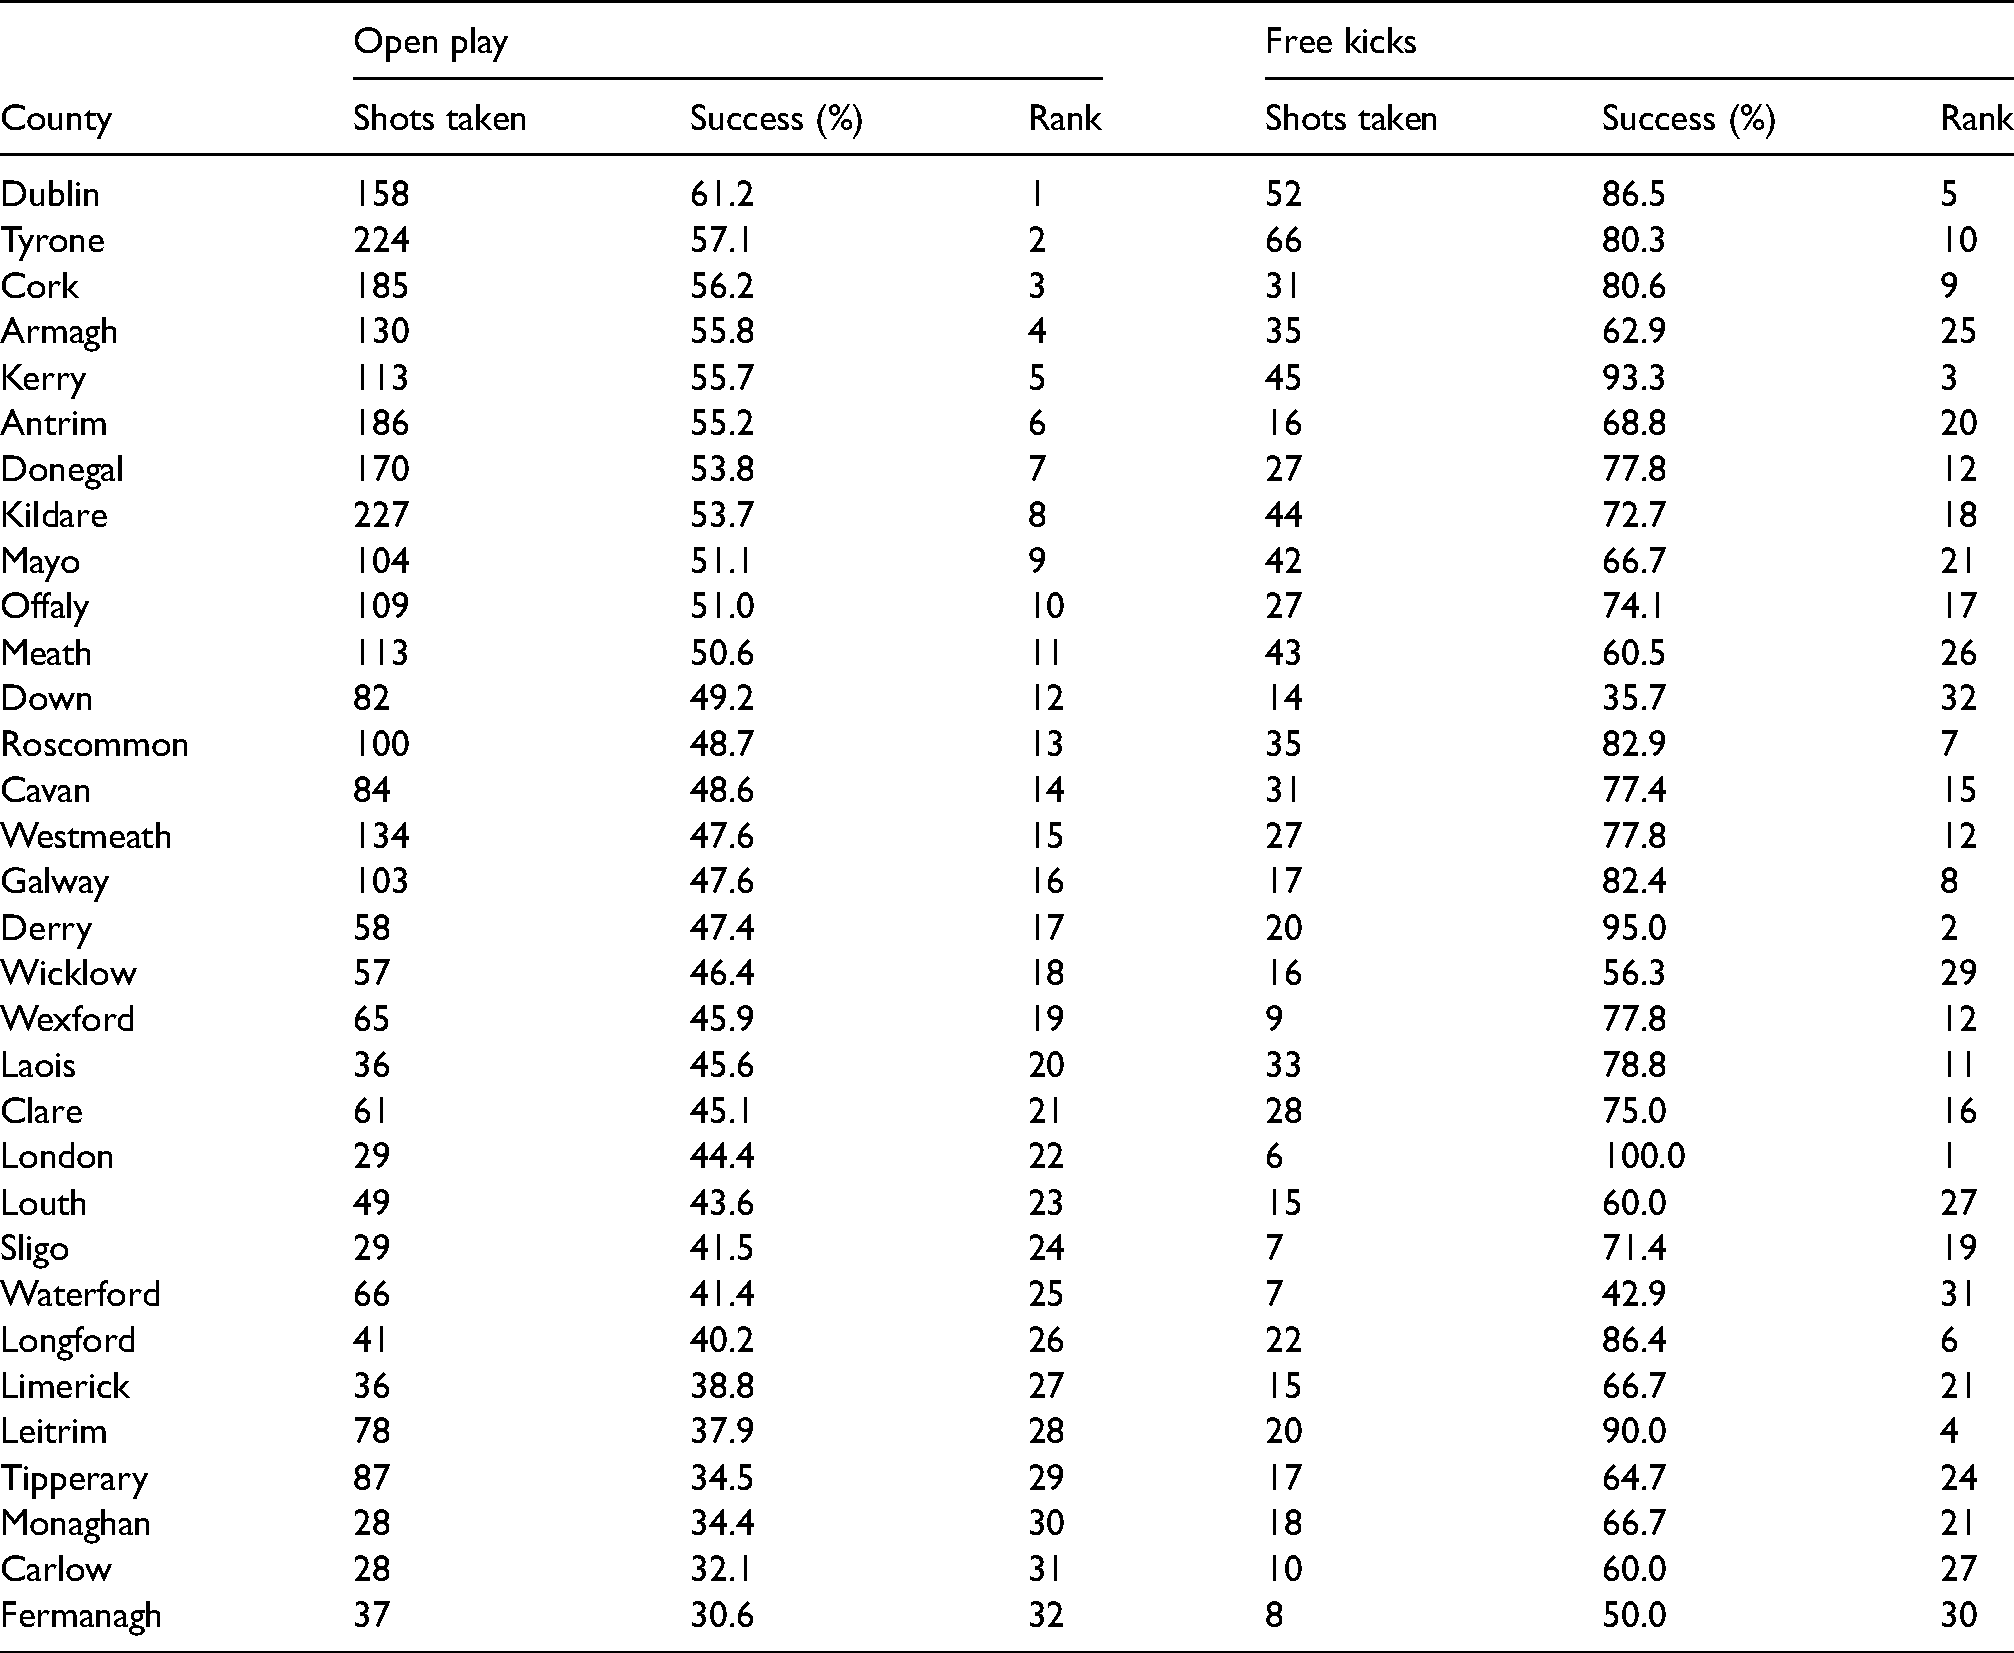
The average distance of shots taken from open play was 29.8 m (±11.0 m), with free kicks from the hands marginally longer at 30.7m (±9.5m) and free kicks from the ground taken from a greater average distance of 43.7 m (±11.2 m). Shot success from open play fell below the threshold for winning performance of 57.6% 2 beyond 28 m. Average success from open play inside 28 m is 64%, while beyond 28 m average success fell to 42%. When assessing shots taken from free kicks, the success rate does not drop <57.6% until taken from beyond 40 m. Inside 40 m free kicks have a combined success rate of 86% while beyond 40 m, free kicks are 48% successful (Figure 1). Notably, inside the 28 m arc, beyond which open play success drops below the winning threshold, free kicks were 98% successful. From open play, eventual All-Ireland champions, Dublin were the most prolific team, scoring from 61.2% of their 158 open play shots (Table 3).
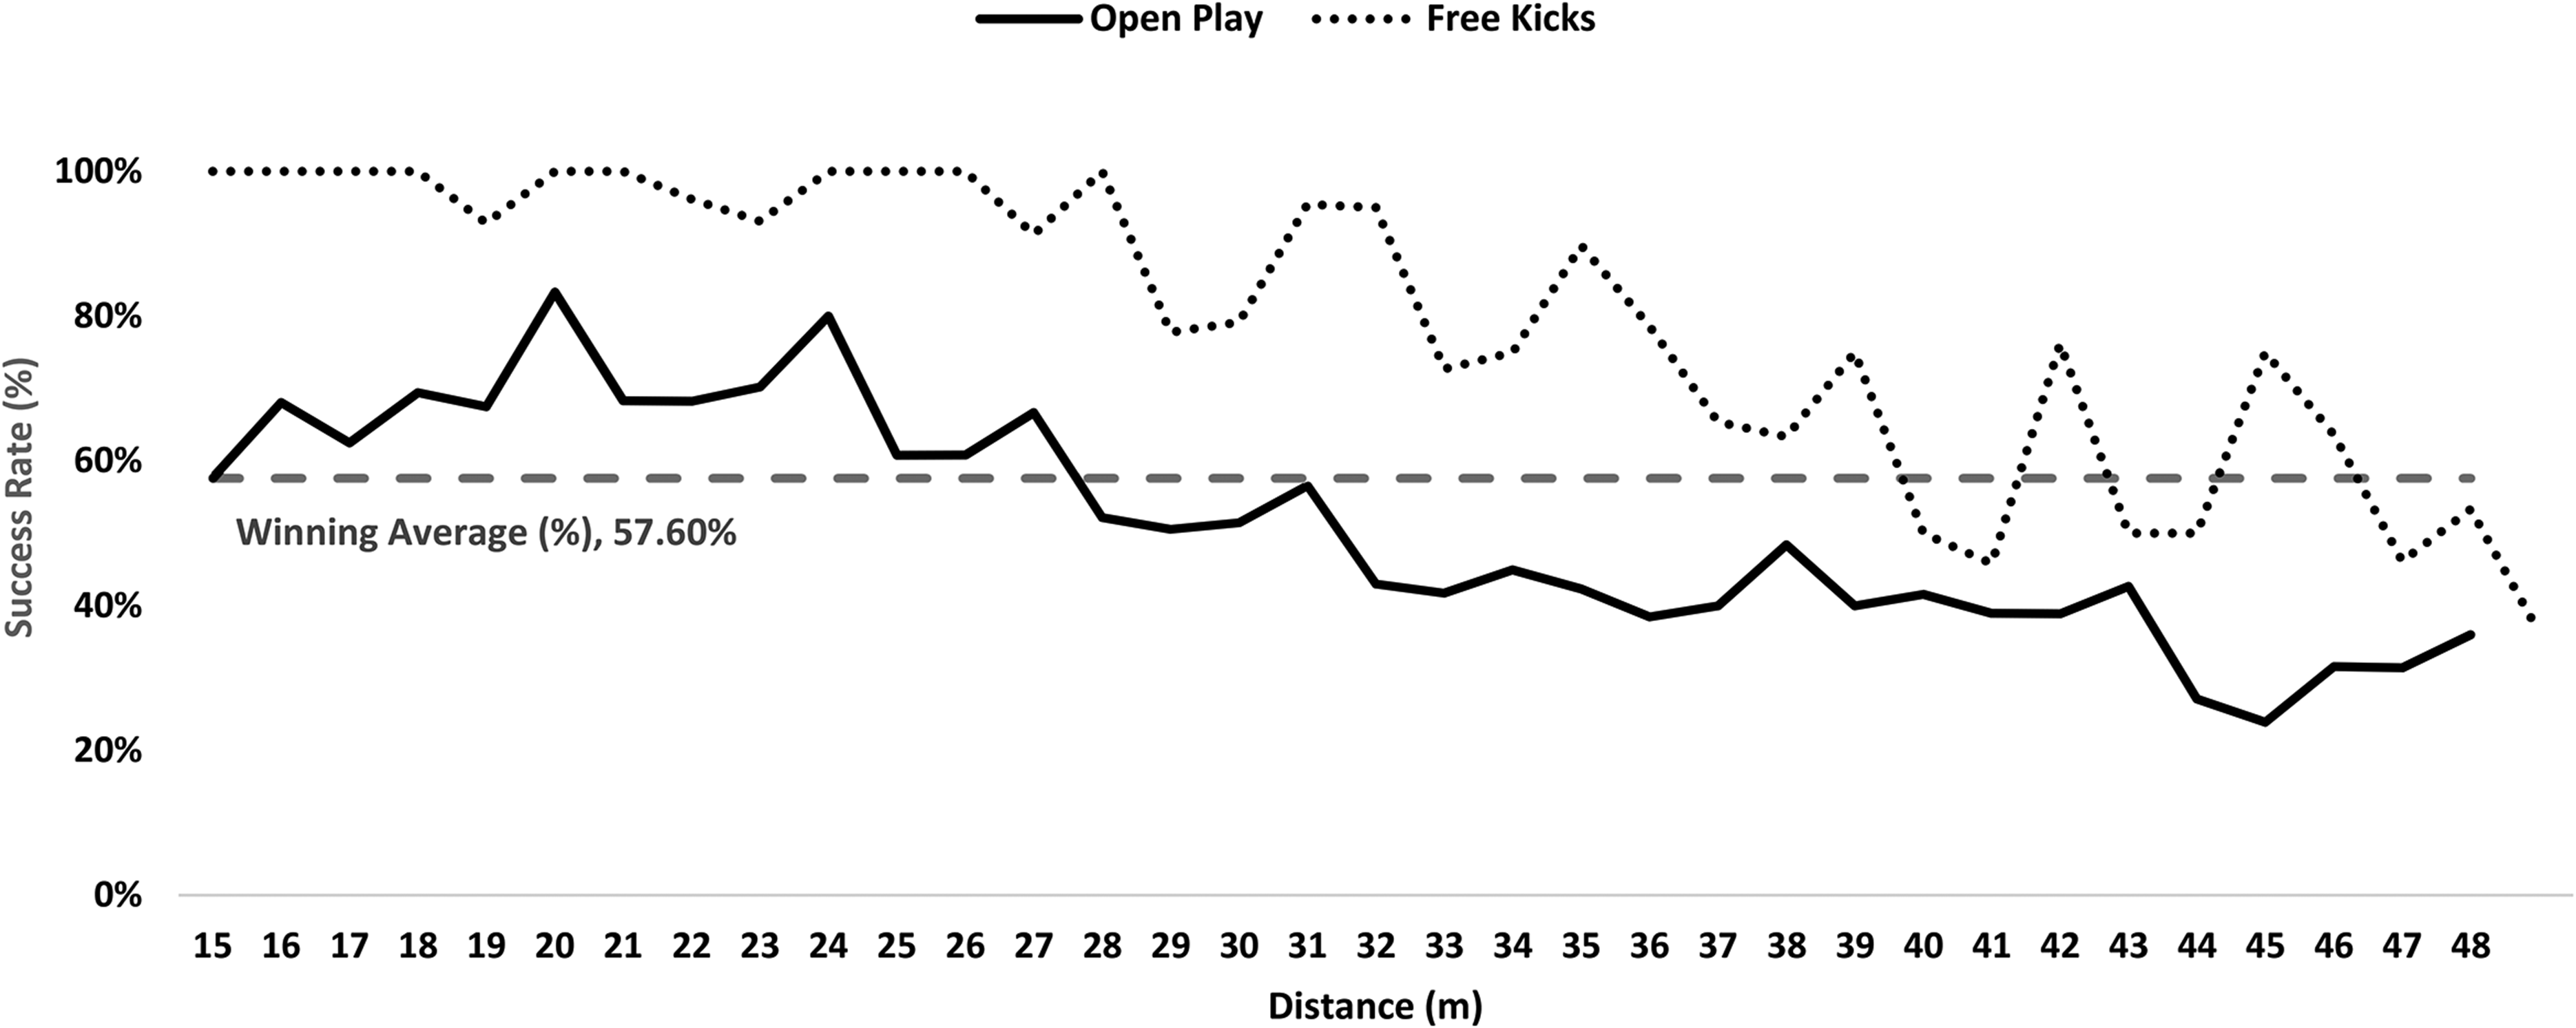
Success rates from open play and free kicks per distance of shot.
Summary of open play shots and free-kick shots taken and success rate per county in the 2019 championship.
Shot method
The primary shot method was right foot shots (2528), accounting for 64.4% of all shots taken. Right foot shots were taken from an average distance of 32.3 m, with a success rate of 54.7%. Left foot shots (1271) constituted 32.4% of those analysed and were taken from an average distance of 30.3 m with a success rate of 53.6%. The remaining shots were fisted points (77/2.0%) from an average of 13 m, with a success rate of 80.5% and palmed efforts (50/1.3%) which were from an average distance of 6.6 m and were 76% successful.
Shot pressure
All ‘set play’ shots were subject to low physical pressure, while of the 3007 shots from open play, 1553 were subject to low pressure, and were 53% successful. Open play shots taken under medium pressure (1121) were less successful (46%), while those taken under high pressure (333) were 49% successful. The average distance of low-pressure shots was 31.9 m, while medium shots were from an average distance of 29.2 m, and high-pressure shots from 21.7 m. While high-pressure shots were more successful than medium pressure shots, they were taken from an average of 7.5 m closer to goal (Figure 2).
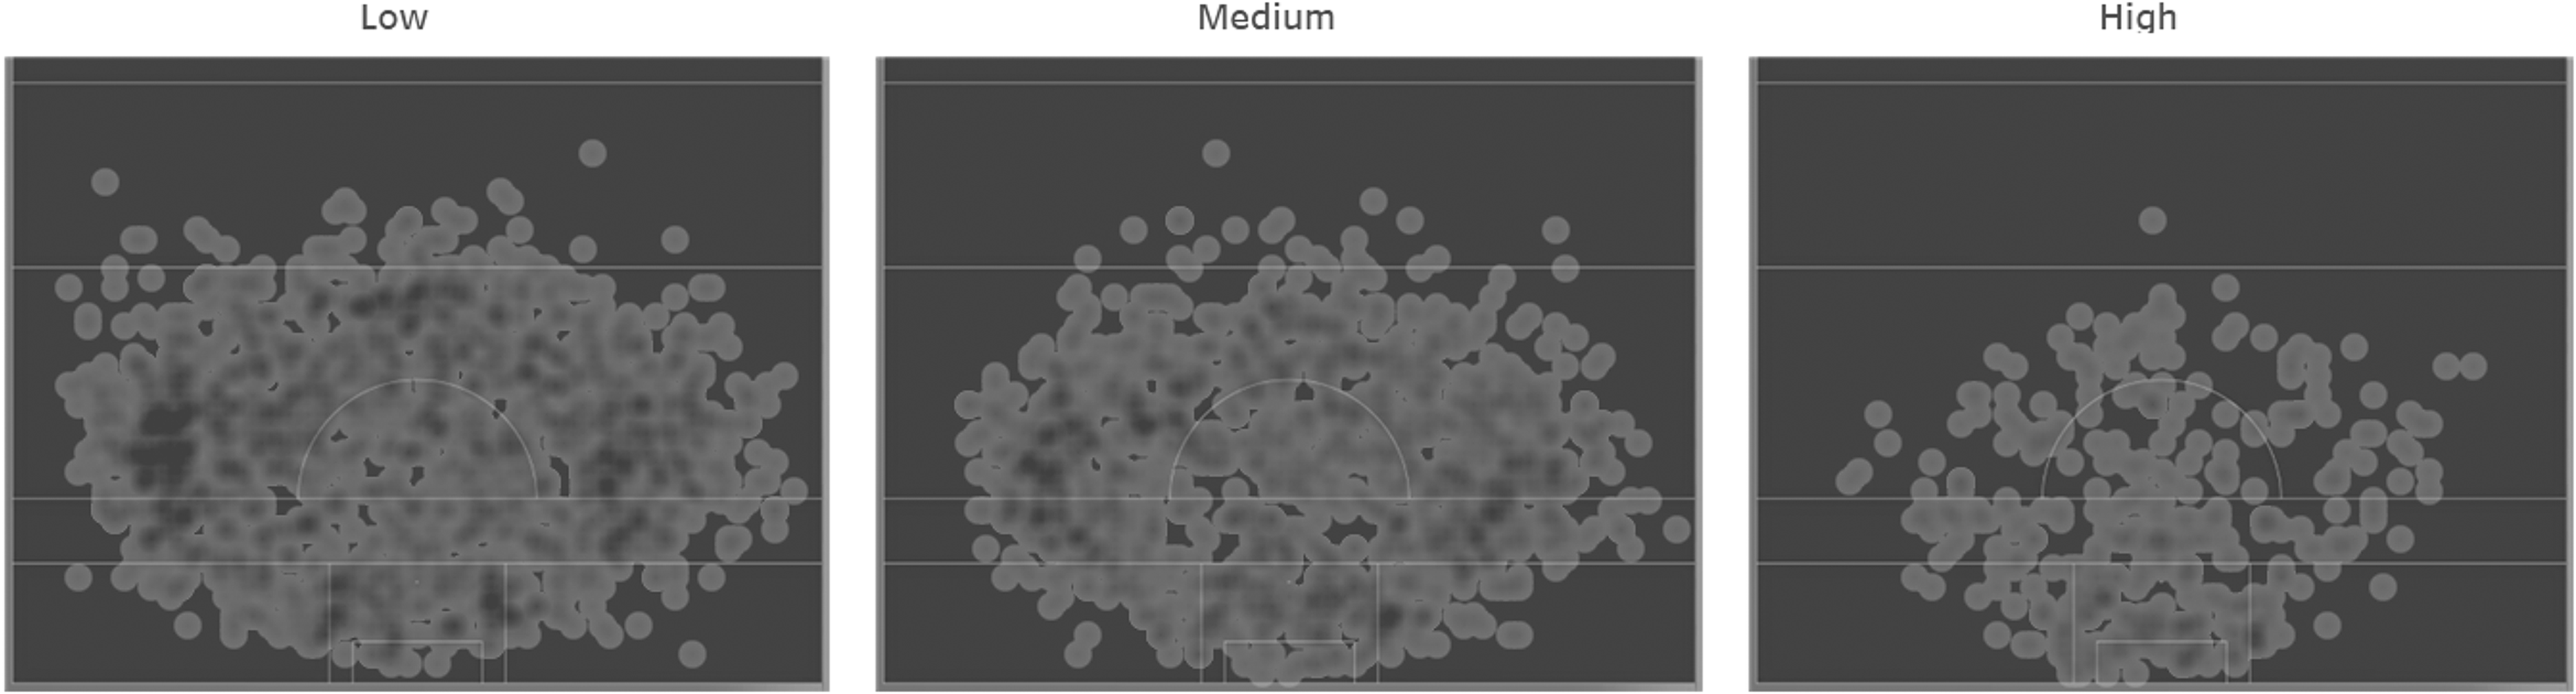
Density plot of the 3007 shots taken from open play categorised according to the level of physical pressure applied when taking the shot.
Logistic regression modelling
A Chi-square test of independence recorded a significant relationship between shot success and each of the variables considered in isolation; shot type (p < 0.001), shot method (p < 0.001) shot pressure (p < 0.001). To explore the impact of these variables on shot outcome in the presence of all other variables a logistic regression model was developed. It aimed to predict whether a shot resulted in a score based on a set of predictor variables. Selected predictor variables included two continuous variables, distance of shot from goal (m) and angle of shot away from the midline of the pitch. 18 Categorical variables included were type (open play, dead ball hand, dead ball ground), method (left foot, right foot, hand) and pressure (low, medium and high) with an additional categorical variable indicating whether a shot was a goal attempt or a point attempt also included.
Table 4 shows the results of the model fitted through RStudio using the glm function based on the predictor variables listed above. It shows the estimated model coefficients along with their standard errors, associated z values (Wald z-statistic) and p values for tests as to whether the coefficients are different from 0. The AIC and residual deviance values (both based on log likelihood) for this model are given by 4804 and 4784, respectively, with null deviance of 5401.8.
Full logistic regression model.
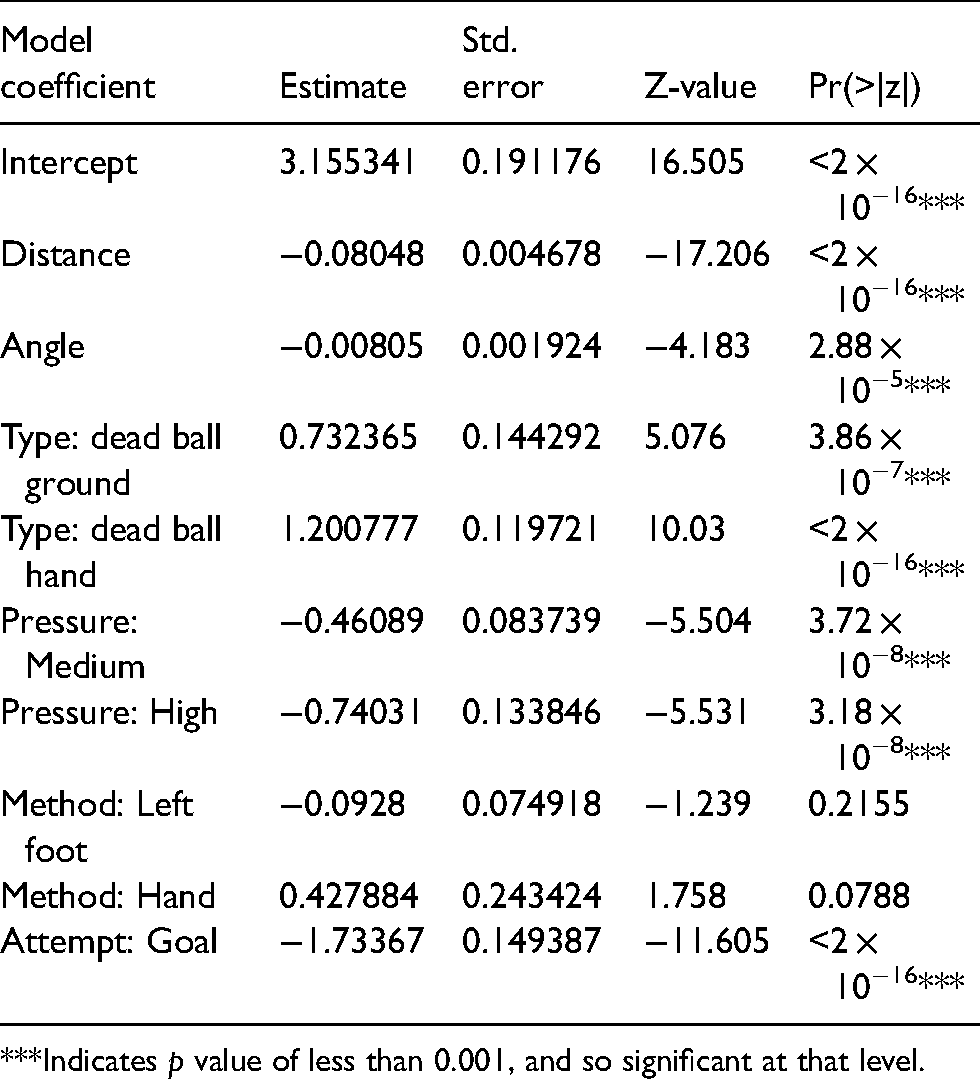
***Indicates p value of less than 0.001, and so significant at that level.
Notably, all the predictor variables are strongly significant except for those linked to the shot method. The model was refined by first excluding the left foot as a separate predictor and then removing the hand as a predictor, and thus removing the shot method entirely from the model, with the AIC values for each model examined. It was found that the optimal AIC value (4803.5) was associated with the model that included a shot method variable with two levels, shots with the foot and shots from hand. This final model is shown in Table 5. Notably, in this revised model with optimal AIC value the method variable based on the Wald test is borderline insignificant. An analysis of deviance using a chi-squared test supported the significance and inclusion of the method variable in a binary form, separated between hand and foot shots.
Revised logistic regression model.
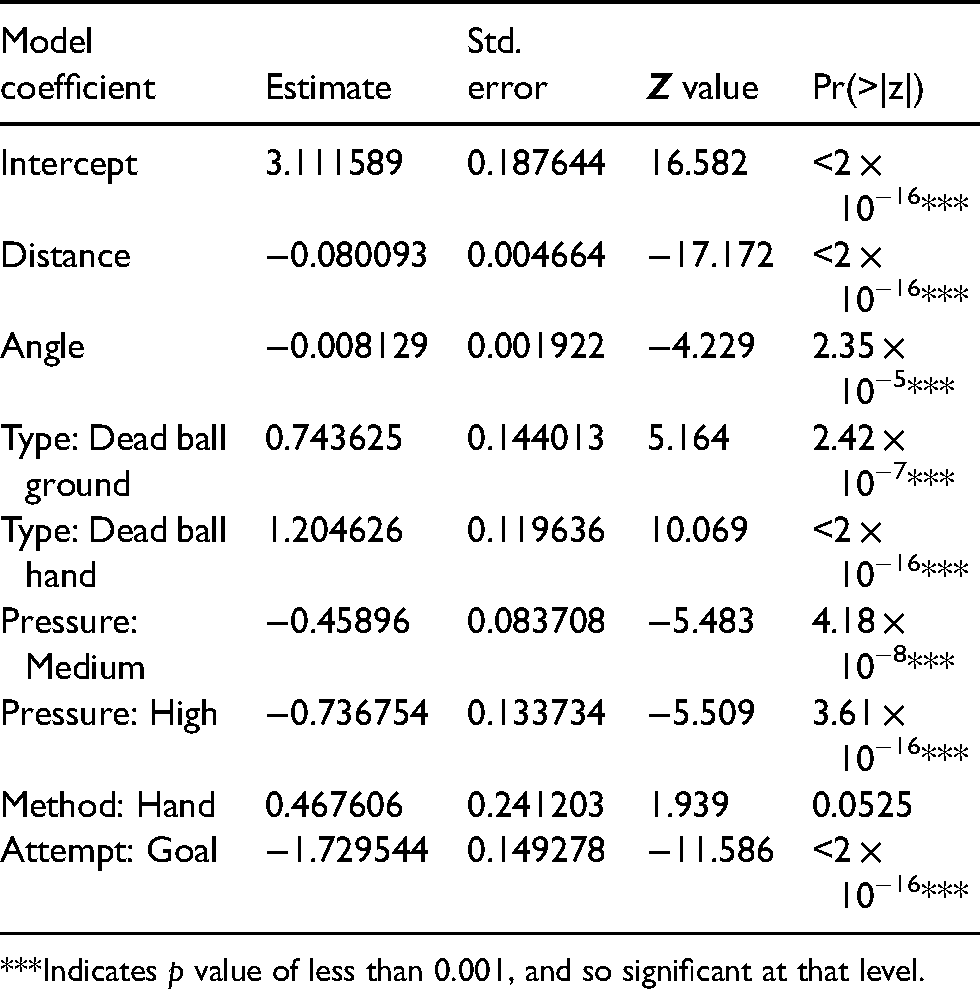
***Indicates p value of less than 0.001, and so significant at that level.
The purpose of developing the regression model is to explore the effect of the key shot variables of distance, angle, method, type, and pressure on the likelihood of a shot resulting in a score. One of the advantages of using a logistic regression model is its interpretability and any analysis must start by addressing the impact and reasonableness of each of the coefficients of the model.
The intercept value represents the prediction of the log of the probability odds of scoring from a shot for a point, from a distance of 0 m, at an angle of 0°, taken from open play, with the foot, under low pressure. As an example, a shot was taken from open play at the edge of the D (35 m) directly in front of goals, with the foot, under low pressure will have a success probability of 0.58 (Table 6).
Demonstration data using the logistic regression model to predict the outcome based on the selected variables.
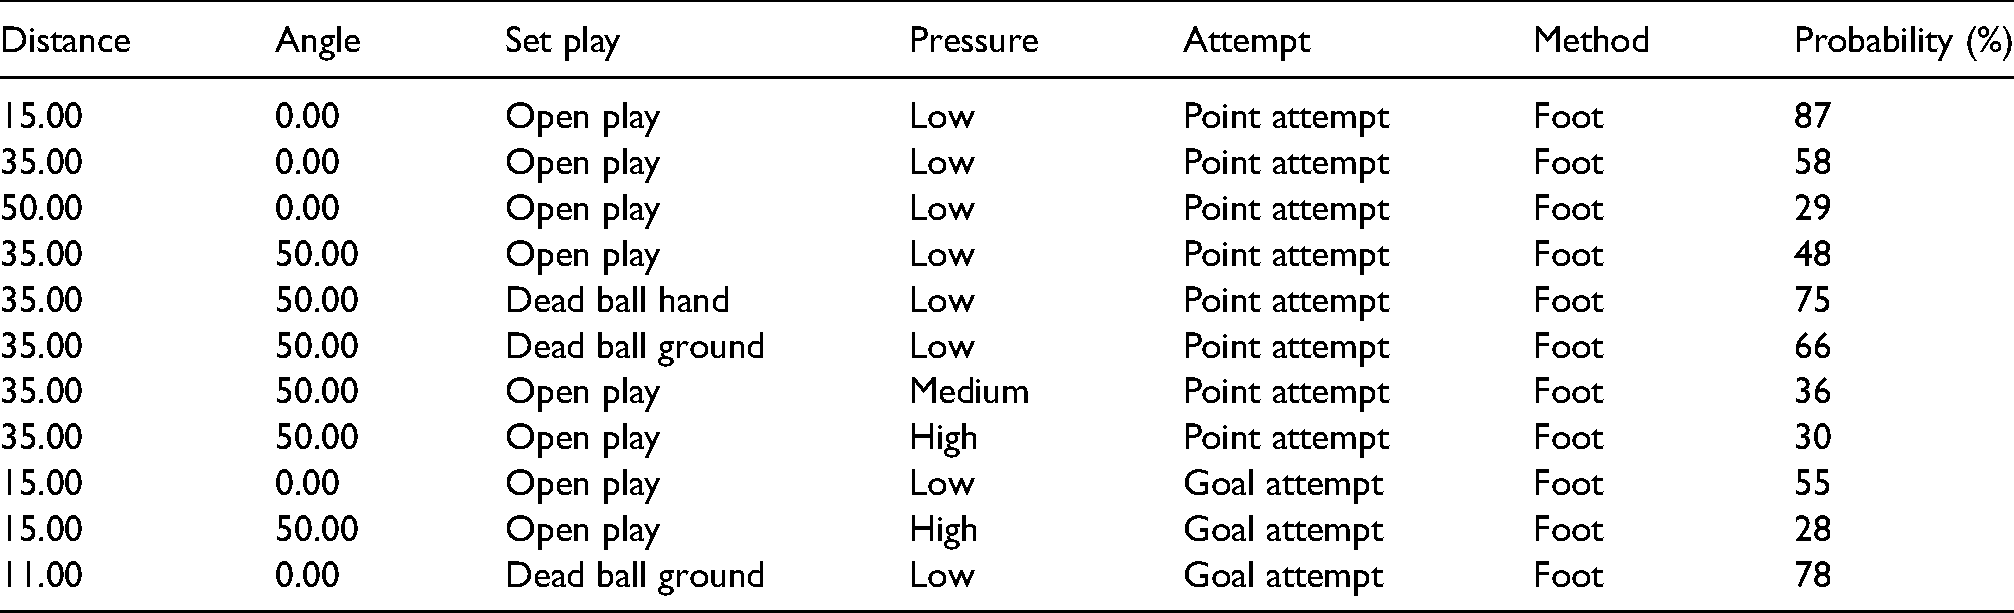
Looking at the model coefficients in detail the distance value is negative which implies that the further out the shot is taken from the less likely that you are to score. Similarly, as the angle away from the pitch midline increases the likelihood of scoring decreases and as pressure increases probability of scoring also decreases. Table 6 depicts the probability of success for a range of hypothetical shot scenarios based on the logistic regression model.
While the goal of this work is to undertake an initial exploration of the impact of situational variables on score outcome, it is noted that, with the revised model, the proportion of scores predicted correctly is 65%. In comparison, a model which simply predicts all shots would be scores would be correct for 55% of the scores. A more complete analysis of the predictive capability of the model would of course split the data set in test and training sets and this will be a key part of future research.
Discussion
The current research aimed to explore the impact of shot type, method, and pressure on successful shooting in GF while establishing an initial logistic regression model capable of predicting shot outcome based on these variables combined with shot position data.
The findings of this research have demonstrated the important contribution of set-piece shooting in GF, in particular free kick proficiency, with more than 1 from every 4 scores in GF coming directly from set-piece attempts. Free kicks contributed over 20% of all shot attempts, and had a success rate of 75%, marginally higher than the previous anecdotal evidence reporting free kick success of 72%. In soccer, Gonzales-Rodenas et al. 5 recorded only 13% of goals directly from set-piece attempts, with only 3.7% of these goals from free kicks. The contrast with the findings of this research, where free kicks contributed 27.8% of the scores recorded, demonstrates the value of free kicks, and indeed the value of possessing proficient free-kick takers in GF. Providing further support to the value of free kicks in GF, the success rate of shots from open play was 25% lower than that from free kicks. In their research in soccer, Gonzales-Rodenas 5 and Kubayi 6 only reported on goals scored while Si Hang and Yang 7 did measure both successful and unsuccessful shots but did not offer a breakdown of the nature of the set-piece attempts, thereby comparison of success rates with soccer research is not feasible.
The current research demonstrates that shooting from a free kick can increase the range for successful shooting, extending the shooting zone described by McGuigan and Collins 18 to a 40 m arc from the centre of goal within which success rate remains above the threshold of 57.6% as outlined by McGuckin et al. 2 for winning teams. From a defensive perspective, the results highlight the importance of not conceding free kicks, with shots from play falling <57.6% threshold beyond 28m – a difference of 12 m between open play and free-kick attempts. In Rugby union place (set piece) kicking, Pocock et al. 20 identified a range of 42 m as the threshold beyond which success fell below the tournament average. When considering the closed nature of free kicking taking in GF and the similarities with Rugby union set-piece kicking, it is interesting that the range of 40 m in GF compares so closely with that described by Pocock et al. 20 in Rugby union.
Notably, Gonzales-Rodenas et al. 5 recorded 9.3% of goals scored from penalties, in contrast to GF where only 0.005% of the scores recorded were as a result of penalties. The lower contribution of penalties to overall scoring in GF suggests that the awarding of penalties is not as prevalent in GF, perhaps reflective of the more physical nature of the game compared to soccer, while consideration must also be given to the dual scoring mechanism in GF and the resulting volume of scores, which contrasts with the relatively low scoring frequency in soccer.
Carey et al. 21 identified 79% of players at the 1998 soccer World cup as having a right foot preference, a trend noted to be in keeping with the general population. Despite the predominance of right foot preference players, several studies in soccer recorded between 65% and 70% of goals scored with the right foot.8–10 While not recording the preferred foot of the players, the current research has demonstrated that 64.4% of shots in GF were taken with the right foot, while 32.4% were taken with the left foot. When considering the relative success rates with each foot, right foot shots were shown to be marginally more successful, while also being taken from a slightly greater average distance. The margin between the general population identifying as right footed (79%), and the volume of shots taken with the right foot (64.4%) would suggest several shots in GF are taken with the non-preferred foot. When considering findings in AF, Moore et al. 13 found that players are significantly less accurate when kicking with their non-preferred foot and it, therefore, may be pertinent to consider greater recruitment of players who are proficient with their left side. 12
Findings suggest that during open play elite teams are effective at working scoring opportunities that can be taken under low physical pressure, with more than half of all open play shots taken with low pressure applied, while only slightly >1 from every 10 attempts were taken under high pressure. Csataljay et al. 14 and Francis et al. 15 both described lowering chances of shot success as pressure increased in basketball shooting. This research demonstrated marginally higher shot success at low pressure (53%), compared to medium (46%) and high pressure (49%) for shots from open play. While the success rates relative to pressure are not definitive it must also be considered that shots taken under high pressure were from an average distance of >10 m closer than those taken under low pressure, and 7.5 m closer than those taken under medium pressure. When considering the higher success rates of free kicks compared to open play attempts, it is pertinent to consider the value of applying high pressure, which carries an added risk of conceding a free kick, while seemingly not reducing the chances of success, when compared to the application of medium pressure,
The logistic regression model constructed in this research has proven to be 65% effective at correctly predicting shot outcomes. Shot distance, angle, type, pressure and whether a shot was a goal or point attempt all proved significant factors in predicting shot outcome, with the shot method (foot vs. hand) proving to have a borderline insignificant impact on shot outcome in the refined model (Table 5). This model provides coaches with a method to quantify the quality of a shot in terms of the potential for shot success (Table 6). Using off the shelf analysis software it is feasible to attribute the required information to shots, generate the distance and angle data 18 and then calculate the probability of shot success through the application of the logistic regression model. Through quantification of shot success probability, coaches may have a mechanism through which to gauge the effectiveness of both attacking and defensive play in terms of the quality of chances created and conceded.
Conclusion
Set piece scores, in particular free kicks, are a vital contributor to scoring in GF with over 3 out of every 10 scores taken directly from set-piece attempts. From a defensive perspective consideration must be given to the much greater potential scoring zone offered from free kicks, extending to 40 m, a total of 12 m beyond that for open play shots. The importance of possessing both left and right foot dominant players is supported by the overall scoring return of both. In acknowledging physical pressure, the findings present a range of options to consider from a coaching perspective, specifically when prescribing defensive tactics and practices. For example, is the application of high pressure worth the risk of conceding a free kick, which in turn increases the chance of a successful shot? The exploratory logistic regression model is a welcome addition to the analysis of scoring opportunities in GF, and while providing a credible model for predicting shot success, it has also sign posting a range of directions for future research across Gaelic games.
Limitations and recommendations
The purpose of this research was to assess the impact on the shot success of several variables related to shooting in GF and to explore the potential of logistic regression modelling in predicting shot outcome in GF. While demonstrating the potential of such modelling, it is evident that several variables should be considered as distinct categorisations of models, rather than variables within a single model. Ongoing work is looking at developing separate models to predict the outcome from point attempts and goal attempts. These models will also explore more complex interactions between predictor variables to allow, for example, for the possible difference in outcome for right-footed players shooting from the left side of the field versus the right side of the field.