
Abstract
The aims of this investigation were to describe the physical output of hockey relative to possession status, and to identify differences in physical output during each possession category with respect of match result. Ten international matches were analysed utilizing Sportscode to identify in and not in possession instances. 24 players (age 26 ± 4) wore a 10 Hz GPS device to track physical output. Linear Mixed Models and post hoc pairwise comparisons were utilised to compare the physical output in each possession category within each position and relative to match result. Significant main effects were found for possession status on several physical output metrics (p ≤ 0.05). For all positions except forwards, not in possession instances were more physically demanding than in possession instances for metrics such as relative total distance, explosive distance, and high-speed running (>5.5 m.s−1). No significant difference was identified between possession category physical output aligned with match result (p > 0.05). This study shows for the first time that not in possession instances were more physically demanding than in possession instances for defenders, outside backs and midfielders. For not in possession instances, relative total distance and high-speed running was, on average, 13% and 41% higher compared to in possession instances. Furthermore, there was no statistical difference in physical output for any position during each possession category relative to the match result.
Introduction
Hockey is an intermittent and dynamic team field invasion sport played on a watered artificial surface in an eleven versus eleven player format. 1 It is an Olympic sport with unique demands due to the specific rules and equipment utilised, which is categorised as a heavy exercise, with an estimated energy expenditure that ranges from 36 to 50 kJ/min. 2 Male hockey players cover between 5,232–6586 m during match play, while completing 25% of this total distance in high intensity zones.3–5 Player position can have a major impact on the physical output of players, with midfielders and forwards completing greater high-speed distance and actions whereas defenders tend to complete greater absolute total distance while accumulating more playing time as they are rotated less frequently. 6 , 7
Beyond full match or tournament summaries, 6 there has been a lack of granularity and context provided in relation to physical output data in hockey coupled with limited exploration of influencing factors such as technical performance and tactical style. 7 In other field sports, physical output has been analysed in great depth with several contextualised factors investigated, for example, match result 8 or phase of play, 9 providing a greater understanding of the variance present in physical output data. 10 , 11 These investigations have established a relationship between the tactical, physical, and technical performance of players and how factors like physical output relative to possession status can in part explain the outcome of match play. 12 Additionally, adding further depth to physical output data has enabled the informed design of training practices with practitioners attempting to replicate the worst case scenario periods experienced in match play to optimally prepare athletes for the highest demands of the sport. 13 , 14 However, solely relying on physical output data without analysing the contextual factors such as the influence of possession on how the accumulation of physical output in match play occurs, may lead to practitioners designing conditioning or training drills that do not capture the tactical and contextual nuance of how this output is accumulated in match play and thus not abide by ecological dynamic principles. 15 , 16
Possession of the ball is an unpredictable and dynamic element of match play in team sport.17–19 It is a key contextual factor that may influence players physical output 19 and match result. 20 For example, an increase in possession has been shown to decrease the distance per rotation in rugby league players, 21 which may be linked to a maintenance of a structured formation and consistent positioning. When compared to unsuccessful teams, teams who were successful completed greater total distance (18%) while in possession of the ball. Similar findings were reported for high-speed distance (16%) and very high speed distance (14%). 22
This is further emphasized in the research of Hoppe et al., 23 who reported that total distance accumulated while in possession of the ball accounted for 60% of the variance in points accumulated across a season rather than just the arbitrary measure of total distance. Furthermore, soccer teams that placed in the highest positions (Top 4) in the league across four seasons, completed more distance while in possession of the ball than those in the middle and low ranked teams within the league. 24 However, in a less possession orientated sport, that is more contact based like Australian Football, which has similar relative total distance completed to hockey, time spent at >3.88 m.s−1 and >5.27 m.s−1 without ball possession was a significant predictor of success. This may suggest that the defensive work rate and closing down space is a vital component of success in this sport. Both findings may be applicable to hockey. High levels of physical output in possession may allow a team to move the ball quickly against an unset defensive structure during counter attacks. In defensive phases, a high work rate may prevent the opposition entering your circle and thus reduce goalscoring opportunities. Yet there is limited investigations which provide insight into this element of the sport.
Aside from full match/tournament summaries of physical output, hockey is largely understudied in terms of tactical and technical performance. Konarski et al. 25 have established that a zonal marking system reduces the energy expenditure and heart rate load of field hockey players compared to a man to man marking system. Timmerman et al. 26 highlighted that possession focused small sided games increased the metres per minute completed but reduce the amount of high speed running and sprinting completed. 26 However, physical output was not split by possession category, therefore, there is still a limited understanding of the role possession plays in the accumulation of physical output in hockey.
Given the variance present in the physical output of hockey players, as noted by previous authors, 5 , 27 , 28 it is important to identify and describe the factors that contribute to such variability to assist in the analysis and interpretation of match activity profiles. There is a link between physical output during match possession phases and match outcome in other team sports, but no research is currently available in this domain in elite hockey, within match play. Investigating physical output relative to possession status, as well as these parameters combined with match result, should increase the understanding of the physical and tactical-technical requirements of this sport. Therefore, the aims of this investigation were: (i) to describe the physical output of hockey players relative to possession status, and (ii) to identify differences in physical output during each possession category with respect of match result. These findings will provide a comprehensive analysis of the relationship between possession and physical output in male international hockey players.
Methods
Match sample
Ten international level matches were analysed, over a 3 month period, with each of the matches split into four 15-minute quarters, as per international Hockey Federation match play rules. Match results consisted of four wins, four losses and two draws. Opposition teams were ranked between 1 and 18, with an average ranking of 5. Players were categorised into four positional groups for each match in a squad of 16 outfield players – Central Defenders (n = 3) Outside backs (n = 3), Midfielders (n = 5) and Forwards (n = 5).
Coding procedures
The matches were video recorded and ‘coded live’ for in-match events by an experienced performance analyst. The analyst has 4 years’ experience working in international hockey and holds a master’s degree in performance analysis. Match coding was reviewed post-match by the same performance analyst and a second performance analyst using the multiple camera angles available to ensure accuracy. Accuracy of coding was also assessed versus coding received from the opposition in two of the matches investigated. An interclass correlation coefficient of 0.96 was found between operators. Match events were coded using SportsCode Elite software (Sportstec Limited).
An experienced performance analyst logged a possession event when a team held possession of the ball for more than a three-second period and included the preceding Three seconds once the threshold was met. Three seconds was used as a threshold for several reasons – it ensured the team had sufficient control of the ball to influence the direction of play, 20 it negated the difficulty of navigating multiple turnovers in a very short period of time and eliminated events where a player touched a ball but did not retain possession. Any period less than Three seconds was discarded from the analysis for these reasons. Possession continued until a foul was given that was not followed by a quick self pass, the opposition regained the ball or the ball was played off the pitch. If a team lost possession through playing the ball over the side or end line, possession restarted when the opposition team moved the ball for the first-time once play had restarted. Possession was allocated during corners unless the ball stayed in play post attempt.
The Sportscode event was exported in CSV format and imported directly into the STATSports Apex Pro Series (Newry, NI) GPS software to create drills for each player. Drills within the Apex Pro Series software allow for the calculation of physical output relative to the time period calculated from the start and end time of a match event. The coded events were based on team possession status and the time stamp for the start and end of possession was utilised as the start and end time for each drill. These drills were imported for players who were on the pitch for these periods and if a rotation occurred during these periods i.e., the player left the field or joined the field, the drill was adjusted to match these on-field periods. The physical output data generated relative to each event code was exported to a bespoke CSV file for further analysis.
Participants
Twenty-four international hockey players, from an international hockey team (age = 26 ± 4, max aerobic speed = 4.85 ± 0.23 m.s−1 – determined from a set distance time trial) participated in this study. All players participating in this investigation had >10 caps (range 12-290 caps) and all were eligible for this study due to their ongoing participation in an elite international hockey team. All players were available for selection and injury-free having completed a full club season, a period of rest and a prolonged international preparatory period which included three tournaments (eleven matches) and several training camps. All participants provided informed consent and the data collected formed part of the national team’s normal performance analysis process. 29
GPS analysis
All players wore a STATSports Apex 10HZ GPS/GNSS unit during the investigatory period (STATSport, Newry NI, Firmware 2.50). All units were activated twenty minutes before use to achieve satellite locking, with the horizontal dilution of precision as 0.67 ± 0.09 and a high number of satellites present 21.5 ± 0.8, which is in line with previous research. 30 Units were placed in a neoprene vest, with the unit located in the mid-thoracic area between the scapulae, with all players utilising the same unit throughout the investigated period to reduce variability. Data from each unit was downloaded post-match using the STATSports Apex Pro Series software, with the reliability and validity of this technology has previously been reported with a high level of utility in a team sport setting, 30 as well as excellent inter and intra unit reliability. 31
GPS metrics
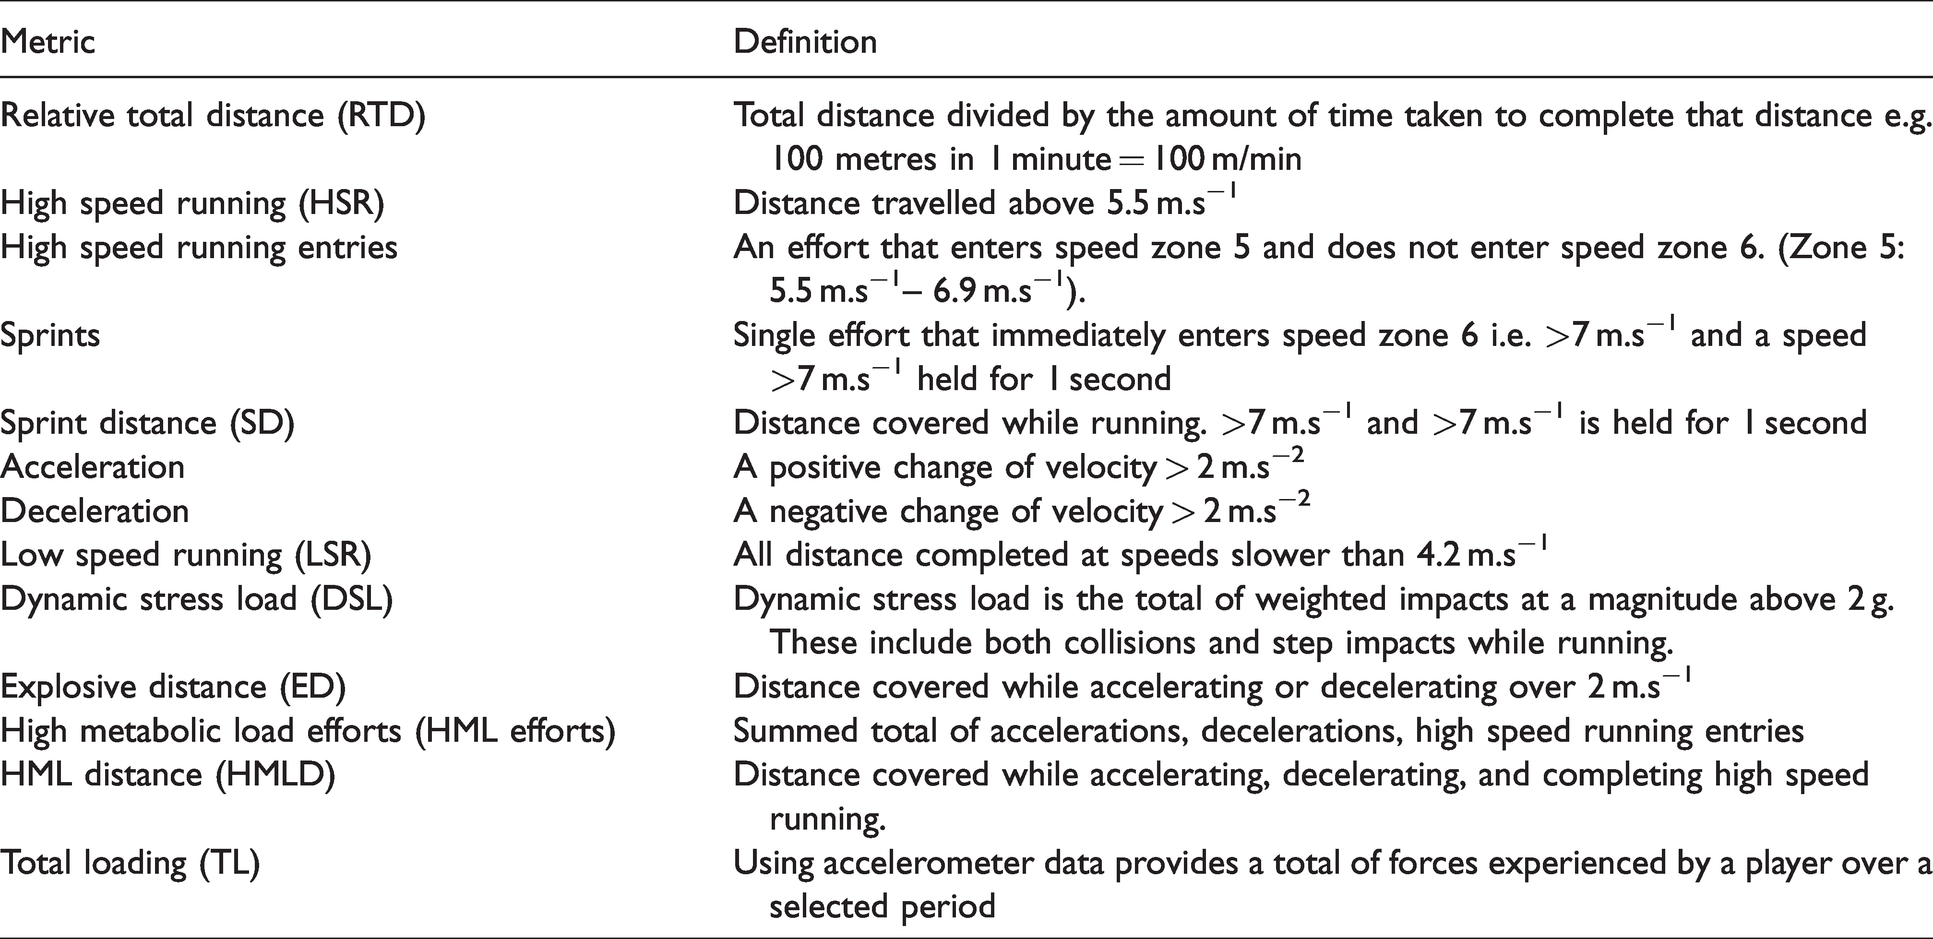
The movement patterns of players were recorded for total time on the pitch, total distance covered, max speed and distance relative to arbitrary speed zones. Using a player’s instantaneous speed, external training load was recorded in meters accumulated between 6 arbitrary speed zones – <1.49 m.s−1, 1.50–2.99 m.s−1, 3.0–4.19 m.s−1, 4.20–5.49 m.s−1, 5.50–7 m.s−1 and >7. This approach was deemed suitable given the proximity to other zones utilised in hockey research 32 and the limited consensus on the optimal approach to determine speed zones. Absolute thresholds, as opposed to player dependent thresholds, have been also been recommended for investigations with a performance analysis focus such as this one. 33 The zones represented 16 ± 1%, 32 ± 1%, 45 ± 2%, 59 ± 2% and 76 ± 3% of the player's max speeds. The max speed of each player was determined from a 40 m sprint test. Other metrics investigated can be found in Table 1. All data were normalised to distance or number of actions per minute to account for playing time. The data used in this investigation relates to “ball-in-play time” with all time associated with game stoppages for goals, short corners, injuries and time spent on the bench removed. 34
Definitions of the GPS metrics utilised throughout the investigation.
Statistical analysis
Differences in physical output between each possession category and the possession category relative to match result were investigated utilising Linear Mixed Models (LMMs). A LMM was utilized to overcome the correlation effects of repeated measures within each player and also due to the flexibility that this method has in accounting for the altering sample sizes between groups. 35
Several iterative models were constructed to identify the optimal model. Random effects included repeated measures of the player within tournaments. If the addition of a random effect did not improve Akaike’s information criterion (AIC) it was removed from the analysis process. 36 Two main analyses were of interest, (i) to ascertain the differences between possession categories and (ii) the relationship between physical output during possession categories relative to the match result. Thus, the fixed effects and their interactions in each model included position (defender, outside back, midfielder and forward) and possession status (in and not in possession) for model one. Of particular interest was the interaction effect, which if significant would indicate that the relationship between possession and output differed by playing position. For model two, position and physical output delineated by possession status were retained with match result added. This was to enable an identification if an interaction existed between physical output delineated by position and possession status and match result.
In all models, random intercepts for a player and tournament were generated to allow for the uniqueness of individuals, and the characteristics of each tournament. Attempts to model random slopes resulted in overfitting of models and was therefore discarded from the analysis. All models estimated parameters using the restricted maximum likelihood method. 37 Potential fixed effects (Position, Possession Status and Match Result) were added sequentially to the model with iterations of the model compared to one another and tested for best fit (R2). Likelihood ratio tests were completed on the iterative models utilising the ANOVA function in R statistical programming software to identify if models were statistically different from one another. Marginal and conditional R2 were assessed 38 for each model with both AIC and R2 informing model choice. LMM were constructed for each of the dependent variables (Table 1).
The LMM’s were computed in R statistical programming software, using the package lme4. 39 Model performance was tested utilising the ‘performance’ package with checks for collinearity, heteroscedasticity, overdispersion and zero-inflation completed. 40 Statistical significance was accepted where p < 0.05. Post-hoc pairwise comparisons were carried out where appropriate to compare performance output (a) in and not in possession for each playing position and (b) between physical output during possession categories dependent on win/lose/draw match outcomes, using Bonferroni adjustment. 41 Mean differences and the respective standard error (SE) of measurement were reported between groups. Effect sizes (ES) for significant differences were also determined using Cohens D. Effect size values of ≥0.20, ≥0.60, ≥1.20 and >2 were considered to represent small, moderate, large and very large differences, respectively. 42
Results
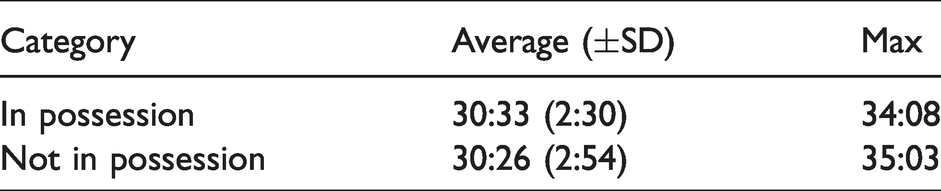
Descriptive data is available in Tables 2 and 3 for time spent in and not in possession in a match and the duration of each possession event. There was no statistical difference identified for total time spent in or not in possession between match results (p > 0.05). Possession status had a main effect on RTD, ED, HSR, HSR Entries, HMLD, HML efforts, accelerations, decelerations, LSR, TL and DSL with greater amounts of output completed by outside backs, defenders and midfielders when not in possession during match play (p < 0.001). Significant interaction effects were found between Possession Status*Position across several metrics including RTD, ED, HSR, HSR Entries, HMLD and HML efforts (p < 0.001), demonstrating that a relationship exists between the physical output completed by each position and the team’s possession status during match play. Estimated marginal means can be found in Table 4 for each category and position.
Average, standard deviation and max duration of time spent in each possession category per match in minutes and seconds.
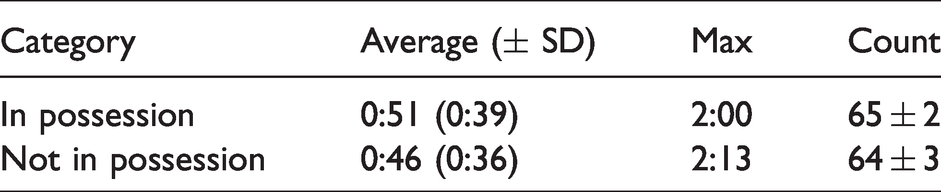
Average, standard deviation and max duration of each possession instance categorised by possession category in seconds. Count of instances of both categories of possession per match.
Estimated marginal means for in and not in possession by metric and position with 95% confidence intervals. all reported in m/min format.
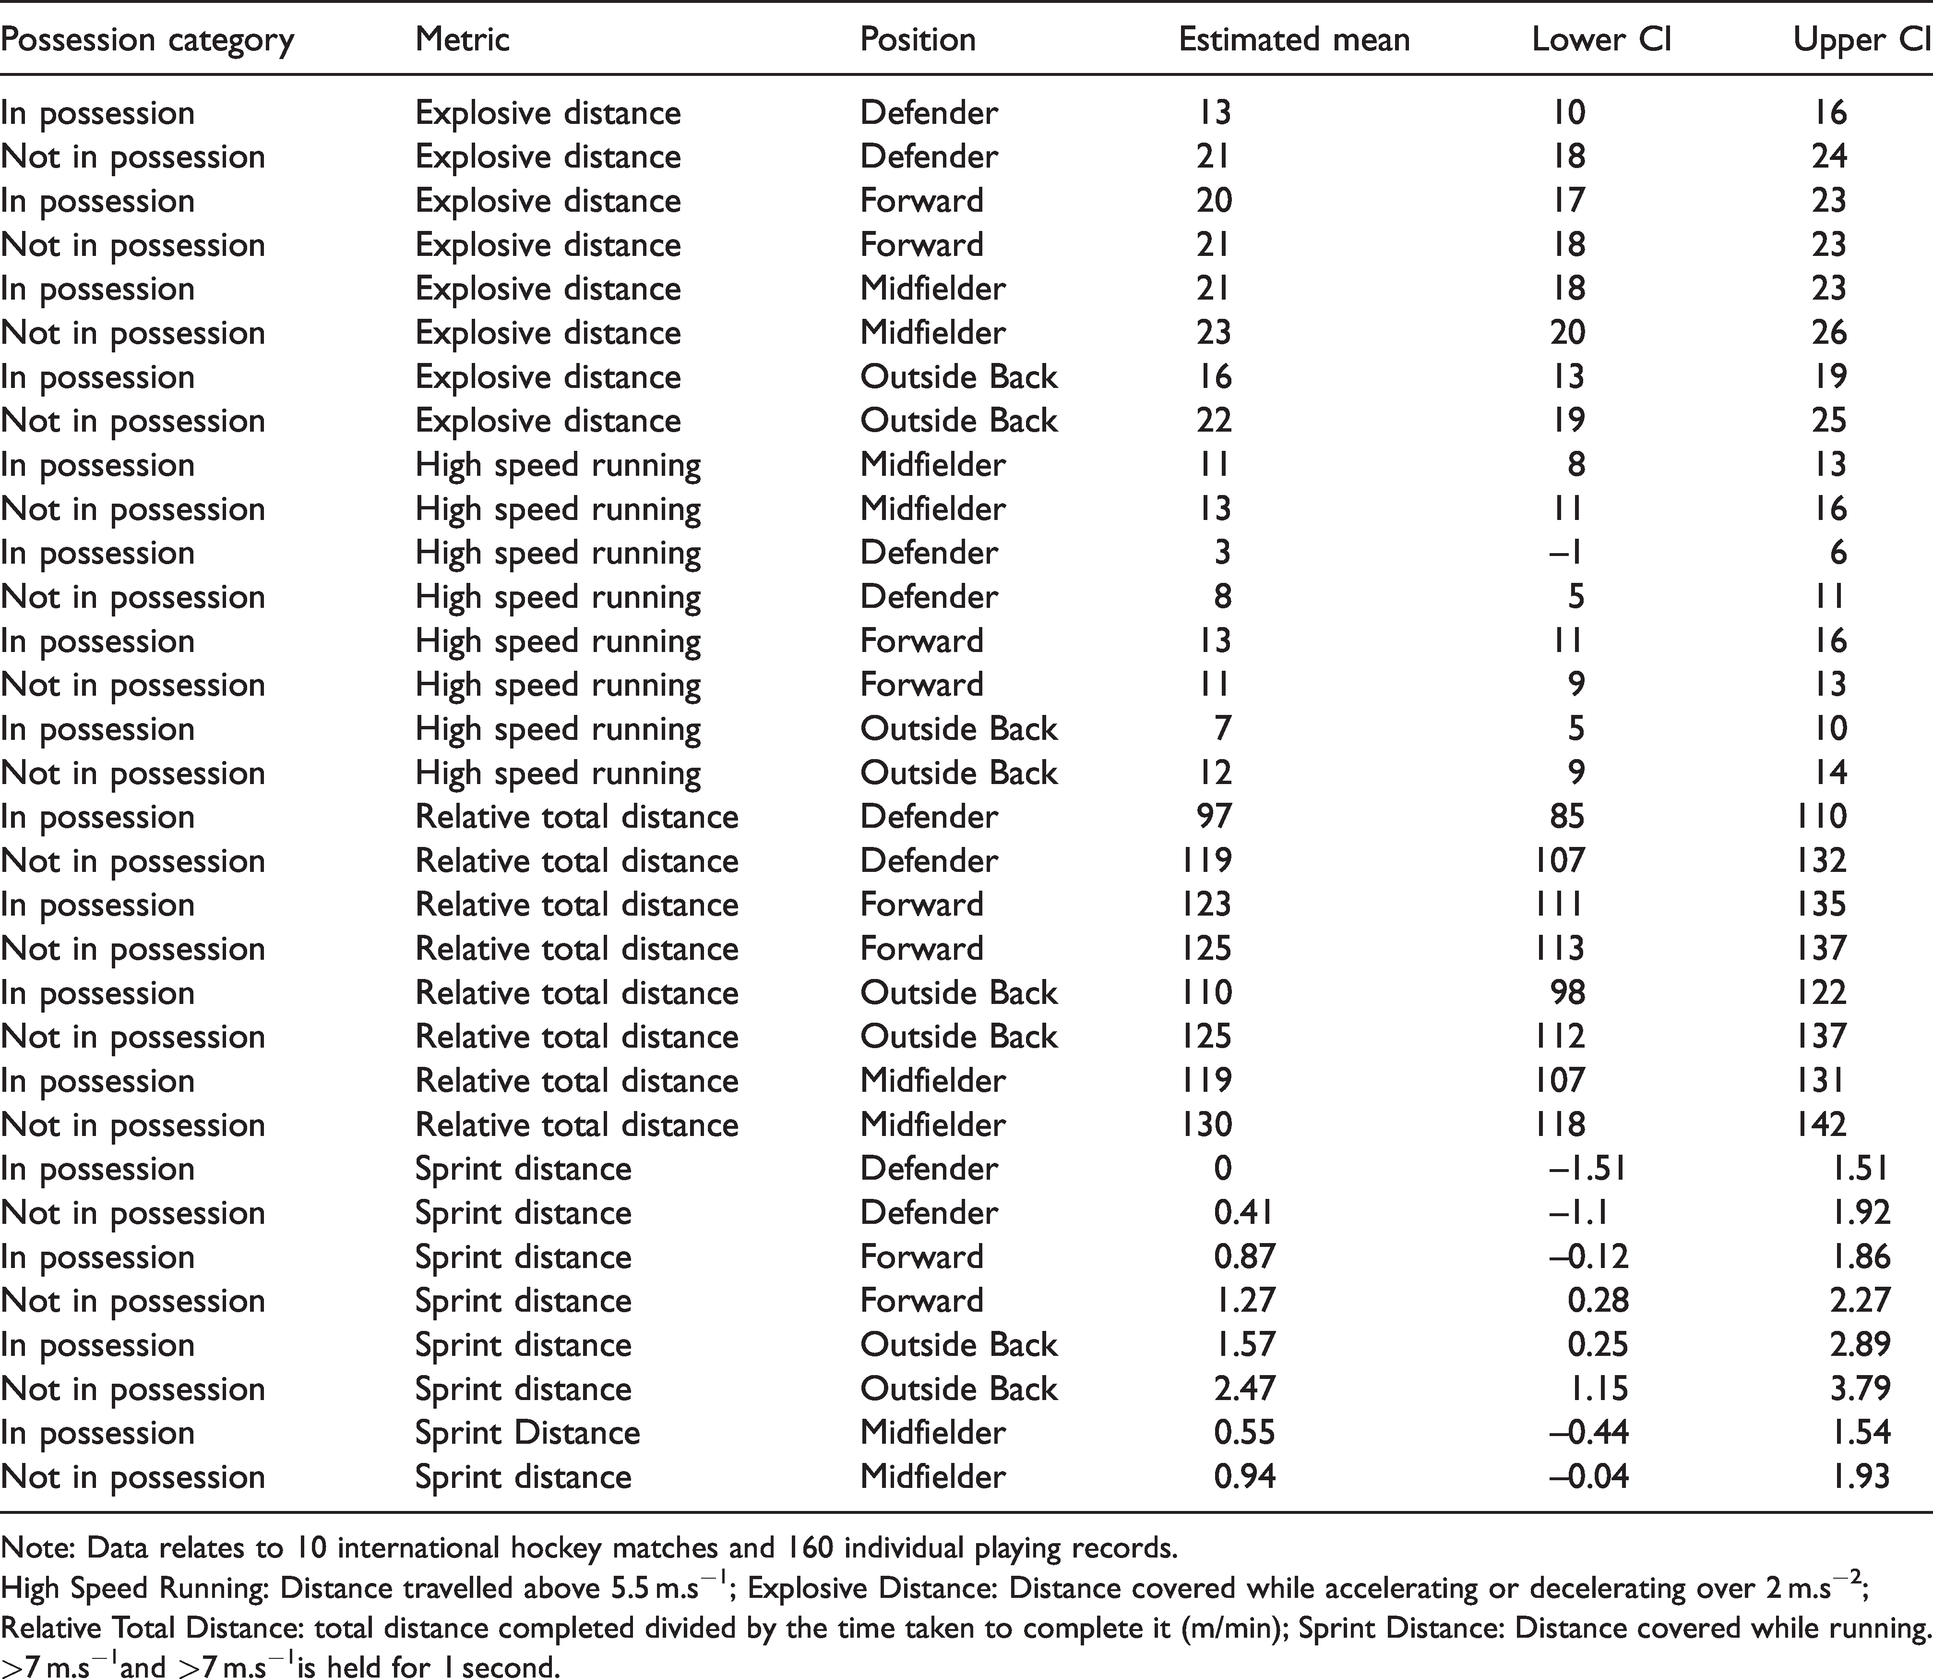
Note: Data relates to 10 international hockey matches and 160 individual playing records.
High Speed Running: Distance travelled above 5.5 m.s−1; Explosive Distance: Distance covered while accelerating or decelerating over 2 m.s−2; Relative Total Distance: total distance completed divided by the time taken to complete it (m/min); Sprint Distance: Distance covered while running. >7 m.s−1and >7 m.s−1is held for 1 second.
A summary of differences identified per position and possession status can be found in Table 5, Figures 1 and 2. There was no significant difference identified for sprint distance (p = 0.930) and efforts (p = 0.700) within positions relative to possession status. Forwards displayed no significant difference in physical output between possession categories for the metrics of RTD, HSR Entries, HMLD, HML efforts, ED, DSL and accelerations (p > 0.05). When compared to not in possession instances, in possession instances elicited lower output for defenders, outside backs and midfielders across several metrics, yet this finding was not present for forwards. Defenders, outside backs and midfielders, produced (small to moderate ES) lower RTD, ED, HSR, HMLD, HSR distance as well as (small ES) acceleration, (small ES) deceleration and (Moderate to Small ES) HSR entries (see Table 5) This culminated in lower DSL (small to moderate ES) and TL (small ES) accumulated during in possession instances.
Summary of estimated differences in physical output between in possession and not in possession categories by position (standard error) and effect sizes (ES) – metrics are presented in per minute format.
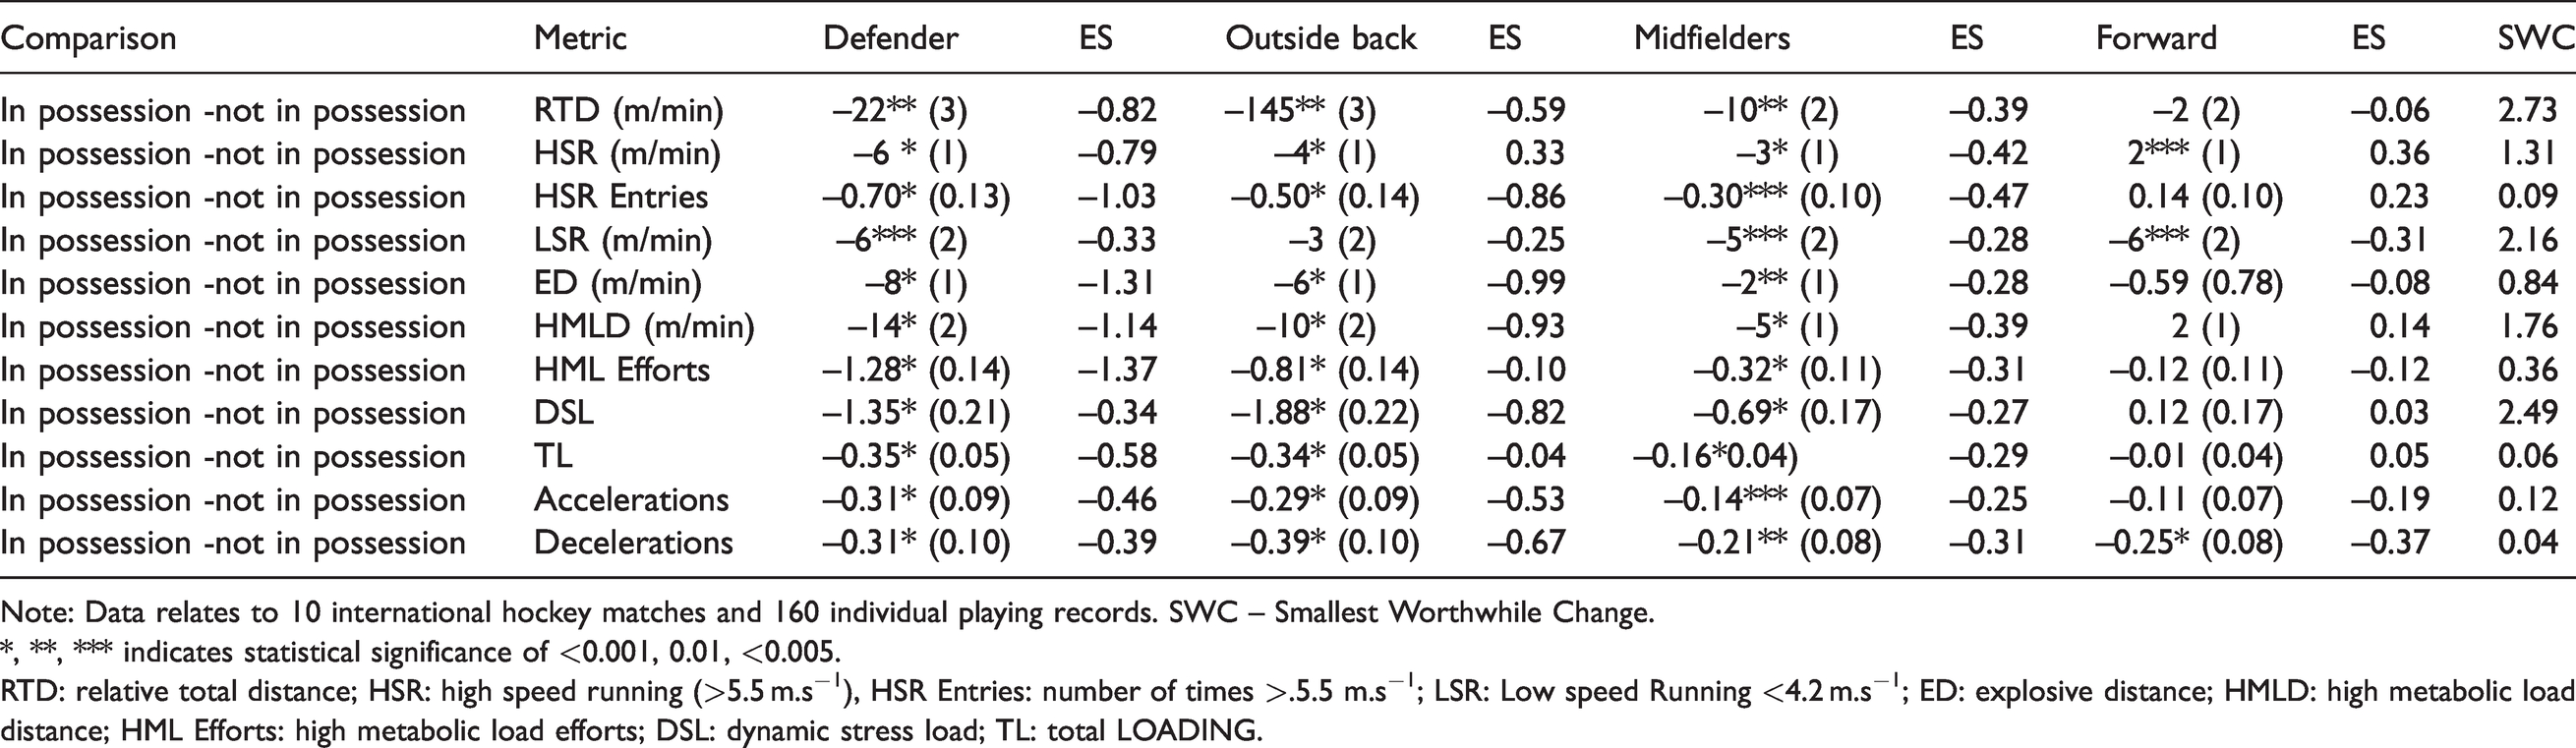
Note: Data relates to 10 international hockey matches and 160 individual playing records. SWC – Smallest Worthwhile Change.
*, **, *** indicates statistical significance of <0.001, 0.01, <0.005.
RTD: relative total distance; HSR: high speed running (>5.5 m.s−1), HSR Entries: number of times >.5.5 m.s−1; LSR: Low speed Running <4.2 m.s−1; ED: explosive distance; HMLD: high metabolic load distance; HML Efforts: high metabolic load efforts; DSL: dynamic stress load; TL: total LOADING.
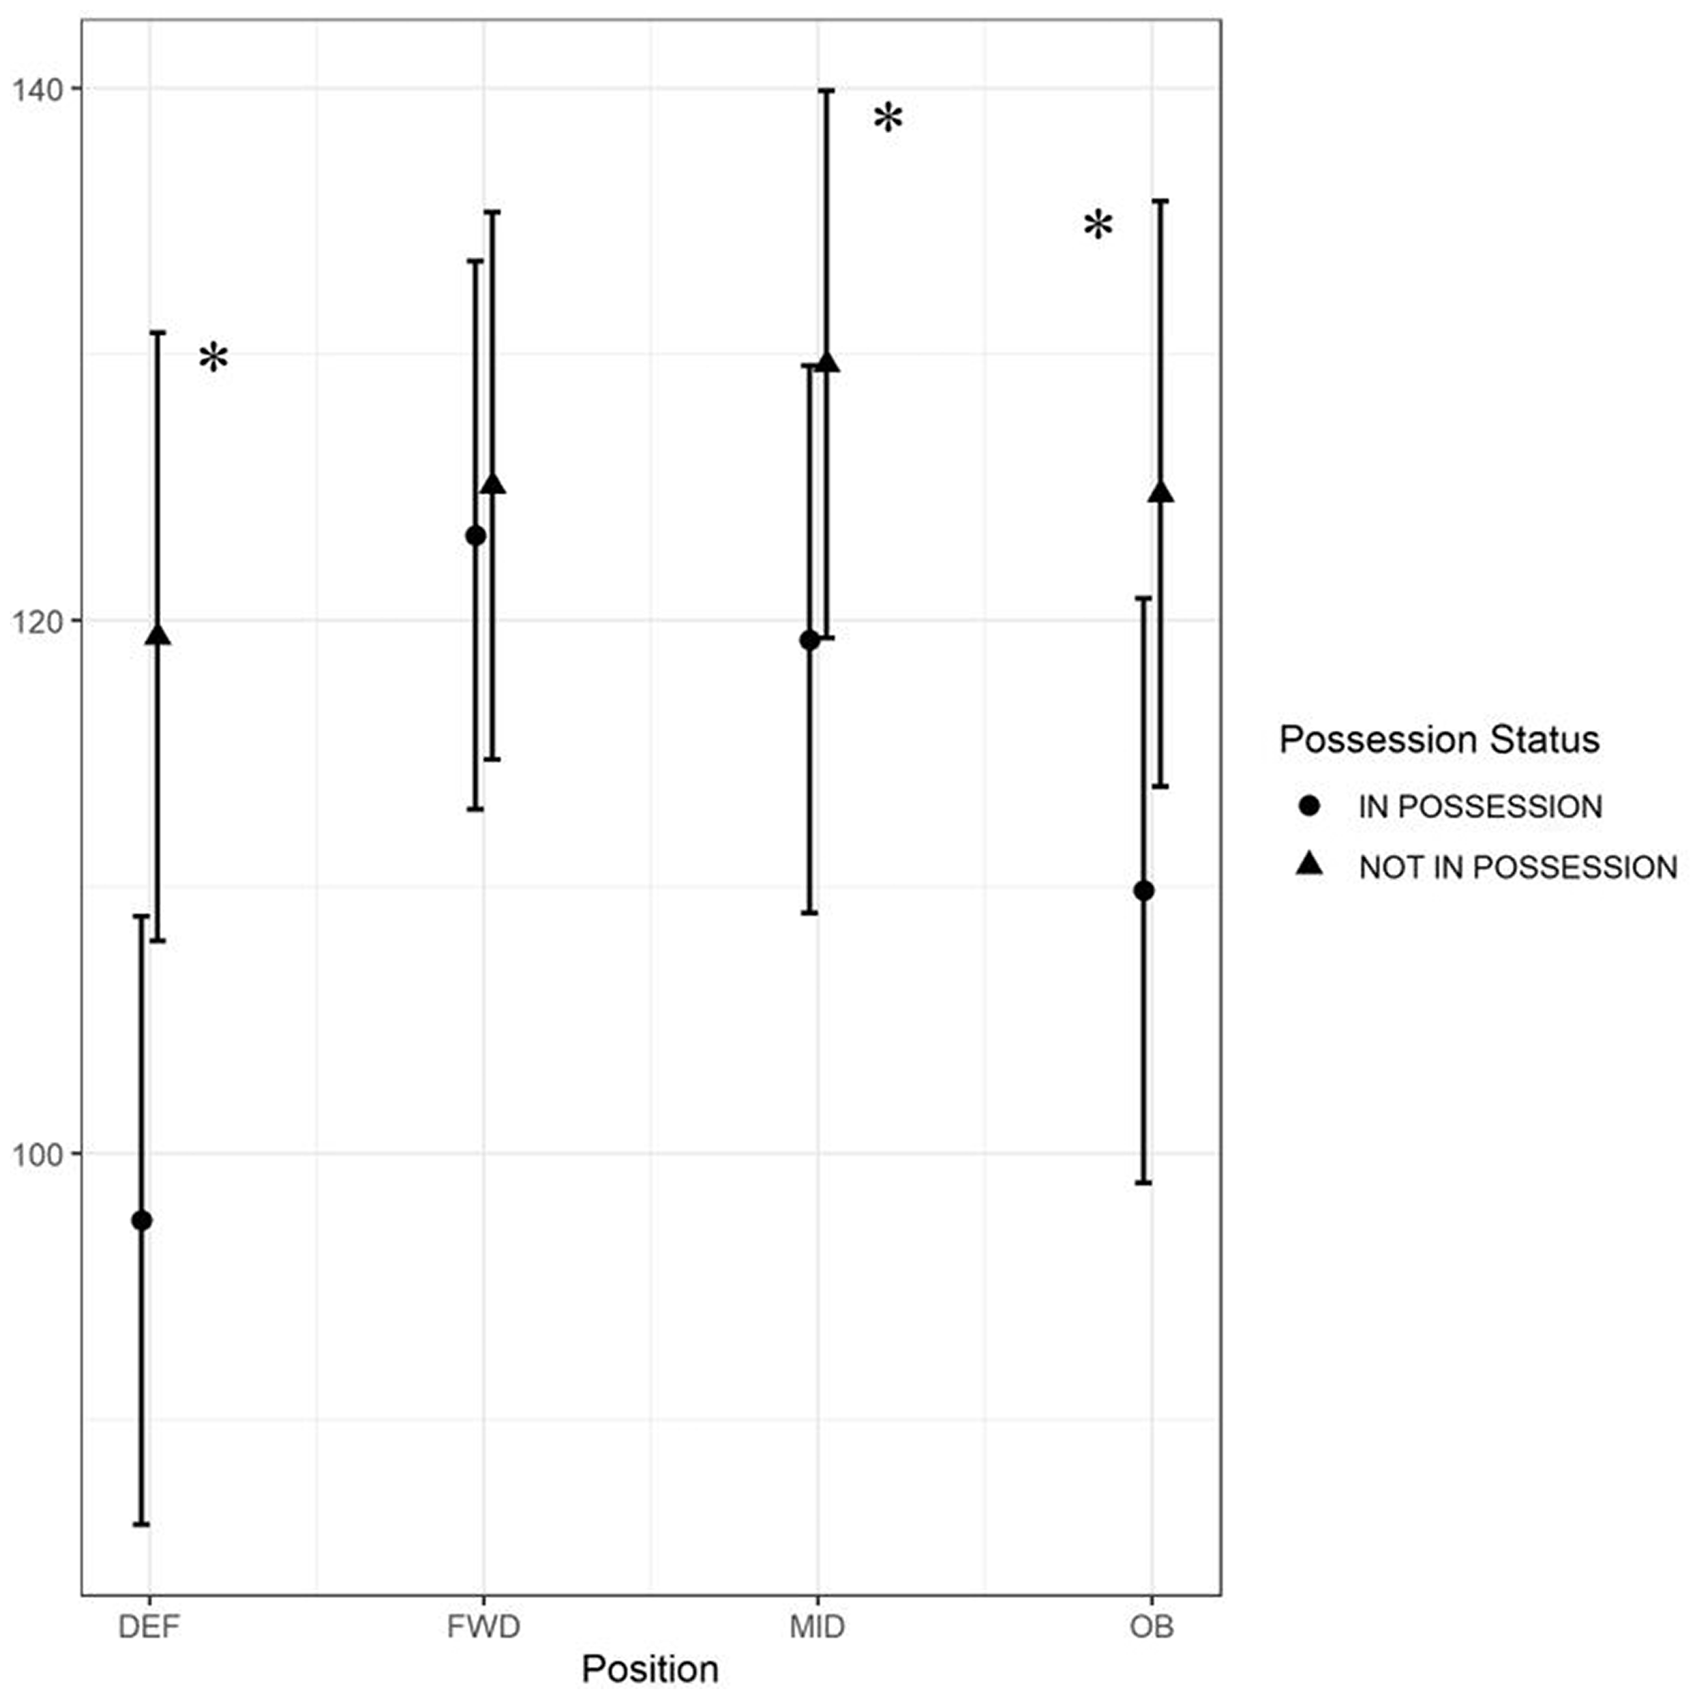
Relative Total Distance (m/min) by Position and Possession category. *indicates statistically significantly different (p ≤ 0.05).
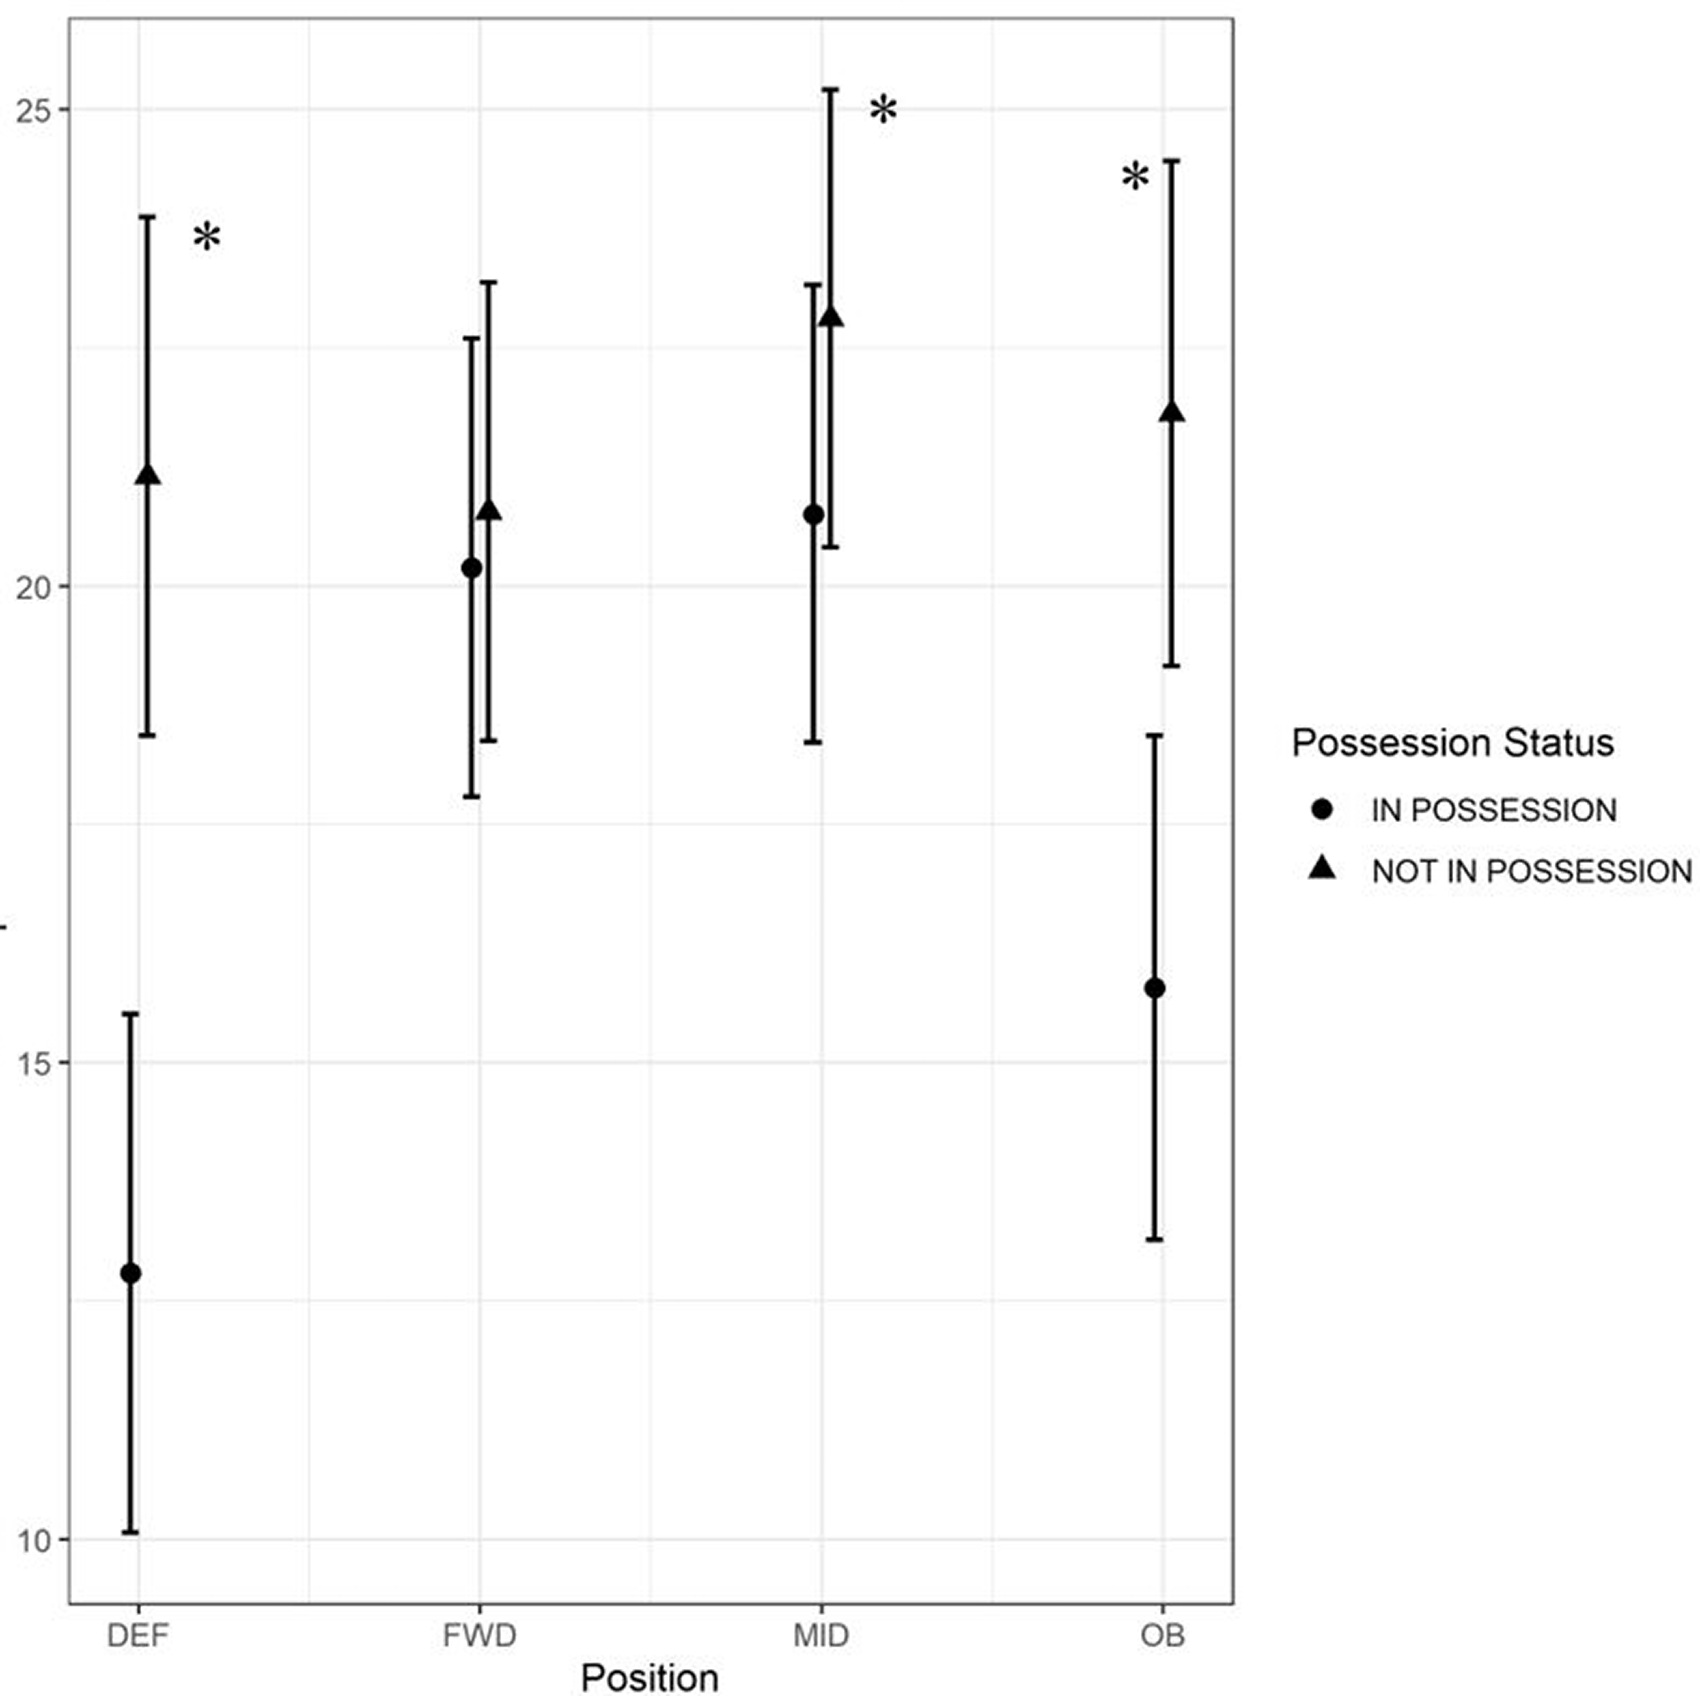
Explosive Distance (m/min) by Position and Possession category. * indicates statistically significantly different (p ≤ 0.05).
When physical output data was segmented into both in possession and not in possession instances and grouped by the match result, no significant differences existed between the physical output of players during in possession instances in matches which were won, drawn, or lost (p > 0.05). No significant differences were identified between the physical output of players during not in possession instances dependent on the match result (p > 0.05).
Discussion
The primary aims of this investigation were, (i) to describe the physical output of hockey players relative to possession status and position of play and (ii) to identify the differences that exist in the players’ physical output during each possession category in respect of match result. This study shows for the first time that not in possession instances were more physically demanding than in possession instances for defenders, outside backs and midfielders. For not in possession instances, RTD and HSR was, on average, 13% and 41% higher compared to in possession instances. Furthermore, there was no statistical difference in physical output for any position during each possession category relative to the match result.
The lower outputs noted when in possession of the ball for several metrics, across three positions, may indicate a lower intensity playing style, a more rigid ‘in possession’ tactical structure or periods of controlling the speed of the match for tactical reasons. Forwards do not display these findings with output similar in both categories apart from HSR. This may be due to several reasons, for instance, not in possession, the team in question may have adopted two strategies, one being a high press and the other being low block. Both not in possession systems may be equally demanding for forwards, as they are the front-line players in both systems, however, both systems may present a different type of physical challenge for forwards as different tactical systems have been shown to elicit statistically significant differences in terms of energy expenditure and heart rate demand for players. 25 Further exploration of not in possession physical output segmented by the style of pressing and phase of play, may be warranted to truly understand the demands of not in possession instances in hockey.
In possession, the team’s goal is ultimately for players to receive the ball in the circle and score. 43 To achieve this the team must create space through the manipulation of the oppositions tactical shape. 44 Given the lower physical output of the team, when in possession, this may highlight that the advancement of possession is methodical and controlled and does not rely on moving the ball quickly towards the opposition goal. This approach may create long periods where the forwards are constantly changing their position on the pitch, over large distances, to create opportunities to receive the ball in advantageous positions. This may explain why forwards, in the current investigation, completed greater HSR when in possession compared to not in possession instances. In comparison to other positional groups, forwards are afforded limited time for ‘pacing’, when their team has the ball. Forwards, therefore, require well developed aerobic fitness to enable prolonged output without physical and technical fatigue 45 , 46 as increased aerobic capacity has been linked with an increased ability to produce HSR in team sports as well as increased RTD and HSR in another sport with multiple rotations and high relative intensity. 47 , 48 Combined with the finding of forwards completing similar HSR Entries and accelerations in both possession categories, it is evident that forwards require well developed physical qualities to carry out their distinct pattern of physical output. It may also highlight the requirement for specific strategies for in-match rotations for this position given the constant demand placed on their physical capacities. 46 , 49
Not in possession instances elicit higher relative output across a broad spectrum of metrics for defenders, outside backs and midfielders due to the constraints of the sport and the tactical system utilised by the team investigated (Table 4). A man to man marking approach is often utilised in international hockey, and the investigated team, whereby defenders, outside backs and midfielders, track a member of the opposition and therein their physical output is responsive to the opposition players' output. Additionally, not in possession, players are required to cover large areas of the pitch because they are tasked with marking players, who reposition frequently as their main aim is to utilize the offensive space by increasing the surface area over which their team is spread. 50 , 51 Konarski et al. 25 has established that a man to man marking system has a higher physical demand than a zonal system – this high output not in possession defensive playing style may cause an element of pacing for these players to occur during in possession instances. Additionally, they may also have to reposition to there in possession structure having been potentially altered by tracking opposition players.
Understanding that not in possession instances are physically more demanding for outside backs, defenders and forwards is useful information for sports scientists and physical preparation staff attached to teams. It is worth considering particularly in relation to rotation strategy. Typically, in hockey, rotations are pre planned on a strict schedule, however, with the knowledge gained from this investigation it is worth considering that if the opposition secures possession for an extended period of time that this schedule may need to be adapted to deal with the increased physical output demanded. It also may inform the pre planning of rotations particularly if competing against a team that tends to gain a high percentage of ball possession. This is particularly relevant as it has been shown that more frequent rotations prevent a decline in physical and technical performance in hockey. 46
When physical output was delineated by possession status and match result, no clear differences were identified. There is no relationship identified between a teams ‘in possession’ or ‘not in possession’ physical output and match result (Table 6). Physical output was relatively similar across match results for both ‘in possession’ and ‘not in possession’ instances. This may be due to the relatively short periods of possession within hockey (Table 3) and that other factors such as player spacing 52 and technical ability may play a larger role in match outcome. In contrast, a clear pattern exists in the Australian Football League – a physically demanding, contact based sport with similar relative physical output to hockey. 53 When comparing wins to losses, the time spent with possession when running at speeds > 3.88 m.s−1 was significantly lower in wins, whilst the time running at speeds <3.88 m.s−1 was significantly higher in wins, across both games and quarters. 53 This pattern may not exist in hockey because this sport is played on a smaller pitch and less physical contact is required compared to Australian Football, therefore, the match result may be more reliant on technical and tactical than physical performance. This is emphasized by the findings of McInerney et al. 52 who reported that in attacking phases, “39% of circle entries occurred when the possessing player was within 15 m of the goal line with more opponents than teammates in his or her region, at the moment of the outcome” and that a smaller distance between the teams leftmost and rightmost player increased the chance of a circle entry.
Estimated marginal means and standard error of measurement per match result, per possession category, per position for several metrics. No statistically significant differences were noted for comparisons. All p values >0.05. All metrics are reported in m/min format.
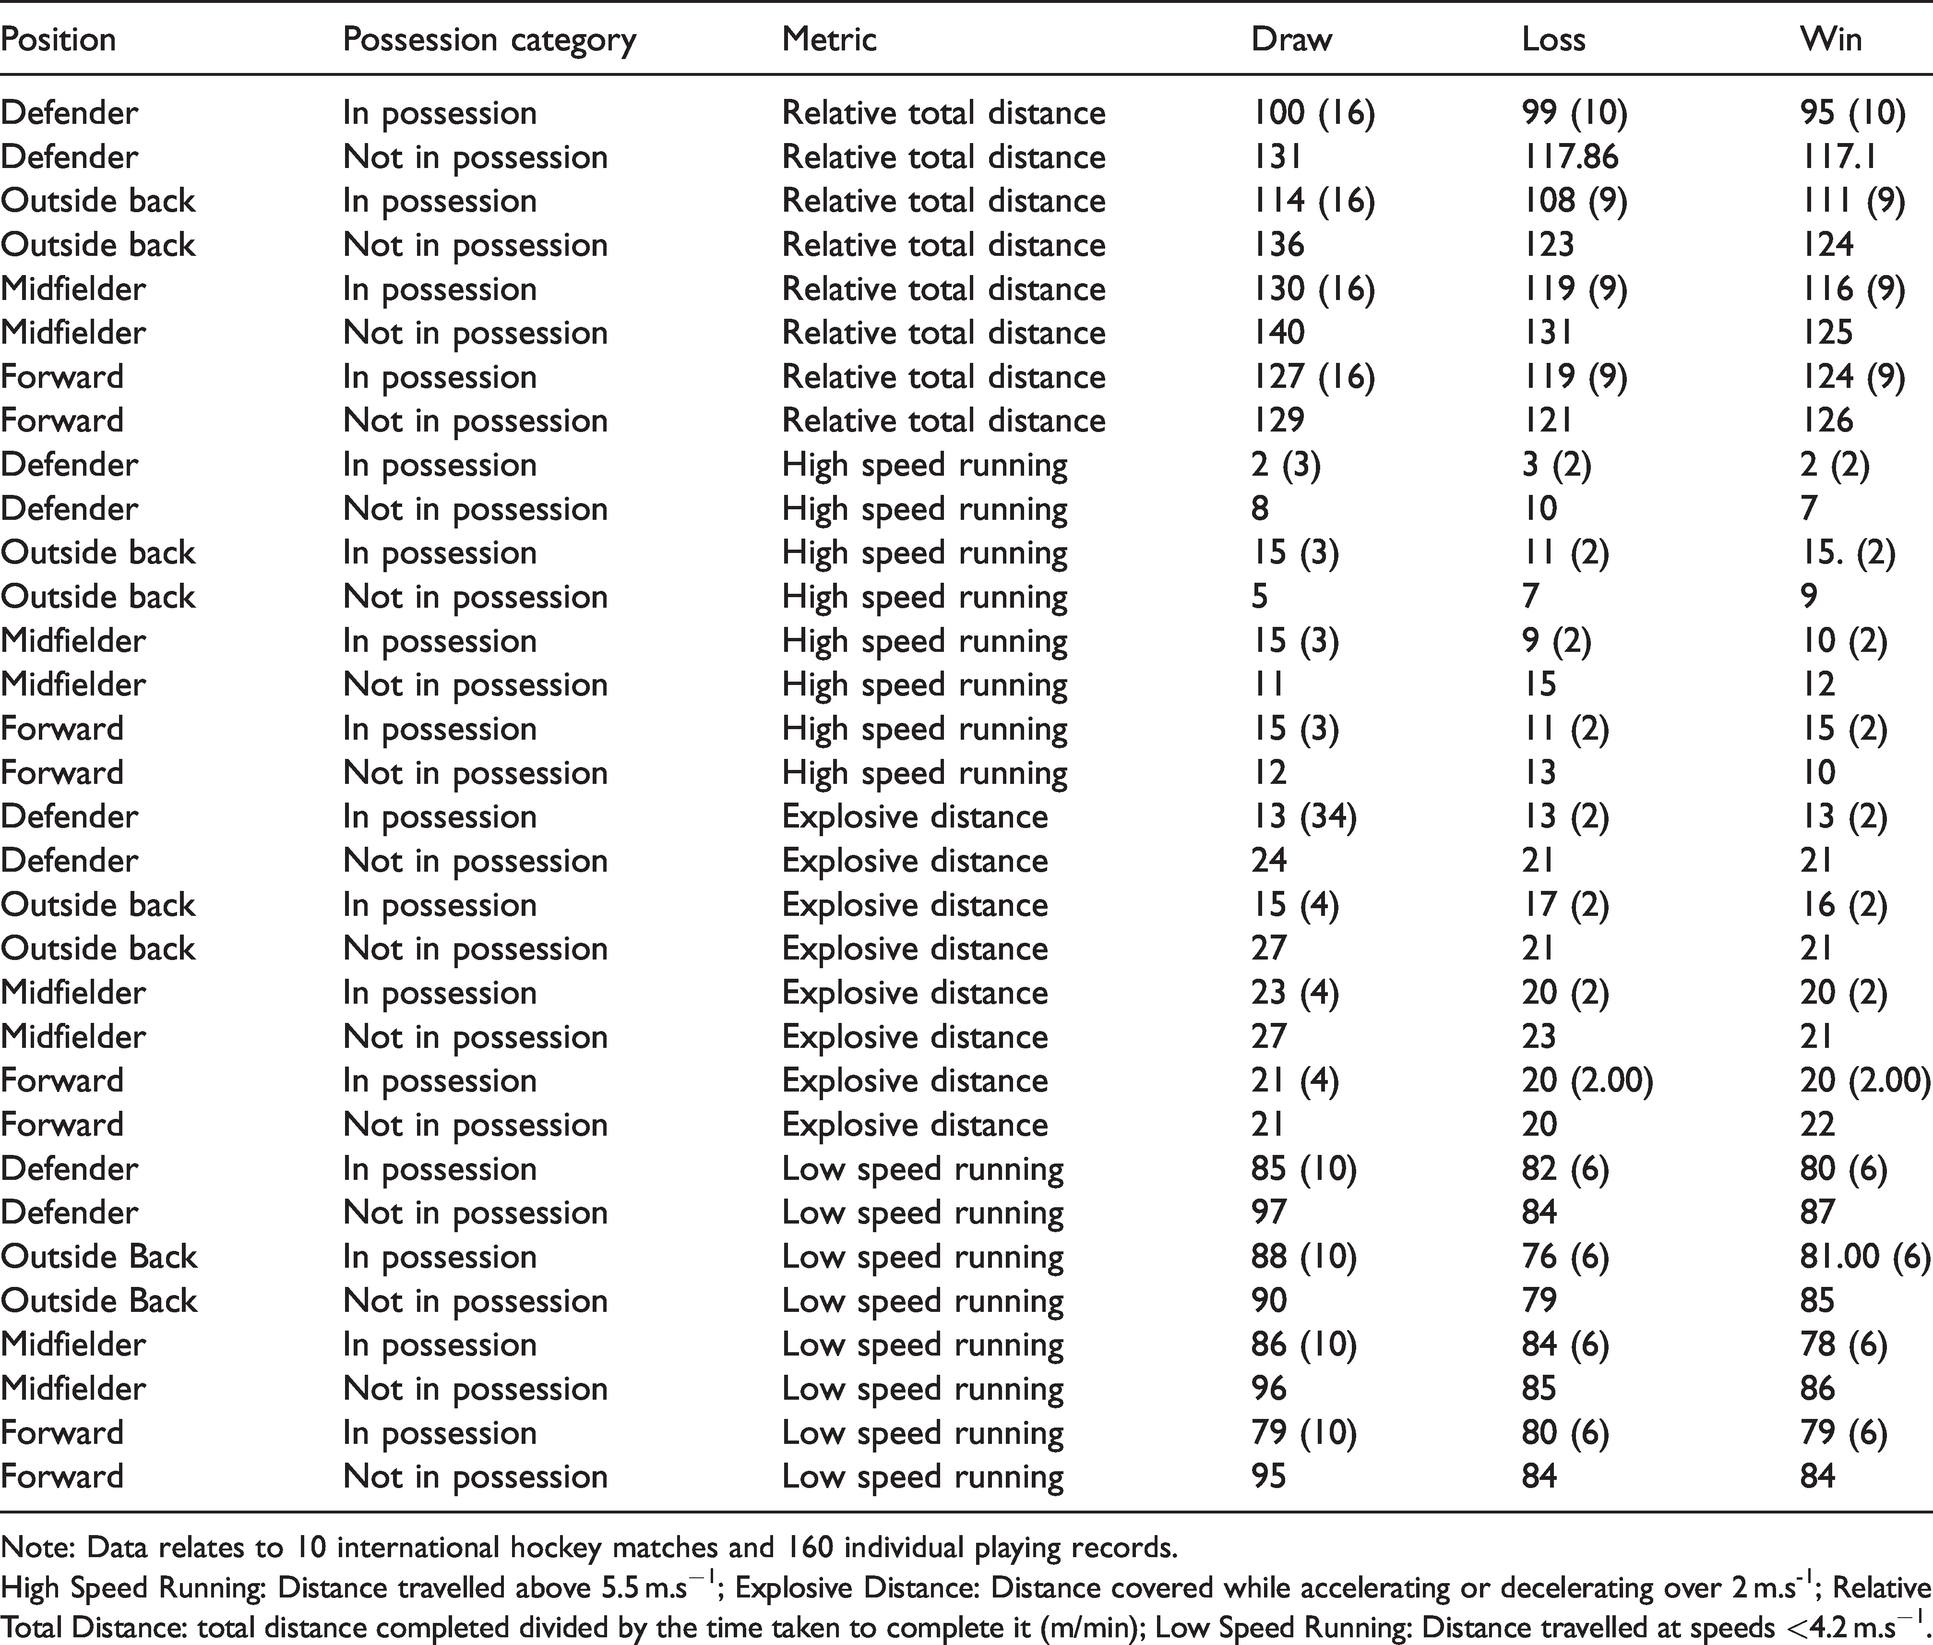
Note: Data relates to 10 international hockey matches and 160 individual playing records.
High Speed Running: Distance travelled above 5.5 m.s−1; Explosive Distance: Distance covered while accelerating or decelerating over 2 m.s-1; Relative Total Distance: total distance completed divided by the time taken to complete it (m/min); Low Speed Running: Distance travelled at speeds <4.2 m.s−1.
Furthermore, the lack of differences between physical output while in possession or not in possession by the match result identified in the present investigation, is potentially influenced by the cumulative effect of each of the four quarters of hockey and the fluctuation of the scoreline throughout match play. A similar approach to that of Gronow et al., 53 where the match is further segmented into a quarter by quarter analysis, may be required to identify differences between physical output while in possession or not in possession. Finally, further context may be required to identify an interaction between possession, physical output and match result with research identifying successful teams, in soccer, displayed longer duration possession instances, typically in a central attacking zone, compared to, unsuccessful teams who had shorter duration possession instances in their own half of the pitch. 54
This study presents two main limitations. First, only one hockey team was investigated. While other sports have been able to investigate similar parameters across multiple teams and leagues due to the widescale availability of data 24 , 55 , 56 this is not currently possible within international hockey due to the variability present in the type of physical output tracking devices utilised by different teams and the variability in the collection of match event data, as there is no overarching international data provider for the sport. The second limitation is the sample size of 10 matches, which could explain the non-significant interaction with match result. In particular, there is a limited amount of drawn matches within the sample. A justification for this is only competitive non-friendly matches were considered. Authors explain this decision because coaches tend to include players, during friendly matches in hockey, who are being trialed at an international level or that have limited play time during the season, and therefore, the physical metrics recorded during these games do not represent the true demands of the official game. This international team also changed head coach 3 times in a relatively short period of time, with differences noted in their playing style which would have introduced further variance into the data. While a limited number of matches were utilised, the focus was on possession instances with an average of 65 and 64 in and not in possession instances analyzed per match for full squad of players, culminating in over 5000 individual instances analyzed for both in and not in possession.
In conclusion, possession status has a large impact on the physical output of hockey players. Not in possession instances elicit higher output across a broad spectrum of metrics. This is true for defenders, outside backs and midfielders. Forwards produce a consistent level of output irrespective of possession status which highlights the need for well-developed physical qualities. There is no difference between physical output within each possession category dependent on the match result. These findings provide parameters for the analysis of full match physical output data. In particular, the understanding of what has occurred in the match and its link to match physical output will allow practitioners to better understand some of the variance present in the metrics as well as the reason for the existence of differences in output among positions.
Footnotes
Declaration of Conflicting Interests
The author(s) declared no potential conflicts of interest with respect to the research, authorship, and/or publication of this article.
Funding
The author(s) disclosed receipt of the following financial support for the research, authorship, and/or publication of this article: Enterprise Partnersip scholarship between Hockey Ireland, the Irish Research Council and Eoin Cunniffe.