
Abstract
Purpose
Monitoring maturation facilitates effective talent development. Various methods of maturity estimation exist with limited knowledge of concordance between methods. This study aims to establish agreement between methods of varied constructs to predict maturity status and compare concordance of methods to categorise players using established thresholds.
Methods
This study compared four maturity equations using anthropometrical data from 113 male adolescent soccer players (mean ±SD; age, 14.3 ± 1 years) from two academies. Conservative (±1 year) and less conservative (±0.5 years) circa-PHV thresholds were employed.
Results
Analysis indicates tight (±0.3 year) agreement between maturity offset methods (MO), but broader agreement between MO and predicted adult height methods (–1.5 to 1 year). However, Kappa Cohen k suggests moderate to substantial (44%–67%) and fair to moderate (31%–60%) concordance between methods when using the conservative and less conservative circa-PHV thresholds respectively.
Conclusion
Despite MO equation iterations claiming to reduce systematic error, they provide very similar estimations. Additionally, practitioners should not use maturity offset and predicted adult height methods interchangeably and are encouraged to apply either method consistently when looking to estimate maturity status or biologically calssify players.
Keywords
Introduction
The holistic and systematic identification and development of the physiological, psychosocial and/or biomechanical attributes that contribute to success, are a primary focus for team sport practitioners. 1 These attributes are often determined through observation and/or assessment of ‘elite’ adult athletes, but talent development studies highlight speed, endurance and decision making as prominent attributes.2,3 Subsequently, youth athletes demonstrating these attributes are identified, recruited and promoted towards excellence. However, development trajectories are complicated when adolescents experience the non-linear, inter-individual variations in tempo and timing of development throughout maturation. 4 Towlson et al. 5 reported staggered asynchronous development trajectories of physical and performance characteristics that were exposed to dynamic temporal changes across peak height velocity (PHV). Maturation varies substantially within chronological age-groups, particularly around PHV, with large variations in physical characteristics such as body mass (∼50%), stature (∼29 cm), percentage of predicted adult height (PAH: 10%–15%) and fat free mass (3–8.6 kg) not uncommon.6,7 This level of diversity in maturity, even within relatively homogenous groups, creates uncertainty surrounding relative talent and future potential in young athletes, therefore confounding talent development processes.
Professionalisation of the academy system 8 now requires monitoring and evaluation of maturation to inform individual talent development decisions. 4 Skeletal age is a ‘clinical’ method of assessing maturity status, but is regarded as impractical within academy soccer. 9 As a result, surrogate ‘non-invasive’ somatic equations to estimate maturity status using anthropometric proportionality differences alongside longitudinal growth data are now common.9–12 These methods offer an indication of biological age either by predicting the age of PHV onset, while informing on the proximity of this in time (years) in the form of a maturity offset (MO), or estimate current percentage of adult height (PAH%). 10 If standardised and routinely assessed, these methods can estimate both the timing and tempo of maturation and have been used with adolescent team sports players previously.13,5,14
Each method has received critical review surrounding their ecological validity (see Mills et al. 15 for a detailed appraisal). The original offset equation 16 was claimed to predict the timing of PHV to within 1-year 95% of the time which was applicable to individuals aged between 10 and 18 years Malina et al. 11 longitudinally applied this method to Polish boys in an attempt to re-validate the equation but identified a systematic discrepancy between predicted and observed PHV. The timing of PHV was underestimated at younger ages and overestimated in older age groups. This was also supported by Mills et al. 15 who added that the equation overestimated the timing of PHV when assessed immediately preceding PHV. Malina and Kozieł11 noted that the magnitude of error tended to be accentuated in early- and late-maturing males, both of which are of particular prevalence in youth sports programmes. Moore et al. 12 then attempted to simplify and externally validate the equation to cater for this overfitting, but still reported an increase in prediction error the further removed from PHV the individual is. A further iteration of this equation has since been validated with academy soccer players. 9 Authors claim that it appears to better account for the systematic error by adopting a polynomial model and estimating a maturity ratio to better reflect the non-linear growth process. However, subsequent critique by Nevill and Burton 17 outlined potential flaws in the equation and the increased likelihood of spurious findings due to chronological age appearing on both sides of the maturity ratio, with similar concerns over accuracy also reported by Teunissen et al. 18
A PAH% developed by Khamis and Roche10 is also widely used within adolescent soccer. 19 Utilising several of the same anthropometric variables and the addition of birth parent stature to ascertain mid-parent stature, the equation can predict the progress towards adult stature as a percentage. If measured accurately the equation is reported to predict the adult stature to within 2.2 and 5.3 cm for the 50th and 90th percentile respectively, although this error may increase to 2.8–7.2 cm when applied only to the age groups where it relates to the adolescent growth spurt (11–15 years). 20 Objectively measuring parent stature is logistically difficult and therefore equation often uses self-reported parent stature and should therefore be corrected for overestimation. 21 In some cases adolescent athletes are not in contact with one or both birth parents, or for whatever reason an accurate stature is not accessible. In such cases the equation suggests using mean national values for male and females, likely reducing the data fidelity via regression to the mean, particularly for those with birth parents with stature significantly different from the mean which may cause additional error.
Peak-height velocity has been suggested to coincide with increased risk and incidence of non-contact and training related injury in team sports22–24 which is concerning for practitioners. It is common within literature to di-, or tri-chotomise the maturation process into periods, often termed pre-, circa- or post-PHV to categorise individuals.14,25–27 In the applied setting, this categorisation may be utilised to implement maturity specific interventions, produce reports or inform talent (de)selection decisions. 4 Several studies have used such classifications to assess the impact of maturation on performance, such as speed, 25 neuromuscular performance 28 and aerobic endurance. 29 Due to error, typical bandwidth thresholds of ±1-year, or ±0.5-years have been utilised to determine whether individuals are pre-, circa- or post-PHV. Similar conservative (85%–96%) and less conservative thresholds (88%–93%) exist for PAH%, based on longitudinal data.4,30 Despite each method having this categorisation capacity, it is unclear as to the agreement between the various approaches, which potentially differs based on the nuances between estimation equations.
Validation of these methods have generally used large scale reference samples from mostly white-Caucasian, middle-class backgrounds, leading to questions surrounding the applicability of this to modern elite soccer environments. In addition, these methods are applied widely and almost interchangeably within adolescent soccer 19 and academic literature. This lack of commonality complicates comparisons and generates uncertainty within the field. Therefore, this study has two main aims; a) to observe the agreement of maturity status estimations between methods using the same anthropometric data and b) compare concordance between methods when looking to categorise players as circa-PHV using established thresholds. It is hoped that findings provide grounding for practitioners to select which method to accurately monitor growth and maturation and to encourage consistency within organisations when looking to track biological maturation.
Methodology
Participants
Male adolescent academy soccer players (N = 113) (mean ± SD; age, 14.3 ± 1.1 years; stature 170.1 ± 10.6 cm; body mass, 58.7 ± 10.5 kg) were recruited from two Elite Player Performance Plan academies. Players were predominantly from White British ethnicity, although some participants were from more diverse ethnic minorities (<10%). Data from 57 participants was collected from a single assessment during the 2017–2018 season, with the remaining 55 participants providing three repeated measurements during the 2018–2019 season, resulting in 222 total estimations. Participants were eligible to take part if they were registered with the academies and free from time-loss injury prior to the stratified random recruitment process to ensure a relatively homogenous sample. Ethical approval was granted by the University ethics committee (REC 17.71.5.2).
Procedures
Following International Society for the Advancement of Kinanthropometry (ISAK) recommendations 31 anthropometric measurements were obtained from all participants wearing light sportswear to facilitate maturity estimations.9–12 A portable stadiometer (Seca© 217, Chino, USA) was used to measure standing stature when participants stood barefoot with feet together and their head in the Frankfort plane. The participants were required to take a deep breath and hold their head still whilst duplicate measures of standing stature were recorded to an accuracy of 0.1 cm and subsequently the mean was calculated with a third taken if necessary (>4 mm difference) and the median recorded. Following similar procedures, participants seated stature was measured whilst sat on a standardised plinth (40 cm high) with feet together and hands rested on thighs. Body-mass was recorded using portable weighing scales (Seca© robusta 813, Chino, USA) whilst participants were stood barefoot wearing normal training attire. Duplicate readings were taken and if measurements varied by 0.2 kg a third measure was taken and the median recorded. All measurements were taken by the same researcher to minimise error, with typical error (coefficient of variation [CV]) for both stature (0.13% CV) and seated stature (0.21% CV) comparable with reported norms. 32 Mid-parental height was calculated using self-reported values corrected for overestimation.20,21
Maturity equations
Estimations of MO and PAH% were calculated using anthropometric measures (standing stature, seated stature and body-mass) and decimal age (years). Typical error (coefficient of variation; CV%) for both stature and seated stature was 0.2% and therefore comfortably within accepted levels. The Fransen et al. 9 method initially calculates a ratio which was subsequently converted to MO for comparison. The Khamis-Roche (PAH%) equation required the addition of birth parent height which was self-reported and corrected for overestimation. 4 Exact equations are available in Appendix 1.
Statistical analysis
Raw data are presented in Table 1. Agreement between measures was assessed using Bland-Altman plots with 95% limits of agreement, using Prism 9 software (9.1.0, GraphPad Software LLC). The Mirwald equation 11 was used as a surrogate reference as this is most widely reported in literature. Due to measuring different constructs, both MO (APHV+MO) and PAH% (using growth reference charts 33 ) were both subsequently converted to represent an estimation of biological age to facilitate analysis. Concordance analysis was conducted using Cohen’s Kappa (k) coefficients derived from contingency tables. Two evidence informed thresholds to categorise circa-PHV for MO and PAH% were applied, a) conservative ± 1-year and 85%–96%; and b) less conservative ±0.5-years or 88%–93%.4,30
Descriptive comparisons between methods to estimate biological age (years).
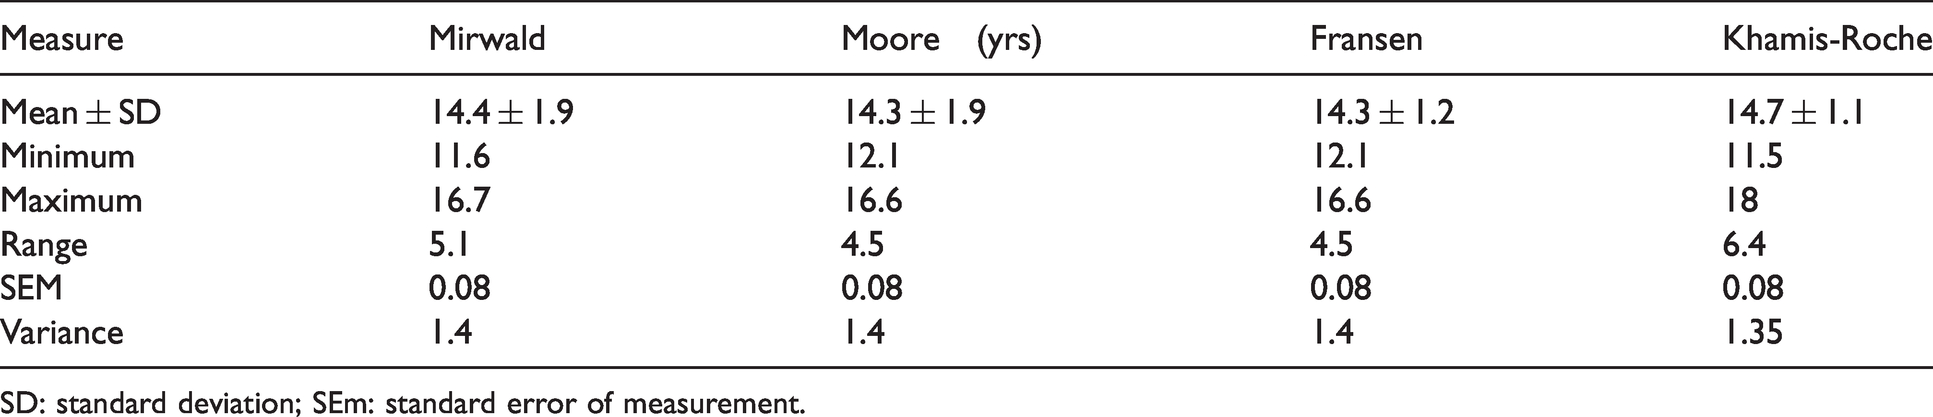
SD: standard deviation; SEm: standard error of measurement.
Results
Descriptive analysis indicates minimal variation between all methods, particularly between those that predict MO, with the closest agreement between the Moore and Fransen methods (±0.05 years) (Table 1). Bland-Altman analysis indicates that MO methods typically agree within <0.3 years 95% of the time, but Khamis-Roche PAH% offers broader limits of agreement (–1.65 to 0.87 years) (Figure 1). Bias indicates that Khamis-Roche estimates biologival age to be ∼0.6 years higher than MO methods (Table 2).
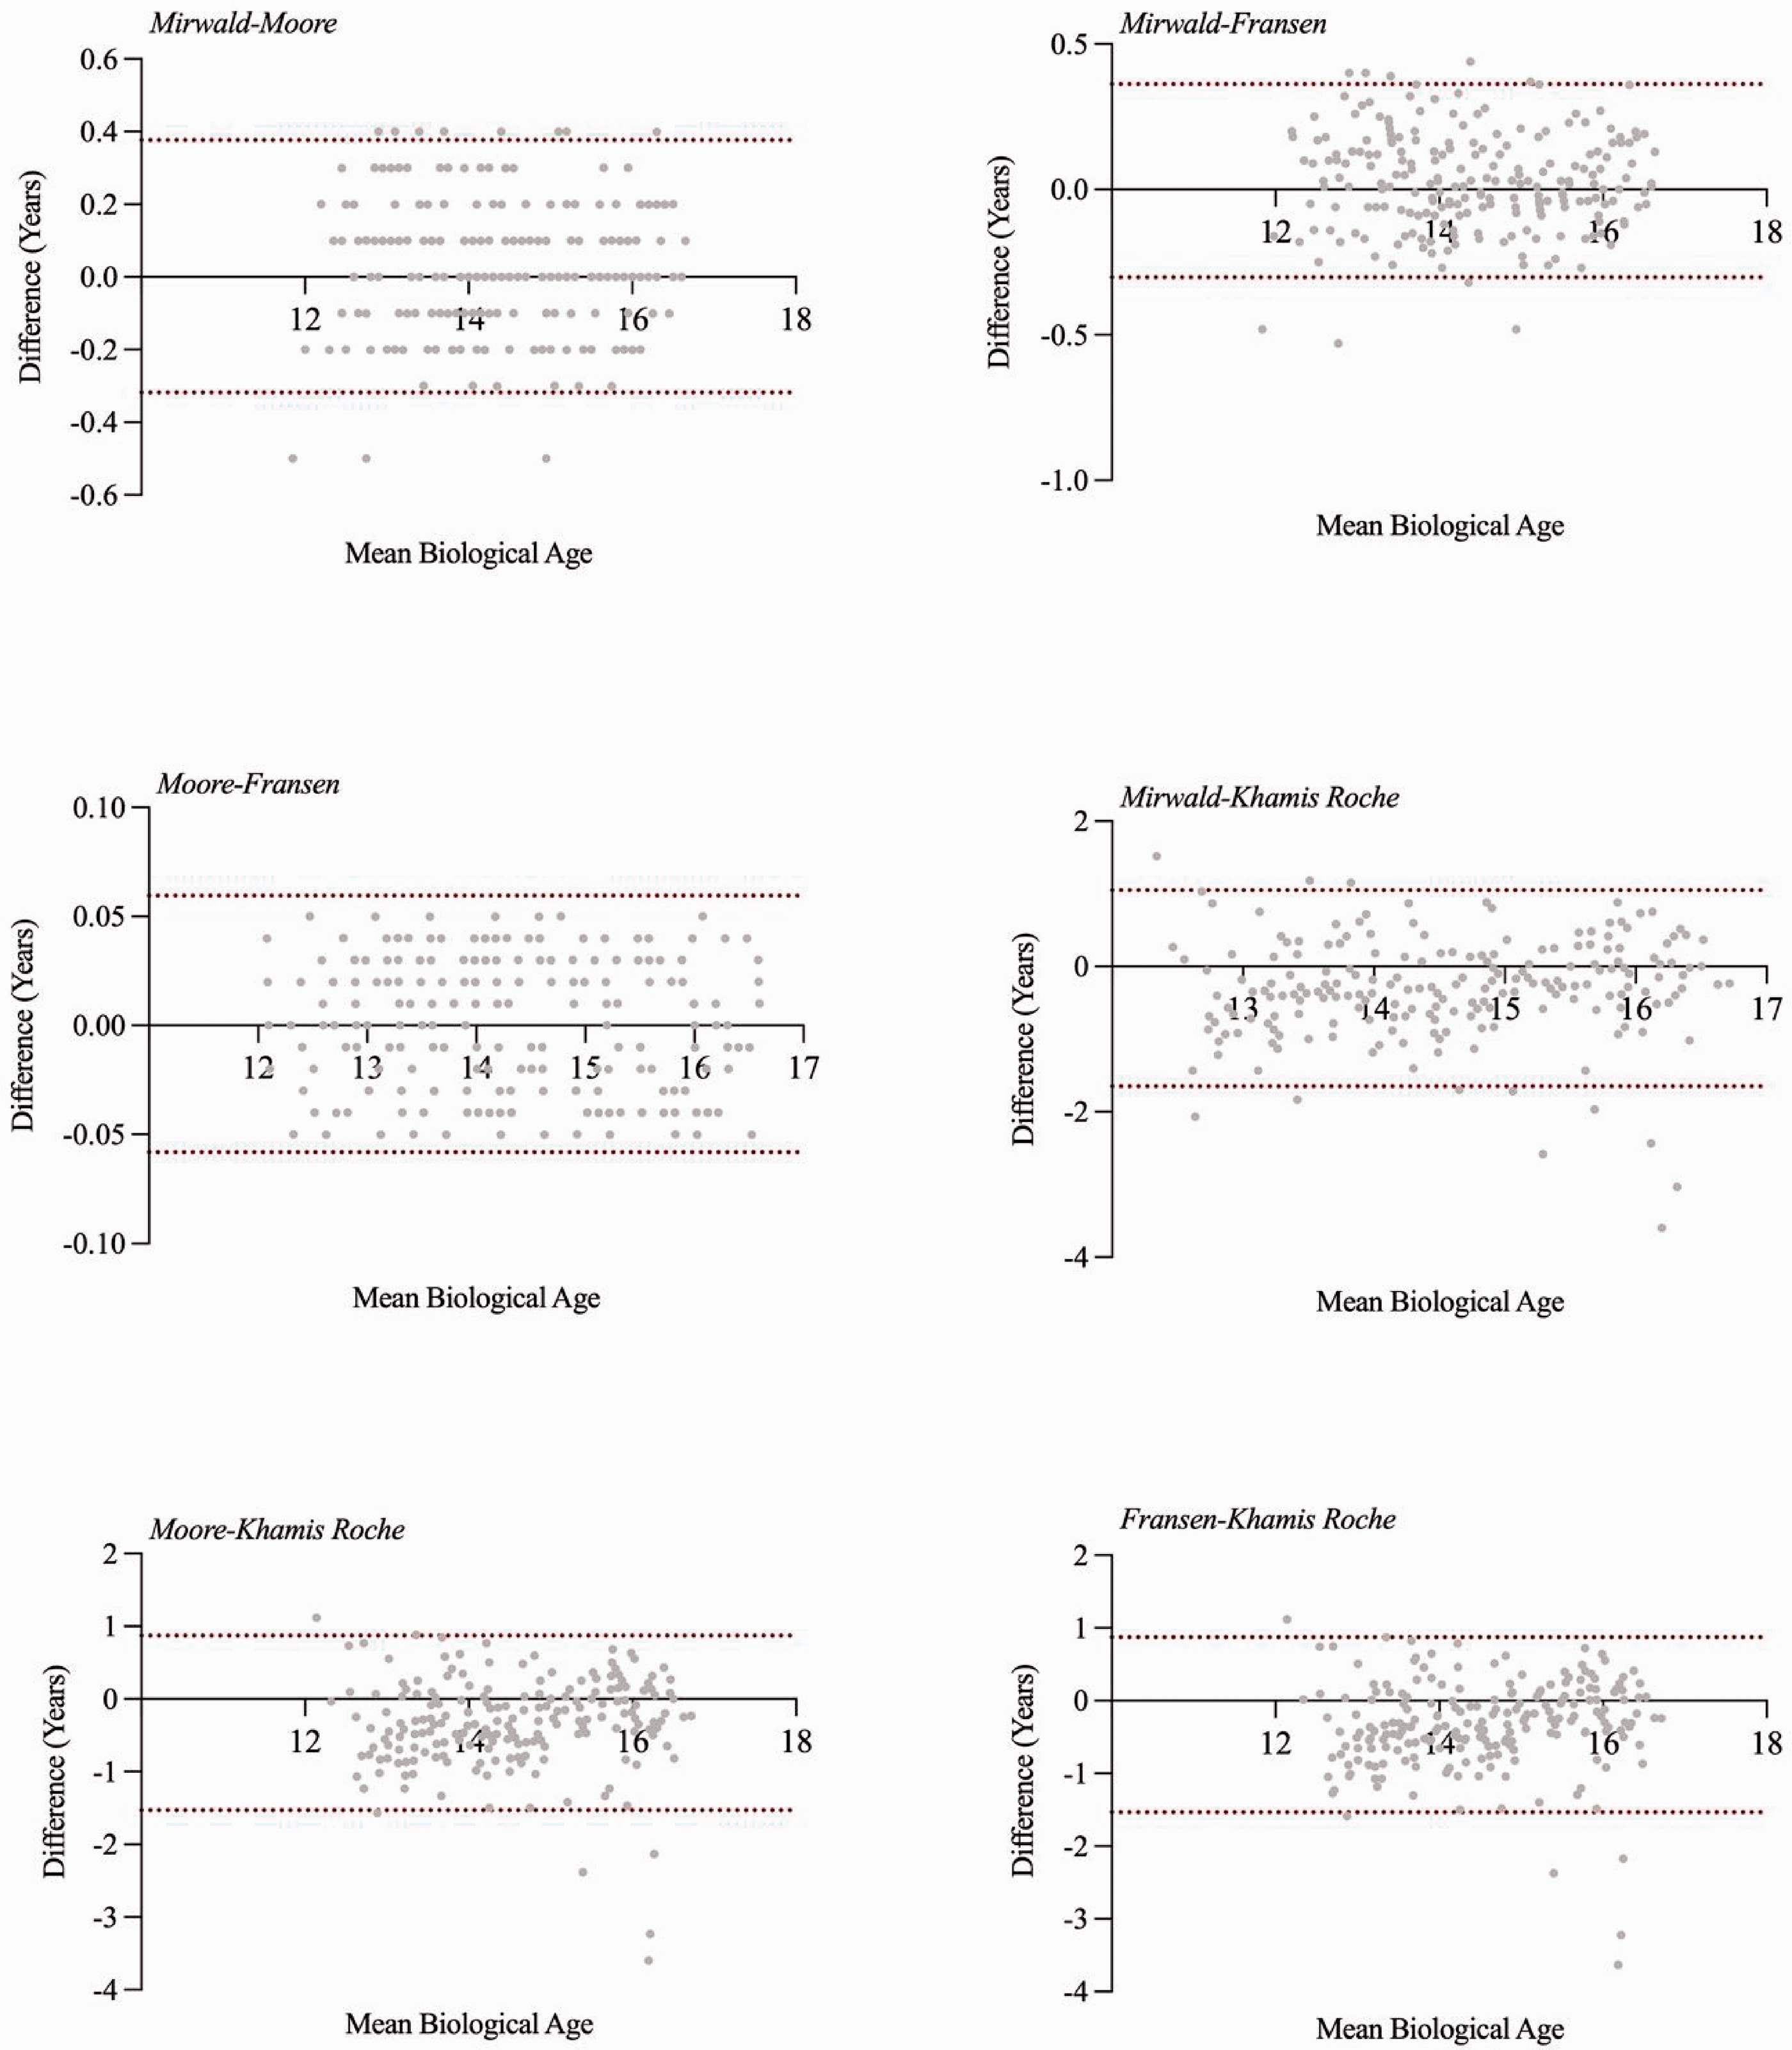
Bland–Altman plots (with 95% limits of agreement) for estimated biological age for the different maturity estimation methods.
Bland-Altman bias (SD) and 95% limits of agreement between biological age estimations.
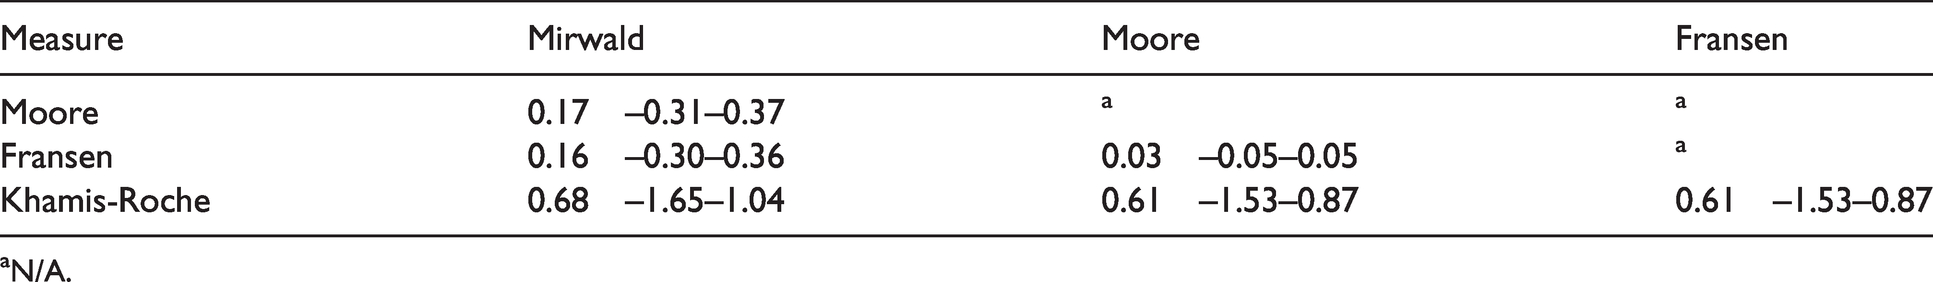
aN/A.
Concordance between methods is presented in Table 3. When conservative (±1 year) there was substantial agreement (64%–67%) between MO methods with moderate agreement (44%–50%) between MO and PAH% methods. There was a decline to moderate agreement (58%–60%) between MO methods and fair-moderate between MO and PAH% (31%–43%) when utilising the less conservative threshold.
Concordance (Kappa Cohen k coefficient) between maturity status estimation thresholds for circa-PHV.
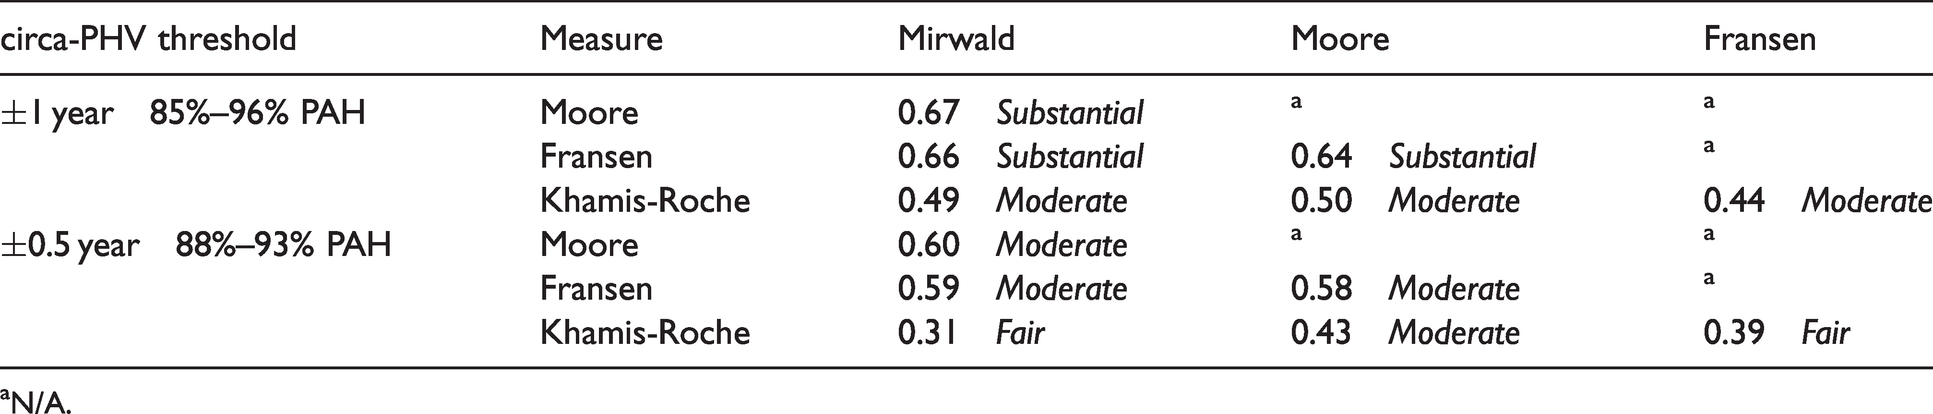
aN/A.
Discussion
This study observed agreement between methods of estimating maturity status, aiming to inform practitioners of differences and interchangeability feasibility between them. All methods of MO produce a similar estimate of biological age (14.3–14.7 years). Findings suggest there are tight limits of agreement between MO methods (±0.3 years) despite methodological nuances. However, biological age estimations derived from Khamis-Roche calculations offer a much broader agreement window (approx. –1.5 to 1 year) with the MO methods. Unsurprisingly, there is greater concordance when using conservative thresholds (44%–67%) than when using less conservative bandwidth thresholds (31%–60%).
The tight agreement thresholds of biological age between MO is initially unsurprising based on them being inherent iterations of the original regression equation. Moore et al. 12 aimed to reduce prediction error by removing seated stature from the equation. The almost perfect agreement observed here (particularly between Moore–Fransen) is interesting based on reported error associated with seated stature, which is historically greater than other components of the equation. 15 However, typical error for both seated and standing stature in the current study was low (0.2%), which is comparable with reported error. 32 This suggests that the inclusion/exclusion of seated stature has little impact on the outcome of the equation if measurement error is adequately controlled. This may alleviate some of the concerns raised by Massard et al. 32 who indicated that failure to pay close attention to sitting height protocol may influence the outcomes for PHV estimation. This suggests that practioners have flexibility to utilise MO methods with or without sitting height, based on logistical constraints within their setting. However, considering the tight agreement between the methods, the Fransen calculation was validated in adolescent soccer, and therefore likely reflects the true population (i.e. ethnicity, maturation tempo) compared with other methods validated in predominantly white-caucasian school children. Additionally, this method offers a maturity ratio preceding MO, which is suggested to help model fit. 9 Therefore, for practitioners working in youth team-sports, the Fransen MO method may offer the most value, whilst maintaining agreement with other approaches.
The PAH% equation presented much broader agreement with MO estimations (Table 2). This may be explained by them initially calculating two separate constructs (PAH% and MO) but both can be converted to biological age using known growth trends, as employed in this study. The PAH% mean biological age of 14.7 years and Bland-Altman analysis suggest the PAH% offers a ∼0.6 year bias compared to MO methods. This bias is more substantial than any of the MO compared with one another, therefore suggesting that practitioners should use either a MO method, or PAH%, but not both interchangeably. Parr et al. 34 conducted longitudinal analysis to observe timing of PHV, and illustrated that PAH% was accurate 96% of the time, with MO correct 61% of the time. This, combined with other studies11,18 highlight potential limitations with MO methods having a tendency to regress towards the mean which may limit their efficacy when differentiating between stages of maturation. Data from the current study would suggest that PAH% is a useful indicator of maturity status in youth team-sport players, however, it does provide maturity estimations that differ from MO methods. Based on the aforementioned limitations of MO methods, and in conjunction with previous findings, PAH% may offer increased accuracy,18,34 but is not reliably comparable to MO methods. Therefore, practitioners should employ either a MO or PAH% method of maturity estimation consistently across the various facets of application (e.g. time to PHV and/or bio-banding). Failure to obtain accurate parental heights, or appropriately correcting the equation, 20 will ultimately undermine its accuracy and inflate error beyond that reported, reducing fidelity of predictions and thus leave MO approaches more efficacious.
Despite the agreement discussed, discrepency exists when categorising players as circa-PHV using both MO thresholds. The 64%–67% concordance leaves a disagreement (i.e. players categorised differently) of approximately 30%–35% and up to 50% when using conservative or stringent thresholds respectively. This disagreement further increases when comparing MO to PAH% to 31%–50% respectively. Therefore, a third to two-thirds of the data would potentially disagree and lead to categorisation error, potentially influencing on the practices these individuals are exposed to. For example, a player may be categorised as circa-PHV using one method, but pre-PHV in another, potentially exposing them to different training stimulus or reducing/increasing their perceived level of risk incorrectly. This has implications for practioners who may use both MO and PAH% methods synonymously for different purposes (i.e. time to PHV and bio-banding), and are therefore encouraged to identify the most feasible and logical method within their context and apply this consistently.
The absence of a criterion value to compare maturity estimations limits confidence in the conclusions from this study, and prevents formal conclusions about which method may be superior, if any. Previous work has attempted to address this15,34 but further studies are required to corroborate these findings. However, this multicentre dataset offers insight into the interchangeability (or lack of) of the common approaches, and highlights how the same anthropoemrtical data may be interpreted differently based on the approach used. Further work surrounding somatic maturity estimation accuracy is required, and where possible should include longitudinal data obtained from multi-ethnic groups.
Findings indicate tight agreement between MO equations, but broader agreement thresholds for MO and PAH% methods. Additionally, concordance between methods to categorise players is moderate at best and may be misleading if multiple methods are employed. Therefore, we conclude that although MO methods are interchangeable with each other, they are not interchangeable with PAH% which may provide different biological categorisation of players. Academies are consequently encouraged to implement an informed approach to apply either MO or PAH% consistently for both research and applied purposes, based on the resources and constraints of their environment. Previously cited limitations 11 of MO methods and the observed bias here would suggest that a PAH% approach may offer increased accuracy when looking to monitor maturity status and timing.18,34 It is further recommended that practitioners monitor both height and weight velocity and plot their respective growth curves over time. With consideration of these findings practitioners can have greater confidence in maturity estimations, leading to appropriate maturity-specific development and evaluation of talent.
Footnotes
Declaration of Conflicting Interests
The author(s) declared no potential conflicts of interest with respect to the research, authorship, and/or publication of this article.
Funding
The author(s) received no financial support for the research, authorship, and/or publication of this article.
Appendix 1. Equations
Equation 1: 11 (MIRWALDMO)
Maturity Offset = -9.236 + (0.0002708 * (Leg Length * Sitting Height))
+ (-0.001663 * (Age * Leg length))
+ (0.007216 * (Age * Sitting Height))
+(0.02292 * (Body Mass by stature ratio * 100))
Equation 2: 19 (MOOOREMO)
Maturity offset =–7.999994 + (0.0036124 * (age * standing stature))
Equation 3: 9 (FRANSENRatio)
Maturity ratio = 6.986547255416
+ (0.115802846632 * Chronological age)
+ (0.001450825199 * Chronological age (2))
+ (0.004518400406 * Body mass)
– (0.000034086447 * Body mass (2))
– (0.151951447289 * Stature)
+ (0.000932836659 * Stature (2))
– (0.000001656585 * Stature (3))
+ (0.032198263733 * Leg length)
– (0.000269025264 * Leg length (2))
– (0.000760897942 * [Stature * Chronological age])
Equation 4: 9 (FRANSENMO)
– Maturity Offset = Age/Maturity ratio
Equation 5: 10 (PAH)
Predicated Adult Height = βo + stature* β1 + body mass*(β2) + corrected mid-parent stature *β3
Note: βo, β1, β2, and β3 are the gender specific intercept and coefficients by which age, stature (in), body mass (lbs) and mid-parent stature (in) respectively should be multiplied from the coefficients table available in Khamis and Roche 10 Correction factor for self-reported height in males is (Parental Height [cm]*0.955) + 2.316.