
Abstract
The current study aimed to compare locomotive outputs across English U16, U18 and U23 academy soccer and investigate possible relationships with neuromuscular and aerobic capacities. Participants included 46 outfield players from an English Category Two soccer academy. Global positioning system (18 Hz) data were utilised to analyse locomotive outputs across twenty eleven-a-side matches in each age group. Maximal sprinting speed (MSS) and aerobic speed (MAS) were assessed at the beginning of the season. Absolute total distance (TD), high-speed running (HSR), acceleration and deceleration workloads were higher in U18’s and U23’s vs. U16’s (g = 1.09–2.58; p < 0.05), and absolute sprinting distances were higher in U23’s vs. U16’s (g = 0.96; p < 0.05). In addition, relative HSR outputs were higher in U23’s vs. U18’s (g = 1.84–2.07; p < 0.05). Across the whole cohort, players’ MSS was positively associated with absolute HSR and sprinting distances (ρ = 0.53–0.79; p < 0.05) but not with relative parameters. MAS was positively associated with total distance, decelerations, and both absolute and relative HSR outputs (ρ = 0.33–0.56; p < 0.05). Overall, absolute locomotive outputs were significantly higher in U23’s and U18’s vs. U16’s. Locomotive outputs were also associated with maximal sprinting and aerobic speeds. Thus, training programmes should be tailored to competition demands to optimally prepare each age group for competition and reflect the increasing demands of each level of competition. Further, improving physical fitness (speed and endurance) is likely to drive greater outputs in competition.
Introduction
In soccer, locomotive outputs such as total distance (TD), high-speed running (HSR) and sprint distance have been extensively researched in senior male,1–3 senior female4,5 and academy male cohorts6–8 to give researchers and practitioners an insight into the demands of competition. Global-positioning-system (GPS) devices allow an objective measurement of the external load experienced by players and are commonly used to quantify such demands. 9 Research within this field may assist practitioners when preparing their athletes for the rigours of competition. This preparation holds clear importance within academy soccer, as youth players need to develop towards sufficient standards to compete within senior competition. Understanding how the demands of the game change as players progress through the different age groups of soccer competition should help coaches ensure that players are adequately prepared.
Whilst research within academy soccer has shown TD covered to increase with age (e.g. ∼5700 m.hr−1 at U11 to ∼6700 m.hr−1 at U15 7 ) other investigations have shown contradictory findings when TD was adjusted for playing time. 10 Nonetheless, clear differences between very young (U9–U10; 3500–4500 m)8,11 and older (U16–U18; 7000–11500 m) age groups are evident.7,10,12,13 Literature surrounding HSR (5–6 m/s) and sprinting (5.3–7 m/s) outputs are morevaried.6,7,10,12,14 Studies have shown HSR to tends increase with age10,12,13 when considering absolute thresholds. However, the picture regarding HSR and sprinting becomes less clear when assessing relative as opposed to absolute data, where thresholds are based on team or individual speed values. Studies have reported both greater distances with increasing age, 13 as well as no differences between age groups7,14 when assessing these relative outputs. As consideration of relative outputs better reflects individual differences in players’ physical capacities (i.e., outputs are relative to their maximal sprinting speed), it is therefore important to consider both absolute and relative measures when analysing competition data in academy soccer.
Although TD, HSR and sprinting outputs give insight into the physical demands of soccer, the inclusion of acceleration and deceleration counts may provide a more well-rounded understanding of the physiological stress of competition. This is due to their high prevalence in matches (e.g. Russell et al. reported ∼650 instances of acceleration and ∼600 instances of deceleration in professional U21 matchplay) and the resultant high eccentric forces imposed on the body.16,17 Whilst these outputs have been researched within senior male15,18 and female soccer, 19 they are yet to be compared across age groups within academy male soccer.
Investigations surrounding the physical demands of competition within male academy soccer have taken place all around the world including: Qatar, 10 Japan, 12 Australia, 20 New-Zealand 21 and England.7,8,13 However, the studies within England have only investigated age groups up to U16 level. To the authors’ knowledge, no research has investigated and compared the locomotive demands of English academy soccer within the highest levels of competition, specifically the professional development phase within England, comprising the U18 and U23 squads. Detailed profiling of U23’s soccer may be important due to the fact that this phase of the academy programme is the final stage before senior first team soccer.
Studies have reported a positive relationship between aerobic physical capacity and competition locomotive outputs in elite and youth soccer cohorts.22–25 For example, Castagna et al. reported aerobic performance within the YoYo intermittent recovery assessment correlated (r = 0.77, p < 0.001) with high intensity outputs in youth (U15) soccer competition. In addition, research has shown significant correlations between high intensity distances covered in competition and peak speeds during incremental field tests (r = 0.65, p < 0.01), as well as mean sprint times on repeat sprint assessments (r = −0.60, p < 0.01). 27 Investigations have also demonstrated faster athletes complete more repeat sprint bouts in competition 6 and reach the higher peak speeds in games in comparison to slower athletes. 28 Thus, it is clear fitness qualities (aerobic capacity and sprinting speed) are associated with locomotive outputs in competition. However, these investigations have not compared how maximal aerobic speed versus maximal sprinting speed may influence locomotive outputs. Moreover, data for U18 and U23 age groups are lacking.
Therefore, the primary aim of the present study was to compare locomotive outputs across U16, U18 and U23 English academy soccer. The study also aimed to evaluate the relationship between athlete physical capacities (maximal sprinting speed and maximal aerobic speed) and locomotive output in competition. It was hypothesised that TD’s would be consistent across all three age groups once playing time has been accounted for. However, it was anticipated that absolute HSR and sprinting distances would be higher within the U18 and U23 vs. the U16’s squad. In addition, it was hypothesised that maximal sprinting speeds would be correlated with absolute HSR and sprinting distances, as well as greater peak speeds attained in games.
Methods
Participants
In total, 46 outfield male soccer players from the U16, U18 and U23 squads of a professional English Category Two academy volunteered to participate in the current study (participant details shown in Table 1). A minimum sample size of 42 (n = 14 per squad) was determined as a result of a priori power analyses utilising G*Power-2 (Version 3.1.9.6, Heinrich-Heine-Universitat, Dusseldorf, Germany).29,30 This output was based on an alpha error of 0.05, power of 0.8 and a medium effect size of 0.5. 12 The U18 and U23 players regularly complete four pitch-based and two strength and conditioning training sessions alongside one competitive fixture per week. The U16’s complete three pitch-based and one strength and conditioning training session in addition to one competitive fixture per week. Typical weekly schedules are provided in Supplementary Content 1. All players had been exposed to a minimum of two year’s soccer specific and strength and conditioning training experience. Written consent from all players was obtained prior to the start of the investigation, as well as informed consent from both parents/guardians for all athletes under the age of 18. All players analysed within competition were completely free of injury. Ethical approval was granted by the review board of the London Sports Institute, Middlesex University.
Player characteristics across the three different playing squads.
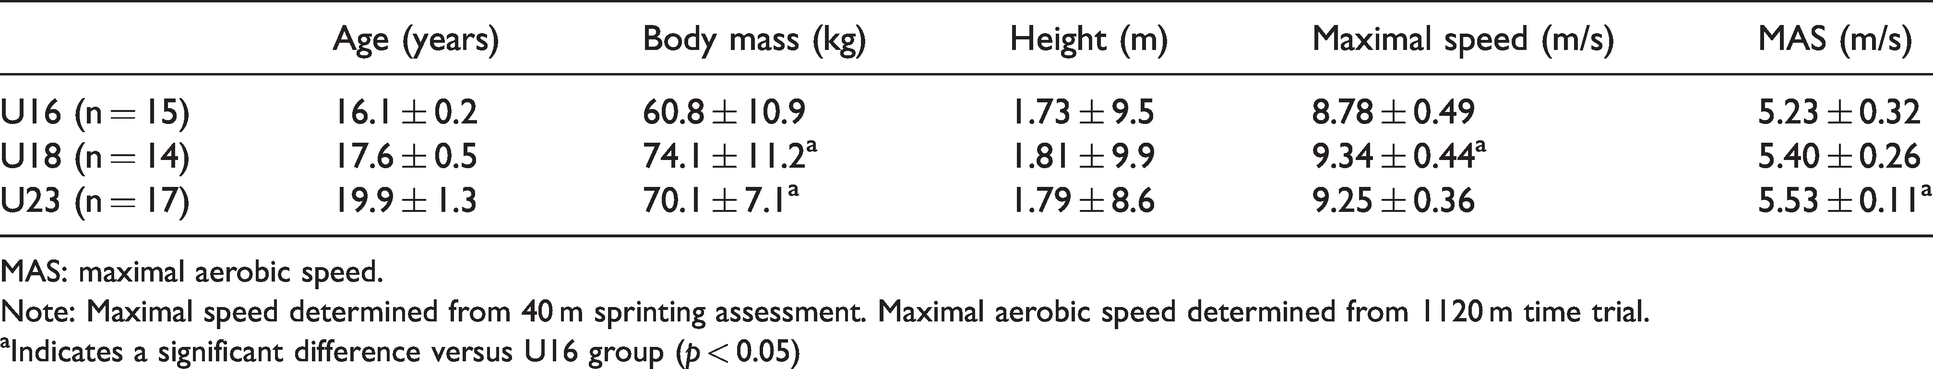
MAS: maximal aerobic speed.
Note: Maximal speed determined from 40 m sprinting assessment. Maximal aerobic speed determined from 1120 m time trial.
aIndicates a significant difference versus U16 group (p < 0.05)
Procedure
Competition analysis
Competition analysis was conducted on U16, U18 and U23 in-season, 11-a-side matches, spanning from September 2019–March 2020. Due to the fact U16’s do not participate in league competition, in-season matches versus other elite soccer academies were chosen for analysis; unlimited ‘rolling’ substitutions were permitted in these U16 fixtures. For both the U18 and U23 sides, only in-season league fixtures were selected, excluding all friendlies and cup competitions from analysis. Data collection took place over twenty games within each age group (a total of sixty games). Only individuals who played a minimum of sixty minutes in at least three fixtures across the season were included in analysis. U16, U18 and U23 competition playing times are 80, 90 and 90 minutes respectively and therefore whole match data was presented, alongside TD, HSR, sprinting, acceleration and deceleration outputs per minute, 11 to allow clear comparisons between age groups.
Output metrics
18 Hz GPS devices (Apex 18 Hz, STATSports, Newry, Ireland) were used to quantify locomotive outputs during competition. Previous research has supported the validity of this 18 Hz device, reporting small bias (<5%) in measuring various distances as well as peak velocities. 31 In addition, studies have highlighted higher sampling rates are a crucial aspect associated with both validity and reliability of GPS data.32,33 It has been reported that devices with a sampling rate of ≥10Hz permit reliable determination of acceleration and deceleration frequencies.34,35
The GPS device was switched on and inserted within the GPS vest pocket and placed between the scapulae prior to commencing the warm-up. Once the fixture ended, GPS units were then collected and later downloaded and analysed on STATSportsApex software (Apex 18 Hz version 5.0). All GPS metrics measured within the study (Table 2) were presented in both absolute and relative terms. 36 Absolute outputs refer to distances covered within ‘standardised’ speed thresholds, whereas relative outputs represent distances covered in relation to individualised speed thresholds. These individualised speed thresholds were based on each athlete’s maximal sprinting speed, measured via GPS during a 40 m sprinting assessment (outlined below). Each player used the same GPS device for the entirety of the study.
Definitions of locomotive variables used in the current study.
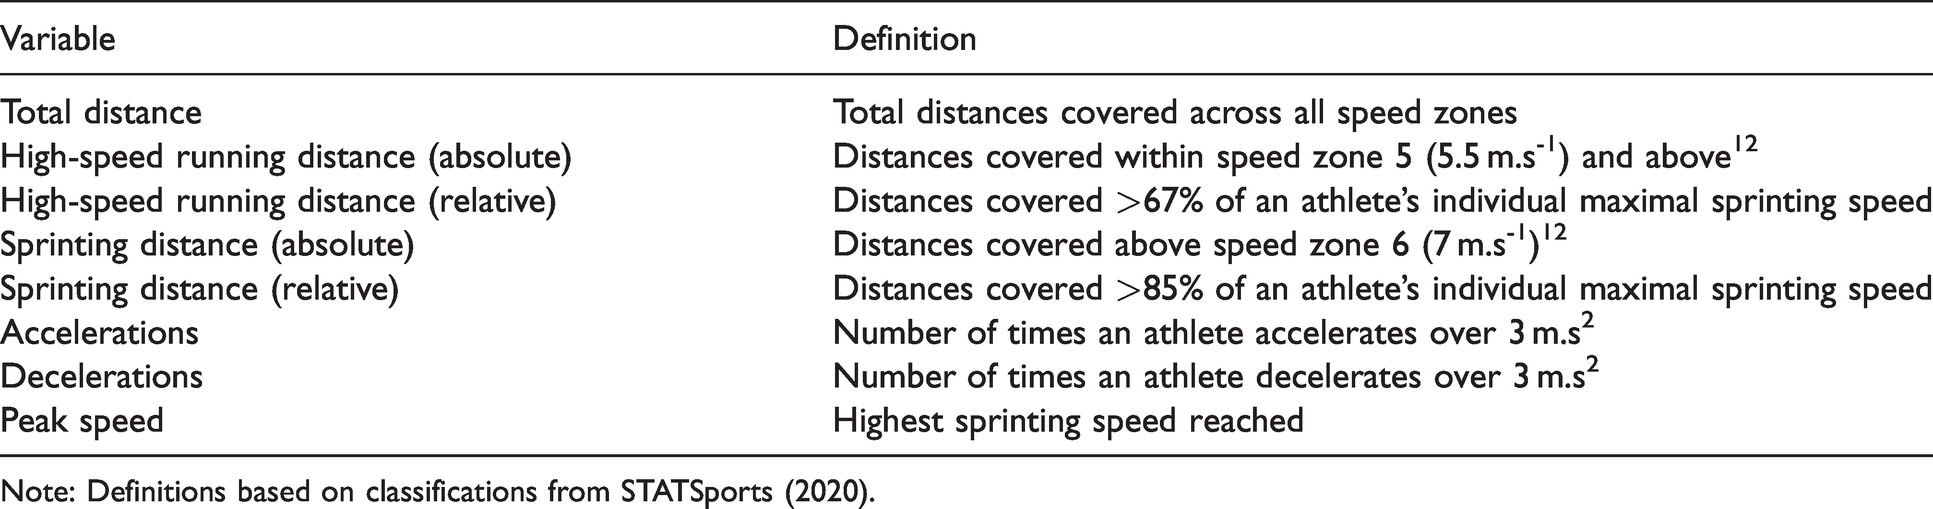
Note: Definitions based on classifications from STATSports (2020).
Sprinting test
40m sprinting assessments utilising GPS devices were conducted on all athletes as part of their regular testing process, to establish accurate maximal sprinting speeds prior to commencing competition analysis in September. This assessment protocol has been performed in similar investigations.6,10Athletes were taken through a standardised ten-minute warm up protocol including floor-, dynamic-, and speed-based sections. Protocols are detailed in Supplementary Content 2. Before the assessment, players performed three ramping warm-up sprints up to 90% of perceived effect. For the subsequent assessment, players performed three maximal sprints. Whilst sprints were also timed using timing gates, for the current investigation, maximal sprinting speeds attained from the GPS devices were used in the analyses. This recorded speed was subsequently used to implement ‘individualised’ relative speed thresholds for each athlete. Maximal sprinting speeds were continuously updated on the STATSport Apex software (Apex 18 Hz version 5.0) throughout the study period, i.e., if athletes recorded new maximal speeds during training or competition relative speed thresholds were adjusted.
Aerobic test
Aerobic testing was conducted on a separate day to the sprinting assessment as part of their regular testing process, on all athletes prior to commencing competition analysis. Athletes were taken through the same ten-minute standardised warm up protocol described above (Supplementary Content 2), and were then asked to complete a 1,120 m time trial. Times for each player were recorded via stopwatch. This score was then used to calculate each player’s maximal aerobic speed (MAS) score, which is calculated by dividing distance travelled (m) by the time taken to complete the test. 37 Similar time trial assessments have shown to be a time-efficient method for determining MAS. 38
Statistical analyses
All findings are presented as mean ± SD, with statistical significance set at p < 0.05. Shapiro-Wilk tests were performed to assess the normality of all variables. Non-parametric analyses (Kruskal-Wallis) were applied to investigate differences in absolute locomotive outputs between U16, U18 and U23 age groups as a number of absolute variables were not normally distributed. Parametric analyses (independent samples t-test) were applied to investigate the differences in the normally distributed relative outputs. However, as relative output data was not available for the U16’s, only U18 and U23 age groups were compared. Effect sizes (Hedge’s g) were calculated to determine the magnitude of between-group differences 39 and interpreted as: trivial (<0.19), small (0.20–0.59), moderate (0.60–1.19), large (1.20–1.99) or very large (≥2.00). 40 Spearman’s rho (ρ) coefficients were utilised to examine the relationship between locomotive match outputs and maximal sprinting speed or aerobic fitness. The magnitude of the correlations were interpreted as: trivial (<0.10), small (0.10–0.29), moderate (0.30–0.49), large (0.50−0.69), very large (0.70–0.89), nearly perfect (0.90–0.99). 40
Results
Absolute locomotive outputs
Competition locomotive outputs for each age group are summarised within Table 3. Playing time was greater for U18 and U23 versus U16. The peak speed attainted during matchplay was greater for U23 versus U16.
Absolute locomotive outputs during matchplay across the U16, U18 and U23 age groups.
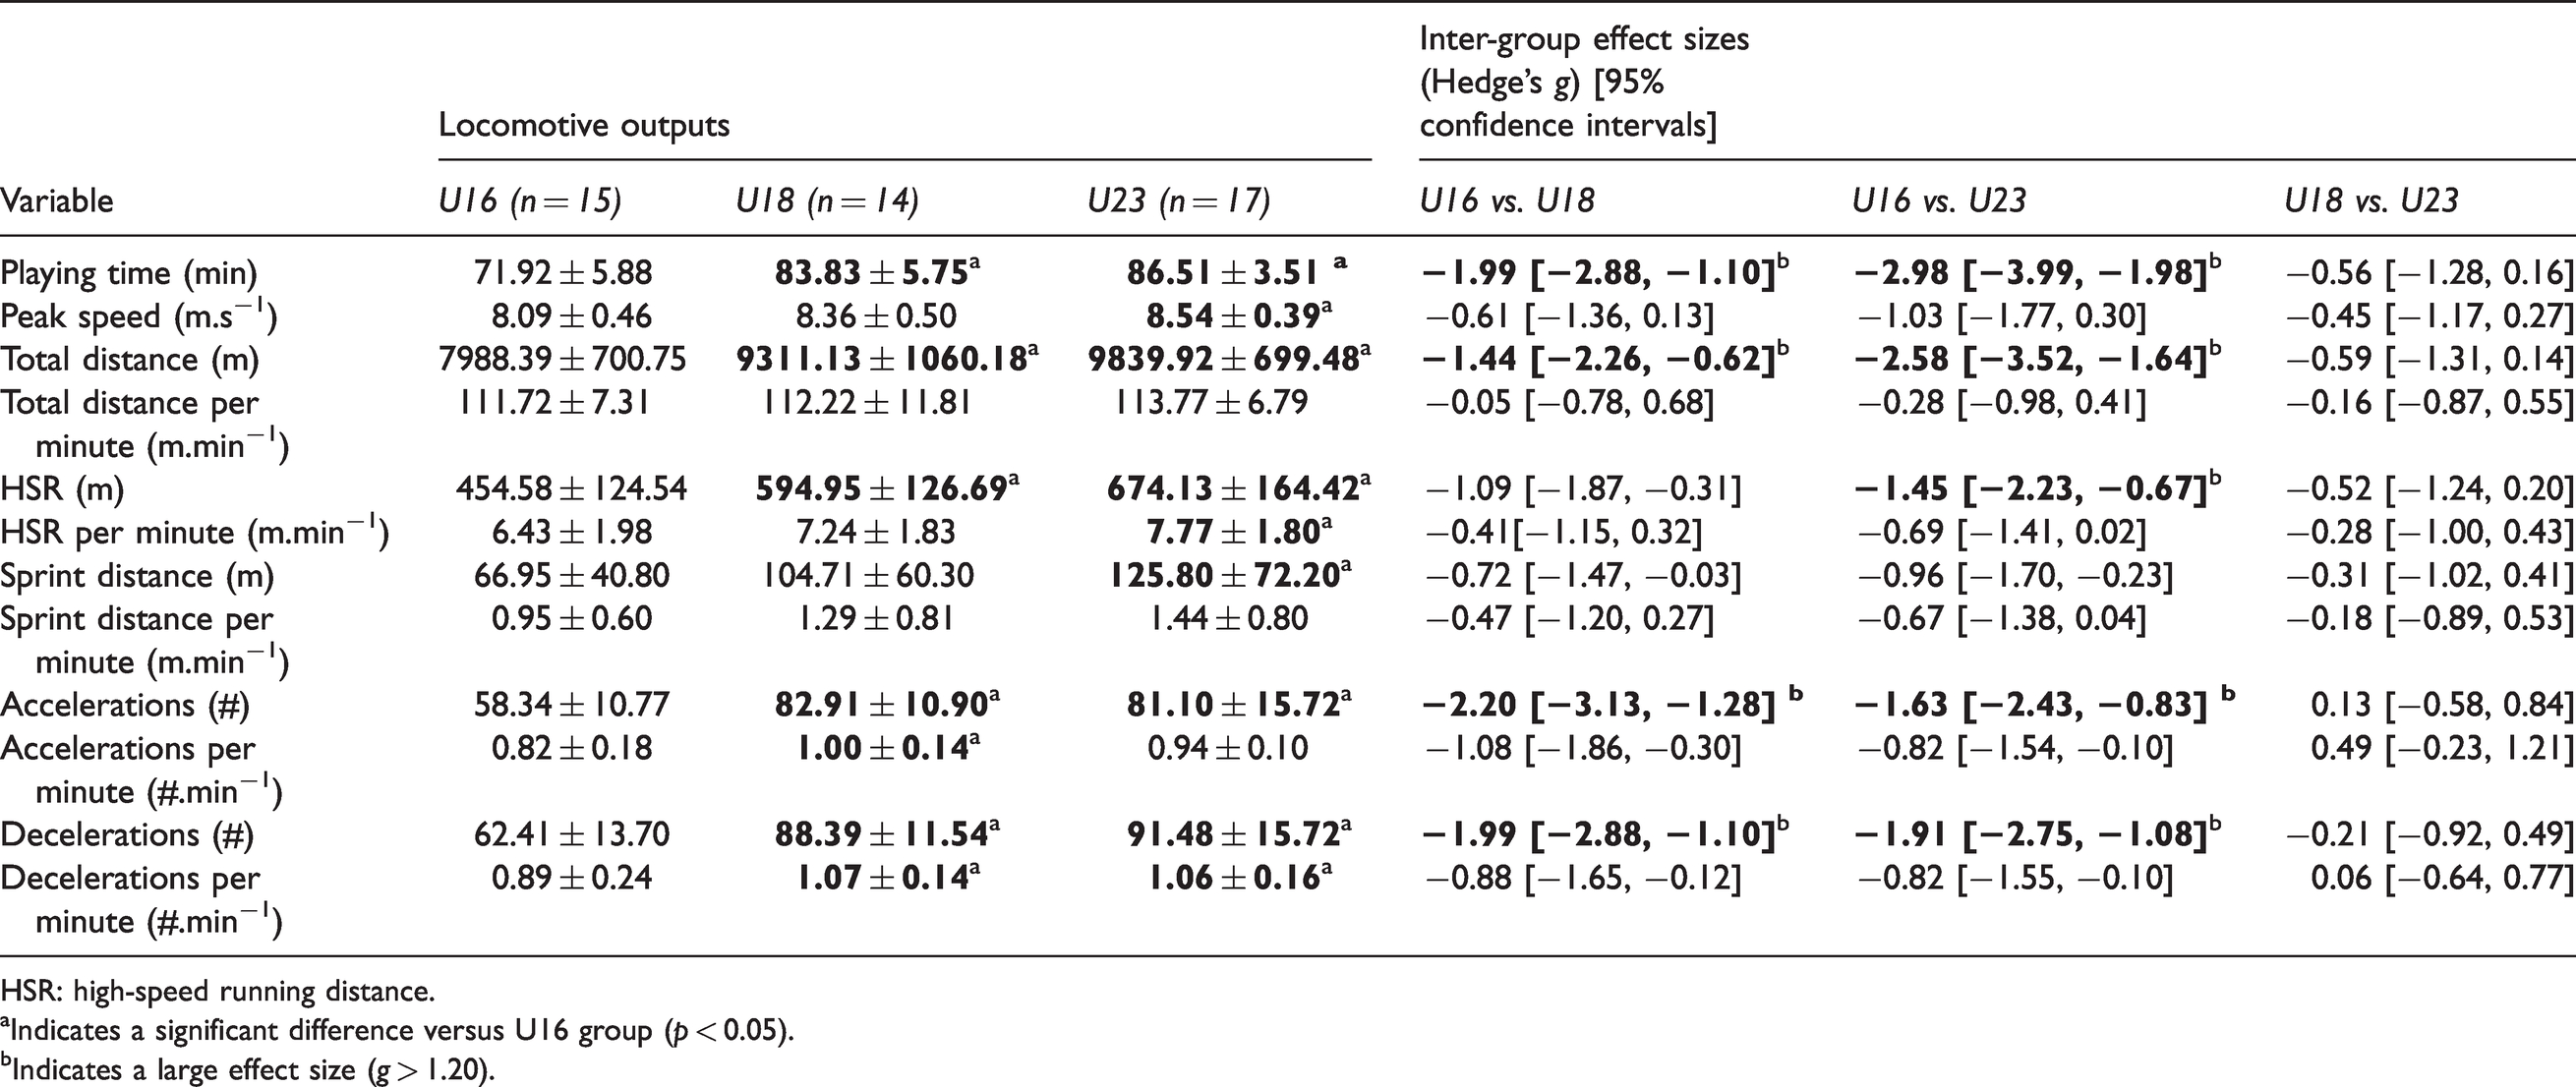
HSR: high-speed running distance.
aIndicates a significant difference versus U16 group (p < 0.05).
bIndicates a large effect size (g > 1.20).
All absolute outputs were significantly greater for U18 and U23 versus U16 before correction for playing time, with the exception of sprint distance for U18, and reported with moderate-to-large effect sizes (g = 0.72 to 2.20). After adjustment for playing time (i.e. outputs per min), significantly greater HSR and decelerations were observed for U23 versus U16. Significantly greater accelerations and decelerations were observed for U18 versus U16. No differences were reported between U18 and U23 groups (g = −0.59 to 0.49).
Relative locomotive outputs
Relative HSR and sprinting outputs are shown in Table 4; relative outputs were not available for the U16 squad. Both relative HSR and relative HSR adjusted for playing time were greater for U23 versus U18. No differences in relative sprint outputs were reported.
Relative locomotive outputs during matchplay across the U18 and U23 age groups.
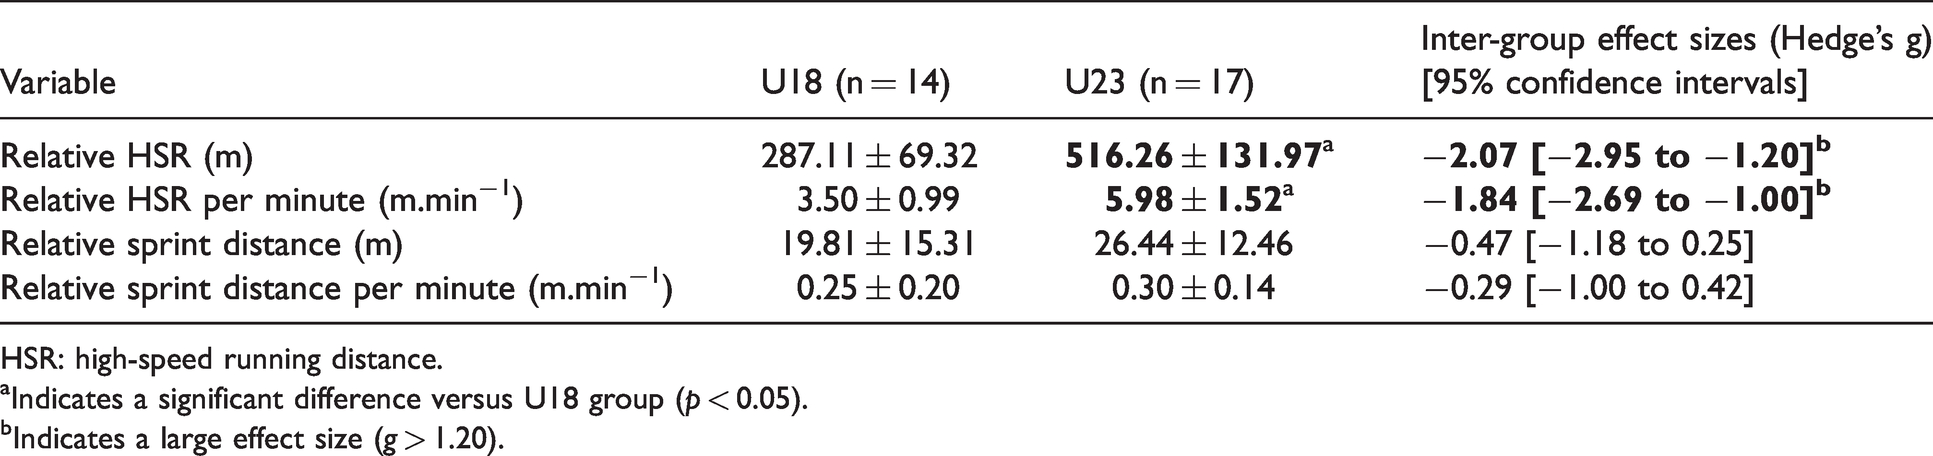
HSR: high-speed running distance.
aIndicates a significant difference versus U18 group (p < 0.05).
bIndicates a large effect size (g > 1.20).
Relationships between physical capacities and outputs
Relationships between locomotive outputs and the two physical capacities have been compiled in Table 5. For maximal sprint speed, a moderate correlation was reported with total accelerations but this did not remain when adjusted for playing time. A large correlation was reported with absolute HSR (both raw and adjusted for playing time) but not for relative HSR. Similarly, a very large correlation was reported with absolute sprint distance (both raw and adjusted) but not for relative sprint distance. A very large correlation was also observed between maximal sprint speed and the peak speed achieve during matchplay.
Correlations (Spearman’s ρ) between locomotive outputs and players physical capacities (maximal sprinting speed and maximal aerobic speed).
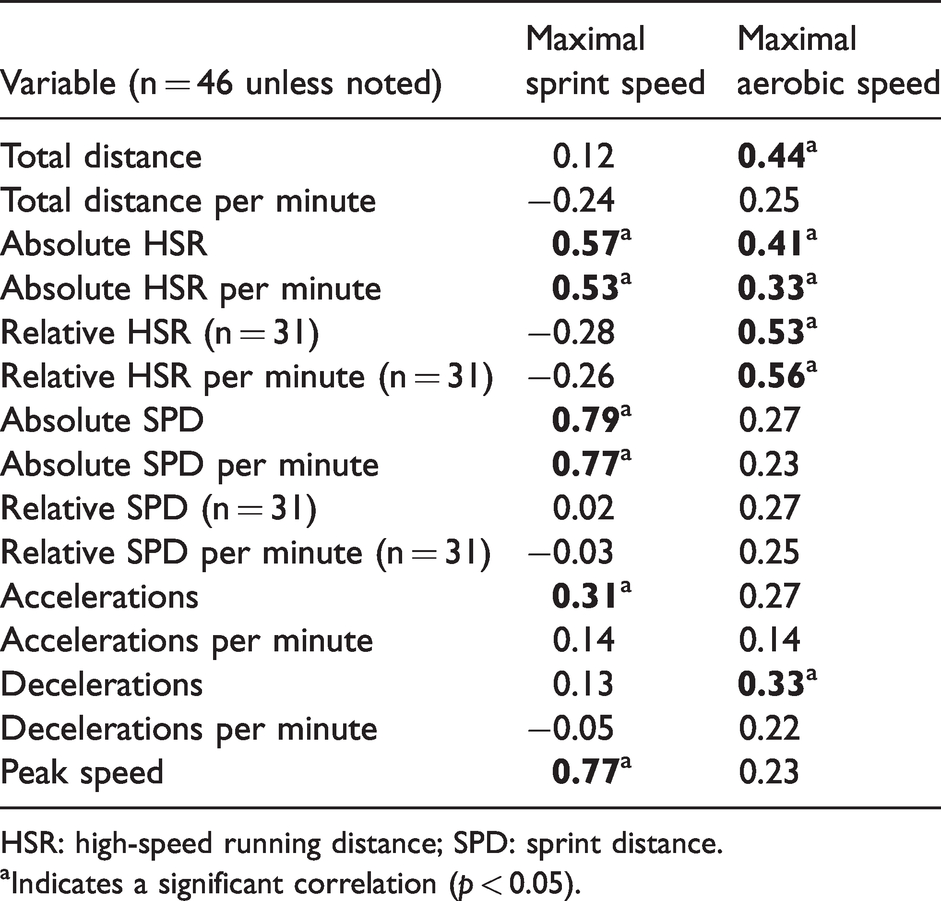
HSR: high-speed running distance; SPD: sprint distance.
aIndicates a significant correlation (p < 0.05).
For maximal aerobic speed, moderate correlations were reported with total distance and total decelerations but did not remain when adjusted for playing time. Moderate correlations were reported with absolute HSR (both raw and adjusted for playing time) whilst large correlations were observed when considering relative HSR (both raw and adjusted).
Discussion
The primary aim of the current study was to compare locomotive outputs across U16, U18 and U23 English academy soccer. In addition, the study sought to evaluate the relationship between athlete physical capacities (maximal sprinting speed and maximal aerobic speed) and locomotive output. In comparison to U16 soccer, absolute outputs were greater at U18 and U23 levels, and were influenced by longer playing duration. Differences in HSR, accelerations and decelerations remained after adjustment for playing time. Between U18 and U23 levels, only relative HSR differed with these demands greater for the U23 group. Across the cohort, maximal aerobic speed was positively related to all HSR outputs. Maximal sprint speed was positively related to absolute HSR and sprint distance, but not relative outputs.
The present study reports greater TD outputs within the U18 and U23 vs. the U16 age group. However, these differences may be explained by playing duration,14,41 as differences were no longer present when adjusted for playing time. These findings are similar to those reported in previous investigations.10,12,14 Whilst TD may prove useful metric as part of a holistic training load monitoring regimen, it is clear that other metrics must be considered if seeking to differentiate between age group competition demands in academy soccer. When comparing TD outputs within the current study to previous investigations, findings are mixed. The U16’s TD covered within the present study (7988 ± 700 m) was lower than previously reported data within Japan (11,257 ± 746 m; although over 90-min) 12 and Qatar (8436 ± 156 m) 10 but similar to data previously reported within England (7672 ± 2578 m). 14 For the U18’s, TD in the present study (9311 ± 1060 m) were higher than reported by Buchheit, Mendez-Villanueva 10 in Qatar (8254 ± 118 m) but lower than observed by Goto and Saward 12 in Japan (11,469 ± 921 m). Such comparisons highlight possible differences in the duration, style of play, and physical fitness across different countries, however, would need to be compared directly using multiple teams from each nation.
The current study demonstrates increasing HSR demands with age. Total HSR distance was greater for U18 and U23’s versus U16’s, however, after adjusting for playing time, a significant difference remained only between U16 and U23. Differences were not as pronounced for sprinting outputs. For total sprint distance, only U23’s recorded significantly greater outputs versus U16’s (g = 0.96), although a ‘moderate’ effect size (g = 0.72) was still present between U18’s and U16’s. Following adjustment for playing time, these differences were not significant, and a ‘moderate’ effect size (g = 0.67) remained only between U23 and U16 groups. As well as the difference in total playing time, a further possible explanation for the disparity between total and adjusted (i.e. per minute) outputs is that rolling substitutions are permitted at U16 level. Locomotive outputs reduce across the duration of competition and after intense periods.2,42,43 Therefore, the ability to be substituted off and recover may have benefitted the U16’s HSR and sprinting performance per minute when being substituted back on. Nonetheless, as these findings suggest a general trend for locomotive demands to increase with age, coaches must consider how training prepares their players for the demands of competitive matchplay.
An important factor which may have contributed to these findings is the difference in players’ maximal sprint speeds. For example, players at U18 demonstrated a higher sprint speed than players at U16 (g = 1.17). They would therefore achieve the speed threshold for HSR (5.5 m/s−1) at a lower relative intensity and, consequently, likely attain this speed more often. 6 The observed large correlations between maximal sprint speed and absolute HSR in the current study (ρ = 0.53−0.57; p < 0.001) would also support the notion that faster players accumulate greater HSR distances during matchplay. Previous investigations have also demonstrated that HSR and maximal sprinting speeds increase with academy age group.6,7,10,12,14,28,41 As sprinting speeds were not different between U18 and U23 players, this could explain why differences were not observed between these groups.
It is also possible that HSR distances may be partially explained by aerobic capacity. The current study observed ‘moderate’ correlations for MAS with absolute HSR (ρ = 0.33−0.41; p < 0.05). However, stronger associations were observed for MAS with relative HSR (ρ = 0.53−0.56; p < 0.01). Previous investigations have also demonstrated similar relationships with aerobic performance. For example, Castagna, Impellizzeri 26 observed Yo-Yo test performance to be correlated with high-intensity distances in U15 youth soccer. Nonetheless, MAS was not associated with sprint distances or accelerations. It is possible that aerobic capacity, which may be reflected by MAS, 38 would underpin the capacity to recover in between high-intensity efforts. 44 Data from the current study indicate that such an effect may be observed for high-intensity running, but not sprinting, in academy soccer.
Comparison of absolute locomotive outputs is often challenging due to the inconsistency in the thresholds used.7,10,14 Goto and Saward 12 used the same thresholds employed in the current study within a Japanese cohort, permitting direct comparison. In their investigation, they report greater ‘very high intensity’ running (U16: 625 ± 337 m vs. 455 ± 125 m, U18: 686 ± 267 m vs. 595 ± 127 m) and sprinting distances (U16: 91 ± 87 m vs. 67 ± 41 m, U18: 117 ± 90 vs. 105 ± 60 m) than observed in the current study. However, the Japanese players completed 90-min matches at both U16 and U18 level versus 80-min for U16s in England. Whether such discrepancies are generally reflective of differences between English and Japanese soccer, however, would require further investigation.
Whilst absolute HSR output was not different between U18 and U23 levels, comparison of relative HSR outputs suggest greater demands of U23 competition. No differences, however, were observed for relative sprint distances. These data indicate that competition at U23 level demanded athletes to cover more distance at a higher relative intensity and should have implications for how U23 players are trained in preparation for greater relative HSR demands. For example, training drills for U23’s could be prescribed at a higher percentage of maximal heart rate in comparison to U18’s. Furthermore, it highlights that interpretation of absolute GPS data alone does not provide coaches with the full picture of competitive demands.
The current study also demonstrates that acceleration and deceleration counts were higher at U18 and U23 levels versus U16’s (g = 1.63−2.20). With the exception of acceleration for the U18’s versus U16’s (g = 0.82), these differences remained significant when adjusted for playing time (g = 0.82−1.08). Due to the taxing nature of acceleration and deceleration tasks, the differences reported between levels may be explained by higher physical capacities possessed by the older players. 17 The current study did report two significant associations for accelerations and decelerations. First, total accelerations were correlated with maximal sprint speed. Second, total decelerations were correlated with MAS. However, neither correlation was large (ρ = 0.31−0.33; p < 0.05) and neither remained when adjusted for playing time. Thus, we cannot infer from these data that acceleration and deceleration counts are related to physical capacities.
The current study is not without limitation. Firstly, locomotive outputs were not analysed in accordance to playing position. Instead, an average of each locomotive output was calculated representing the whole age group. By separating players into playing position coaches may better understand the individual positional differences in locomotive outputs between age groups, as it is well documented locomotive outputs differ between playing position. 2 Further, the influence of anthropometry and body composition were not considered. For example, differences in lean mass between age groups have been previously reported 45 and demonstrate the potential to affect locomotive output. The current study did report that U18 and U23 players were significantly heavier than U16s but this was not examined this further. The influence of playing formation, weekly training schedule, and specific training programmes were also not controlled for.
The current investigation was unable to investigate relative locomotive outputs for the U16 players and consequently could not make comparisons between absolute and relative outputs across all three age groups. Given the differences in maximal sprint speed between U16 and the other age groups, the use of standardised speed thresholds is flawed when examining between age groups in academy soccer. Lastly, a range of individual match files were included per player, due to our inclusion criteria. For example, individual’s average locomotive outputs were comprised of as many as twenty match files. In contrast, due to injury, substitutions or absence, certain individual’s average locomotive outputs comprised of three match files. The available data did not permit a detailed evaluation of match-to-match differences in locomotive outputs.
Conclusions
The current study summarised locomotive outputs across U16, U18 and U23 levels of English academy soccer; the demands of U23 soccer had not been previously examined. These data highlight large differences in absolute high-intensity outputs between U16 soccer versus U18 and U23 levels, many of which remain after adjustment for playing time. Whilst absolute differences were not observed between U18 and U23 levels, the relative HSR demands of U23 soccer were greater. It is important that coaches and support staff understand how the level of competition affects the likely locomotive outputs during matchplay and that athletes are adequately prepared for them. Coaches should pay particular attention to the transition from U16 to U18 soccer given the large differences in outputs.
Across the entire cohort, maximal sprint speed was associated with greater absolute HSR and sprint distances. Whilst improving sprint speed is likely to provide players a competitive advantage in many game scenarios (e.g. a one-on-one race to the ball), it is also likely to result in players covering more of the pitch at a higher speed. MAS was also related to absolute HSR but was more strongly related to relative HSR. As such, improving players’ aerobic capacity may enable them to better sustain high-intensity outputs. Coaches are therefore advised to prioritise appropriate training of maximal speed and aerobic capacity. A needs analysis and physical assessment is likely to elucidate which area should be prioritised (i.e., speed vs. aerobic capacity) for individual players.
Supplemental Material
sj-pdf-1-spo-10.1177_17479541211018771 - Supplemental material for “Small steps, or giant leaps?” Comparing game demands of U23, U18, and U16 English academy soccer and their associations with speed and endurance
Supplemental material, sj-pdf-1-spo-10.1177_17479541211018771 for “Small steps, or giant leaps?” Comparing game demands of U23, U18, and U16 English academy soccer and their associations with speed and endurance by Ben Smalley, Chris Bishop and Sean J Maloney in International Journal of Sports Science & Coaching
Footnotes
Declaration of Conflicting Interests
The author(s) declared no potential conflicts of interest with respect to the research, authorship, and/or publication of this article.
Funding
The author(s) received no financial support for the research, authorship, and/or publication of this article.
References
Supplementary Material
Please find the following supplemental material available below.
For Open Access articles published under a Creative Commons License, all supplemental material carries the same license as the article it is associated with.
For non-Open Access articles published, all supplemental material carries a non-exclusive license, and permission requests for re-use of supplemental material or any part of supplemental material shall be sent directly to the copyright owner as specified in the copyright notice associated with the article.