
Abstract
The aim of the present study was to firstly, quantify the external training load (TL) of semi-professional soccer players during an annual season and secondly, to examine the influence of one (1MW) and two (2MW) match weekly microcycles. Data were collected from 24 semi-professional outfield soccer players during the 2018-2019 annual season using micro-electromechanical system (MEMS) devices for the following variables: Training duration (min), total distance (TD), Player Load (PL), high speed running (HSR) distance (5.5-7.0 m/s), and acceleration (ACC) efforts (>2 m/s2). Training sessions were defined as days before match day (i.e. MD minus), with match weeks broken down as either 1MW or 2MW. Data revealed higher TD, PL, and HSR distance on MD and MD-5 when compared to all other MD codes. MD-4 displayed significantly higher values compared to MD-1 (mean differences (Mdiff): TD: 785 ± 158 m; PL: 29 ± 9 au; HSR: 192 ± 63 m; ACC: 15 ± 3 #) and MD-2 (Mdiff: TD: 279 ± 137 m; HSR: 127 ± 54 m). During 2MW scenarios, both TD (Mdiff: 685 ± 328 m) and PL (Mdiff: 33 ± 14 au) were higher on MD-1 when compared to 1MW. However, lower values were observed for duration and HSR on MD-2 and MD-4 during 2MW compared to 1MW scenarios.These data suggest that there appears to be a progressive reduction in TD, PL, HSR and ACC leading into competitive matches based on MD- analysis. However, some variability exists in TL prescription as a result of different MW scenarios (i.e. 1MW vs. 2MW).
Introduction
Soccer is a high-intensity field-based invasion sport involving unstructured movement patterns which tax both the aerobic and anaerobic energy systems significantly. 1 In professional soccer players, the total distance covered during a competitive match is around 11–13 km, with players on average performing ∼60 sprints and 1150 m above 20 km.h−1. 2 In comparison, semi-professional players have been found to cover lower total distances and distances at high velocities. 3 The associated differences have been attributed to differences in technical demands required within the lower league systems. 4 Within football league systems, the majority of teams are classified as semi-professional, with typically only the top divisions being professional. In the UK, for example, the top four leagues (levels 1–4) are classified as professional, comprising 92 teams, whereas semi-professional leagues (levels 5–8) comprise of 296 teams. Due to budget limitations, semi-professional teams often have reduced ability to access sports science support and use of sports technology, such as micro-electromechanical systems (MEMS). However, recent advancements with both the accessibility and affordability of MEMS devices has increased attention to the monitoring and conditioning of players at these levels.
The monitoring of training load (TL) is now common practice across the different levels of soccer in order to closely monitor the load that player’s undertake for different training sessions and matches. 5 This approach allows coaches to plan, manipulate and evaluate a team’s training to optimize performance, with the assumption that a combination of training stimuli and sufficient recovery will improve adaptation to training and increase physical fitness. 6 Conversely, inappropriate training stimuli or too little recovery may result in an increased risk of injury/illness and reduction in physical preparation. 7 TL consists of both external and internal TL, with external TL referring to the physical work undertaken during exercise and internal TL being associated with the stress response to the work stimulus. 5 In soccer, external TL is typically measured in training and matches through either MEMS devices or optical-camera tracking systems, using metrics such as distances covered and relative intensity of different movements. 8 Internal TL is often quantified using heart rate (HR) telemetry and rating of perceived exertion (RPE). 8 However, the limited sensitivity of HR to detect sudden movement changes during intermittent exercise 9 and subjective nature of RPE monitoring may limit its appropriateness within soccer to monitor TL. 10 In addition, the aforementioned budget restraints in semi-professional teams limits the number of technological products that practitioners are able to afford (e.g. HR belts) and thus often have to choose the monitoring system that provides the most relevant data for their players.
The manipulation of external TL across in-season microcycles is of importance to soccer practitioners in order to ensure players adequately recover from the previous match and optimise preparation for the upcoming match. 11 During a soccer microcycle, each day is typically labelled according to the number of days prior to the next match (i.e. match day (MD)-). 12 For example, MD-1 would refer to one day before match day. Previous research in professional soccer has typically reported the lowest TL on MD-1 within the microcycle, with variations in loading patterns on the other remaining training days.11–19 Despite the available literature relating to professional soccer players, to the authors knowledge there are no current studies that have systematically quantified the external TL of semi-professional soccer players. Such data would be useful for coaches and practitioners in order to provide reference values for training practice and insight into periodization strategies.
An additional consideration that has typically received limited attention is that associated with how match scheduling, and congested match-schedules, influence weekly TL. It is well considered in relation to professional match analyses that congested schedules can result in impairments of tactical 20 and physical21–23 performance, and if not appropriately managed, can result in increased injury risk.24–26 It would therefore be expected that practitioners would consider this, and ultimately manage TL practices in the lead up and between congested schedules to cope with the potential enhanced demands placed upon the players during match-play. It is therefore somewhat surprising that to the authors knowledge limited literature exists in relation to how practices are manipulated to help cope with these potentially enhanced demands. 27 Anderson et al. 14 found that daily TL periodisation was similar in both one- and two-match weeks within elite professional soccer players. Knowledge of such practices would be pertinent for all levels of soccer, but it is arguably of additional importance in semi-professional teams who are regularly exposed to congested schedules. Such teams may have limited capacity to rotate squads or appropriately condition and monitor their players. Furthermore, through the quantification of TL during the in-season phase we will be able to utilise the information to understand the differences in TL demands compared with know data for professional level players for those looking to transition through the different levels of the playing pyramid.
Therefore, the aim of the present study was to systematically quantify the external TL of semi-professional soccer players across both training and competitive matches during the season. A secondary aim of the study was to examine the influence of one and two match weekly microcycles on the external TL.
Methods
Study design
The design of this study was observational in nature in order to quantify the TL practices of a semi-professional English soccer club. TL data were collected using MEMS devices over a 33-week in-season period during the 2018-2019 annual season from August 2018 – April 2019. The team competed in four official competitions across the season including: FA Cup, FA Trophy, District Cup and League Competition. This meant the team would compete in either one or two matches per 7 days (Monday to Sunday) (1 match week (MW) × 14, 2 MW × 18).
Participants
Twenty-four professional outfield soccer players (defenders = 7; midfielders = 11; forwards = 6; age: 26 ± 6 years; height: 181 ± 8 cm; weight: 79.7 ± 7.8 kg) employed by a team in the English National League North (level 6 of the English football league system) took part in this study. Goalkeepers were excluded from data analysis due to the different nature of their positional demands. All the players were notified of the research design and provided formal written consent. This study was approved by the local university ethics committee.
Study procedures
Only main team training sessions were considered for analysis. Alternative sessions (e.g. rehabilitation, individual sessions, etc.) were excluded to maintain consistency in data in line with previous research. 11 , 16 During a typical 1MW, the players trained 3 times per week in the lead up to matches. Within a 2MW, the matches were typically played on a Tuesday and Saturday, with recovery and match preparation training sessions in between matches. Inclusion criteria for individual datasets are that players must be free of injury and available for team selection and must have completed the full training session. All training sessions included elements of physical, technical and tactical drills which were administered by the club’s coaches and not influenced by the researchers. Training sessions were defined as days before match day (i.e. MD minus). 11 Match data (excluding warm up/cool down) were collected during the in-season period. Individual observations were included if players played at least 60 min, with values recalculated to 90 min if players didn’t complete the full match 18 (overall individual match observations = 536).
The TL data during both training and matches were collected using a MEMS device (PlayerTek™, Catapult Sports Group, Australia). This device provides position, velocity and distance data sampling at 10-Hz and is integrated with a 100-Hz tri-axial accelerometer and 100-Hz triaxial magnetometer. The device has recently been shown to produce similar TL data outputs when compared to a previously validated differential MEMS device. 28 The device was worn by the players between the scapula and secured using a custom-made fitted vest supplied by the manufacturer. All data handling and collection procedures were in line with those previously recommended in the literature. 29 MEMS data was downloaded following each session using the manufacturers proprietary software (PlayerTek™ Cloud, Catapult Sports Group, Australia). The following variables were selected for analysis as they are commonly used by soccer practitioners 8 : Training duration (min), total distance (TD) (m), Player Load (PL) (au), high speed running (HSR) distance (5.5-7.0 m/s) (m), sprint (SPR) distance (>7 m/s) (m) and acceleration (ACC) efforts (>2 m/s2).
Statistical analyses
Data were analysed using linear mixed modelling (LMM) using the statistical software IBM SPSS Statistics (Version 25, Chicago, IL, USA). A LMM was utilised to overcome the assumption of independence, and also because of the flexibility that this method has in accounting for the altering sample sizes between groups with repeated measures. 30 All models began as a null and progressed to more complex parsimonious hierarchical models. Days in relation to the match (i.e. MD minus and number of matches per week (1MW and 2MW) were treated as categorical fixed effects. Random effects were associated with the individual players and each individual day. A basic variance components model was executed to calculate the intraclass correlation (ICC) of the random factors for individual day code and player to determine if any contributed significance variance to the dependent variable. Given the large sample sizes, Wald Z statistics were utilised to test the null hypothesis that the population variance is zero. If rejected, the proposed random factors were included in subsequent larger models. The covariance structure of the random factors was set to variance components in all models. Model fit was assessed using Akaike’s information criterion (AIC). For each dependent variable, AIC revealed the model that best fit the data utilised the first order auto-regressive (AR-1) repeated covariance structure for the repeated measures. Significance was set at P<0.05. Where appropriate, post hoc analyses (LSD) and the inclusion of 95% confidence intervals (CI) of the differences is reported. All data are represented as mean difference ± standard error.
Results
Variance calculations
Table 1 depicts the ICC’s (%) of the random factors accounted for in the linear mixed model. The individual player and individual day code contributed significant variance to all dependent variables and was subsequently included in all of the larger hierarchical models.
The ICC’s (%) of each random factor considering all of the dependent variables.
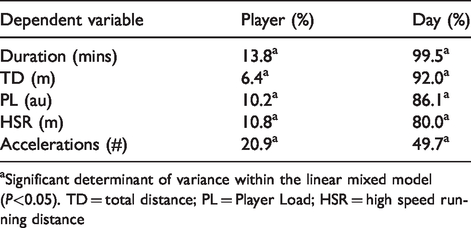
aSignificant determinant of variance within the linear mixed model (P<0.05). TD = total distance; PL = Player Load; HSR = high speed running distance
Main effects for MD code for all metrics.
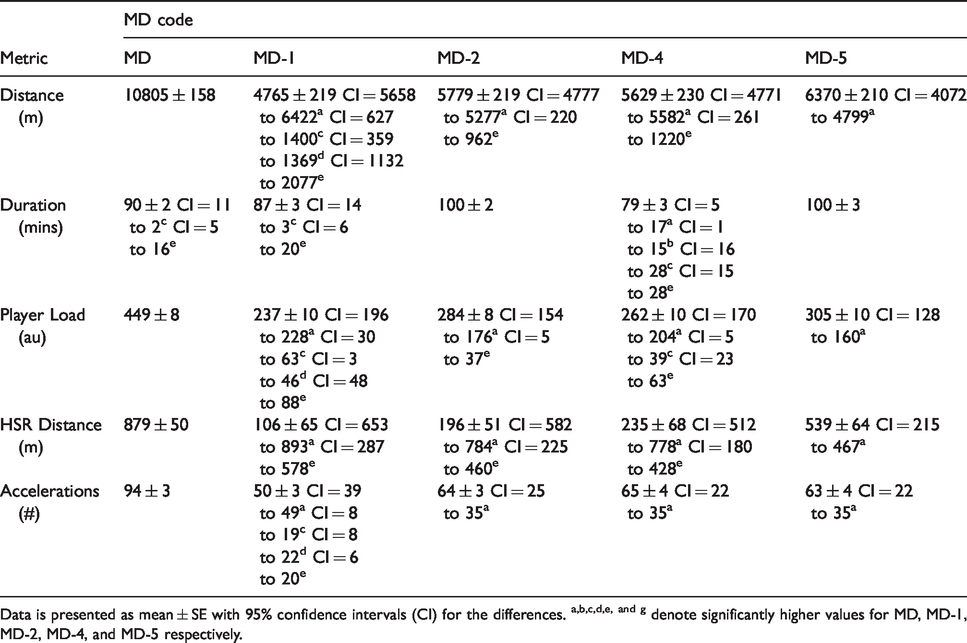
Data is presented as mean ± SE with 95% confidence intervals (CI) for the differences. a,b,c,d,e, and g denote significantly higher values for MD, MD-1, MD-2, MD-4, and MD-5 respectively.
Duration
A significant main effect for MD code was observed (P<0.001), with higher values recorded on MD and MD-1 when compared to MD-4 (Table 2). Higher values were also recorded on MD-2 when compared to MD, MD-1, and MD-4. Likewise, values recorded on MD-5 were higher than those recorded on MD, MD-1, and MD-4. A significant interaction was identified (P<0.001) for MD code days and GPW, with higher values on MD-2 and MD-4 during a 1 GPW microcycle (MD-2 = 106 ± 2 mins; MD-4 = 94 ± 3 mins) when compared to a 2 GPW microcycle (MD-2 = 95 ± 2 mins, CI = 8 to 15 mins; MD-4 = 64 ± 4 mins, CI = 22 to 39 mins) (Figure 1(a)).
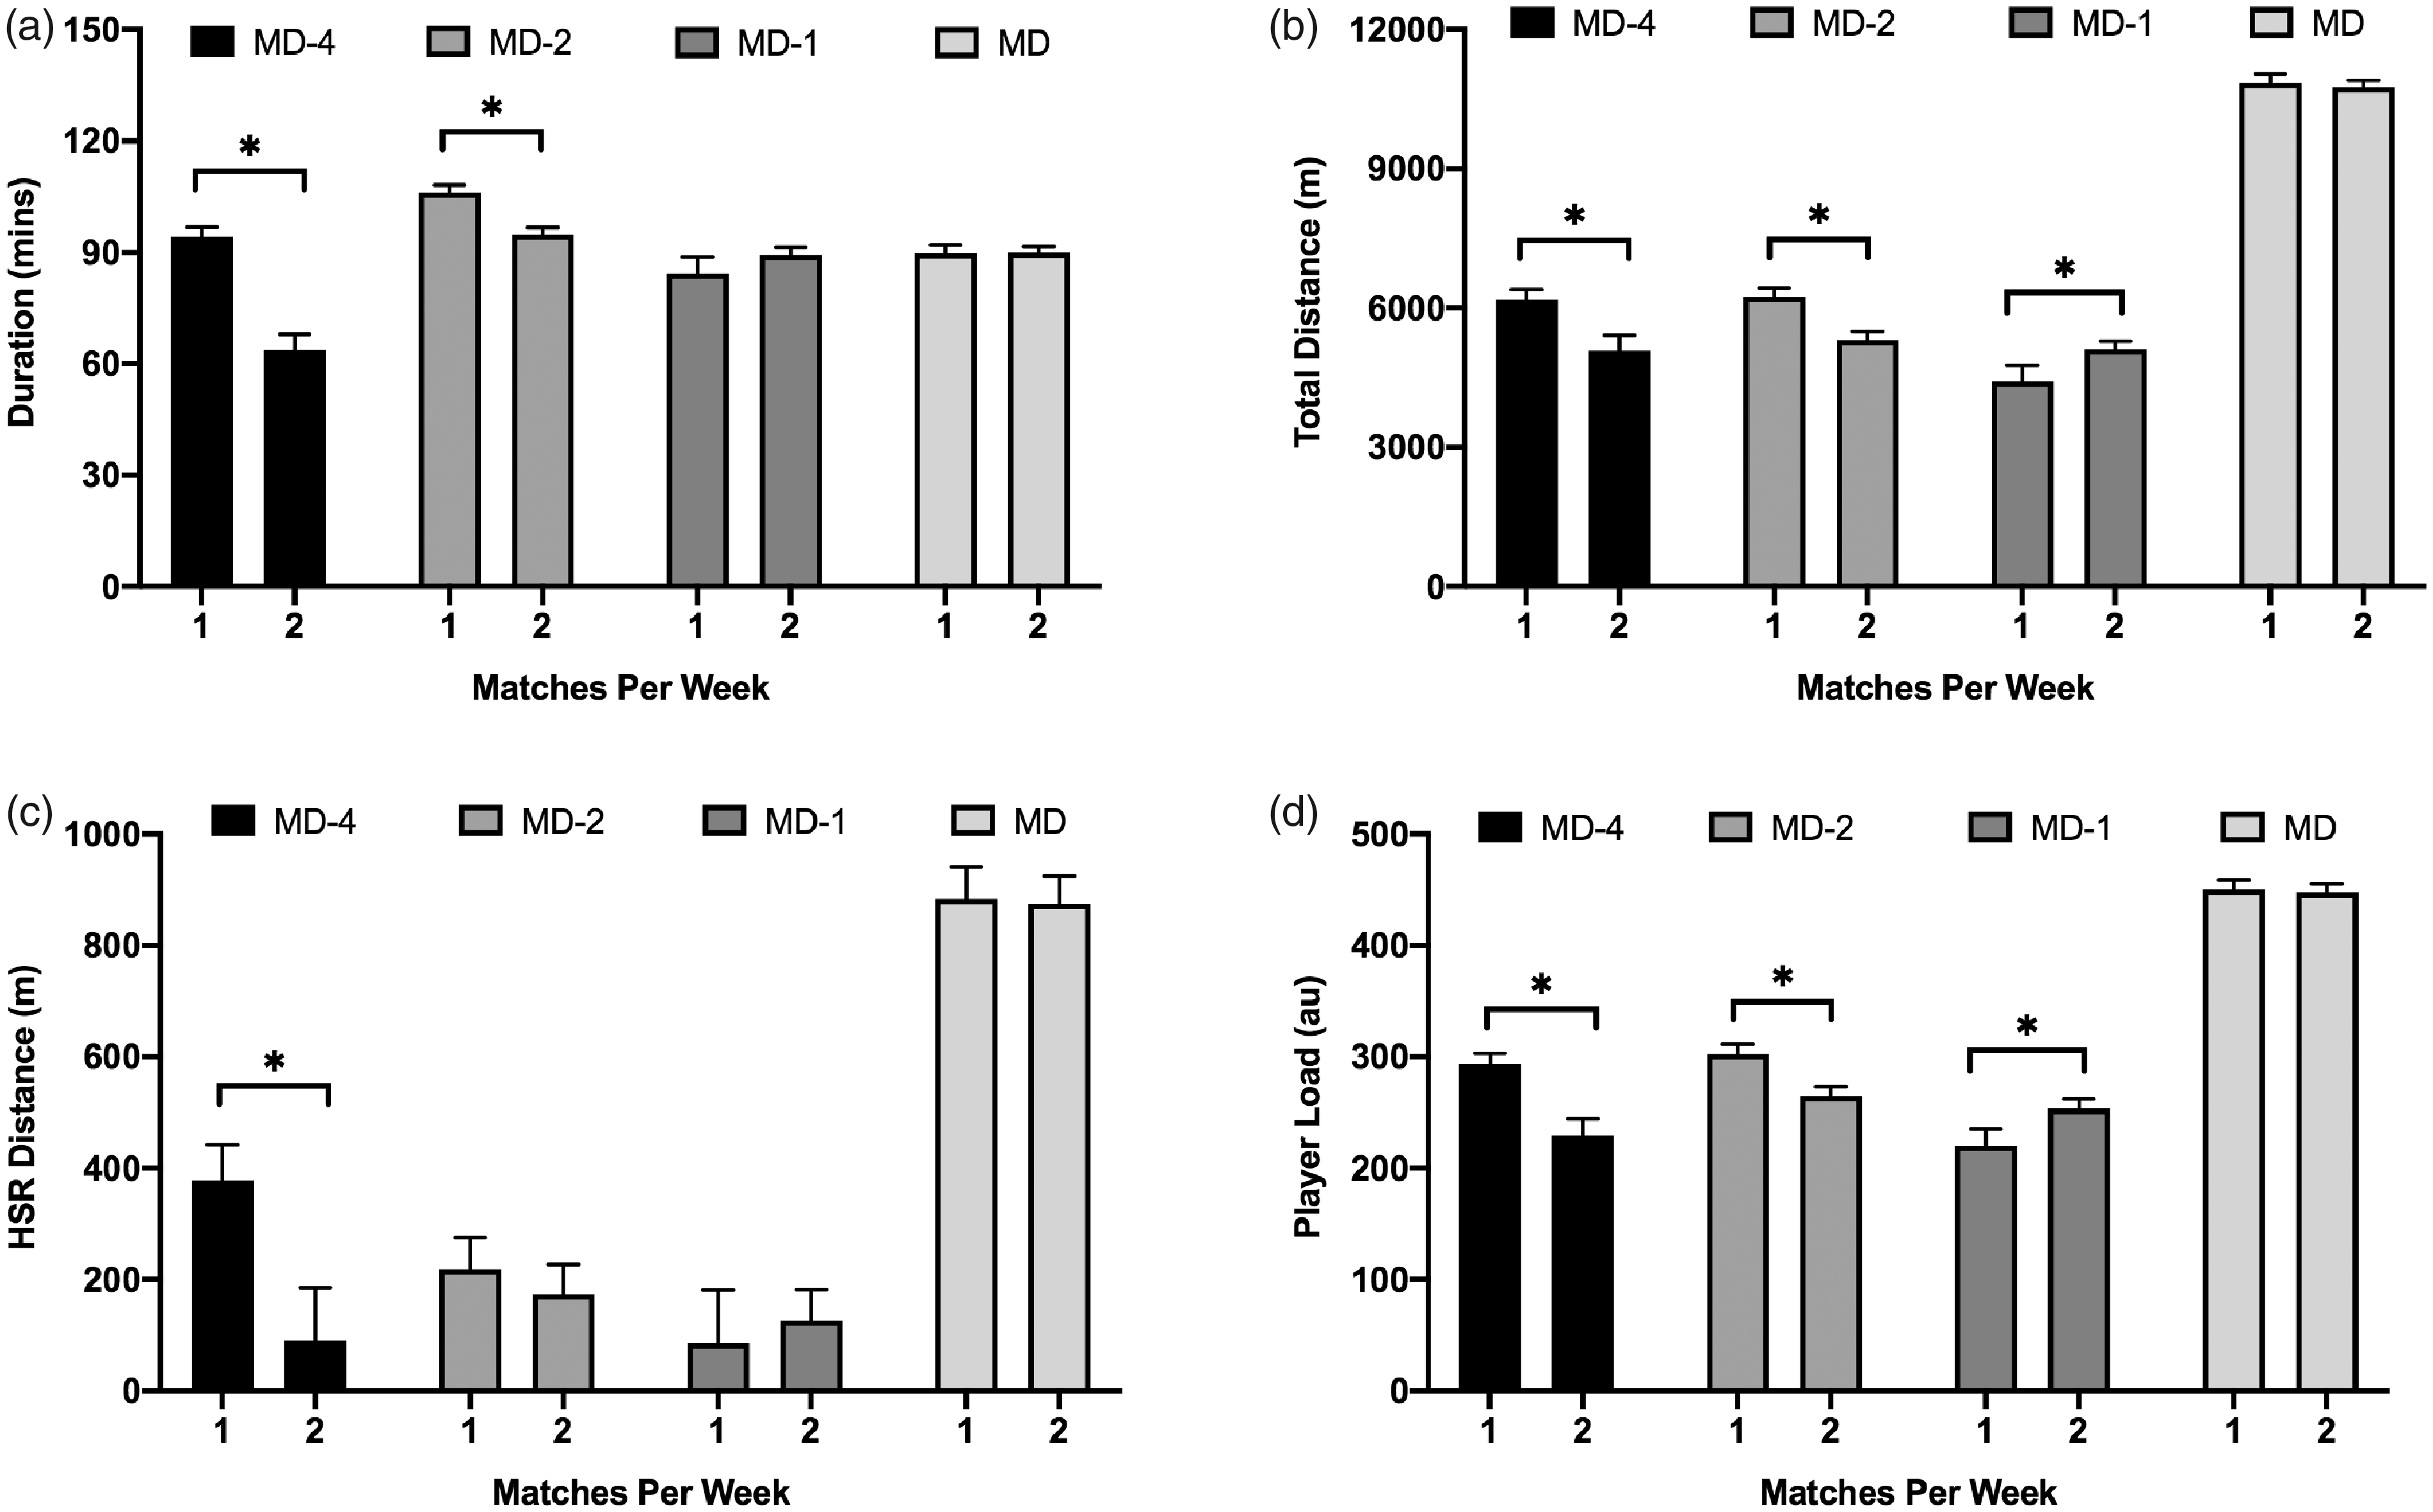
Training load data for (a) duration; (b) total distance; (c) HSR distance; (d) player load in respect to days relative to match day in 1MW and 2MW scenarios. HSR = high speed running distance (5.5-7.0 m/s); MD- = match day minus; 1MW = 1 match per week; 2MW = 2 matches per week. * denotes significant difference between 1MW and 2MW scenarios.
Total distance
A significant main effect for MD code was observed (P<0.001), with higher values recorded on MD when compared to all other days (Table 2). Higher values were also recorded on MD-5 when compared to MD-1, MD-2, and MD-4. Likewise, values recorded on MD-2 and MD-4 were higher than those recorded on MD-1. A significant interaction was identified (P<0.001) for MD code days and MW, with higher values on MD-1 during a 2 MW microcycle (5108 ± 180m) when compared to a 1 MW microcycle (4423 ± 342m; CI = 42 to 1327m). The opposite was observed for both MD-2 (1 MW = 6243 ± 180m; 2 MW = 5315 ± 173m; CI = 646 to 1211m) and MD-4 (1 MW = 6184 ± 212m; 2 MW = 5075 ± 335m; CI = 478 to 1739m) (Figure 1(b)).
High speed running distance
A significant main effect for MD code was observed (P<0.001), with higher values recorded on MD when compared to all other days (Table 2). Higher values were also recorded on MD-5 when compared to MD-1, MD-2, and MD-4. A significant interaction was identified (P = 0.027) for MD code days and MW, with higher values on MD-4 during a 1 MW microcycle (378 ± 64 m) when compared to a 2 MW microcycle (91 ± 95 m; CI = 113 to 463 m) (Figure 1(c)).
Player load
A significant main effect for MD code was observed (P<0.001), with higher values recorded on MD when compared to all other days (Table 2). Higher values were also recorded on MD-5 when compared to MD-1, MD-2, and MD-4. Likewise, values recorded on MD-2 and MD-4 were higher than those recorded on MD-1. The values recorded on MD-2 were also higher than those on MD-4. A significant interaction was identified (P<0.001) for MD code days and MW, with higher values on MD-1 during a 2 MW microcycle (254 ± 9 au) when compared to a 1 MW microcycle (220 ± 15 au; CI = 7 to 60 au). The opposite was observed for both MD-2 (1 MW = 303 ± 9 au; 2 MW = 265 ± 8 au; CI = 26 to 50 au) and MD-4 (1 MW = 294 ± 10m; 2 MW = 230 ± 15m; CI = 38 to 90 au) (Figure 1(d)).
Number of accelerations
A significant main effect for MD code was observed (P<0.001), with higher values recorded on MD when compared to all other days (Table 2). Higher values were also recorded on MD-2, MD-4, and MD-5 when compared to MD-1. Due to zero inflated non-normality of the 2 MW data, ACC data was unable to be considered in relation to the influence of different MW scenarios.
Discussion
The aim of the present study was to systematically quantify the external TL of semi-professional soccer players across both training and competitive matches during a season. The secondary aim of the study was to examine the influence of one and two match weekly microcycles on the external TL. Our data suggests that there is a progressive reduction in TD, PL, HSR and ACC in the lead up to competitive matches. However, when faced with congested fixture scheduling (i.e. 2MW), TL was kept similar (MD-2: HSR and Duration) or higher (MD-1: TD and PL) compared with a 1MW scenario. This may be due to coaches attempting to condense match preparation into a shorter time frame when leading into competitive matches.
When comparing the TL across different MD- days during a microcycle, it was found that TL was lowest on MD-1 in agreement with previous studies in professional soccer players.11–19 In addition, there appeared to be a progressive reduction in TL (e.g. HSR distance and TD) from MD-5 to MD-1, which suggests an element of TL tapering in line with previous studies. 16 , 18 Unfortunately, as there is no published data on the TL practices of semi-professional players, we are not able to make direct comparisons with the present study. Interestingly, the volume of acceleration efforts within training remained similar across all training days in the lead up to matches (mean: MD-5 = 64, MD-4 = 68, MD-2 = 67, MD-1 = 54 efforts). Osgnach et al. 31 highlighted the increased energy cost of rapid changes in velocity compared to constant speed motion, which may result in excessive fatigue. Therefore, it was surprising that there was a lack of a periodized approach within the training microcycles when considering this TL variable. This may have occurred due to coaches typically including small sided games (SSG) within their daily training drills which has been shown to include a high number of acceleration efforts. 32 However, further data around the fatigue response from the players in this study following the volume of across each MD- day would provide additional insight into appropriate periodization practices in soccer. Whilst SSG are an important training tool to induce a significant internal TL response, they can often overemphasise the biomechanical responses, and thus potentially increasing fatigue and injury risk. 33
Semi-professional English soccer players typically play two matches per week during the in-season phase due to their involvement in multiple competitions. When considering the MD- approach within 1 and 2 match per week scenarios, it was found that total distance and Player Load were both higher on MD-1 in the 2MW scenario. In addition, HSR distance was similar across both MD-2 (mean: 1MW = 82 m; 2MW = 113m) and MD-1 (mean: 1MW = 252 m; 2MW = 213m) in both match per week scenarios, which indicates that fixture congestion was not factored in when planning training intensity over higher velocities. This notion agrees with Anderson et al. 14 who found similar daily TL patterns in both one and two match weeks in elite English Premier League soccer players. Dupont et al. 25 found in top level French soccer players that when soccer players compete in two matches per week, despite similar physical outputs between matches, the rate of injury significantly increases compared to a 1MW scenario. This would suggest that coaches need to adjust their TL between matches in order to account for this increased accumulated match load. Although TL may arguably be able to be maintained in professional soccer due to the use of squad rotation practices, ∼40% of players are required to complete all matches during a two or three game microcycle. 27 Due to financial limitations, and the subsequent limitations this may have on squad sizes, the ability to rotate players for congested matches is potentially less achievable in semi-professional soccer and, as such, the manipulation of weekly TL in the build-up to congested schedules is of particular importance for this cohort. Therefore, it could be suggested that practitioners need to evaluate their MD- structure across different MW scenarios as per the present study to gain further insight into their periodization practices.
As with most applied studies, there are some limitations and directions of future research from this study. From the available data set, we were only able to quantify the external TL of the soccer players. However, future work should look to include internal TL measures and physical testing data to further our understanding of the ‘dose-response’ effect of TL scheduling within soccer training periodization. However, given the limitations previously highlighted around current commonly used internal TL measures, research should focus on developing the sensitivity and practicality of using such methods in practice. It should also be noted that the present data only quantifies TL practices of a single club, so any findings cannot be generalised across other sample populations. Despite this limitation, the present study is the first to the authors knowledge to consider the TL practices during congested and non-congested match schedules in semi-professional soccer players.
In summary, we provide novel data on the external TL practices of semi-professional soccer players across a longitudinal period. It must be noted that our data is limited to a single club and caution should be made when generalising to the whole semi-professional soccer population. Our data suggests that there appears to be a progressive reduction in TL in the lead up to competitive matches. However, when faced with congested fixture scheduling (i.e. 2MW), TL was kept similar at MD-2 and MD-1 compared with a 1MW scenario. Coaches and sports science practitioners should manipulate their TL prescription based on the different MW scenarios to appropriately periodize their training practices to ensure maximal preparation and minimize injury risk. Future research should also evaluate the relationship between TL across different MW scenarios and injury rates within this cohort of players.
Footnotes
Acknowledgements
The authors would like to thank the players, coaching and medical staff for their cooperation throughout the present study.
Declaration of conflicting interests
The author(s) declared no potential conflicts of interest with respect to the research, authorship, and/or publication of this article.
Funding
The author(s) received no financial support for the research, authorship, and/or publication of this article.