
Abstract
The block start and initial steps following block exit are fundamental aspects of sprinting and their development is key to junior athletes’ progression. This study assessed the difference in force production between elite senior (including two sub-10 s 100-m sprinters) and junior academy sprinters during the block phase and the first two steps of a sprint. Thirty-seven male sprinters (17 senior, 20 junior) performed a series of maximal effort 20–40 m acceleration from blocks on an indoor track, with the ground reaction forces produced during the block phase and first two steps measured using force platforms. Senior athletes produced better block-phase performances (average horizontal external power; 15.52 ± 1.48 W/kg, M ± SD) compared with the juniors (12.37 ± 2.21 W/kg; effect size ± 90% confidence interval = 1.28 ± 0.38). However, force production during the initial two steps was comparable across groups. Specifically, senior athletes exhibited higher relative force production and ratio of forces during the early (∼15–35%) block phase and higher anteroposterior forces during the transition from bilateral to unilateral pushing (58–62% of the block phase). Front foot force production was also found to differentiate senior and junior groups at rear block exit (∼55% of the block phase). This may be a required response to the greater centre of mass displacement in order to prevent over-rotation in the senior athletes during the front block pushing phase. Collectively, these results indicate that the progression of junior athletes is non-uniform across the block phase and subsequent two contacts, which should be considered when attempting to progress junior athletes towards senior ranks.
Introduction
In order to guide athletic development and support the transition of young sprinters to senior status in sprinting, one important issue is to identify any kinetic factors that differentiate junior and senior athletes. The sprint start is a highly complex skill with high-level performances characterised by coordinated movement about multiple joints.1,2 Undoubtedly, large capacities of lower limb strength and power are essential to the sprint start as the rate at which an athlete can increase their kinetic energy (average horizontal external power) dictates performance level. 3 Specifically, better sprint starters have consistently been found to be those who exhibit greater anteroposterior components of force4,5 and higher rates of force development, 6 particularly in the early parts of the rear block push. 7
Enhancing sprint start performance is, however, likely to be more complex than simply increasing peak force and/or power production. For example, the ability to orientate the force vector more horizontally (in conjunction with the capacity to produce high forces) has been linked to superior block-phase performance,4,5,8 particularly during the early block push phase. 9 Moreover, waveform analyses have revealed that it could in fact be the application of forces lower than the applied peak force that are related to better sprint start performance, particularly for the front block.7,9,10 Thus, discrete analysis of peak forces may neglect important information and the consideration of the entire one-dimensional curves relating to both the force orientation and magnitude in the analysis of sprint start performance is evidently important.
High anteroposterior force development is also required in the initial ground contact phases after block exit and the ability to direct the resultant ground reaction force vector more horizontally has been associated with better performances during early acceleration. 4 These ground contact periods consist of a braking and propulsive phase 11 across which an athlete’s centre of mass horizontal velocity will decrease and increase, respectively. As net horizontal impulse determines velocity change, performance can be enhanced by decreasing the braking impulse, increasing the propulsive impulse or both. During the initial steps, the propulsive phase accounts for the majority of the ground contact duration 4 and forces produced during propulsion (rather than the braking phase) have been associated with average horizontal power generated. 12
Whilst force production during the sprint start has been widely studied, the progression of sprinters from junior to senior ranks has, however, received much less attention in the literature. Growth, maturation and the associated changes in anthropometry presumably play important mediating roles. Indeed, senior sprinters were previously shown to exhibit a more mesomorphic profile with both larger limb circumference and higher skeletal muscle mass than their adolescent counterparts. 13 As strength capacity is largely dependent on muscle cross-sectional area, 14 these previously observed anthropometric differences presumably have implications for junior athletes’ force production. Indeed, previous discrete analyses confirmed peak anteroposterior force and horizontal power to be higher in senior compared with junior athletes, with rear block force production and lower (more horizontal) projection angles across the first two steps revealed as performance-differentiating factors. 15
To date, the few studies investigating the kinetic factors differentiating senior and junior athletes have included only discrete analyses and potential differences between force waveforms are yet to be fully explored. The aim of this study, therefore, was to understand the differences in sprint start performances between international-level senior athletes and junior academy athletes by assessing the ground reaction force waveforms produced during the block phase and the first two steps of a sprint.
Methods
Seventeen male senior (20 years old or above) sprinters (age = 26.0 ± 5.1, mass = 75.8 ± 8.1 kg and height =179.5 ± 7.3 cm) and 20 male youth academy (under 20 years old) sprinters (age = 15.9 ± 1.6, mass = 61.6 ± 6.2 kg and height = 172.4 ± 6.7 cm) were asked to perform a series (between one and eight) of maximal effort 20–40 m accelerations from blocks on an indoor track. Two of the senior athletes had previously recorded a 100-m time of less than 10 s. Unfortunately, 100-m personal best (PB) times were not available for all junior athletes due to a lack of accurate official records of some local competitions. However, the percentage differences between the mean 100-m PBs (where available) for the senior and junior groups, and the World Records for the same age groups were 8.2% and 12.2%, respectively. The data were collected as part of the routine sport science support provided to the athletes, to which all athletes (and their parents, where appropriate) had consented. To ensure confidentiality, all data were pseudonymised before analysis. Sessions were carried out as part of their regular training with a coach present to direct the warm up. Athletes wore their usual spikes and performed the sprint starts using their preferred block settings.
An array of six Kistler force platforms (four 9287CA and two 9281E; Kistler Instruments Ltd, Switzerland; sampling at 1000 Hz) was used to capture the ground reaction forces produced by all four limbs during the block phase and those produced during the first two contact periods (Figure 1). A laser gun (Laveg, LDM-300C; Germany) was used to obtain a time to 10 m for each run using a 5-point moving average, which provided a competitive element and instantaneous feedback to the athletes. Due to the nature of the testing session and the requirement for quick feedback, a 7-point moving average was applied to the force data. A comparison with an alternative approach of applying a Butterworth filter revealed that differences in smoothing made only small differences (<0.3%) to discrete force variables (e.g. peak anteroposterior and vertical force). Additionally, further checks highlighted that the smoothness factor (full width half maximum) of the curves (an important characteristic for the waveform analysis used in this study) changed minimally with the different smoothing techniques (only a ∼0.001 difference in z-star threshold, which is usually around 3.1–3.5 for this data set).
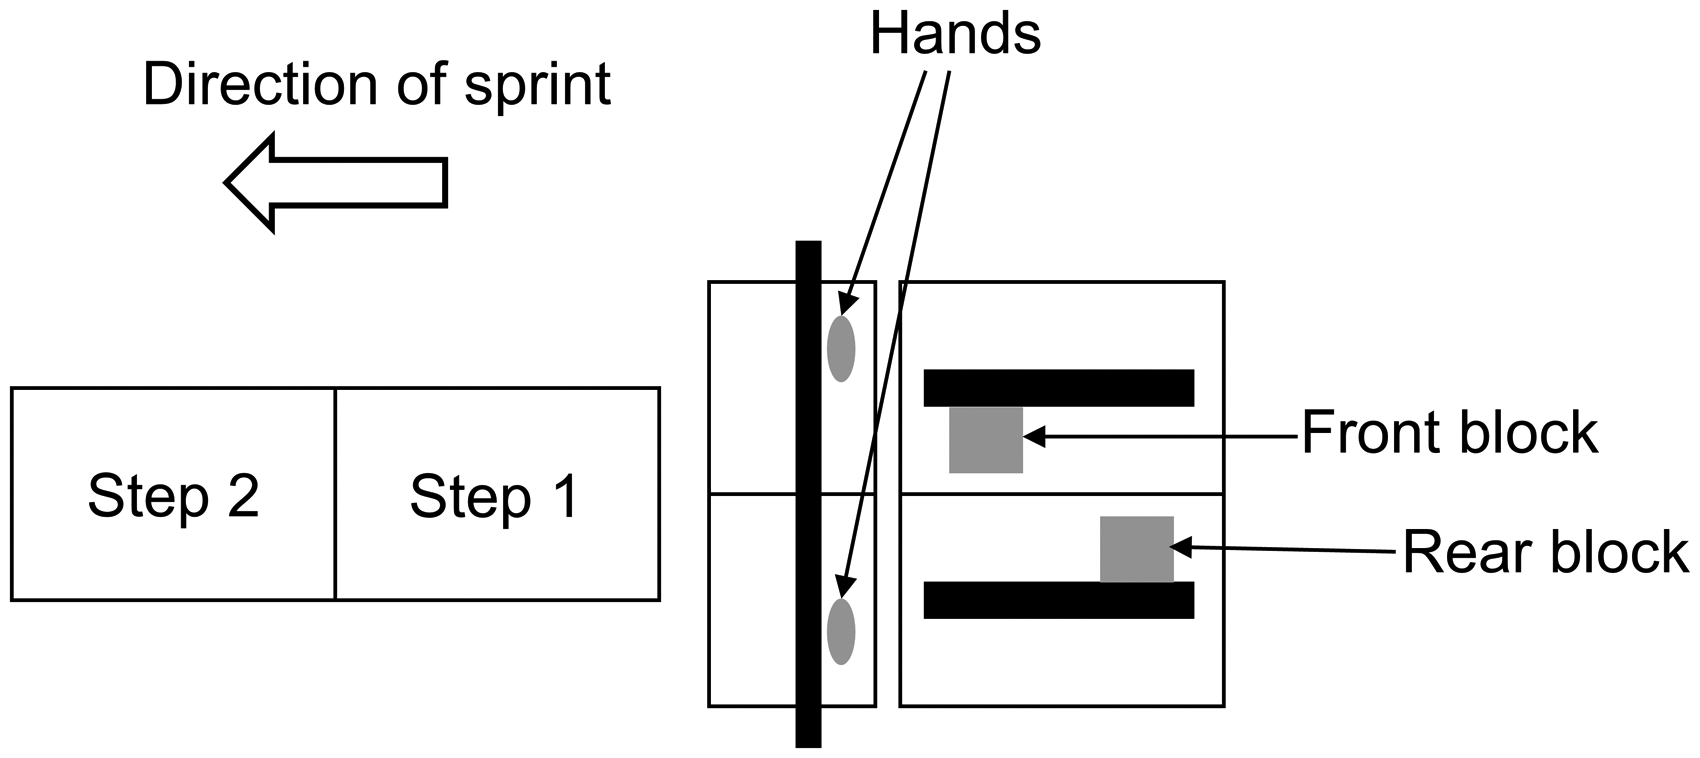
Schematic of experimental set-up.
Anteroposterior and vertical force data from all four of the force plates under the blocks and hands were summed across each block phase, after which resultant force (sagittal plane) was calculated. For the first and second stance, resultant force was computed in the same way for the data from each force platform. Additionally, in line with previous work, 16 the ratio of the anteroposterior component to resultant force was also computed. The onset of movement was defined as the first instant where total vertical force exceeded 20 N above the steady body weight force and remained above this threshold for at least 30 ms. Block exit was defined as the first instant when vertical force fell below 20 N and 20 N vertical force thresholds were also used to define touchdown and take-off for the first and second step. The impulse–momentum relationship was used to calculate horizontal and vertical velocity of the body’s centre of mass from the summed forces, and the horizontal impulses generated against each block (rear and front leg) and by the arms (combined) were also computed separately. Block exit velocity was combined with block push duration to provide average horizontal external power as the performance criterion. 3 Continuous horizontal external power curves (the product of anteroposterior force and horizontal velocity) were also calculated. Force and power data were expressed relative to body mass. For each stance phase, average horizontal external power was calculated by inputting horizontal velocity (initial and final, calculated from the force data) and ground contact duration into the equation provided by Bezodis et al. 3
Differences in the discrete force variables between groups were evaluated standardised differences (effect sizes). A threshold of 0.2 was set for the smallest practically worthwhile effect 17 through which clear (positive or negative) and unclear differences were defined using 90% confidence intervals (CIs). Effects were deemed clear if these were greater or lesser than 0.2 or −0.2 threshold, respectively, and the 90% CI did not overlap the opposite threshold. Effect size values were classified as follows: <0.2 trivial, 0.2–0.6 small, 0.6–1.2 moderate, 1.2–2.0 large and >2.0 very large.
For the waveform analyses, force (resultant, anteroposterior, vertical and ratio of force) and instantaneous power data across the block phase were registered to 101 nodes. Open-source statistical parametric mapping (SPM) software (Pataky, 2012) was then used to assess for differences between the entire force curves of the two groups, using the same methods as described by Colyer, Nagahara. 18
Results
The mean (± SD) average horizontal external powers produced by the senior athletes across the block phase, the first ground contact phase and the second ground contact phase were 15.5 ± 1.5, 25.1 ± 3.6 and 26.7 ± 3.6 W/kg, respectively. For the junior athletes, corresponding values were 12.4 ± 2.2, 23.1 ± 2.6 and 24.9 ± 4.5 W/kg. Therefore, there was a large effect size between the average horizontal external power produced by the senior compared with the junior athletes on the blocks (effect size ± 90% CI = 1.28 ± 0.38). Conversely, only a small effect was observed for the first and second step (effect sizes ± 90% CI = 0.59 ±0.53 and 0.44 ± 0.55, respectively). Average horizontal external power values achieved by individual athletes are illustrated in Figure 2.
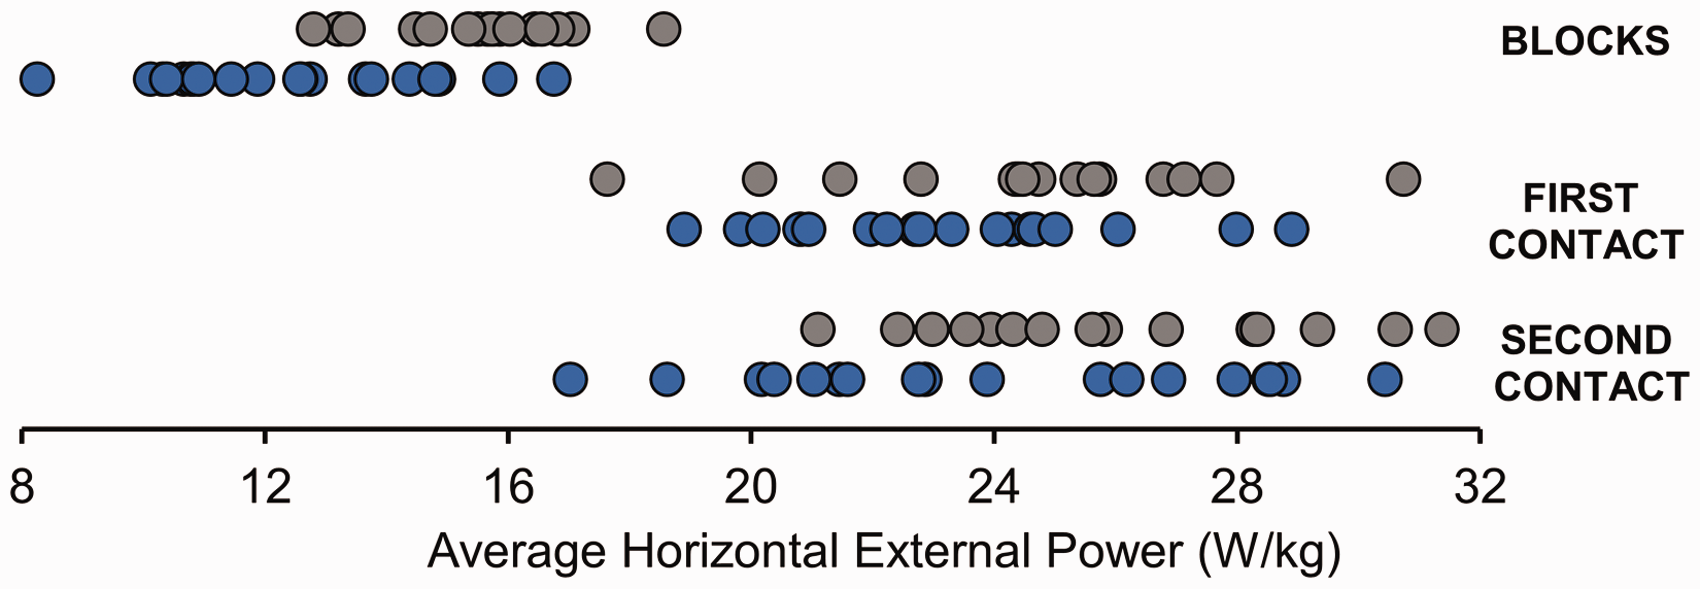
Average horizontal power produced by senior (grey) and junior (blue) athletes across the block phase, first ground contact and second ground contact.
Senior athletes produced this higher average horizontal external power on the blocks both by generating greater (6% higher) horizontal block exit velocity and spending less time pushing against the blocks (11% lower) compared with the junior athletes (Table 1). Conversely, similar vertical block exit velocity was observed across groups (0.60 vs. 0.61 m/s for senior and junior athletes, respectively). Although senior athletes had a slightly more horizontal centre of mass projection angle than junior athletes (10.2 ± 2.0 vs. 11.0 ± 2.1), this was small in magnitude (effect size ±90% CI = −0.42 ± 0.56). Time to 10 m was lower (large effect) for senior (1.640 ± 0.045 s) versus junior athletes (1.706 ± 0.063 s; effect size ± 90% CI = 1.22 ± 0.36).
M ± SD discrete performance variables relating to the block phase, first stance phase and second stance phase and the differences between senior and junior athletes.
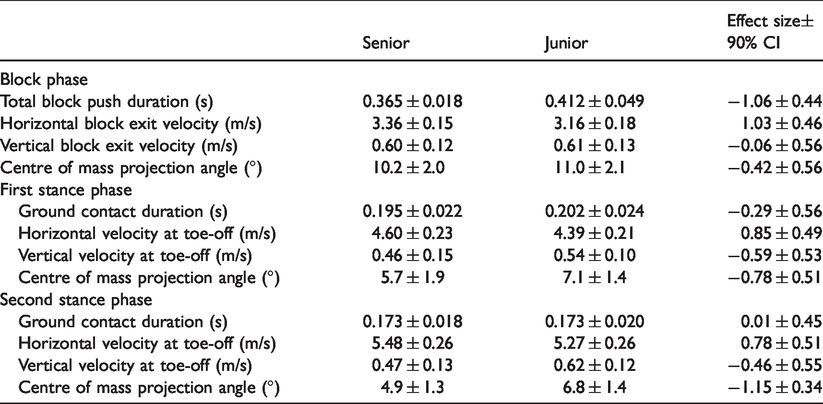
For both the first and second stance phases, ground contact durations were similar (unclear effect) across groups (effect sizes ± 90% CI were −0.29 ± 0.56 and 0.01 ± 0.45, respectively). However, there were small differences in average horizontal external power and moderate differences in horizontal velocity at toe-off, with between 7–8% and 4–5% higher (respectively) values reported in senior compared with junior athletes across the two stance phases (Table 1). A small group effect on vertical velocity was also observed for both the first and second stance phases. Consequently, senior athletes’ centre of masses were projected more horizontally than the junior athletes from both stance phases, with moderate effects observed (effect sizes ±90% CI were −0.78 ± 0.51 and −1.15 ±0.34 for first and second ground contact, respectively).
Waveform analyses revealed that horizontal block power was higher from 16% to 64% of the total block phase for the senior athletes compared with the juniors (Figure 3). No differences in the continuous power curves were observed across the first stance. However, the senior athlete group then exhibited higher horizontal power than the junior group from 10% to 19% of the second stance phase (Figure 3). Further, the force curves revealed differences in force production during the initial ∼15–35% of the block phase (Figure 4). Specifically, resultant force, anteroposterior force and vertical force were higher for senior, compared with junior, athletes between 21–31%, 18–31% and 22–30% of total block push duration, respectively. Additionally, senior athletes exhibited a higher ratio of force (anteroposterior component to resultant) between 15% and 35% of the block phase. Senior athletes also produced higher anteroposterior forces from 58% to 62% of block push duration, which corresponded to the approximate part of stance when the rear foot left the block (55% of the block phase on average).
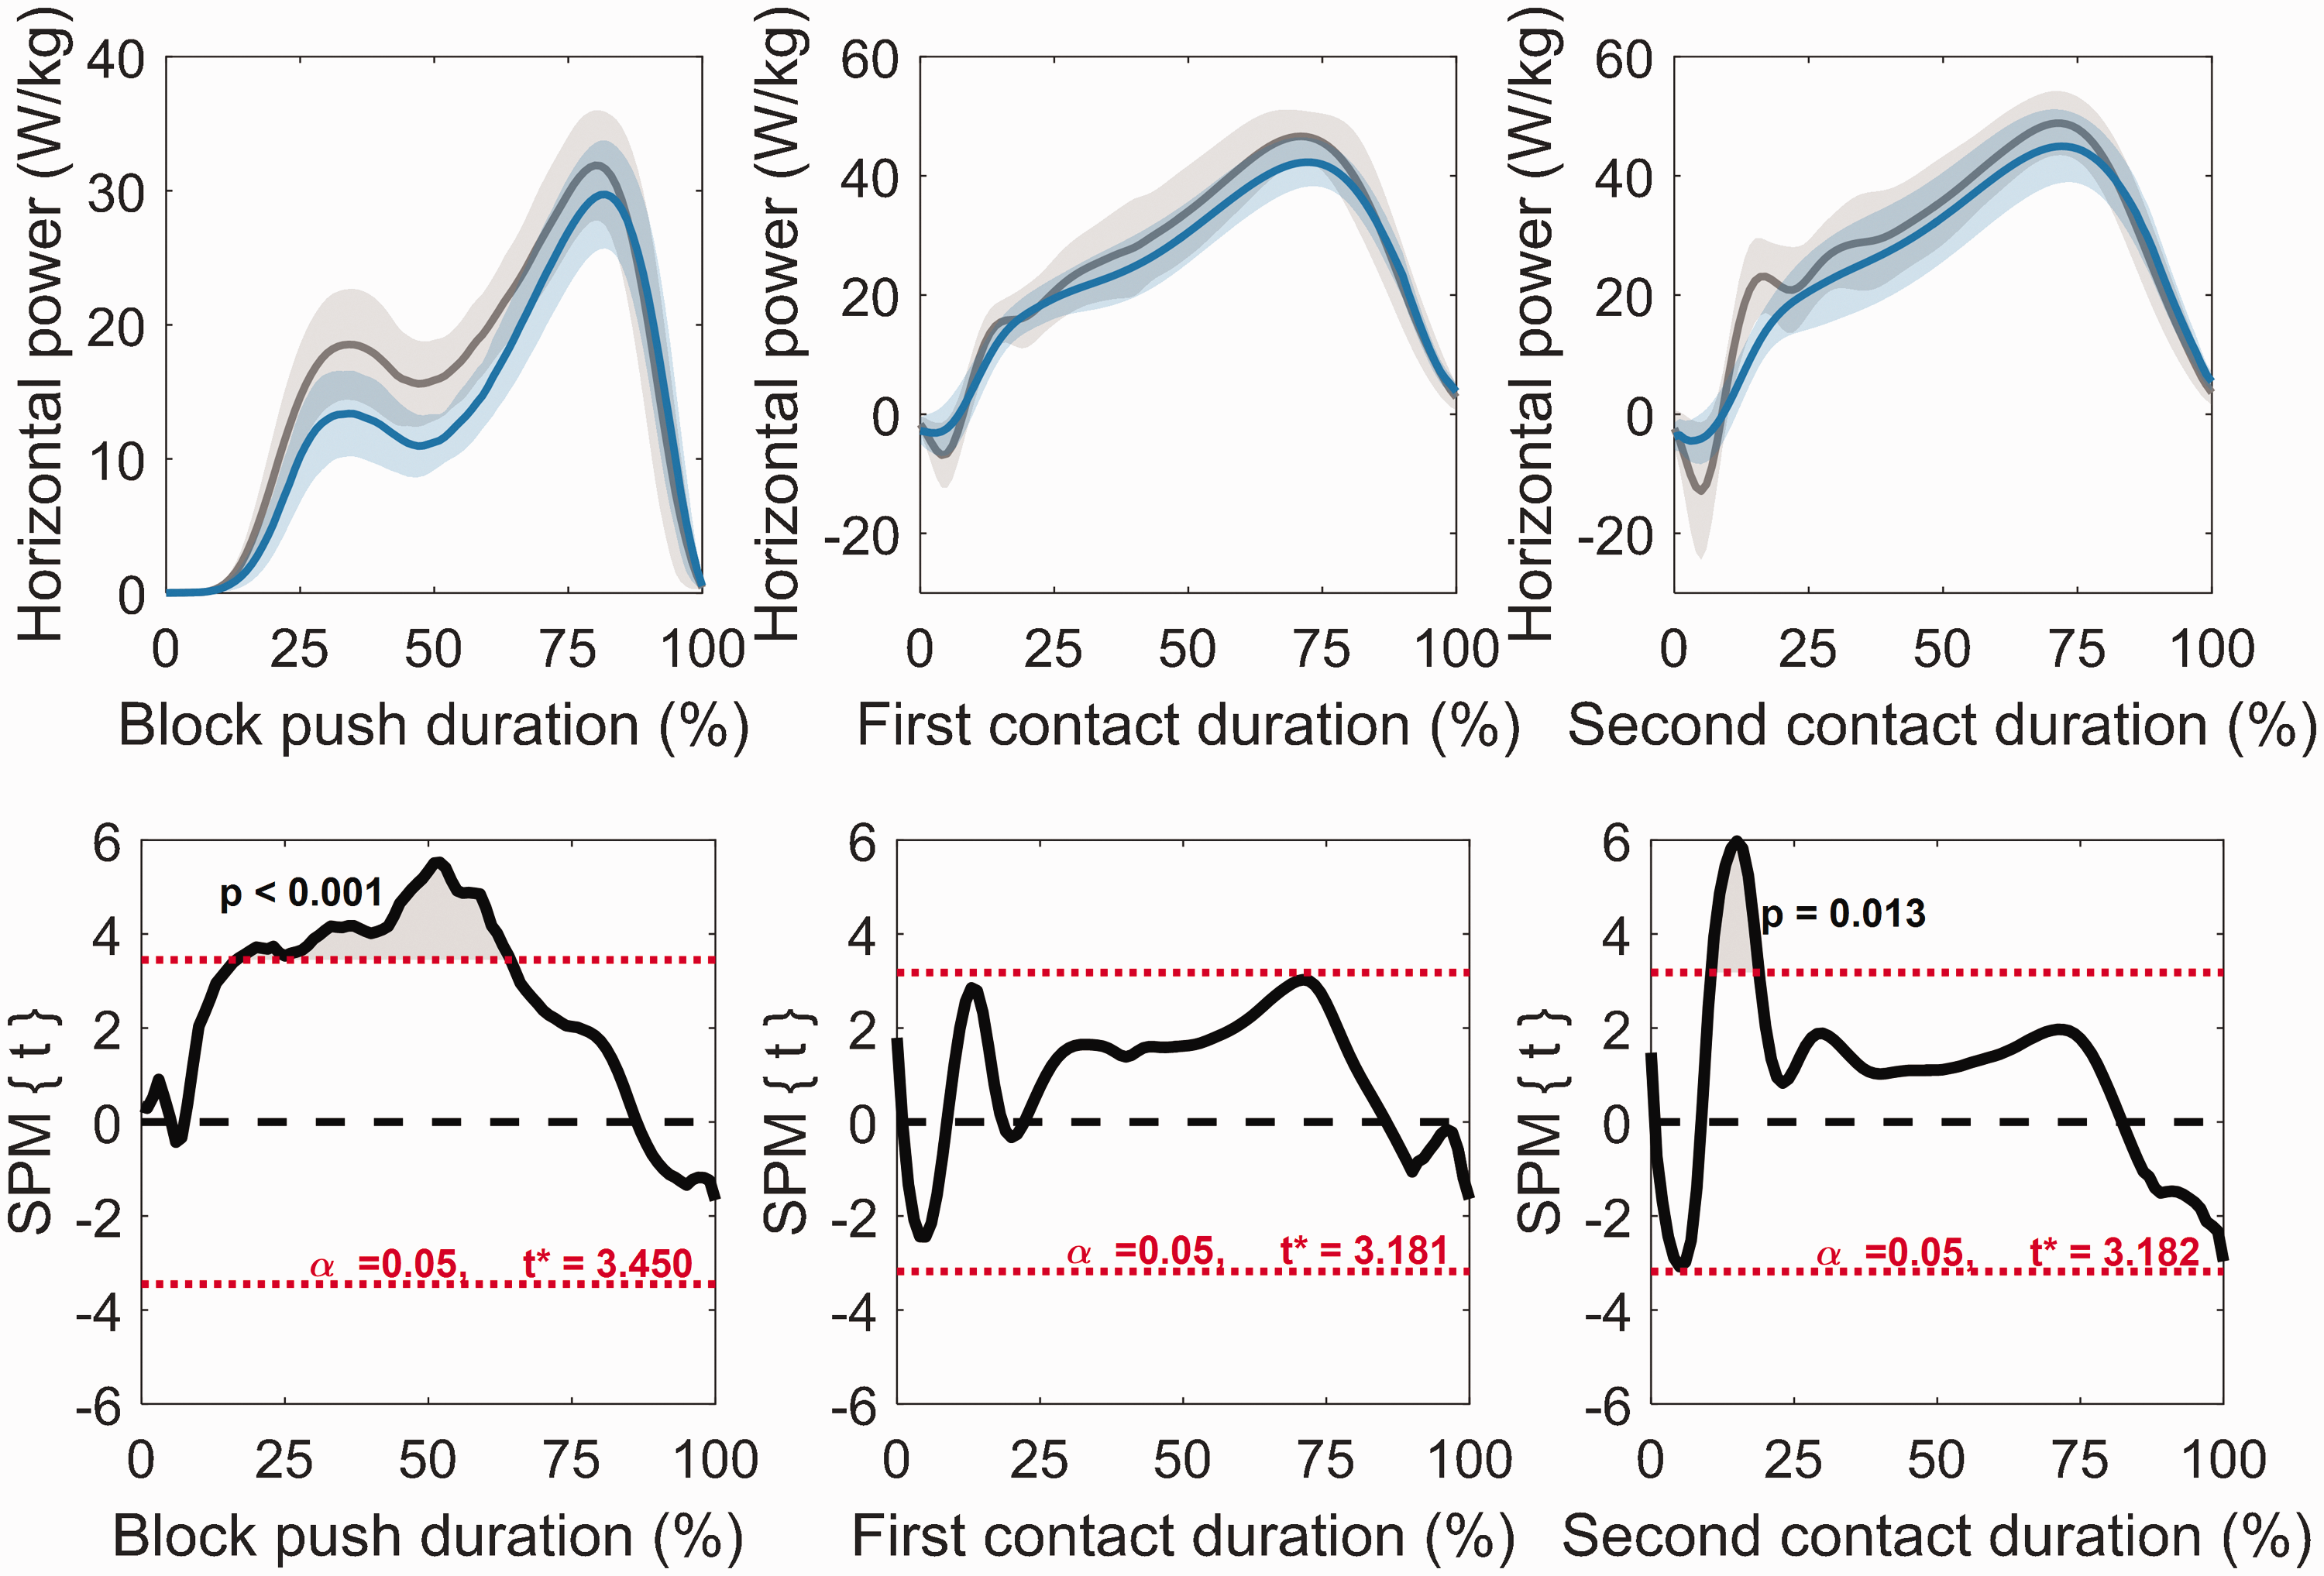
Normalised horizontal power curves (upper row) produced by the senior (grey) and junior (blue) athletes across the block phase (left), first stance phase (middle) and second stance phase (right), and the associated SPM‐1D t-test result for differences between the curves (lower row). Grey-shaded areas on lower row denote supra‐threshold clusters, which are indicative of statistically significant differences between curves at those specific nodes (% of the block push duration or ground contact).
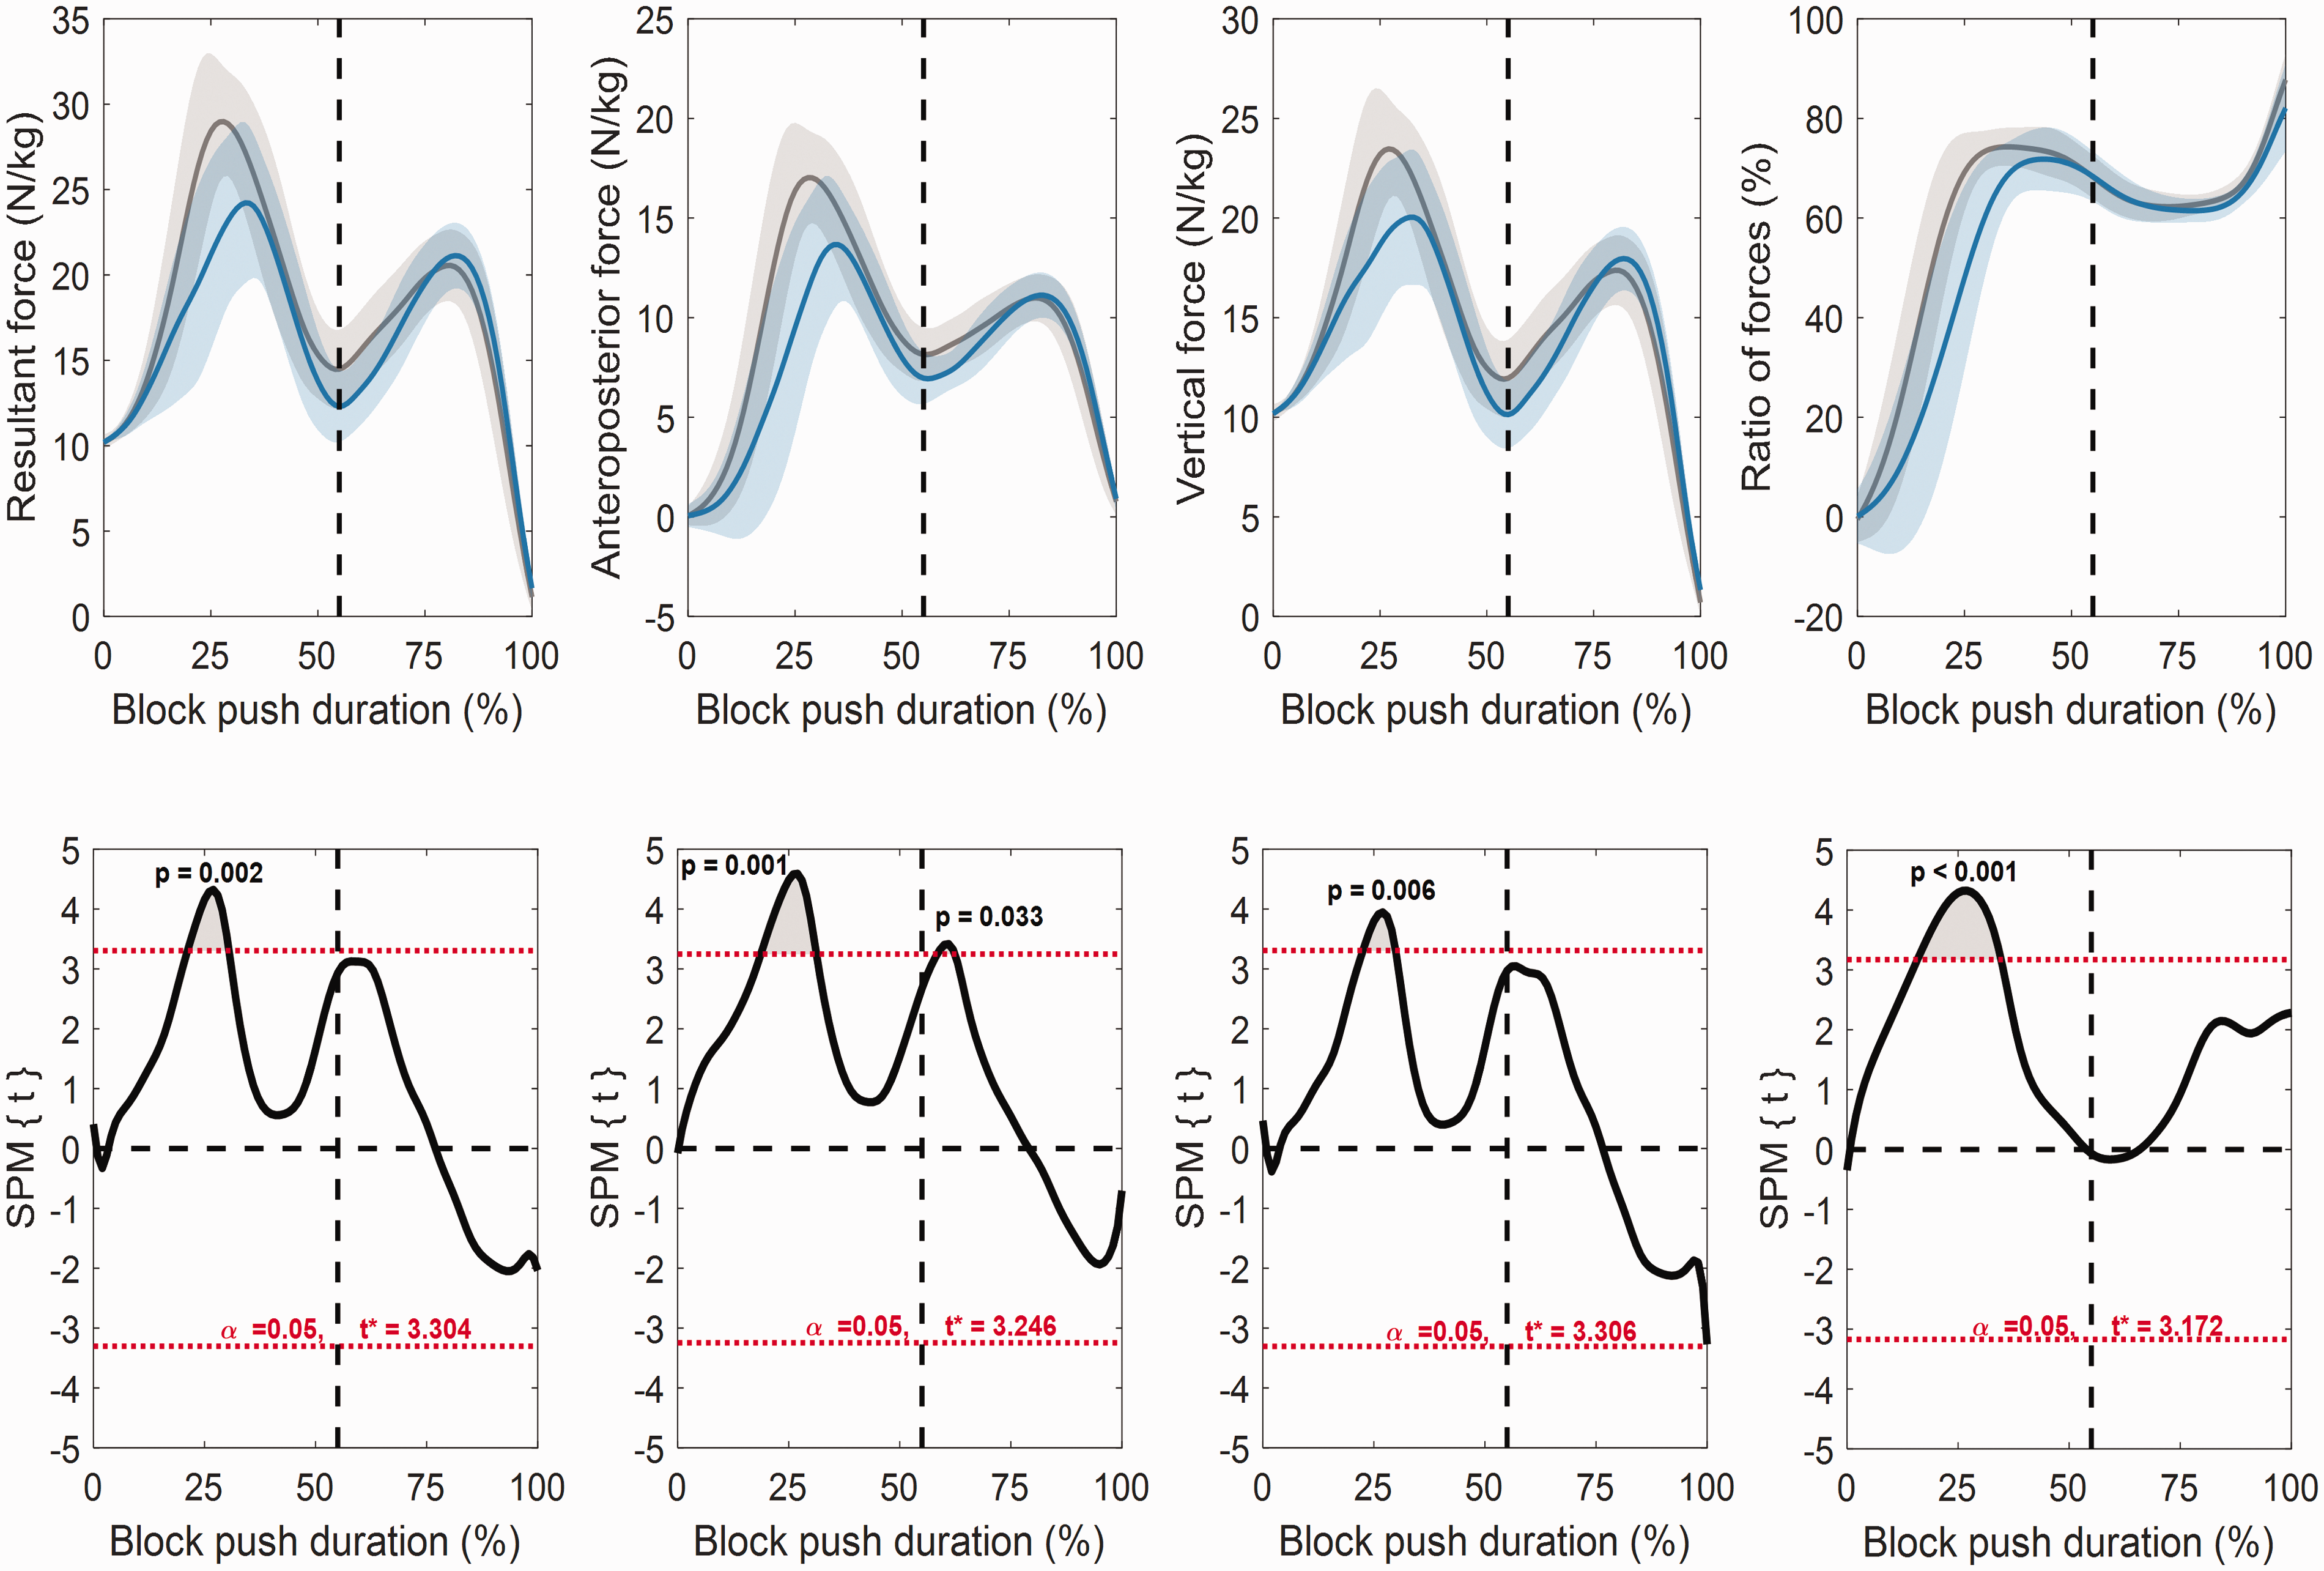
Normalised mean ground reaction force curves produced by the senior (grey) and junior (blue) athletes across the block phase (upper row) and the associated SPM‐1D t-test result for differences between the curves (lower row). From left to right: resultant force, anteroposterior force, vertical force and ratio of forces (anteroposterior component to resultant force). Grey-shaded areas on lower row denote supra‐threshold clusters, which are indicative of statistically significant differences between curves at those specific nodes (% of the block push duration). Vertical black dashed lines represent the average instant where rear foot exited the rear block.
When the rear and front block force waveforms were analysed separately, inter-group differences in anteroposterior forces were found from 16% to 28% and 25% to 62% of block push duration for the rear and front blocks, respectively, with higher forces observed in the senior group (Figure 5). In the vertical direction, no differences in rear foot force production were observed, however, force was higher in the senior group at approximately the same time as rear foot block exit (differences were observed from 49% to 54% of the block phase; Figure 6). Unexpectedly, no between-group differences were observed between any of the force waveforms during the first stance phase (Figure 7) and the amount of force produced also seemed to be similar between groups for the second stance (Figure 6). However, senior athletes exhibited higher ratio of forces in the initial parts of the stance phase (from 9% to 15% and 25% to 29%; Figure 8).
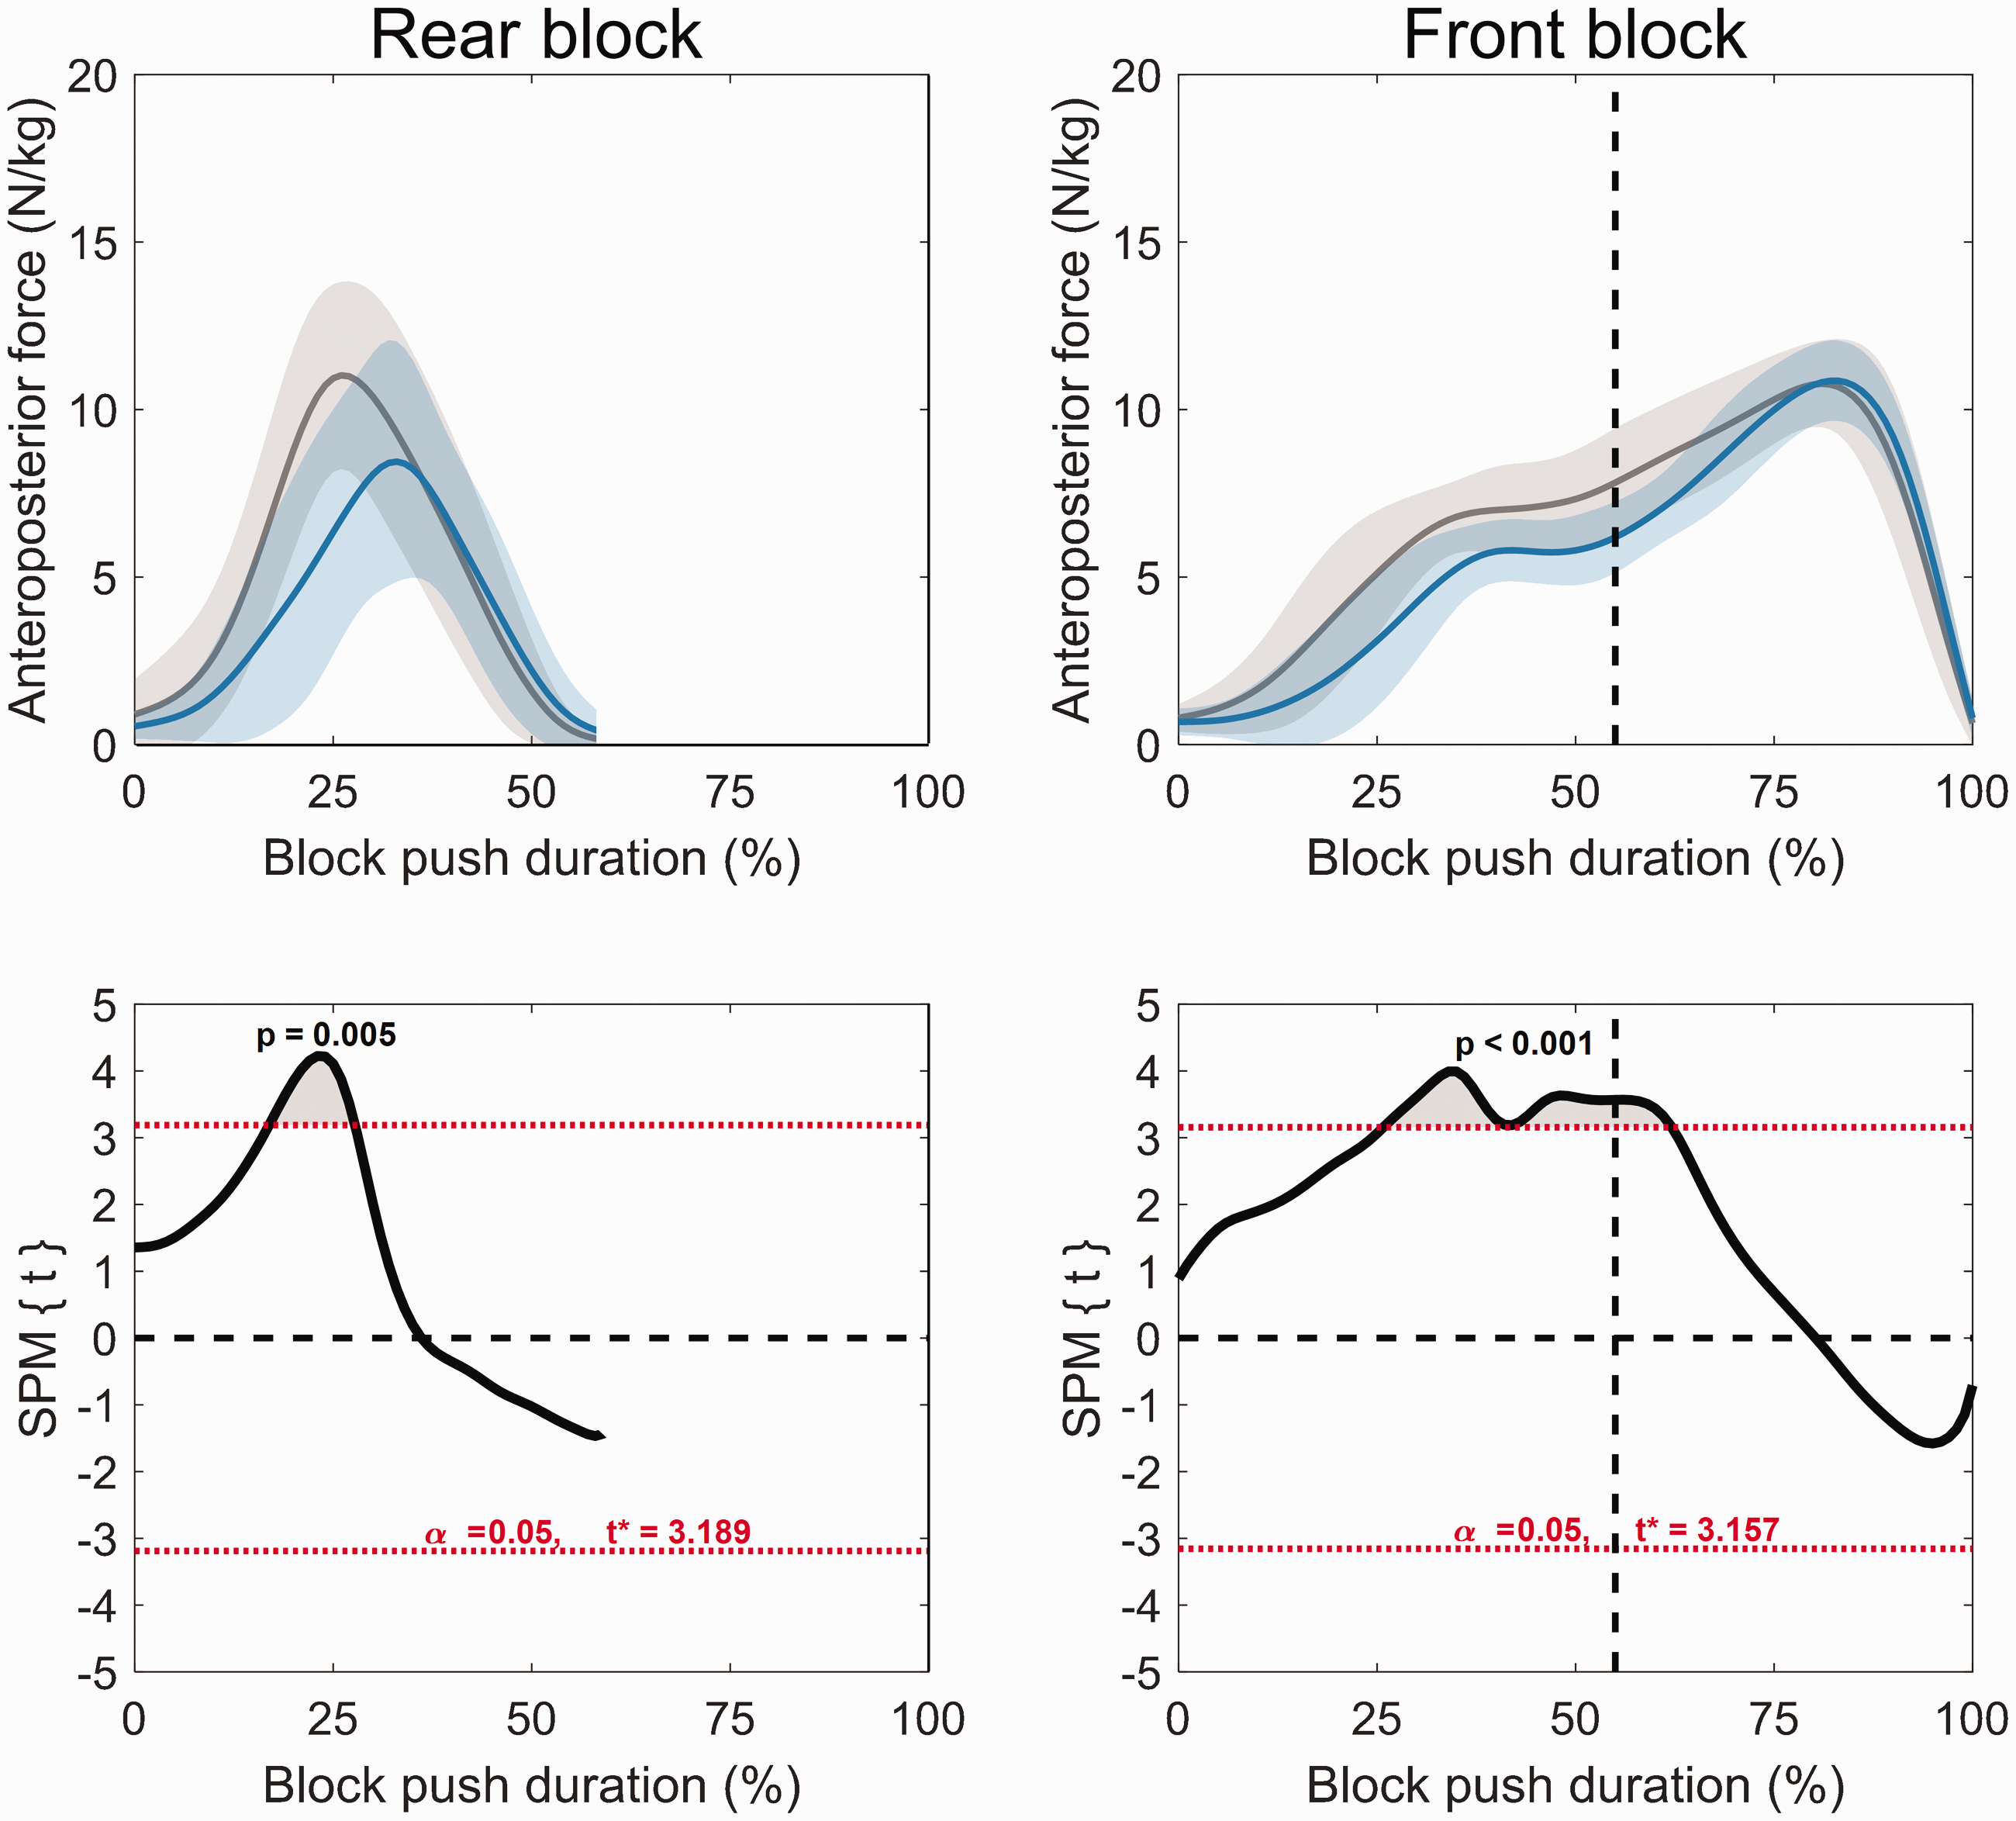
Normalised anteroposterior force curves produced on the rear (left) and front (right) block by the senior (grey) and junior (blue) athletes across the block phase (upper row) and the associated SPM‐1D t-test result for differences between the curves (lower row). Grey-shaded areas on lower row denote supra‐threshold clusters, which are indicative of statistically significant differences between curves at those specific nodes (% of the block push duration). Vertical black dashed line represents the average instant where rear foot exited the rear block.
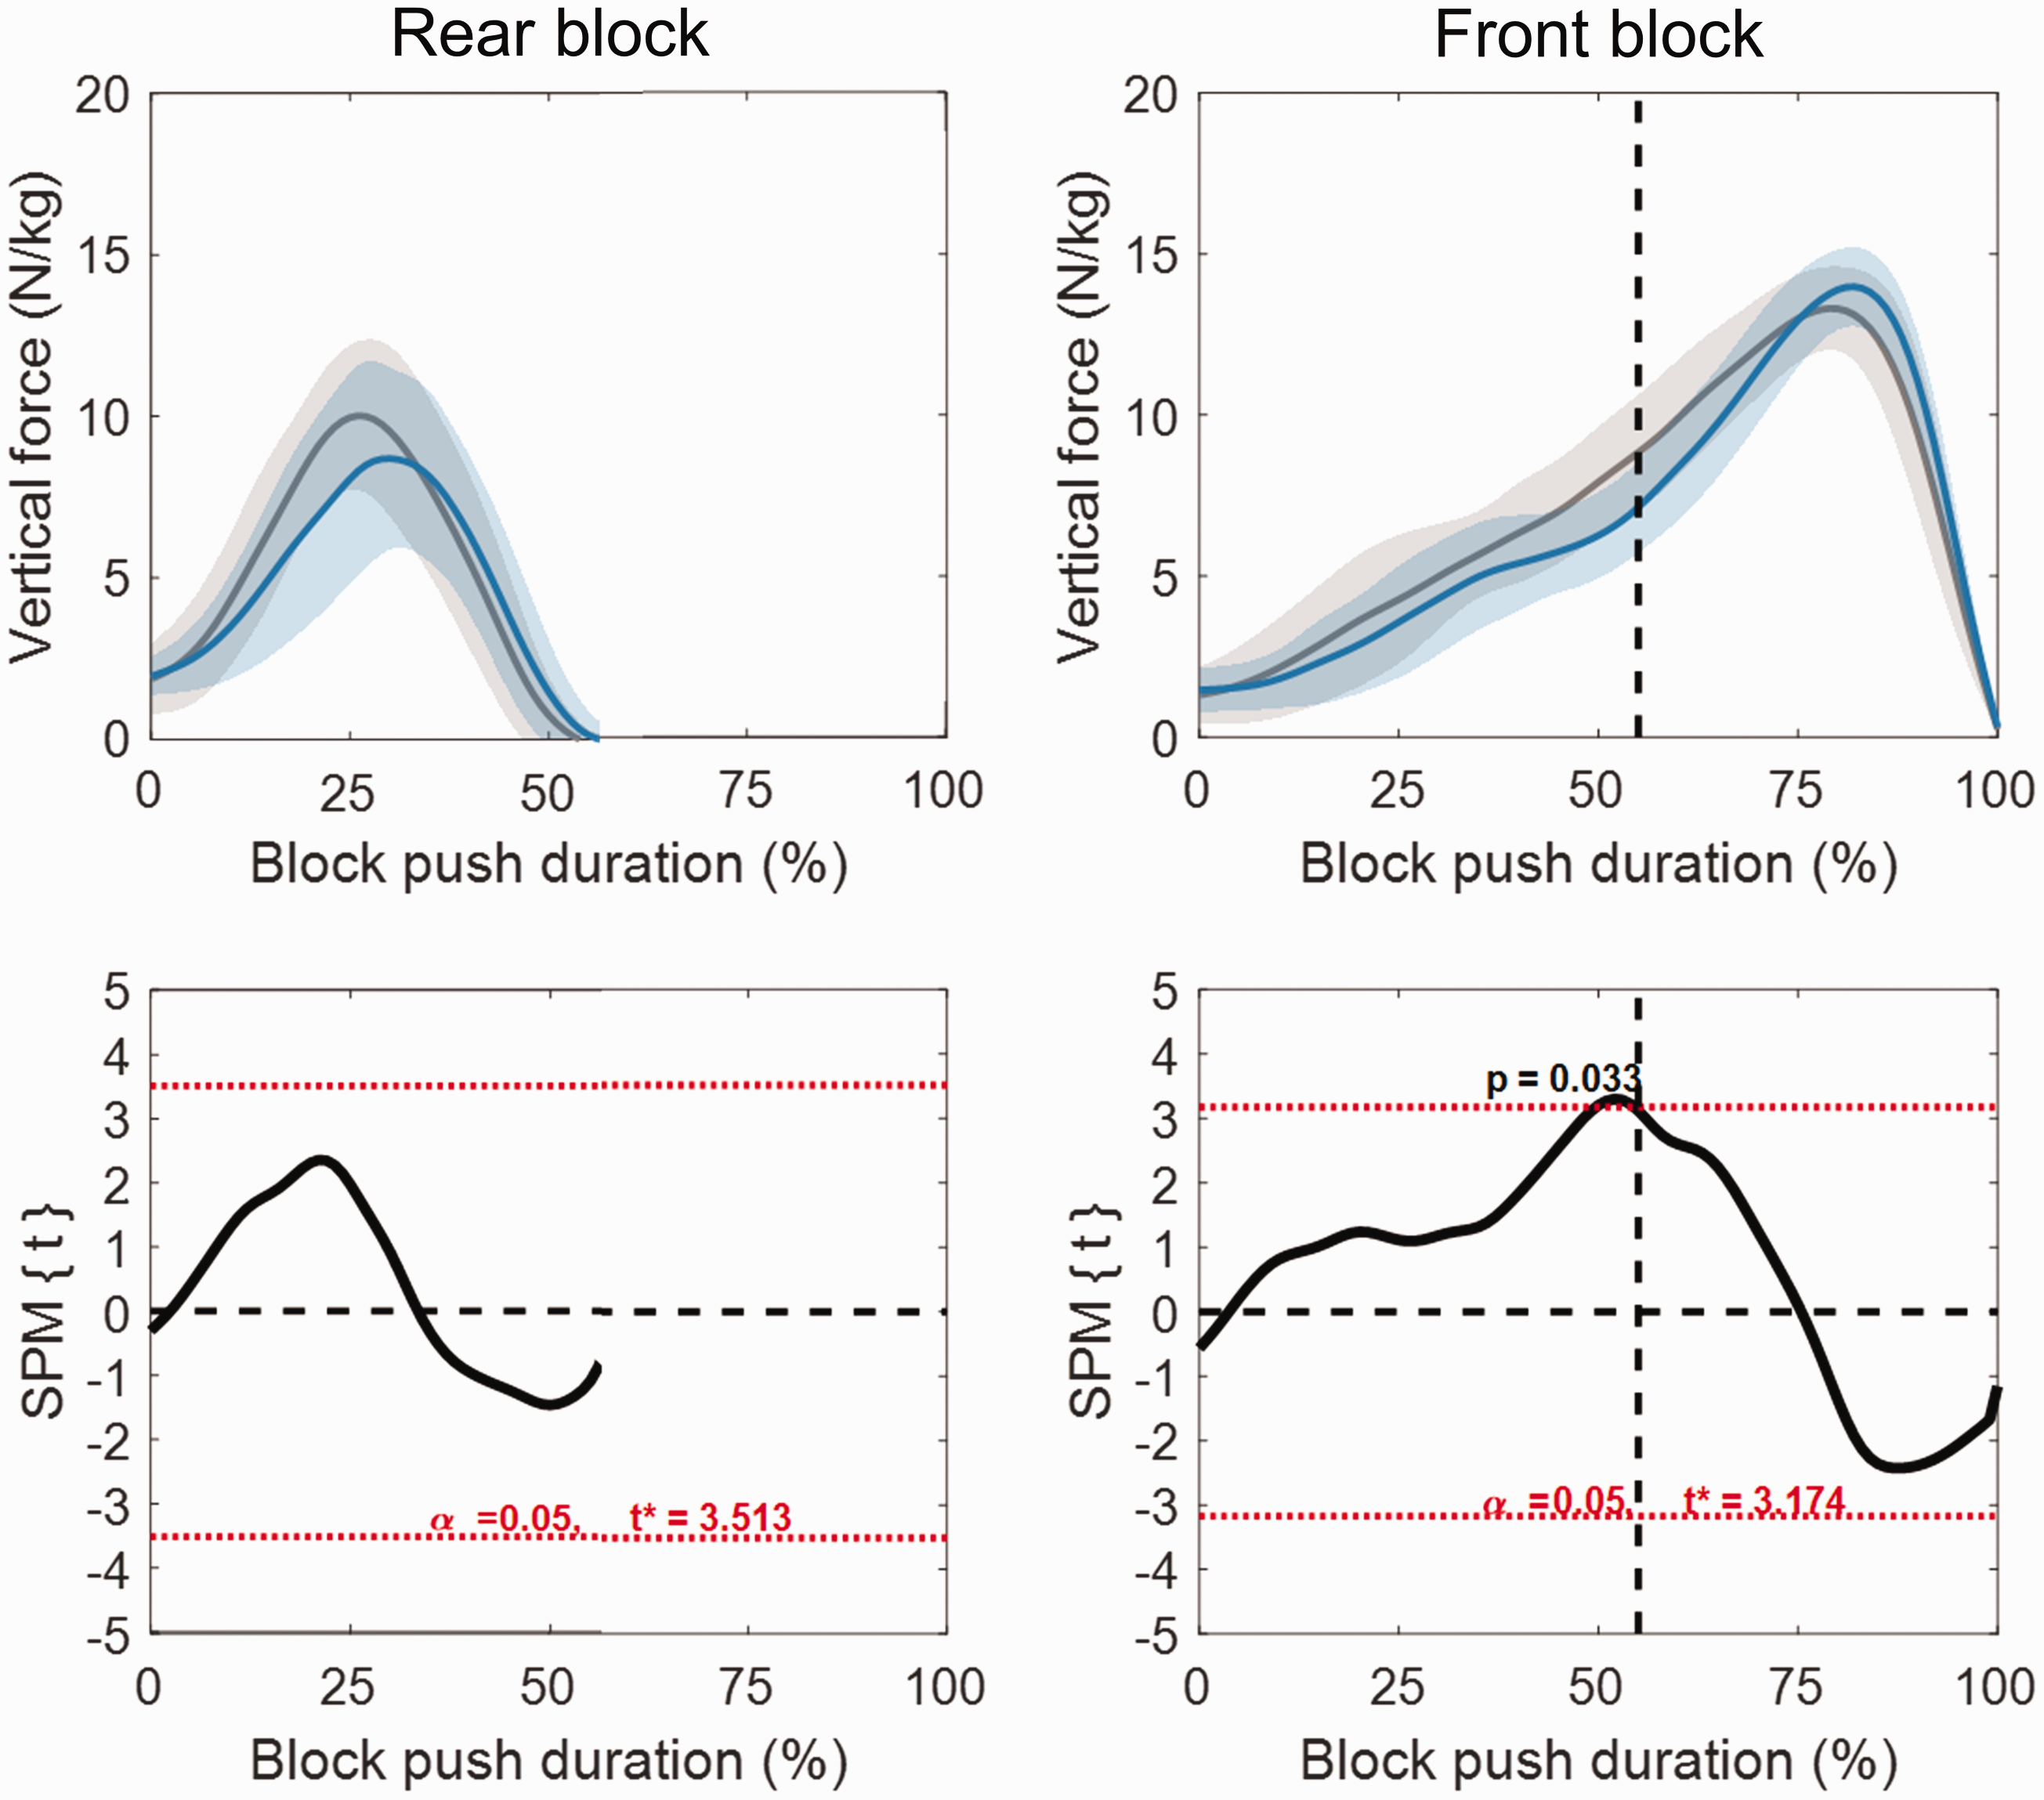
Normalised vertical force curves produced on the rear (left) and front (right) block by the senior (grey) and junior (blue) athletes across the block phase (upper row) and the associated SPM‐1D t-test result for differences between the curves (lower row). Grey-shaded areas on lower row denote supra‐threshold clusters, which are indicative of statistically significant differences between curves at those specific nodes (% of the block push duration). Vertical black dashed line represents the average instant where rear foot exited the rear block.
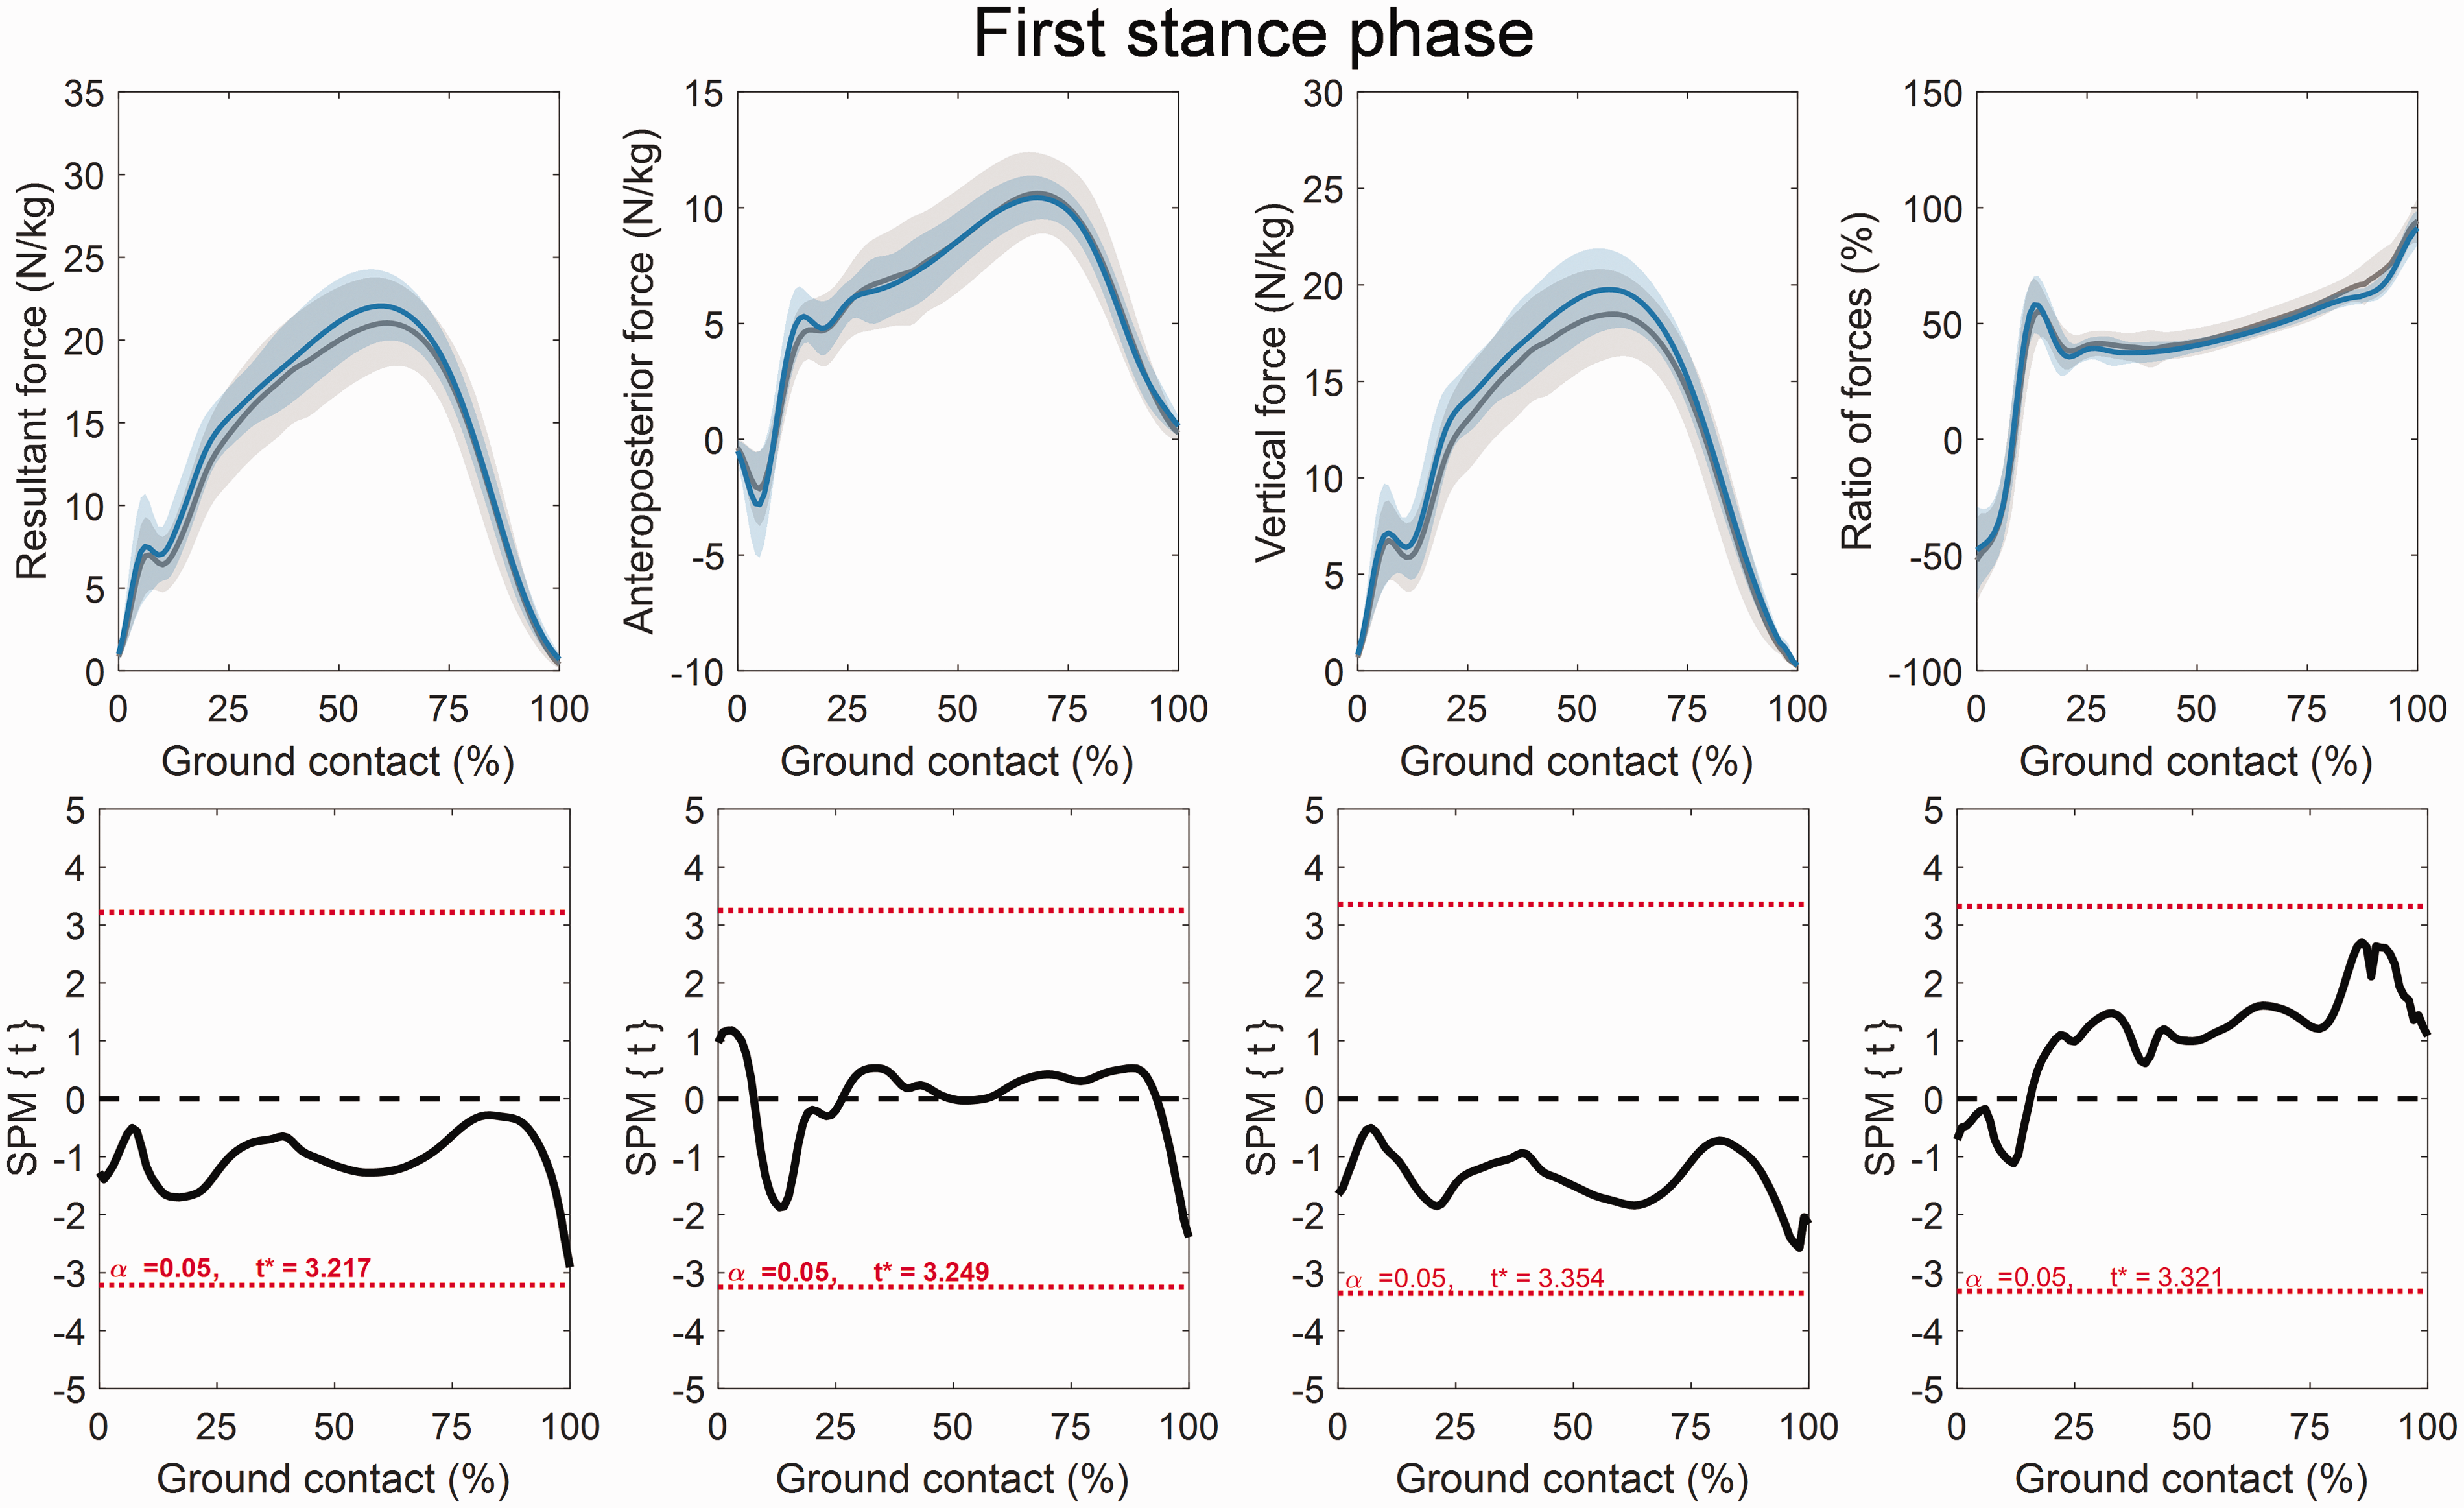
Normalised mean ground reaction force curves produced by the senior (grey) and junior (blue) athletes across the first stance phase (upper row) and the associated SPM‐1D t-test result for differences between the curves (lower row). From left to right: resultant force, anteroposterior component of the ground reaction force, vertical component of the ground reaction force and ratio of forces (anteroposterior component to resultant force). Grey-shaded areas indicate supra‐threshold clusters, which are indicative of statistically significant differences between curves at those specific nodes (% of the ground contact).
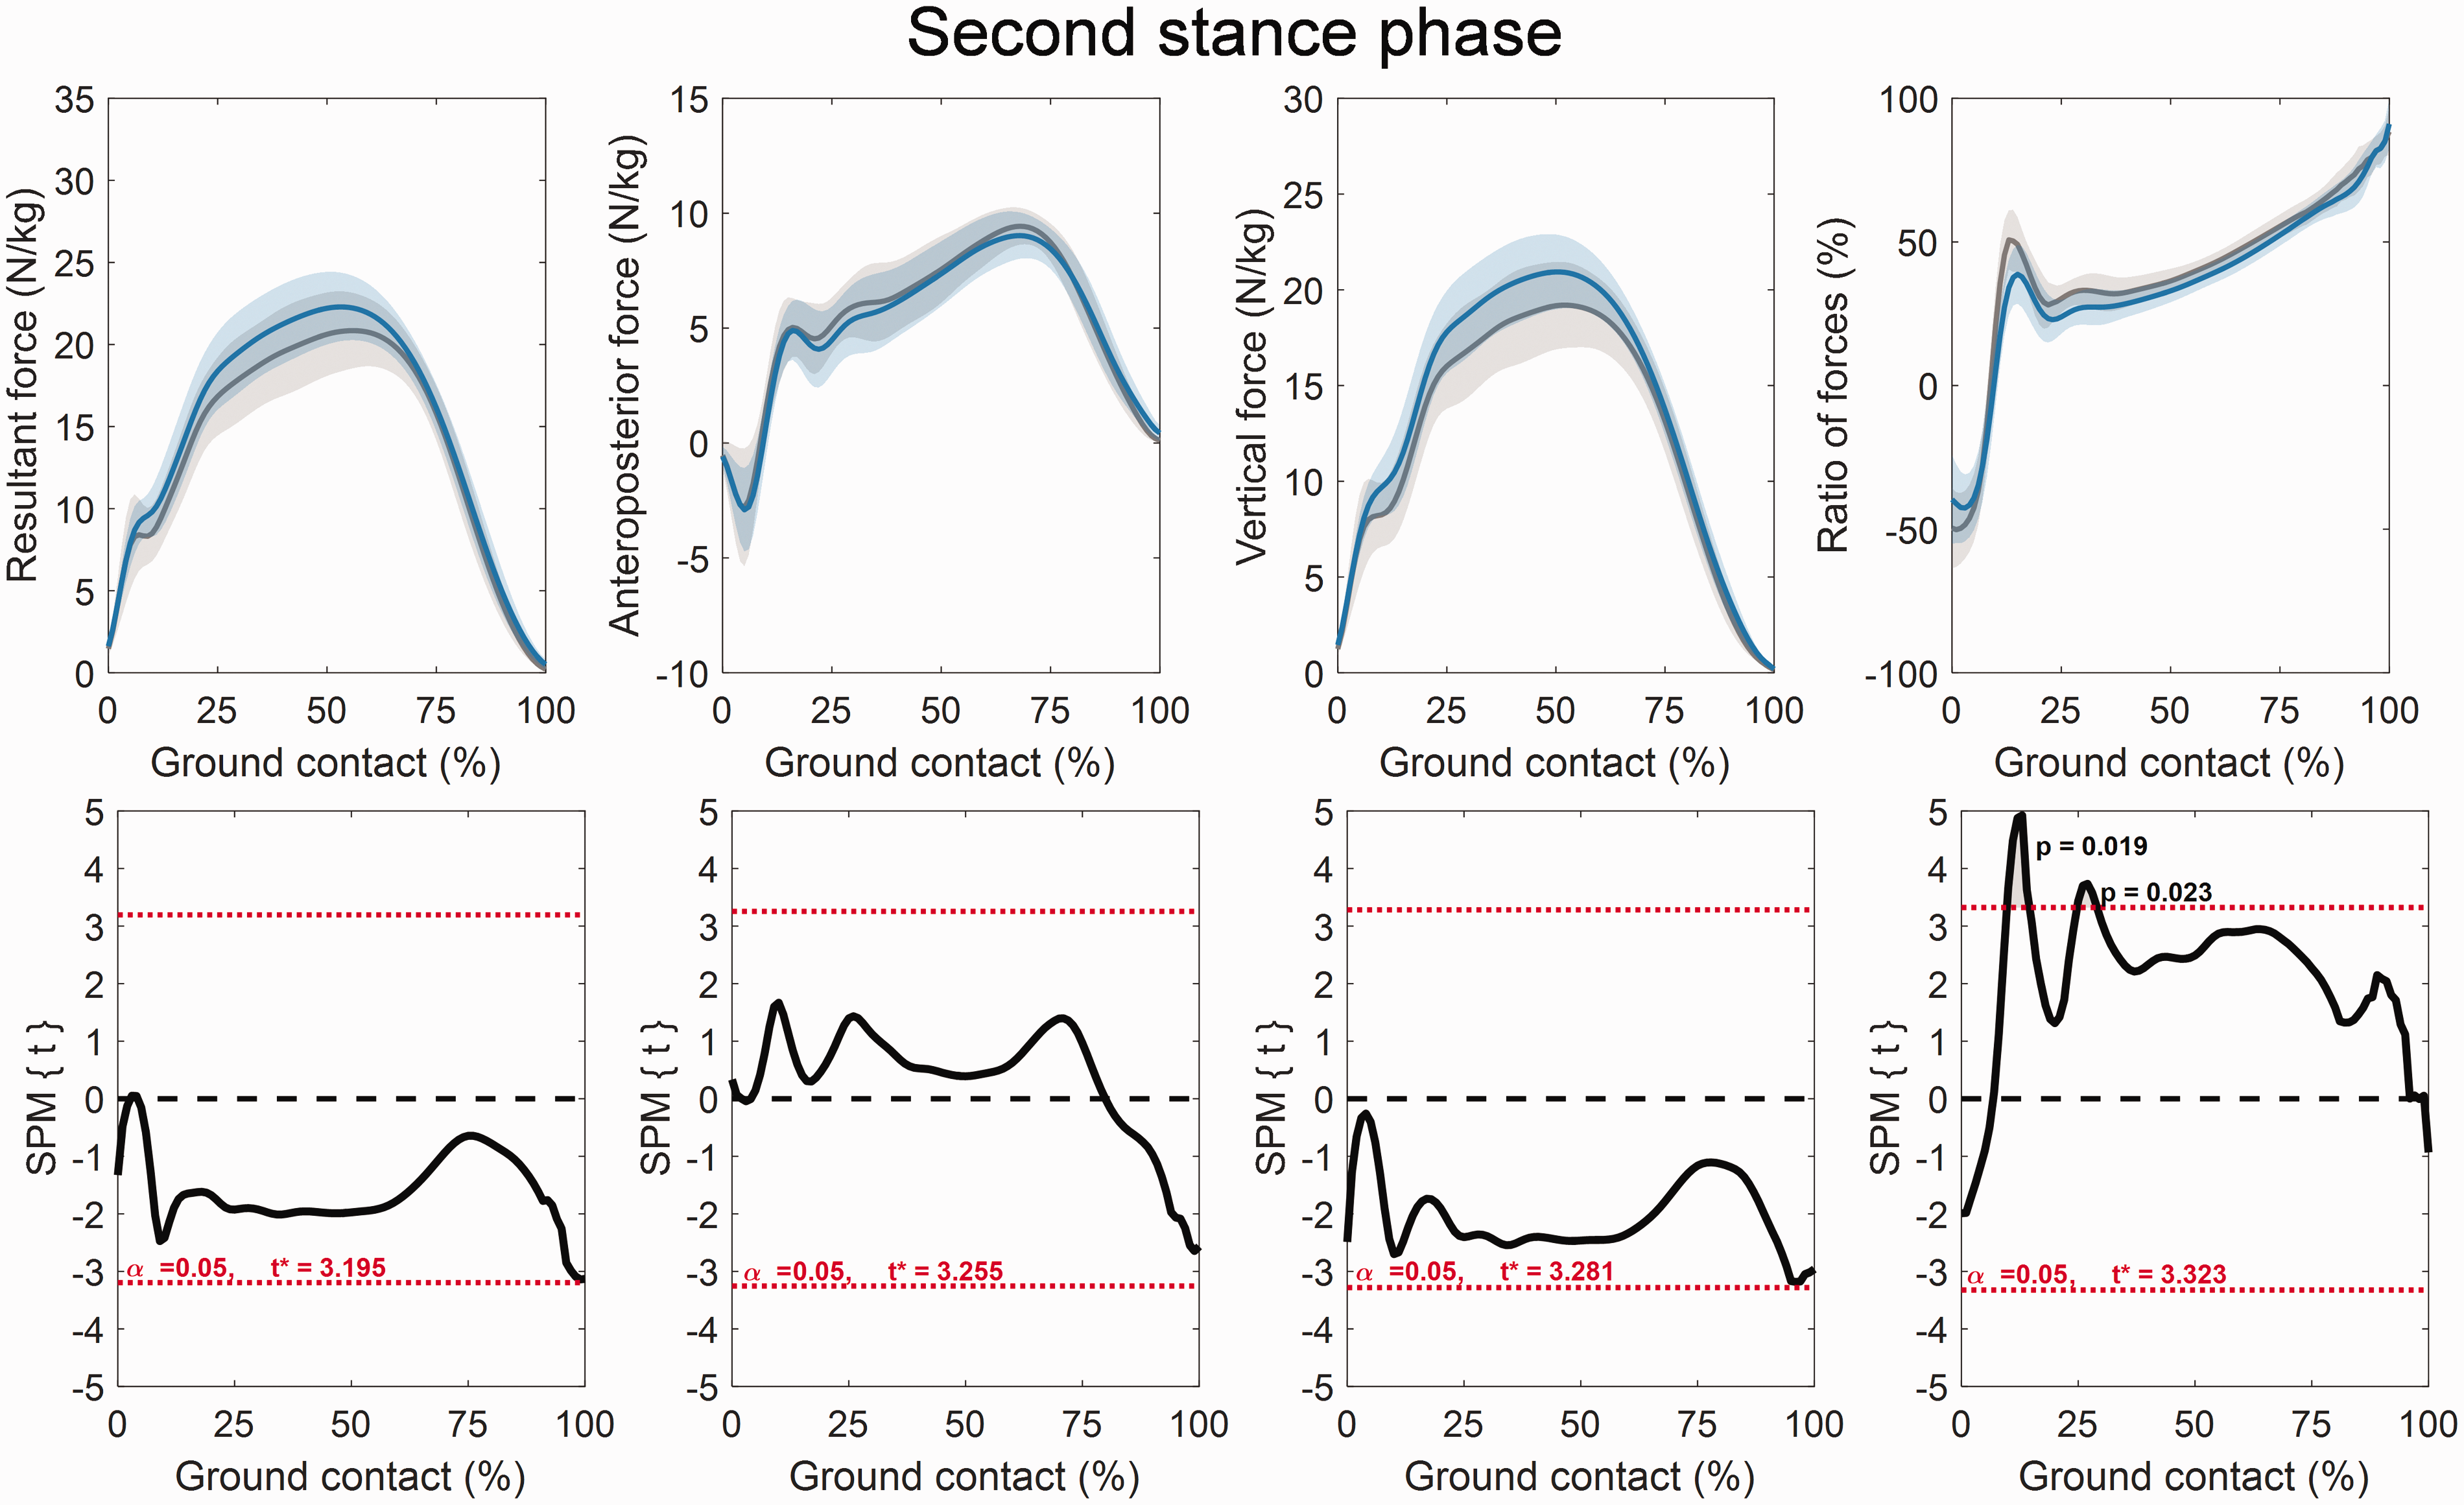
Normalised mean ground reaction force curves produced by the senior (grey) and junior (blue) athletes across the second stance phase (upper row) and the associated SPM‐1D t-test result for differences between the curves (lower row). From left to right: resultant force, anteroposterior component of the ground reaction force, vertical component of the ground reaction force and ratio of forces (anteroposterior component to resultant force). Grey-shaded areas indicate supra‐threshold clusters, which are indicative of statistically significant differences between curves at those specific nodes (% of the ground contact).
Discussion
The most marked kinetic differences between the senior and junior athletes were observed across the block phase, with only subtle differences apparent across the initial two steps. Senior athletes exhibited higher relative force production and ratio of forces during the early block phase, and higher anteroposterior forces during the transition from bilateral to unilateral pushing (58–62% of the block phase; just after the rear foot exited the block on average, 55%; Figure 3). The force and power waveforms relating to the first and second steps did not differ markedly across athlete groups. However, horizontal power during the initial part of the second ground contact (10–19% of the stance phase) was higher in the senior athletes with a higher ratio of forces also exhibited immediately following the reversal of braking forces (from 9% to 15% and 25% to 29% of stance, Figure 8).
Senior athletes exited the blocks with higher horizontal velocity and exhibited shorter block push durations than the junior group (Table 1), resulting in considerably higher (large effect) block average horizontal external power (15.52 W/kg compared to 12.37 W/kg, respectively). Two athletes produced over 17 W/kg of average horizontal external power, which would group them amongst the ‘elite’ based on the categories by Rabita et al. 4 involving medallists at major championships and Olympic finalists (mean = 17.32 W/kg). On the other hand, in the same study by Rabita et al., 4 the average horizontal external powers of junior athletes would result in them being classified as sub-elite (100-m PBs ranging 10.40–10.60 s). As such, whilst there was an overall large effect between the average horizontal external power produced by the senior and junior athlete groups, the overlap between groups (Figure 1) highlights the future promise that some of the junior athletes in this study show. Thus, this evident high relative force-generating capacity of the younger sprinters allows similar average horizontal external power values to the senior athletes to be achieved. As these junior athletes mature, it will become important to maintain this high relative force production capacity as body mass is accrued.
Specifically, the senior athletes in the current study produced higher power compared with the junior athletes from 16% to 64% of the block phase. This difference appears to be attributable to higher force production and higher ratio of forces early in the block phase (18–31% and 15–35% of the block phase, respectively). Thus, the between-group variation likely results from differences in both physical (e.g. lower-limb muscle mass, Aerenhouts et al. 13 ) and technical (i.e. force application) differences. Initially, the difference in anteroposterior force production related to rear block force production (16–28% of the block phase), with front foot force production differentiating groups later in the block phase (25–62%). Importantly, differences in front block forces occurred at values that were below the peak force attained. The latter finding aligns with previous waveform analyses, 7 which recently showed that a forceful rear block push from the onset of the block phase was an important performance determinant, but front block force production also become a contributing factor, albeit later in the block phase. However, the analysis performed by Bezodis et al. 7 (involving sprinters, jumpers and decathletes with mean 100-m PBs of 11.37 ± 0.37) did not find any variables relating to orientation to contribute to block phase performance. Thus, it could be that direction of the force vector becomes a more performance-differentiating as ability level increases. More research is required to better understand these apparent discrepancies.
Front block force production, particularly in the anteroposterior direction, was found to differentiate senior and junior athlete groups around the time that the rear foot exited the block, in line with previous correlation analyses. 9 Specifically, this may suggest that the senior athletes have superior balance and strength during this transition from bilateral to unilateral pushing, as previously speculated. 15 It could be speculated that seniors may overcome more inertia through their superior rear foot horizontal force production and their centre of mass may travel further ahead of the centre of pressure. In fact, we have previously shown superior sprinters to displace their centre of mass further before this first transition, 9 the response to which could be higher anteroposterior front foot force production to avoid falling forwards. This would conceivably result in a reduced drop in force and a more effective transition, as observed in senior compared to junior athletes involved in the current study. Alternatively, through experience, senior athletes may have found a block set-up that facilitates more optimal lower extremity joint angles at the transition onto the front foot, and combined with greater strength, power and coordination are able to utilise the greater force production more effectively. Future research to longitudinally monitor the training progress of junior athletes (physical capacities alongside ground reaction force production) and their potential progression to senior ranks would greatly contribute to the current body of knowledge.
Senior athletes were also able to maintain a lower (more horizontal) projection angle across the initial two steps of the sprint compared with junior athletes (effect size −0.78 ± 0.51 and −1.15 ± 0.34 for first and second stance phase, respectively). This difference seems largely attributable to the higher horizontal block exit velocities and the lower vertical take-off velocities from subsequent contacts in senior athletes. It is noticeable that the increases in horizontal velocity across the first two stance phases were similar across groups (1.24 m/s and 1.23 m/s for senior and junior athletes, respectively, across the first stance phase, and 0.88 m/s for both groups across the second stance phase).
Waveform analysis of the ground reaction forces produced across the first two steps revealed only subtle between-group differences in force production (Figures 6 and 7). This could indicate non-uniform progression in sprint start ability whereby development of the block phase is somewhat delayed compared to the force production during the initial stance phase. This may be attributable to differences in maximum force capacity between groups, given that force production is highest during the block phase. It could be that the largest differences between these groups are at the high force, low velocity end of the force–velocity spectrum and so greater differences are observed during the block phase (where athletes clearly start with zero velocity). Practitioners and coaches should take this into consideration when attempting to improve the sprint start performance of junior athletes and perhaps use more high-force, lower velocity training to improve the block phase.
Across the stance phases, however, it was only the ratio of forces during the initial parts of the second stance phase, which was different between groups for two short-lived periods (9–15% and 25–29% of the stance phase). A potential mechanism for this could be through a more negative touchdown distance, which has been shown to result in a more horizontally orientated force vector in the first stance phase. 19 Nonetheless, more longitudinal research that includes both kinematic and kinetic data is required to fully elucidate how these factors change as an athlete develops.
This study is the first to detail kinetic differences in ground reaction force waveforms between elite senior and junior academy sprinters. The senior athletes in the current study performed considerably better block phases compared with the junior sprinters. The abilities to produce high relative anteroposterior force during the initial block phase, to sustain high forces during the transition from bilateral to unilateral pushing and to maintain more horizontal projection angles all seemed to differentiate senior sprinters from their younger counterparts. However, force production during the initial two contact periods did not differ considerably across groups, perhaps indicating that junior athletes’ block phase performances have not progressed at the same rate as that of the subsequent contacts. These findings can directly inform the monitoring of junior athletes, which in turn can inform the training and coaching of junior sprinters to facilitate more effective progression towards the senior ranks within athletics.
Footnotes
Declaration of conflicting interests
The author(s) declared no potential conflicts of interest with respect to the research, authorship, and/or publication of this article.
Funding
The author(s) declared the following potential conflicts of interest with respect to the research, authorship, and/or publication of this article: This investigation was part-funded by CAMERA, the RCUK Centre for the Analysis of Motion, Entertainment Research and Applications, EP/M023281/1.