
Abstract
This study successfully synthesized a pectin/Fe2O3 membrane from the Da Xanh grapefruit peel. In this case, Fe2O3 was synthesized using a green solvent, and pectin was synthesized from grapefruit peel. Results from the structural analysis methods of SEM, EDX, XRD, FTIR, and BET showed the Fe2O3 material to be a hexagonal shape. The pectin/Fe2O3 material had tiny holes attached to the surface, and the cut surface shows the membrane to be close-knit fibers. The elemental composition of material was determined through EDX and FTIR spectrum which indicated the connection between the components in the film. The best adsorption capacity of BG (27.792 mg g−1) and CV (23.433 mg g−1) dyes were evaluated at the best conditions: 4 g L−1, temperature 50 °C, pH 5 for BG and pH 4 for CV, 120 min and concentration 150 mg L−1. The adsorption process of the material occurred following the PSO model, according to the mechanism of chemical bonding and interaction with each other. The adsorption isotherm occurred in the D–R model with BG and the Langmuir model with CV, both of which were monolayer adsorption with CV as a homogeneous surface and with BG as a heterogeneous surface. Therefore, the pectin/Fe2O3 membrane material synthesized by the green chemistry method was a potential material from pomelo peel waste that can replace other adsorbent materials and save costs.

Introduction
Nowadays, environmental pollution was becoming one of the urgent global issues, especially water pollution caused by industrial waste. Among them, pollution caused by dyes from the textile, printing, and leather industries was one of the most serious types of pollution.1,2 In Sujata Mani’s research, it was shown that the harmful effects of Crystal Violet dye to be toxic to cells, causing gene mutations and cancer cells. 3 Besides, it also caused a number of diseases affecting humans such as vaginal fistula, severe Candida and macroglossia, skin irritation, gastrointestinal irritation, respiratory and kidney failure, and so on. In animals, the leukemic form of CV was reported to cause kidney, liver and lung tumors.3,4 In addition, research by Michalina Oplatowska has highlighted the harmful effects of BG on human skin, causing toxicity to cells and contributing to the formation of cancer cells when ingested by humans. 5 Therefore, research on effective and environmentally friendly treatment methods is essential to remove dyes from wastewater.
Recently, pectin/Fe2O3 composite membranes have been investigated as a potential material for dye pollution treatment, due to the film-forming effect of pectin a natural polysaccharide derived from plants, 6 and iron III oxide (Fe2O3) an inorganic material with adsorption and photocatalytic properties. 7 Pectin has high biocompatibility, gel-forming ability, and the ability to bind to pollutants through chemical functional groups on the surface. 6 The combination of pectin and Fe2O3 significantly enhances the adsorption capacity, thanks to the larger surface area and higher photocatalytic ability of Fe2O3 than other materials such as activated carbon or zeolite. Fe2O3 material has the ability to decompose organic compounds under light, allowing this composite membrane to adsorb and destroy dyes, thereby enhancing the treatment efficiency. 8 Compared with other materials such as activated carbon or zeolite, the pectin/Fe2O3 composite membrane not only has high adsorption efficiency but also has the ability to self-clean thanks to the photocatalytic process of Fe2O3. 9 This helped to increase the service life of the material, as well as minimize replacement and maintenance costs. 8 Moreover, pectin/Fe2O3 membrane was also environmentally friendly, as pectin is biodegradable and does not cause secondary pollution. Compared with other biological materials such as chitosan or cellulose, the pectin/Fe2O3 membrane has a stronger adsorption capacity due to the combination of Fe2O3, and the biocompatibility of pectin, making this membrane a potential choice for dye wastewater treatment applications. 10
Synthesis of Fe2O3 nanoparticles by green method was very promising because it is non-toxic and environmentally friendly. However, few studies have been conducted on the synthesis of Fe2O3 nanoparticles using Pomelo peel (PP) extract. In 2022, the aim of this study was to remove indigo carmine dye from industrial wastewater using Fe2O3 nanoparticles synthesized through PP extract. In the synthesized aqueous solution, the optimal pH value was 2.4 with an indigo carmine adsorption rate of 84.72%. The maximum adsorption rate in aqueous solution was 96%. The study with industrial wastewater was showed that the adsorption rate of indigo carmine was 28.68%. Therefore, γ-Fe2O3 nanoparticles from PP extract could be propose for the purification of indigo carmine contaminated industrial wastewater. 11 In 2024, the study of efficient selective separation of organic dyes from high salinity textile wastewater including inorganic salts and organic dyes was of great significance for textile wastewater treatment. Graphene oxide (GO) has been widely used to form ultrathin membranes with high permeability for molecular and ion sieving. However, the swelling and fouling of GO membranes have hindered its practical applications. In that work, reduced graphene oxide (rGO) membranes with high stability and antifouling properties were fabricated, and Fe2O3 nanoparticles were used as intercalators to modify the interlayer spacing of the membranes. The rGO/2Fe2O3 nanocomposite composite membrane exhibited a high permeability of 24.90 L m−2 h−1 bar−1, excellent organic dye rejection (98.15% and 98.69% for methylene blue and Evans blue, respectively), and low salt retention (6.26% for NaCl). Meanwhile, the membrane demonstrated a high selectivity dye/salt separation factor of up to 232 with a high rejection rate of 99.59% for Evans blue and a lower salt rejection rate of 5.03% for NaCl. 12 Thus, pectin/Fe2O3 composite membrane not only provided high adsorption performance but also combined the advantages of both biological and inorganic materials, helping to optimize the treatment of dye pollution in wastewater. This material provided to be a sustainable and effective solution for environmental pollution.
Results and discussion
Structural characteristics of pectin/Fe2O3 nanoparticles
Fe2O3 material and pectin/Fe2O3 film were synthesized by extract and pectin from Da Xanh Pomelo peel. The material after synthesis was evaluated for structural characteristics by using SEM, EDX, XRD, FTIR, and BET. The SEM and EDX results were shown in Figure 1. In Figure 1(a), the morphology of Fe2O3 material was clearly shown with irregular polyhedral at a size of 1 µm. The size of Fe2O3 particles was determined in a scale with a length of 1.47 µm, and a width of 0.71 µm. Most of the Fe2O3 particles had a size of above 1 µm. This was also similar to in the study of Bui Thi Hang. 13 In Figure 1(b), the morphology of the surface of pectin/Fe2O3 film showed a flat surface with dots corresponded to Fe2O3 molecules shown on the surface. The elemental composition was also evaluated by EDX in Figure 1(c). The results showed that the composition of the Fe2O3 material includes carbon, oxygen, and iron. The proportion of iron and oxygen accounts for more than 85% of the total mass in which, a small amount of residual carbon was sourced be from organic compounds in the PP extract. This also shows the formation of Fe2O3 when combined with PP extract. In Bashir’s study, Fe2O3 was also synthesized when combined with orange peel extract, giving similar EDX results with 85% Fe2O3 and 15% impurities. 14 This shows that the formation rate of Fe2O3 nanoparticles from Citrus extracts was over 80%. When Fe2O3 was incorporated into the pectin film, the components include carbon, oxygen, iron, calcium, and chlorine. In particular, the high carbon and oxygen content was due to the presence of pectin, the main polymer component for the film synthesis process. In addition, calcium and chlorine were components of CaCl3, which act as a polymer network linker, and make the pectin film difficult to dissolve in water. The proportion of iron present in the film has a low mass due to the mixing ratio of 20% compared to the mass of pectin.
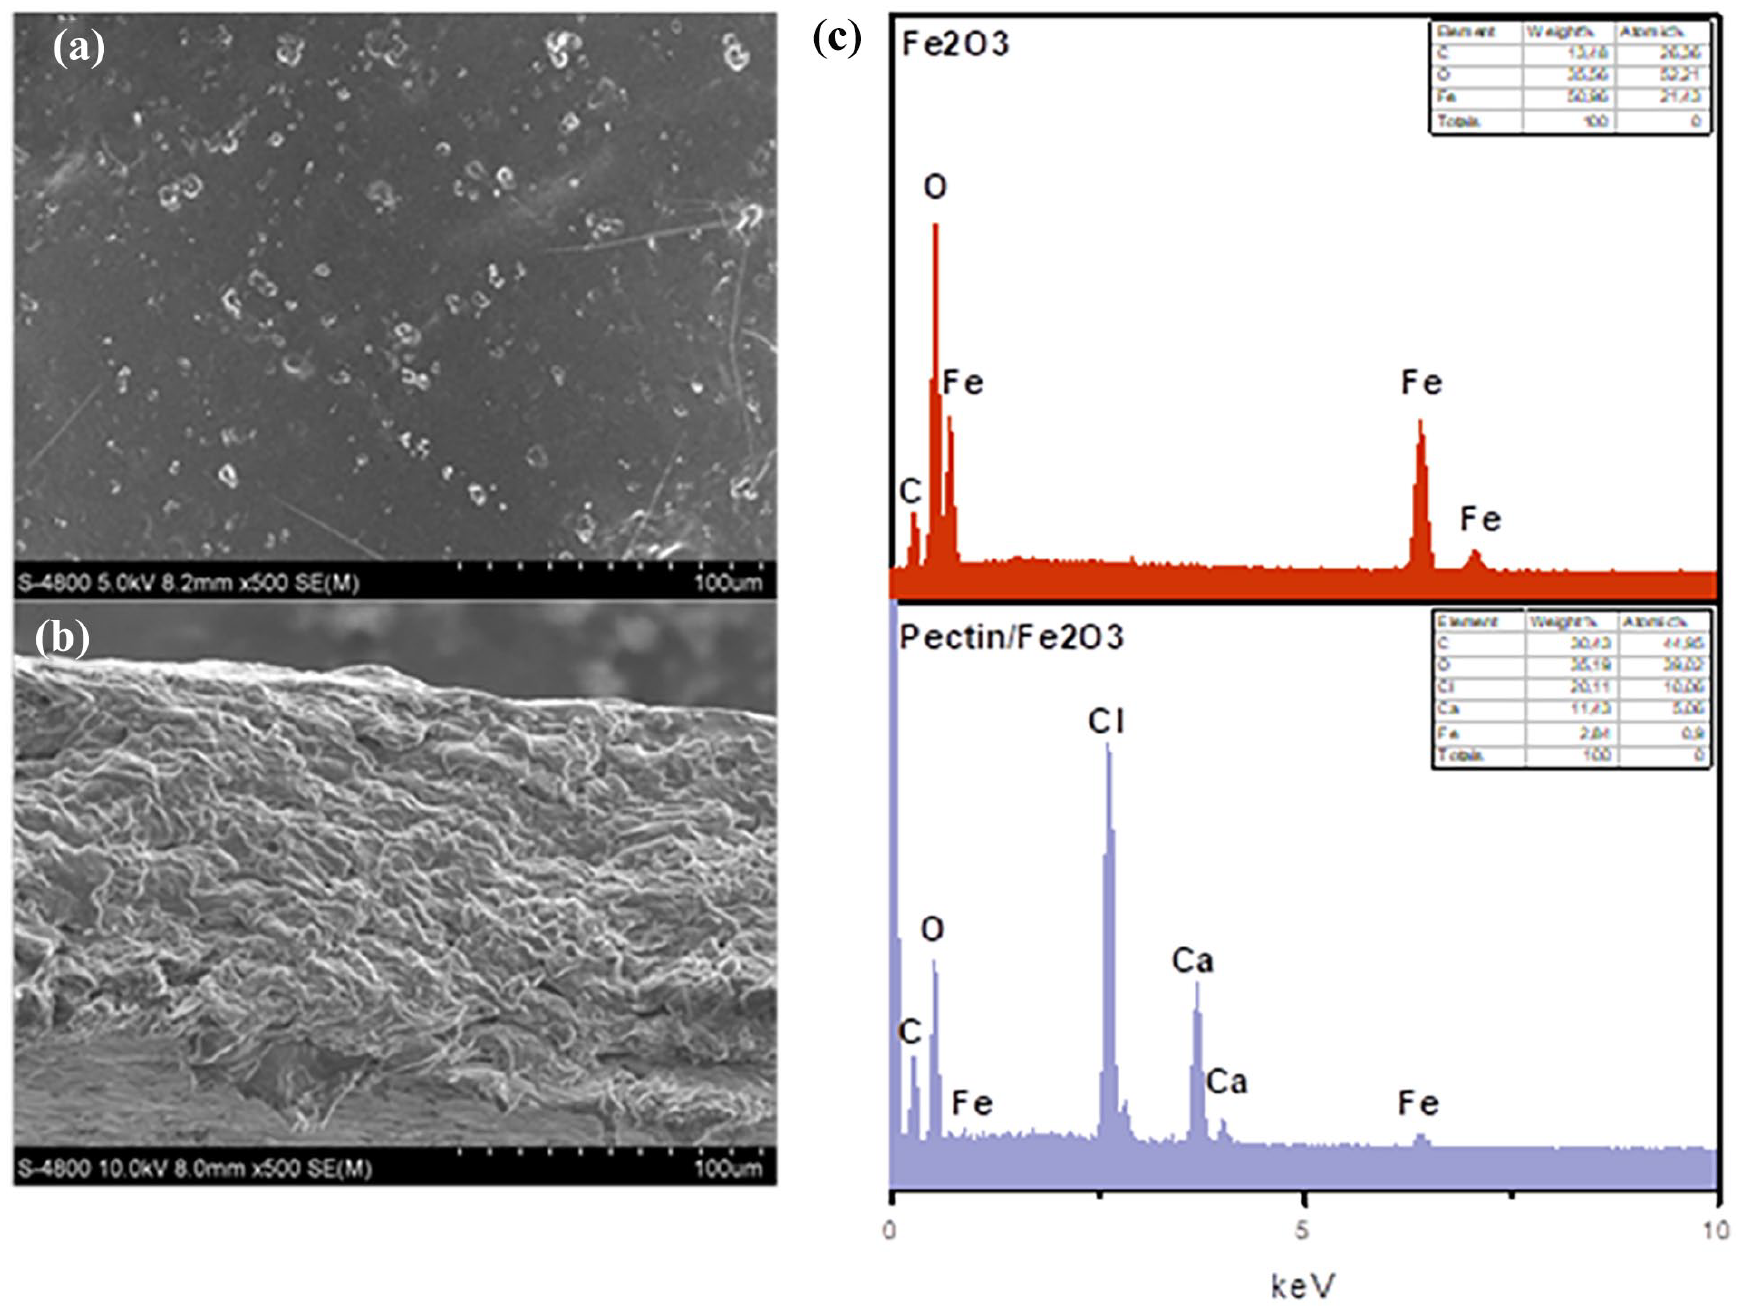
SEM images surface morphology (a), and cross section of pectin/Fe2O3 (b) and EDX results (c).
To clearly understand the formation and bonding of components in pectin film, XRD and FTIR were used for analysis. The crystal structure of Fe2O3, pectin film and pectin/Fe2O3 film was clearly shown in Figure 2(a). Fe2O3 clearly shows crystal peaks at 2θ = 24°, 33°, 36°, 41°, 49°, 54°, 58°, 62°, 64° representing the characteristic crystal structure of α-Fe2O3. In Abbas’s study, the crystal planes corresponding to strong diffraction peaks including (012), (104), (110), (113), (024), (116), (214), (414), and (119) were compared with standard spectrum (JCPDS card number: 33-0664) showing the crystal characteristics of α-Fe2O3. 15 This shows that the Fe2O3 material had a cubic structure and was clearly shown in the SEM image with irregular polyhedra. For pectin from PP peel, the recording at 2θ = 22° shows the characteristics of the pectin component with an amorphous structure. 16 When pectin was combined with Fe2O3, the formation of a crystalline phase was showed with 2θ = 14°, 18°, 22°, 27°, 36°, which indicate the formation of a bonding network between pectin, Fe2O3 and CaCl2 molecules. 17 As shown in Figure 2(b), the FTIR results clearly show the organic bonds were present in the film. FTIR analysis of the nanoparticles shows the presence of some characteristic bands. The peaks at 3416 cm−1, 2344 cm−1, 1613 cm−1, 697 cm−1, 642 cm−1, and 558 cm−1 were attributed to the –OH, C=C, C=O groups of the PP extract, and the formation of bonds with the metal oxide band (M–O). 18 For pectin, the peaks at 3308 cm−1, 2944 cm−1, 1740 cm−1, 1641 cm−1, and 1041 cm−1 had strong bending and elongation vibrations which indicate the presence of O–H groups, C=O groups, C=C groups, CO-O-CO groups (aldehydes). When Fe2O3 material was added to the pectin network, the peaks 3349 cm−1, 1433 cm−1, 1725 cm−1, 1617 cm−1, 1107 cm−1, and 1013 cm−1 correspond to strong bending, rounding and elongation which indicate to be the existence of O–H groups, C=C groups, C=O groups, all vibrations were of the pectin network.

XRD (a) and FTIR (b) patterns of Fe2O3 (a), pectin (b) and pectin/Fe2O3 (c).
Surface area, pore volume and pore size were the important parameters for the adsorption process. The analytical results are shown in Table 1 and Figure 3. The surface area of the pectin film was evaluated before and after adding Fe2O3 and showed that the surface area was improved from 0.5823 to 1.8076 m2 g−1. It can be seen that Fe2O3 molecules help to improve the pores inside the film and increase the interactive functional groups for the pectin film. This was one of the important points to improve the adsorption capacity of the film. According to IUPAC, the nitrogen adsorption isotherm follows the I(b) model shown in Figure 3. Type I(b) isotherms were found for materials with a wider pore size distribution including wider micropores and possibly narrow mesopores (<2.5 nm). 19
BET analysis for surface area, pore size, and porosity present in.
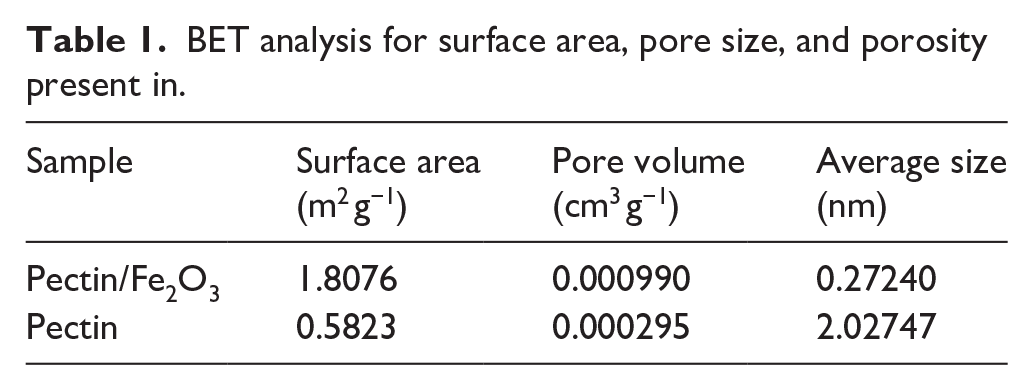

N2 adsorption isotherm of pectin/Fe2O3.
Evaluate the adsorption ability
Pectin/Fe2O3 membranes were evaluated for selective adsorption of positive and negative dyes and the results are shown in Figure 4. For negative dyes (CR and MR), very low adsorption capacities were recorded at 4.9 mg g−1 (CR) and 2 mg g−1 (MR). For positive dyes (CV and BG), adsorption capacities were recorded at 14.1 mg g−1 (CV) and 18.15 mg g−1 (BG). This shows that pectin/Fe2O3 membranes have better adsorption capacity for positive than negative dyes. This is attributed to the interaction between free groups on the membrane surface and dye molecules. Therefore, to have an overview and clearly evaluate the process and interaction between dyes and membranes, experiments on influencing factors, kinetic models and isotherms were performed.

Selective adsorption capacity for CV, CR, BG, MR dyes.
Effect of adsorption conditions
The following influencing factors were evaluated: time, pH, temperature, content, and color concentration. Factors affecting dosage (A) and temperature (B) are shown in Figure 5. In Figure 5(a), the adsorption efficiencies of BG and CV color were increasing rapidly when increasing the membrane content from 0.1 to 4 g L−1 and balances when increasing to 6 g L−1. The membrane content was selected as 4 g L−1 to evaluate the next condition. The results of the influence of temperature on the adsorption capacity were shown in Figure 5(b). The results show that temperature had a clear influence on the adsorption capacity of the material. The temperature was evaluated from room temperature to 60 °C, with the adsorption capacity increasing rapidly from 2.9 mg g−1 (30 °C) to 6.2 mg g−1 (50 °C) for CV color and decreasing when reaching 60 °C. For BG colorant, the best recorded adsorption capacity was 8.5 mg g−1 at 50 °C. This shows that temperature had a certain influence on the color adsorption process of the film. Increasing temperature causes the molecules in the solution to move faster, increasing the adsorption rate. This helps improve the adsorption process. When the temperature increases, it can change the structure of the pectin film, affecting its ability to bind with Fe2O3. This reduces the adsorption capacity of the film, along with rapid disturbance, hindering the adsorption process. To clarify this process, the thermodynamic model would be evaluated and the temperature value of 50 °C was selected as a good value for the following experiments.

Effect of dosage (a) and temperature (b) on adsorption capacity.
The results of the pHpzc value and the pH effect assessment were shown in Figure 6, with pH values from 2 to 10. The pHpzc value was recorded at pH = 4.16, which the surface charge of a material is zero at the pH point. The initial experiment was performed at pH points such as pH2, pH4, pH6, pH8, pH10, but during the evaluation process, it was shown that pH4 and pH6 had equivalent adsorption capacities, so pH3 and pH5 were performed for specific evaluation. The results showed that the highest adsorption capacity of CV color was recorded at 6.2 mg g−1 at pH4 and that of BG color was recorded at 9.8 mg g−1 at pH5. For CV, the pH4 < pHz value shows that the material surface was not consistent to adsorbs CV molecules. This shows that the adsorption capacity of CV was lower than that of BG at the highest pH value. Possible interactions for CV dye were ion exchange and hydrogen bonding. This shows that the adsorption mechanism is consistent with the FTIR analysis results. For BG, the pH5 > pHz value shows that the adsorption process was consistent with the prediction of the pHz method. The material surface was negatively charged, so it easily adsorbs BG molecules (positive charge). This shows that the adsorption mechanism was consistent with the FTIR analysis results. BG was affected at pH > 6, changing from a positive colorant to a colorless quinone form. 20 This hinders the adsorption process, so it can also be seen that after the pH5 value, the BG adsorption capacity decreases sharply. The pH 4 value for CV color and pH 5 for BG color were selected to evaluate the following factors. In order to evaluate comprehensively, the adsorption mechanism was evaluated based on the kinetic model and adsorption isotherm.
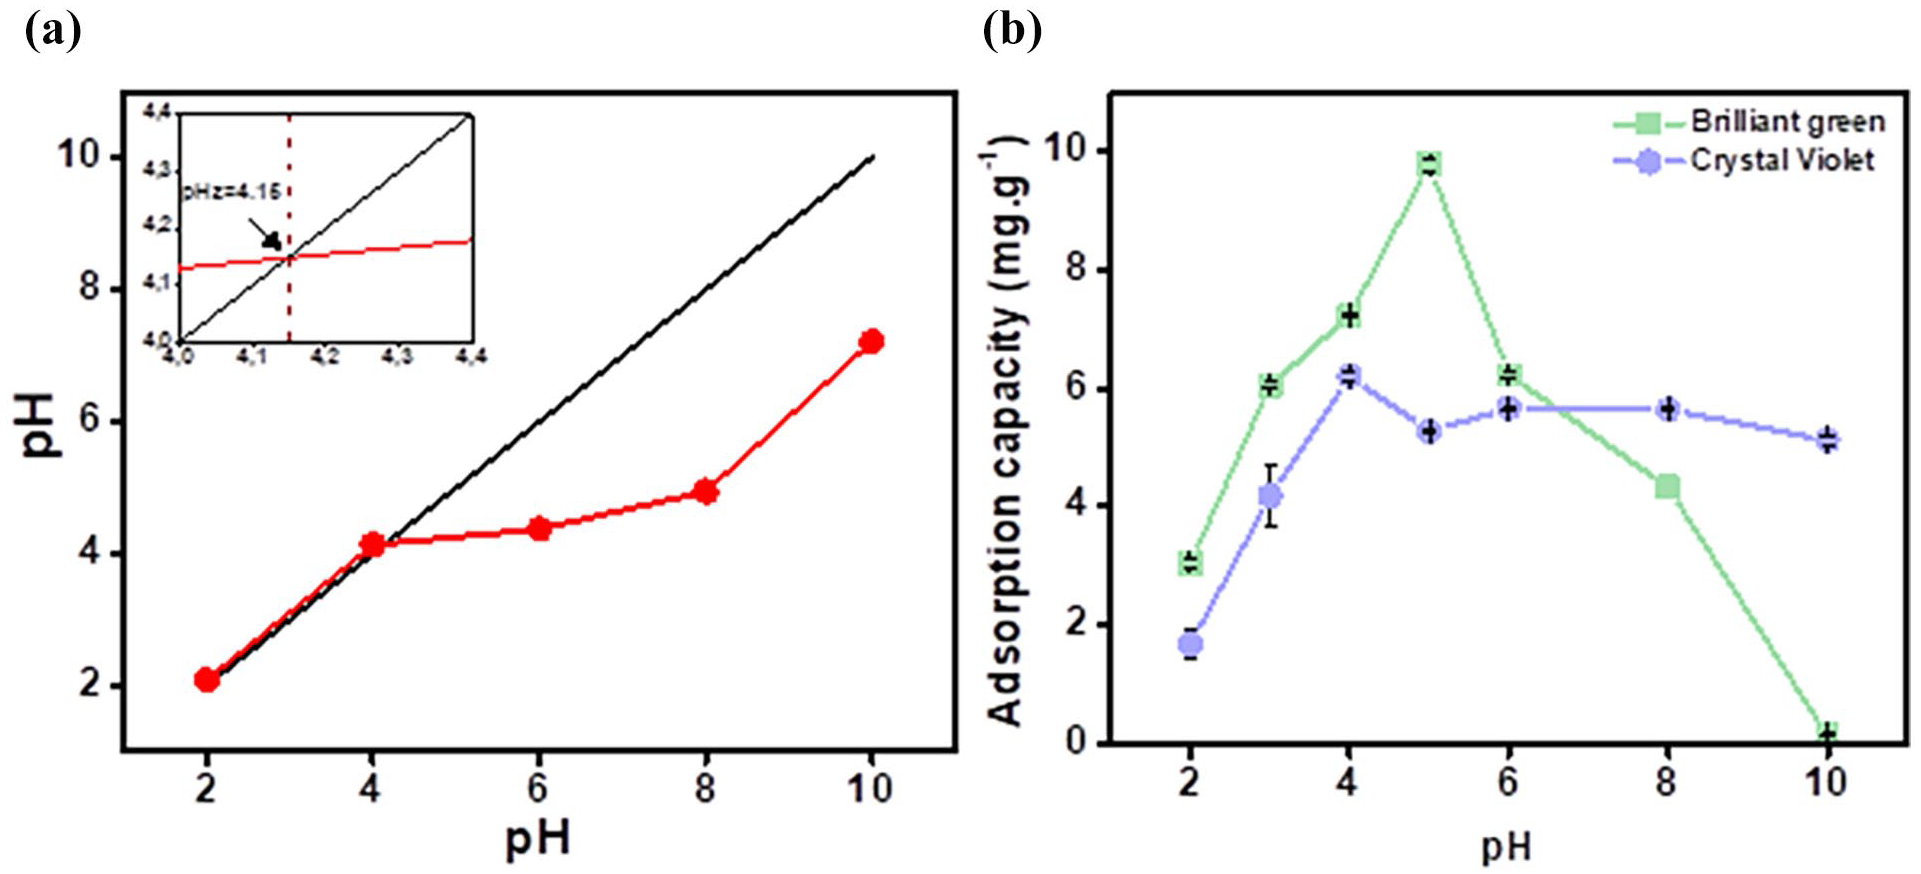
The pHpzc value (a) and effect of pH on adsorption capacity (b).
The effects of time and dye concentration were evaluated and shown in Figure 7(a). The results showed that the adsorption capacity increased rapidly from 0 to 6 mg g−1 for CV and 8 mg g−1 for BG from time point 0 to 30 min. This is the time period in which the initial stage occurs when the membrane begins to contact the dye molecules. This process occurs rapidly when the dye molecules begin to be adsorbed by the membrane and physical and chemical interactions take place. At time point 30 to 120 min, the adsorption capacity increased but not significantly from 6 to 6.6 mg g−1 for CV and 8 to 9.8 mg g−1 for BG. Stage 2 of the adsorption process occurs, with the adsorption process being stable and almost at equilibrium and stage 3 occurs from time point 120 to 240 min. The adsorption capacity at this time almost did not increase but even decreased. The equilibrium stage is when the material both adsorbs and desorbs. At 120 min, the adsorption capacity almost reached equilibrium for both activated carbon materials. Therefore, the time chosen was 120 min to conduct the following experiments.
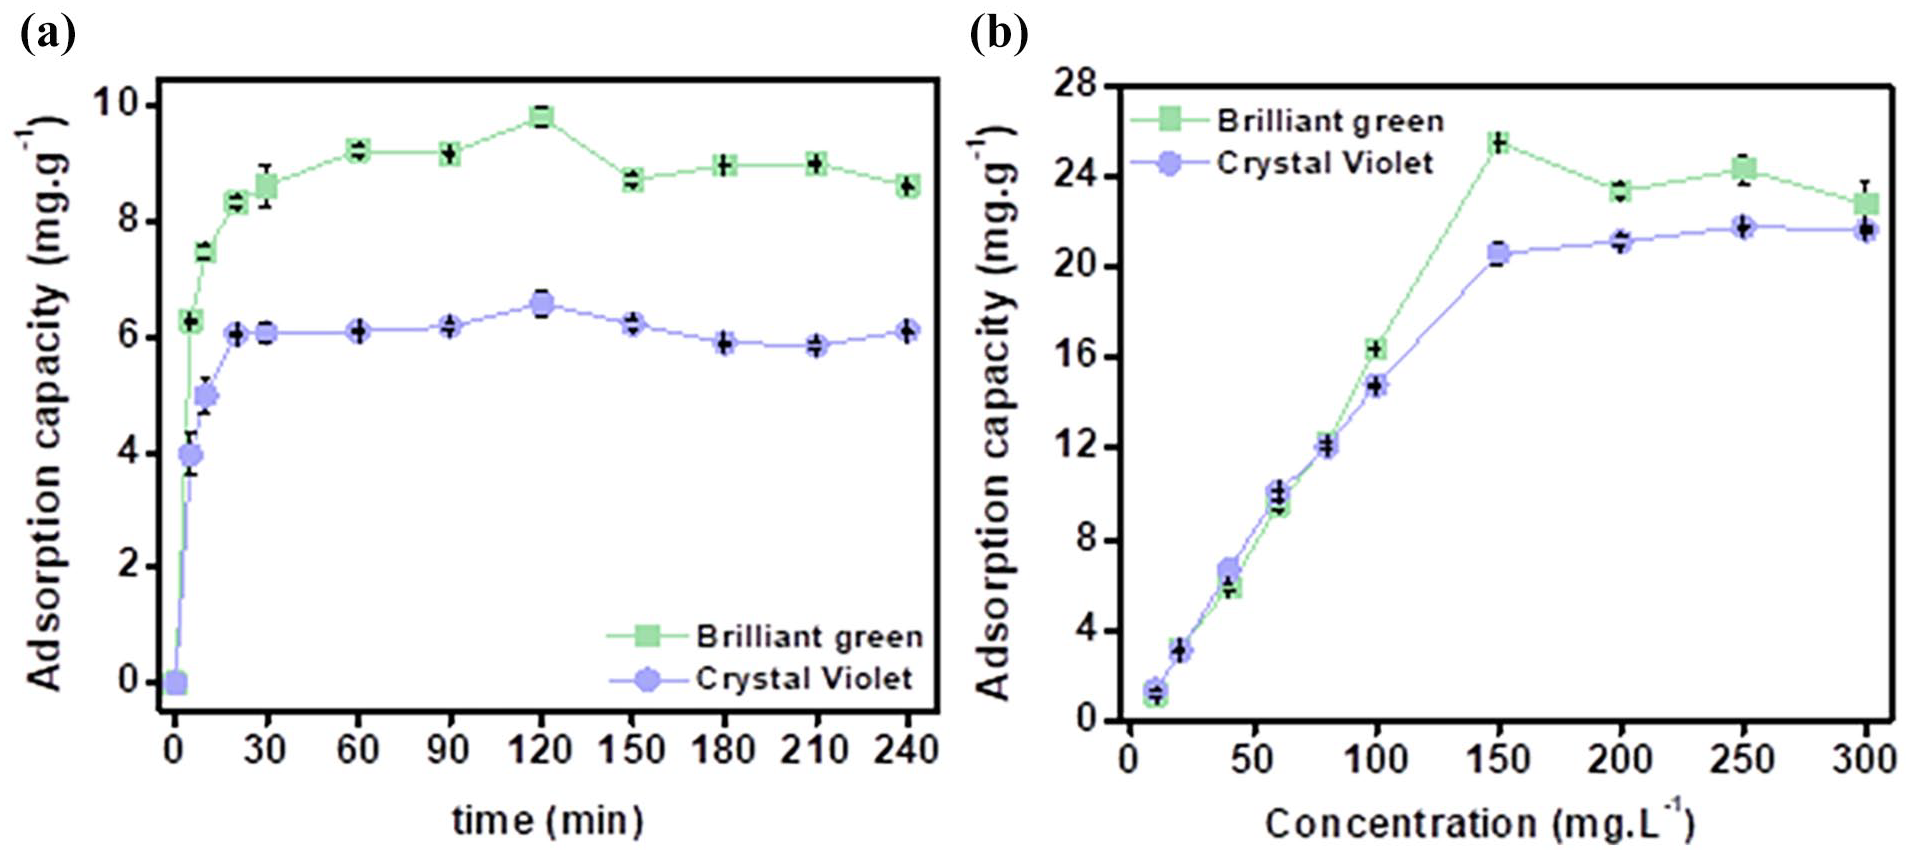
Effect of adsorption time (a) and dye concentration (b) on adsorption capacity.
The results of the color concentration evaluation are shown in Figure 7(b). The adsorption capacity increased rapidly from 1 to 25 mg g−1 for BG and 20 mg g−1 for CV at the dyes concentration range from 10 to 150 mg L−1. However, from a concentration range from 150 to 300 mg L−1, the adsorption capacity almost did not increase but tended to decrease. This shows that at the concentrations below 150 mg L−1, the disturbance of color molecules in the solution was at a suitable level, helping the material to easily adsorb, while at the concentrations above 150 mg L−1, as the density of molecules was excessively high, the disturbance was hindered and the adsorption process decreased. In order to be able to evaluate specifically, adsorption isotherm models were performed. The highest adsorption capacity values recorded for BG and CV were 25 and 20 mg g−1, respectively, at 150 mg L−1 concentration, 4 g L−1 content, pH4 and pH5, temperature of 50 °C, and time of 120 min. The best adsorption condition was selected as the central condition for the optimization evaluation using RSM model.
Adsorption kinetics and isotherm models
The adsorption process will be evaluated using pseudo-first-order, pseudo-second-order, Elovich and Bangham kinetic models. The kinetic model of the membrane for BG and CV dyes is shown in Figure 8. The results show that the experimental values are evenly distributed on the kinetic model curve. The model results are also shown in Table 2. The results show that the adsorption process of BG and CV follows the PSO model with R2 = 0.983 and 0.977. The predicted adsorption capacities are 9.260 mg g−1 (BG) and 6.335 mg g−1 (CV) along with the adsorption rate constants of 0.04 min−1 and 0.062 min−1. In addition, the error from the PSO model was also recorded with the lowest value compared to the PFO model, Elovich and Bangham showed that the suitability of the PSO model was the best for predicting the adsorption process in practice. This shows that the adsorption process takes place slowly with chemical interactions. Chemical interactions are one of the important interactions in the adsorption process.

Kinetic models of Brilliant Green (a) and Crystal Violet (b).
Kinetic parameters of CV and BG adsorption of membrane.

The adsorption process was evaluated by the Langmuir, Freundlich, Temkin, DR isotherm models. The isotherm models of BG and CV are shown in Figure 9. It can be seen that the distribution of experiments according to the model is very uniform. In addition, the results of the model are shown in Table 3. The results show that the adsorption process of CV follows the Langmuir model and BG follows the DR model with R2 = 0.953 and 0.915. The maximum adsorption capacity is predicted to be 30.547 mg g−1 (BG) and 27.792 mg g−1 (CV) from the Langmuir model. The errors from the model show that the Langmuir model fits the experimental values for BG and CV. In addition, the errors of the Temkin model also give similar errors to Langmuir, indicating a high level of model suitability. From there, the results show that the Langmuir and Temkin models are suitable to predict the adsorption process of materials in practice. In addition, the parameters RL = 0.348 (BG) and 0.369 (CV) show that the adsorption process takes place smoothly when RL is in the range of values from 0 to 1. The adsorption process is predicted to take place according to the single adsorption mechanism with adsorption points and uniform binding energy on the adsorption surface.

Isothermal models of Brilliant Green (a) and Crystal Violet (b).
Isothermal parameters of CV and BG adsorption of membrane.

It can be seen that the adsorption capacity of pectin/Fe2O3 membrane was predicted and the adsorption capacity of the membrane was also recorded at 23,433 mg g−1 for BG and 27,792 mg g−1 for CV. Comparison with other studies has been shown in Table 4. The results show that the composite membranes combined with Fe2O3 give adsorption capacities from 11,476 to 60 mg g−1 for some positive-based dyes or BG and CV dyes. In which, the adsorption capacity for CV is not high when the organic polymer membrane combined with Fe2O3 is only about 20–30 mg g−1. This is also consistent with the results that have been studied. When combining Fe2O3 membrane with another precursor such as SiO2, MWCNTs, rGO, Clinoptilolite, the adsorption capacity is significantly improved, increasing to more than 40 mg g−1. This shows that the actual adsorption capacity of the polymer membranes combined with Fe2O3 is in the range of 20–30 mg g−1.
Comparison of adsorption capacity of Pectin/Fe2O3 membrane with other studies.

Mechanism prediction
The evaluation of the adsorption kinetic and isotherm models showed that the material had adsorption mechanisms corresponding to CV (pseudo-second-order, pseudo-first-order, Langmuir and Temkin) and BG (pseudo-second-order, Elovich, Langmuir and DR). The adsorption mechanism was predicted and shown in Figure 10. Pectin films were described as monolayer adsorption surfaces with adsorption energy points on the material surface. The adsorption of BG and CV by Pectin/Fe2O3 membrane relies of both physical adsorption and chemisorption processes, including electrostatic interactions, hydrogen bonding, π–π interactions, n–π interactions, cation exchange, surface adsorption, pore-filling diffusion process, and interactions with functional groups.28,29 FTIR results showed that the functional groups active on the membrane surface include OH, CO, C=C, and C=O groups. The OH group was involved in many interactions with the dye, such as electrostatic interactions, hydrogen bonding, and n–π interactions.29,30 For BG dyes, electrostatic interactions (cation interaction) occurred when the OH groups on the surface were deprotonated to O—groups and interacted with the BG molecule. Studies of the effect of pH had demonstrated this. In the study of Diego Barzallo, this interaction was also predicted for the dyes Methylene blue and Methyl green. 28

Predict the adsorption mechanism of the membrane.
Evaluation of reusability
Reusability was one of the factors that evaluate the potential of a material for practical applications. The evaluation process includes the type of solvent and the number of reuses and was shown in Figure 11. Three solvents were used for evaluation: water, ethanol, and acetone. The results showed that the adsorption capacity of the material after washing with water was almost zero. It can be seen that the water solvent cannot remove the color molecules that have adhered to the material’s surface. For the samples washed with acetone and ethanol, the adsorption capacities were recorded (25.43 and 18.23 mg g−1) for BG and (21.8 and 14.79375 mg g−1) for CV. The results showed that the two solvents removed the colorant on the surface at the interaction points. In which ethanol solvent gives the highest adsorption capacity after washing process. So, ethanol solvent was chosen to evaluate the following factors. The reuse results were shown in Figure 11(b), with up to 5 reuses recorded. The adsorption capacity from the first to the fourth adsorption decreased from 25.5375 to 20.24 mg g−1 for BG (corresponding to 20.7%). For CV colorant, the adsorption capacity decreased from 20.6375 to 15.8 mg g−1 corresponding to 23.4%. In which, the adsorption capacity gradually decreased through reuses, but by the fifth reuse, the adsorption capacity decreased sharply. This was believed to be because the active sites on the material surface were filled with color molecules. Therefore, the pectin/Fe2O3 membrane showed the ability to be reused four times with a negligible decrease in adsorption capacity. This is one of the bright spots for further research on the possibility of applying pectin/Fe2O3 membrane in practice.

Evaluation of cleaning solvent (a) and number of reuses (b).
Conclusion
In this study, the composite pectin/Fe2O3 membrane material was successfully synthesized from the waste of green-skinned Pomelo peel. Through the structural analysis methods of SEM, EDX, XRD, FTIR, and BET, it was found that the Fe2O3 material has a hexagonal shape, the pectin/Fe2O3 material had tiny holes attached to the surface, and the cut surface shows the membrane has close-knit fibers. The best adsorption capacity of BG (mg g−1) and CV (mg g−1) dyes was evaluated at 4 g L−1, temperature 50 °C, pH 5 with BG color and pH 4 with CV dyes, 120 min, and concentration 150 mg L−1 at the best conditions. CV (pseudo-second order, pseudo-first order, Langmuir and Temkin) and BG (pseudo-second order, Elovich, Langmuir and DR) adsorption processes were specifically predicted with different interactions. It can be seen that the same positive dye but the interactions between the dyes are different. This helps to open up studies on the isolation of dyes in color mixtures. Therefore, the pectin/Fe2O3 membrane material synthesized by green chemistry method is a potential material from PP waste, to replace other adsorbent materials thanks to its cost optimization.
Materials and methods
Pretreatment and chemicals
After collecting, Pomelo peel (PP) was washed to remove dirt and damaged parts. PP was dried at 50 °C for 48 h to remove water. Afterwards, PP was crushed into fine powder. Sodium hydroxide (NaOH), iron (III) chloride hexahydrate (FeCl3.6H2O), and ethanol (⩾ 95% purity) were produce from Xilong Scientific Co., Ltd. Methyl blue (MB), Brilliant green (BG), Congo red (CR), Methyl red (MR), Crystal violet (CV) were produce from Sigma-Aldrich Co, Switzerland.
Preparation of extracted and pectin from Pomelo peel
PP extract was obtained by using the maceration method. 1 g of PP powder was added to 15 mL of 70% ethanol in Erlenmeyer flask for 24 h, at 30 °C. The extracted solution was filtered in Buchner flask to remove PP powder. The PP extract was maintained in tube samples in a refrigerator at 10 ± 5 °C. PP powder and add 10 mL of 1M citric acid solution. Stir the mixture for 2 h at 70 °C, speed 500 rpm, pH 1.5. Then, filter the residue and collect the extract. The extract was washed with ethanol and centrifuged at 6000 rpm for 15 min to obtain solids to collect pectin, and dried at 60 °C for 24 h. The sample will be washed many times to pH about 4–5. The sample was collected and ground to collect pectin powder, and stored in desiccator.
Preparation of Fe2O3 synthesis
The synthesis of Fe2O3 nanoparticles was based on Mohsan Bashir’s research with some modifications. 14 FeCl3.6H2O was added to 100 mL of deionized water at a concentration of 0.1M and stirred at 70 °C for 60 min. One hundred milliliters of PP extract was slowly added to the Fe3+ solution and stirred at 70 °C for 60 min. Fifty milliliters (1 mM) of NaOH was slowly added to the solution every 30 min. During this process, the solution changes from yellow brown to brown and then turn black as the extract and NaOH was added, indicating the formation of colloidal Fe2O3 nanoparticles. The sample was centrifuged to collect solids and washed several times with deionized water and ethanol to remove residual iron and residual extract from the sample. After washing, the sample was dried at 80 °C for 48 h and crushed to obtain Fe2O3 powder. The sample was collected, grounded, and stored in desiccator.
Preparation of pectin/Fe2O3 synthesis
pectin/Fe2O3 membrane synthesis process was showed in Figure 12 with the specific parameters. Weigh 1 g of pectin, dissolve in 100 mL of distilled water and stir for 24 h (solution A). Weigh 0.2 g of Fe2O3, dissolve in 50 mL of distilled water and sonicate until completely dissolved (solution B). Solutions A and B were mixed and stirred slowly in 5 min, added 50 mL of CaCl2 solution (20 mg mL−1) and stirred for 6 h. The solution membrane was casting on square mold and dry sample at 60 °C for 24 h. The pectin/Fe2O3 membrane was stored in desiccator and used for subsequent experiments.

pectin/Fe2O3 membrane synthesis process.
Characterization
The surface morphology and element of pectin/Fe2O3 were examined by Energy Dispersive X-ray Spectroscopy (EDX) and Scanning Electron Microscopy (SEM) using Hitachi S-4800 system, Japan. The functional groups of the pectin/Fe2O3 were analyzed in the range of 4000 cm−1 to 400 cm−1 coated with KBr powder by a Nicolet 6700 Spectrometer (FTIR). Crystallinity and structure were determined via X-ray diffraction (XRD) at a scan rate of 2° min−1 (2θ) with CuK radiation (1.5406 Å) using a Siemens D5000 diffractometer. The surface area and pore size of pectin/Fe2O3 were analyzed by Static Volumetric Gas Adsorption (SVGA) using N2 gas adsorption/desorption with 1 g.(cm3)−1 degas at 150 °C for 12 h and tested in the Micro Active for TriStar II Plus 2.03 (High Throughput Surface Area and Porosity Analyzer). A UV-Vis spectrophotometer (Metash UV-5100 spectrophotometer) was used to analyze dyes concentrations in solution samples.
Adsorption experiment
Adsorption evaluation experiments were performed based on the procedure performed in previous studies with some changes.31 –33 A total of 0.05 g of pectin/Fe2O3 nanoparticles and 50 mL of dyes solution (concentration of 25 mg L−1, pH6) were added to 250 mL Erlenmeyer flask. Then, the sample was shaken in an incubator shaker (JEOTECH IST-4075R—Korean) at 30 °C for 2 h. The sample mixture was centrifuged at 6000 rpm to recover the color solution after adsorption. Adsorption capacity (qe) and adsorption efficiency (H%) were calculated by applying formula (1)–(2) in which, the initial dye concentration (Co) and the equilibrium dye concentration (Cf) were determined by a UV-Vis spectrophotometer.


In the adsorption process, the several conditions such as time, pH, temperature, concentration and dosage were investigated. The time was tested from 0 to 240 min. The temperature was tested from 30 °C to 60 °C. The concentration was tested from 0 to 500 mg L−1. The dosage was tested from 0.2 to 4 g L−1. The pH in solution was tested from pH2 to pH10. The pH values were determined using a pH meter and adjusted with 0.01M NaOH and HCl solutions.
The acids/bases surface and zeta potential measurement (pHpzc)
The pH point zero charge (pHpzc) was investigated by the method reported in Thuan and Bich’s study.34,35 0.1 g of pectin/Fe2O3 and 100 mL KCl solution (0.1 mol/L of concentration) were added in Erlenmeyer flask with pH from 2 to 10 adjust by KOH and HCl at concentrations of 0.1M and 0.01M. The samples were shaken for 3 h and stabilized for 24 h at room temperature. The initial pH (pHi) and pH final (pHf) values were recorded by using a Hanna Instruments HI2210-02 bench machine pH meter. pHpzc was determined at crosspoint between pHi and pHf on the pH value chart.36 –38
Adsorption kinetics and isotherm model
The adsorption mechanism helps explain the interaction between pectin/Fe2O3 nanoparticles and dye through prediction from models. Kinetic and isothermal models were executed from the equations in the form of nonlinear models based on Quyen’s research. 32 The model’s coefficients with the adjusted R2 coefficient were calculated based on formulas and presented in Table 5.
Equations of kinetic and isothermal models.

Washing and reuse experiment
To evaluate the reusability and applicability of the membrane. The pectin membrane was adsorbed at 4 g L−1, temperature 50 °C, pH 5 with BG color and pH4 with CV dyes, 120 min, and concentration 150 mg L−1 at the best conditions. Next, the membrane was desorbed by soaking it in ethanol solvent for 24 h to remove the colorant on the membrane. The washing process was repeated many times until the membrane could not desorb the colorant molecules. After washing, the membrane was dried at 60 °C for 24 h. Then, the membrane was re-adsorbed at the selected conditions.
Footnotes
Acknowledgements
We acknowledge Nguyen Tat Thanh University, Ho Chi Minh City, Vietnam for supporting this study.
Ethical considerations
This paper does not contain any studies with human or animal participants.
Consent to participate
This paper has no human participants and informed consent is not required.
Consent for publication
Not applicable.
Author contributions
Writing – original draft preparation: B.N.H. and T.T.H.; data curation: L.M.N. and A.M.H.; methodology: Q.M.T.D.; writing – review and editing: L.G.B. and T.T.H. All authors have assented to the manuscript’s published version.
Funding
The author(s) disclosed receipt of the following financial support for the research, authorship, and/or publication of this article: The study was supported by the Science and Technology Incubation Program for Youth (STIY), managed by the Youth Promotion Science and Technology Center of the Ho Chi Minh City Communist Youth Union and the Department of Science and Technology of Ho Chi Minh City, under contract number “02/2024/HĐ-KHCNT-VƯ.”
Declaration of conflicting interests
The author(s) declared no potential conflicts of interest with respect to the research, authorship, and/or publication of this article.