
Abstract
The zinc(II) bis-(8-hydroxyquinoline) (Znq2) has excellent photoluminescence properties, and its fluorescence emission can be significantly quenched by Fe3+ in water. To accelerate the detection response of Znq2 to Fe3+, a luminescent metal–organic framework Znq2@ZIF-8 based on guest molecular luminescence was constructed by growing zeolite imidazolate framework-8 (ZIF-8) on the outer surface of Znq2. The results show that the prepared Znq2@ZIF-8 has an octahedral core–shell structure, a particle size of approximately 1–3 μm, an enhanced specific surface area of 1105.41 m2 g−1, and with a stable green luminescence at 495 nm. A fluorescence analytical method was developed for the detection of Fe3+ in water, the correlation coefficients were significant in the Fe3+ concentration range of 0–600 μmol L−1, and the limit of detection was as low as 3.89 μmol L−1. The spiked recoveries of tap water samples demonstrated that the method could be applied to practical applications. The mechanism of fluorescence detection is that Fe3+ participates in the competitive coordination of Znq2@ZIF-8 metal centers, leading to the collapse of the crystal structure, meanwhile, Fe3+ produces a certain degree of competitive absorption of the excitation light of Znq2@ZIF-8. This method was applied for the detection of Fe3+ in water with good selectivity, anti-interference ability, and has the potential to be used as a rapid detection method.

Introduction
Iron (Fe), an essential trace element, is involved in the synthesis of hemoglobin and oxidative enzymes in the human body, and if the iron content in the body deviates from the appropriate range, it may cause mental depression, metabolic disorders, growth retardation, and increased risk of cancer.1–3 Most of the existing assays use atomic fluorescence spectrometry, atomic absorption spectrometry and X-ray fluorescence spectroscopy to determine the metal content, but most of these methods are time-consuming and expensive to perform and require skilled operators, which are shortcomings that limit their application in routine analysis. 4 Fluorescence detection, a method used to indicate the content of a substance through changes in the photoluminescence intensity of a fluorescent material, can be used to detect a particular substance through rational design and has the advantages of less interference, simple operation, high sensitivity and low cost.5–7 Metal–organic frameworks (MOFs) are self-assembled from metal ions and organic ligands with high porosity, specific surface area, and good structural stability. 8 One class of MOFs with optical properties is known as luminescent metal–organic framework (LMOFs), where fluorescence can come from metal centers, organic ligands, and guest molecules and has been used to identify and detect environmental pollutants such as metal cations, anions, biomolecules, and pesticides in the environment. 9 The synthesis of LOMFs based on guest molecule luminescence is simple and can utilize the excellent optical properties of guest molecules, on one hand, and the high specific surface area and porosity of the MOF matrix, on the other hand, which can effectively enrich pollutants and improve the detection response speed.
Traditional guest luminescent molecules mainly include dyes, quantum dots, luminescent metal complexes, etc. In the synthesis of guest molecule–based luminescent LMOFs, since most MOFs need to be synthesized under hydrothermal conditions, avoiding the influence of specific synthesis conditions on the structure and fluorescence properties of guest molecules is an important prerequisite. For example, Han et al. 10 used a one-pot method to rapidly encapsulate highly luminescent AlQ3 (tris(8-hydroxyquinoline) aluminum) as a guest molecule within the pore structure of ZIF-8 host crystals, which did not result in morphological and structural differences compared to a single ZIF-8 structure, failing to account for the morphological and structural compositions of the AlQ3 in the composite. Many studies have utilized the structural characteristics of the MOF matrix to encapsulate dye-luminescent molecules inside its pores. However, considering that dye molecules are instability, they are difficult to apply to the detection of pollutants in aqueous environments and may generate secondary pollution.11–13
In this study, a guest molecular luminescent–based LMOF was constructed as shown in Figure 1. Zinc(II) bis-(8-hydroxyquinoline) (Znq2) with an octahedral morphology was synthesized by a hydrothermal method, and ZIF-8 was synthesized by in situ coating on the outer surface of Znq2 to form a core–shell structure of Znq2@ZIF-8, and the composite has the morphology and structure of each component. Znq2@ZIF-8 retains the luminescent characteristics of Znq2, while the outer coating of ZIF-8 can accelerate the rate of mass transfer recognition of targets and improve structural stability. A turn-off fluorescent probe was constructed for the trace detection of Fe3+ using fluorescence analysis, and the spiked recovery test demonstrated the potential of the fluorescence analysis method for practical application.

Schematic diagram of the synthesis pathway and Fe3+ detection of Znq2@ZIF-8.
Results and discussion
Characterization of morphology and structure
Scanning electron microscopy (SEM) images of Znq2, ZIF-8, and Znq2@ZIF-8 are shown in Figure 2(a)–(c), respectively. Znq2 has a smooth octahedral structure with a particle size of 1–3 μm, whereas the particle size of ZIF-8, which is used as a shell layer material, is approximately 50 nm. The core–shell material Znq2@ZIF-8 with Znq2 as the core and ZIF-8 as the shell layer has a distinct octahedral profile. Compared with the smooth Znq2 octahedra, many small ZIF-8 particles were obviously present on the outer surface of the formed Znq2@ZIF-8, and the size of the material increased slightly with the formation of shell layer. As shown in the transmission electron microscopy (TEM) image in Figure 2(d), Znq2@ZIF-8 has an obvious core–shell structure. Figure 2(e) shows the SEM-energy dispersive X-ray spectroscopy (EDS) mapping analysis, and C, O, N and Zn are uniformly distributed in Znq2@ZIF-8.

SEM images of (a) Znq2, (b) ZIF-8, and (c) Znq2@ZIF-8. (d) TEM image of Znq2@ZIF-8. (e) SEM-EDS elemental mapping profiles of Znq2@ZIF-8.
Fourier-transform infrared spectroscopy (FTIR), as shown in Figure 3(a), revealed that ZIF-8 is located at 1580, 1500–1350, 1350–600, and 420 cm−1, which correspond to the stretching vibration of C=N, the planar stretching vibration of the imidazole ring, the planar bending vibration of the imidazole ring, and the stretching vibration peaks of the Zn–N bond, respectively, 14 these peaks are also found in Znq2@ZIF-8. In addition, there are also C=N stretching vibration peaks and Zn–N bond stretching vibration peaks at 1580 and 420 cm−1 for Znq2, and the characteristic vibrational absorption of the benzene ring skeleton at 1500 and 1467 cm−1 by quinoline structure, the stretching vibration absorption of the C–O bond at 1279 and 1114 cm−1, and the absorption belonging to Zn–O and Zn–N in the range of 400–600 cm−1, these peaks are also present in Znq2@ZIF-8. 15 As shown in X-ray diffraction analysis (XRD) diffraction pattern (Figure 3(b)), the characteristic diffraction peaks of Znq2 located at 8.9°, 10.9°, 13.7°, and 22.6° correspond to the four crystal planes of (023), (110), (101), and (311), respectively, 16 which appear in Znq2@ZIF-8. Similarly, the diffraction peaks located at 7.4°, 12.8°, 14.7°, 16.5°, and 18.1° in ZIF-8 are attributed to the five crystal faces (011), (112), (022), (013), and (222) of the ZIF-8 crystal, respectively, 17 and the corresponding diffraction peaks can be found in the XRD pattern of Znq2@ZIF-8. N2 adsorption and desorption isotherm tests were performed to determine the BET specific surface area, pore size distribution, and pore volume of the material (Figure 3(c)). The results show that the specific surface area of Znq2 is small, and its adsorption isotherm is of type II isotherm, which is a typical physical adsorption result of nonporous or macroporous adsorbents. In contrast, ZIF-8, as a porous adsorbent, has a high specific surface area, and the enhancement of the specific surface area of Znq2@ZIF-8 through the composite is obvious, which is mainly attributed to ZIF-8, and the high specific surface area can lead to more adsorption sites. The adsorption isotherms of ZIF-8 and Znq2@ZIF-8, on the contrary, exhibit typical type I isotherms, reflecting the phenomenon of microporous filling belonging to microporous adsorbents. 18 As shown in Figure 3(d), the pore structure of Znq2 is less significant, which corresponds to the nonporous physical adsorption of the type II isotherm, while ZIF-8 and Znq2@ZIF-8 are distributed with many microporous structures corresponding to the type I isotherm. The specific surface area, pore volume, and average pore size of the materials are detailed in Table 1.

(a) FTIR. (b) XRD. (c) N2 adsorption and desorption isotherms. (d) Pore size distributions.
The BET surface area, pore volume and mean pore size of Znq2, ZIF-8, and Znq2@ZIF-8.

Characterization of fluorescence properties
To evaluate the fluorescence properties of Znq2@ZIF-8, UV-Vis spectra and fluorescence spectra of several components were obtained to determine their fluorescence sources. As shown in Figure 4(a), both Znq2 and Znq2@ZIF-8 produced UV absorption near 257 nm, and a broad absorption peak at 360 nm, both of which can be attributed to the UV absorption properties of 8-HQ (8-hydroxyquinoline) and produce a certain degree of absorption redshift with respect to 8-HQ, which is related to the formation of the Zn–O/N coordination structure in Znq2. The strong absorption band of Znq2@ZIF-8 at 257 nm and the broad absorption band near 360 nm are attributed to π–π* electron-leap absorption in the quinoline ring and charge transfer from the electron donor O to the acceptor N, respectively. 15 8-HQ–based metal coordination compounds have high fluorescence, whereas a single 8-HQ has low fluorescence due to excited-state intramolecular proton transfer (ESIPT). The formation of a coordination structure with metal ions, blocks the ESIPT channel, thus restoring strong fluorescence emission. 19 Therefore, 8-HQ and Znq2 have similar fluorescence emission peaks (near 500 nm), Znq2@ZIF-8 and Znq2 have stronger fluorescence emission (Figure 4(b)), whereas ZIF-8 does not show fluorescence emission under the same excitation conditions, which suggests that the fluorescence source of Znq2@ZIF-8 is 8-HQ, which is an LMOF based on guest molecular luminescence. Figure 4(c) shows the fluorescence emission spectra of Znq2@ZIF-8 at 257, 360 nm, and nearby photoexcitation wavelengths, and the strongest emission corresponding to 495 nm was produced under excitation at 360 nm (λex = 360 nm, λem = 495 nm). By comparison, the excitation spectrum of Znq2@ZIF-8 under fixed emission at 495 nm (Ex@495 nm) and the emission spectrum under fixed excitation at 360 nm (Em@360 nm) have almost the same coincidence (Figure 4(d)), which is symmetric and produces a large Stokes shift of 135 nm, which can effectively prevent interference caused by the excitation light source during the fluorescence detection process. Fluorescence stability is a prerequisite for the application of fluorescent probes in practice. Therefore, the stability of Znq2@ZIF-8 was investigated in the range of 0–7 days (Figure 4(e)), and it can be clearly observed that there was no trend of fluorescence intensity decay in this range of time. The green fluorescence characteristics of Znq2@ZIF-8 were determined by the CIE chromaticity coordinates (Figure 4(f)).
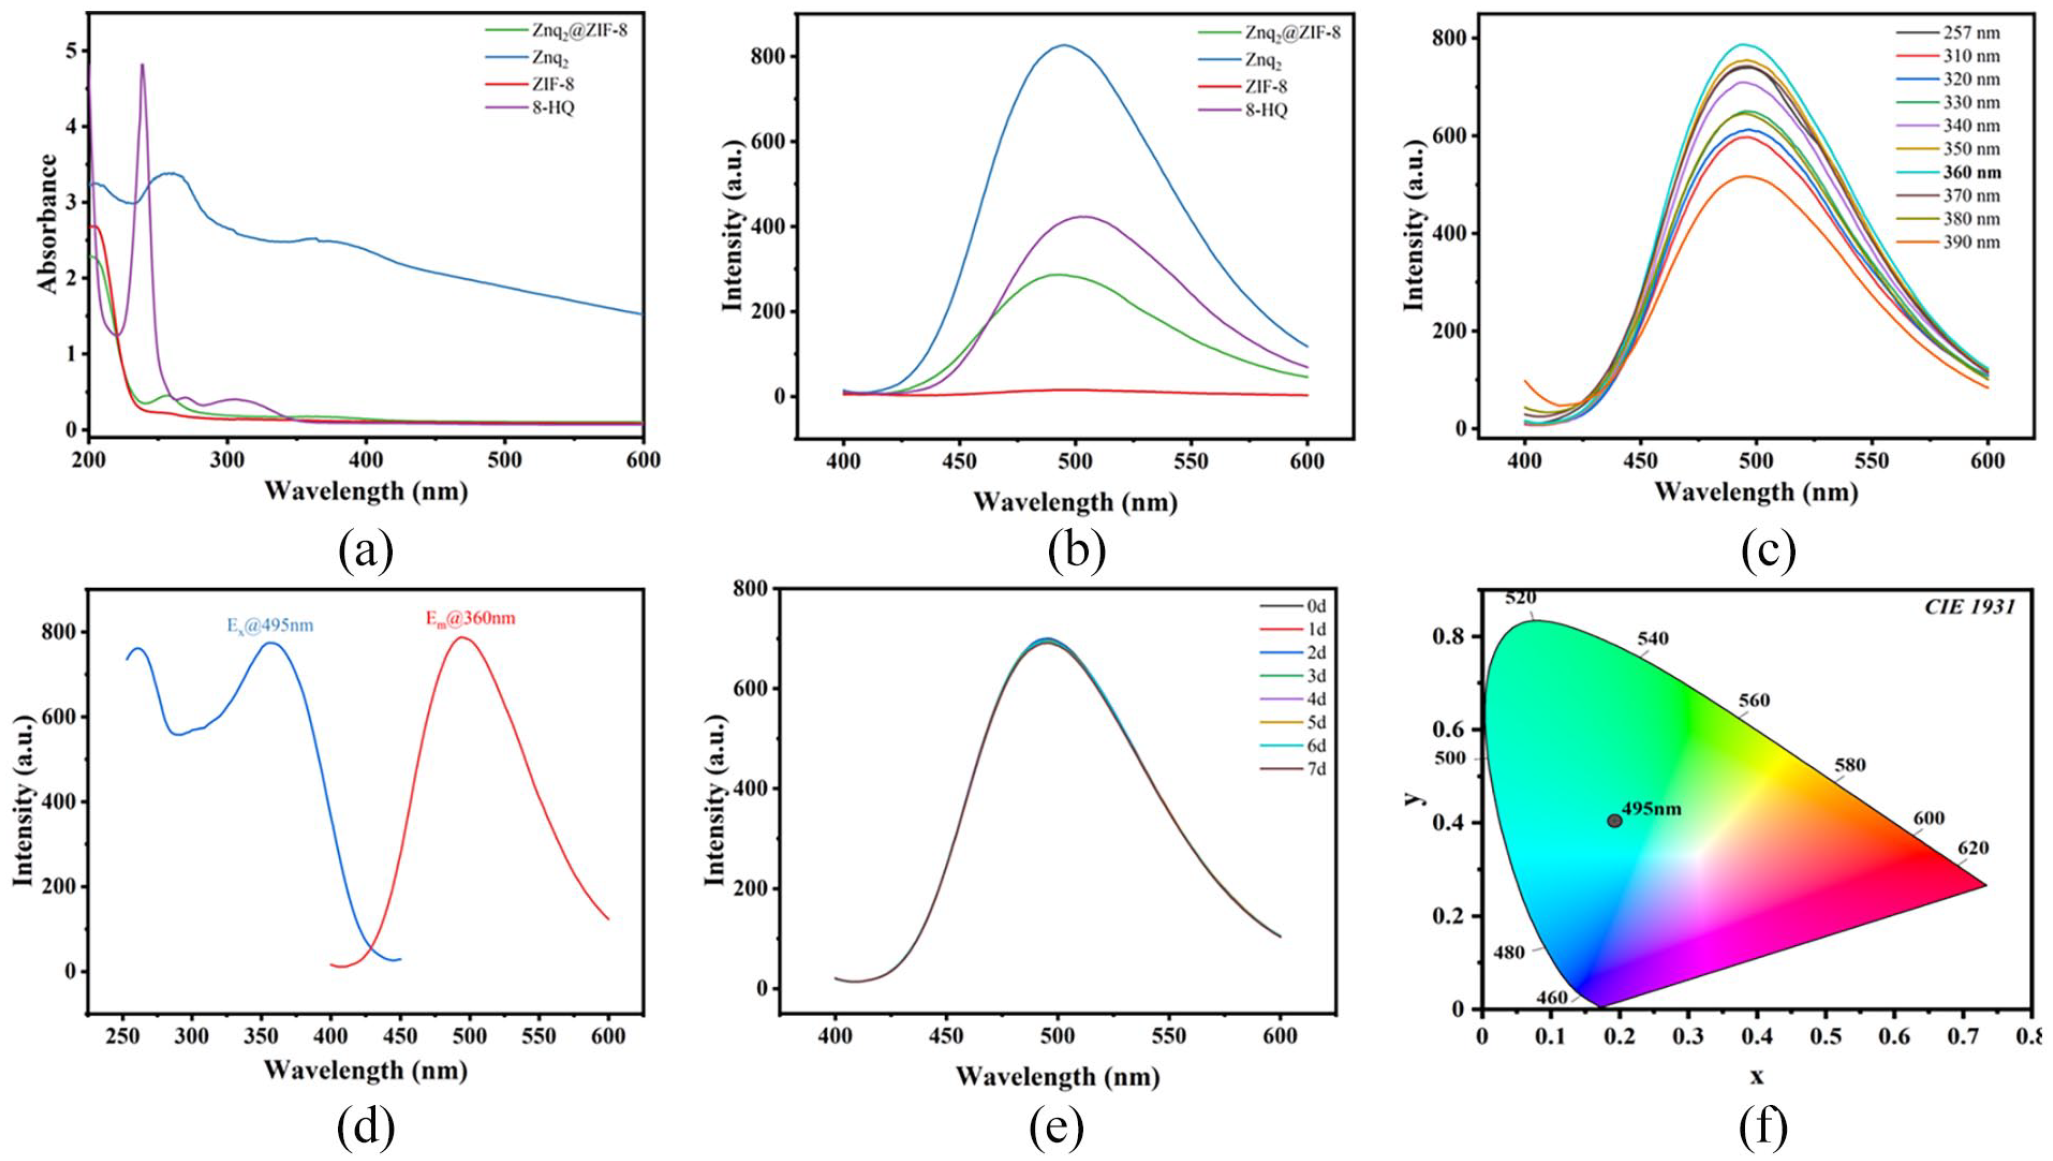
UV-Vis spectra (a) and fluorescence emission spectra (b) of ZIF-8, 8-HQ, Znq2, and Znq2@ZIF-8. Excitation wavelength optimization (c), fluorescence spectra (d), fluorescence stability over 0–7 d (e), and CIE chromaticity diagram of Znq2@ZIF-8 (f).
Optimization of detection conditions
An alkaline pH may cause serious interference in Fe3+ detection, and thus, only the change in the fluorescence intensity of Znq2@ZIF-8 under acidic conditions was tested. As shown in Figure 5(a), the acidic environment causes a slight decrease in the fluorescence intensity of Znq2@ZIF-8. The fluorescence of Znq2@ZIF-8 was quenched to a certain extent after the addition of Fe3+, and the maximum quenching degree occurred at pH = 6, so this was used as the optimal detection condition. The fluorescence intensity of Znq2@ZIF-8 was tested in several common solvents, as shown in Figure 5(b), with the strongest fluorescence intensity occurring in water and a certain degree of blueshift of fluorescence emission occurring in solvents with lower polarity. The reason may be that in the environment of organic solvents with lower polarity, the dipole moment of the material in the ground state is larger than that in the excited state, and the phenomenon of blueshift emission occurs. 20 For optimal emission conditions, the reduction of secondary pollution, and economic considerations, it is more appropriate to use water as the dispersing solvent for the material. Under irradiation with a 365-nm UV lamp, Znq2@ZIF-8 emits bright green light corresponding to the CIE chromaticity diagram (Figure 5(c)). The fluorescence of Znq2@ZIF-8 was significantly quenched by the addition of Fe3+ and was basically unchanged after 1 min of addition, indicating a rapid response.

(a) Changes at different pH values. (b) Changes in different solvents. (c) Changes over time.
Fluorescence detection of Fe3+
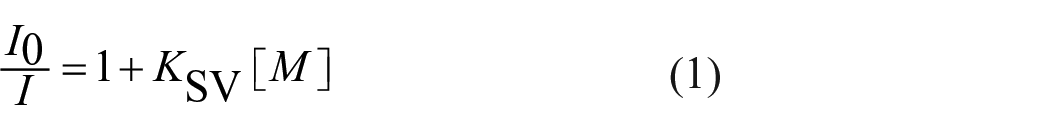
Figure 6(a) shows that the fluorescence intensity of Znq2@ZIF-8 clearly decreased with increasing added Fe3+ concentration under the optimal detection conditions. The data were fitted to the Stern–Volmer equation according to equation (1), the linear fitted equation (Figure 6(b)) was y = 0.00143x + 1.0327, R2 = 0.991, which showed a good linear relationship in the range of Fe3+ concentrations from 0 to 600 μmol L−1. The lowest limit of detection (LOD) was calculated to be 3.89 μmol L−1 according to the LOD formula in equation (2). The results of fluorescence titration showed that the prepared Znq2@ZIF-8 had excellent fluorescence detection performance for Fe3+ with a high correlation and low detection limit over a wide linear range.

(a) Fluorescence emission spectra of Znq2@ZIF-8 with different concentrations of Fe3+. (b) Linear fitting of the Stern–Volmer equation. (c) The degree of fluorescence quenching of Znq2@ZIF-8 by different metal ions. (d) The degree of fluorescence quenching of Znq2@ZIF-8 by Fe3+ in the presence of different metal ions.
Excellent detection selectivity and anti-interference ability are prerequisites for the practical application of fluorescence probes, so a series of metal cation solutions that may cause detection interference were formulated to analyze the selectivity and anti-interference performance of Znq2@ZIF-8 for Fe3+ detection. As shown in Figure 6(c), Fe3+ still showed an obvious fluorescence quenching effect at concentrations of various metal ions five times that of Fe3+. Although the presence of some interfering ions, such as Cu2+ and Ba2+, also had a certain quenching effect on Znq2@ZIF-8, the effect was small compared to that of Fe3+. In addition, the anti-interference ability was explored (Figure 6(d)), and the interfering ions had no significant effect on the fluorescence quenching effect of Fe3+. The above results indicated that Znq2@ZIF-8 had strong selectivity and anti-interference ability for the detection of Fe3+. As shown in Table 2, compared with some existing fluorescent probes, this method has better detection performance.
Comparison of Znq2@ZIF-8 with other fluorescent probes.

Study on the mechanism of fluorescence detection
The fluorescence quenching mechanism of Znq2@ZIF-8 for Fe3+ was analyzed by XRD, FTIR, UV-Vis, and X-ray photoelectron spectroscopy (XPS). As shown in Figure 7(a), the structure of Znq2@ZIF-8 after the detection of Fe3+ can be seen by XRD, which does not have the characteristic diffraction peaks of the two monomer materials, and the crystal structure collapses. According to the FTIR spectrum shown in Figure 7(b), the strength of the Zn–N bond in the material at 420 cm−1 decreased, and competitive coordination of Fe3+ may have occurred. In addition, the planar bending vibrational bands at 1147, 997, and 760 cm−1, all attributed to the imidazole ring, exhibited different degrees of weakening of the absorption intensity as well as displacement of the peaks, suggesting that effectively adsorbed Fe3+ and interacted with the above-mentioned groups. 25 As shown in Figure 7(c), one of the UV absorption peaks of Fe3+ is at 295 nm, which is close to the fluorescence excitation peak of Znq2@ZIF-8, resulting in a partial energy competition absorption leading to quenching. To further illustrate the quenching mechanism of Fe3+ on Znq2@ZIF-8, the XPS fine spectra of N 1s and Zn 2p before and after the detection of Fe3+ were comparatively analyzed. As shown in Figure 7(d) and (e), both N 1s and Zn 2p decreased in intensity after Fe3+was detected, indicating that Fe3+ strongly interacted with the Zn–N bond and that competitive coordination occurred, which corresponds to the FTIR. 26 The above results suggest that the fluorescence detection mechanism of Znq2@ZIF-8 for Fe3+ should be the collapse of the structure due to competitive coordination, simultaneous, a certain degree of competitive absorption of excitation light energy, which has been extensively reported for metal ion-detecting fluorescent probes.27,28
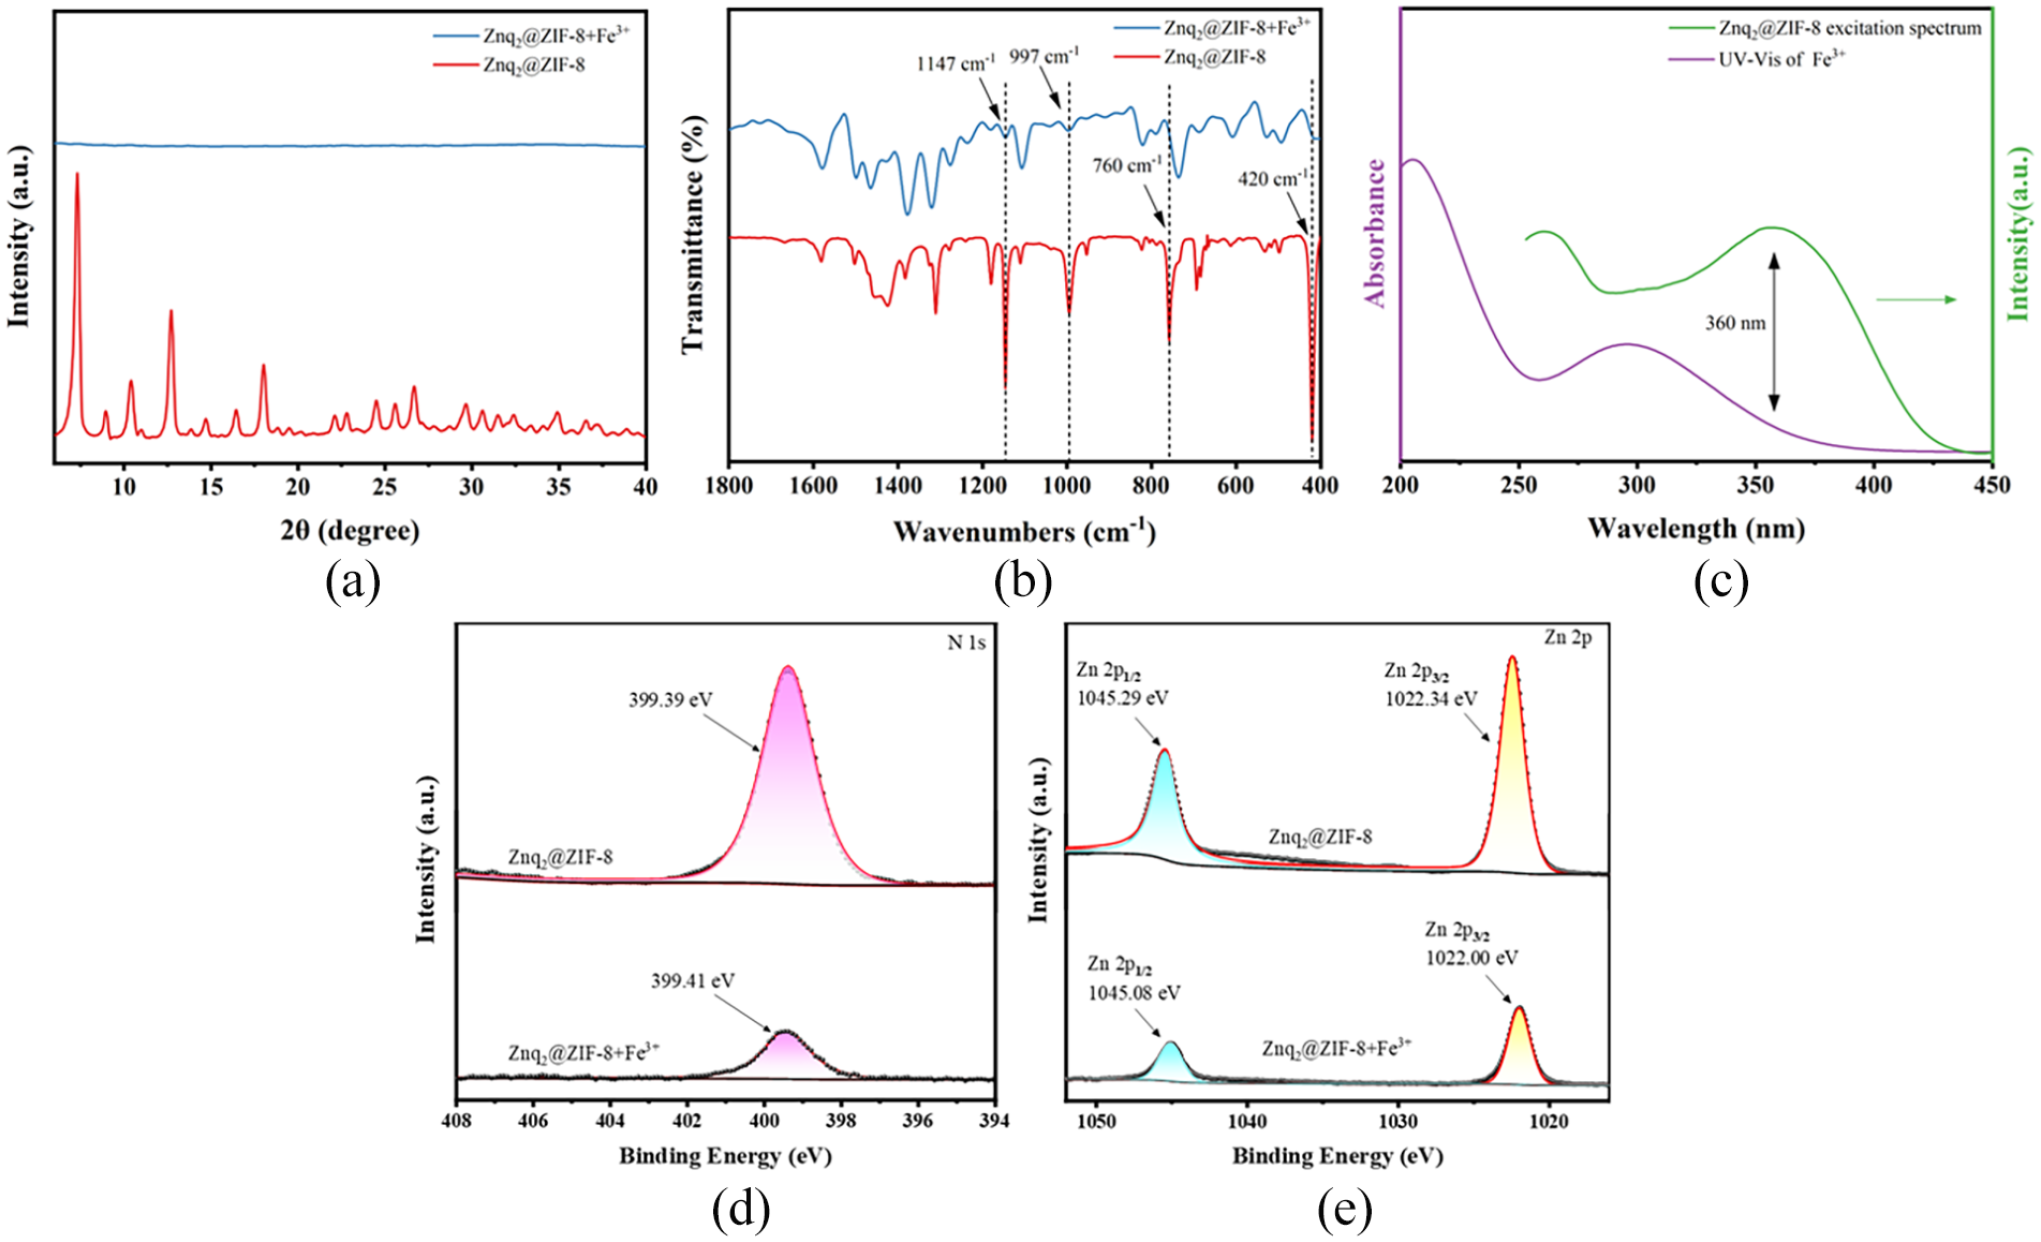
XRD (a) and FTIR (b) of Znq2@ZIF-8 before and after the detection of Fe3+. (c) UV-Vis spectra of Fe3+ and excitation spectra of Znq2@ZIF-8. XPS Fine Spectrum Fitting: N 1s (d) and Zn 2p (e) of Znq2@ZIF-8 before and after the detection of Fe3+.
Detection of Fe3+ in practical samples
The spiked recovery method was used to evaluate the feasibility of the present assay in practical applications. The results are shown in Table 3. The method exhibited good recovery and stability, with recoveries ranging from 92.24% to 103.62% and relative standard deviations (RSDs) ⩽8.13% for spiked amounts of Fe3+ ranging from 0 to 100 μmol L−1. The above results indicate that the present assay has potential for practical application.
Detection of Fe3+ in tap water samples.

Conclusion
In this work, Znq2@ZIF-8 with an octahedral core–shell structure was synthesized by growing ZIF-8 on the surface of Znq2. Guest molecularly luminescent LMOFs were formed based on the excellent fluorescence emission ability of Znq2, and Znq2@ZIF-8 has a tunable luminescent compared with that of ZIF-8 alone. In addition, the prepared composite material of Znq2@ZIF-8 has a significantly larger specific surface area and richer pore structure relative to Znq2 alone, in the study of fluorescent probes, the above characteristics are believed to be helpful to enhance the adsorption capacity of the target, which can improve the response speed and reduce the response concentration. Through a series of tests, it was verified that Znq2@ZIF-8 has good selective recognition and strong anti-interference ability for Fe3+ in aqueous environments, as well as a low detection limit and wide linear range. In view of the fluorescence detection effect of Znq2@ZIF-8, a fluorescence analytical method with simple process, fast response and high detection sensitivity can be established for the detection of low concentrations of Fe3+ in water.
Experimental section
Reagents and instruments
8-HQ and 2-methylimidazole were AR grade, and were purchased from Aladdin Biochemical Technology Co. Acetone, methanol, ethanol, ethyl acetate, n-hexane, and ethylene glycol, and various inorganic salts were AR grade and were purchased from Sinopharm Chemical Reagent Co.
Model SU8010 SEM (Hitachi); EDS (Bruker); TENSOR 27 FTIR (Bruker); XRD-6100 XRD (Shimadzu); ASAP 2460 surface area and porosity analyzer (BET, Micromeritics); UV-2550 spectrophotometer (UV-Vis, Shimadzu); Fluorescence spectrometer (FL, Agilent); X-ray photoelectron spectrometer (XPS, Thermo Fisher Scientific).
Synthesis of Znq2
8-HQ and zinc acetate dihydrate (1 mmol each) were dissolved in 20 mL of ethylene glycol, respectively, stirred at room temperature for 10 min, and allowed to dissolve completely. The zinc acetate solution was mixed with 8-HQ at an injection rate of 240 mL h−1 under room temperature stirring. The mixed solution was then transferred to a polytetrafluoroethylene-lined reactor and reacted at 180 °C for 24 h. After that, the solution was alternately washed by centrifugation with water and ethanol three times to remove unreacted raw materials and then finally dried in an oven at 60 °C for 24 h. 16
Synthesis of ZIF-8
Zinc nitrate hexahydrate (0.5 mmol) and 2-methylimidazole (5 mmol) were weighed at a molar ratio of 1:10, dissolved in 20 mL of methanol, continuously stirred at 50 °C for 120 min and then washed with methanol three times before being dried in an oven at 60 °C for 24 h. 29
Preparation of Znq2@ZIF-8
50 mg of the prepared Znq2 were dispersed in 20 mL of methanol and sonicated for 30 min to make the dispersion uniform. Then, 0.5 mmol of zinc nitrate hexahydrate and 5 mmol of 2-methylimidazole were dissolved in the above dispersion, washed with methanol three times after continuous stirring at 50 °C for 120 min, and then dried in an oven at 60 °C for 24 h.
Fluorescence detection methods
The conditions were optimized by UV-Vis and fluorescence spectrometry for optimal excitation and emission light, fluorescence source, fluorescence stability, optimal solvent use conditions, optimal pH for detection, and detection response time for Fe3+ of the probe. The above tests were repeated three times using ultrapure water as the solvent, and the excitation and emission slits were 5 nm.
Different concentrations of Fe3+ (0–1000 μmol L−1) were prepared, and the same concentration of Znq2@ZIF-8 (0.25 g L−1) was prepared. The substance to be detected (Fe3+) was mixed with the probe solution (Znq2@ZIF-8) and then sonicated for 10 min. After the reaction was complete, the fluorescence intensity of the mixture was measured using an FL under the previously optimized conditions (λex = 360 nm, λem = 495 nm). The linear range of detection was calculated using the Stern–Volmer equation (1), and later, the lowest LOD of the probe for Fe3+ was calculated by the LOD equation (2).
The Stern–Volmer equation:
LOD calculation equation:

where I0 is the fluorescence intensity of the probe before Fe3+ addition, and I is the fluorescence intensity of the probe after Fe3+ addition. M denotes the concentration of Fe3+ (μmol L−1). Ksv is the constant of the Stern–Volmer equation, LOD is the lowest LOD, K is the slope of the linear fit by equation (1), and SD is the standard deviation of the 10 blank tests.
The selectivity of the probe for detecting Fe3+ was analyzed by preparing a solution of interfering ions at five times the concentration of the Fe3+ solution, sonicating for 10 min after the addition of the interfering ions, and testing the degree of fluorescence quenching for the probe solution. In addition, a solution of interfering ions at five times the concentration relative to Fe3+ was added during the detection of Fe3+, and the degree of fluorescence quenching of the probe in the mixed system was measured to test the immunity to interference for Fe3+ detection. The degree of fluorescence quenching was expressed as I/I0, with I/I0 = 1 indicating the constant fluorescence intensity, I/I0>1 indicating the fluorescence enhancement, and I/I0<1 indicating the fluorescence quenching.
According to the established fluorescence analysis method, tap water samples were taken and spiked with different amounts of Fe3+ for the recovery test, and the recovery was calculated.
Footnotes
Acknowledgements
LY thanks Dr Mellissa from Syracuse University for English, grammar, punctuation, and spelling corrections.
Declaration of conflicting interests
The author(s) declared no potential conflicts of interest with respect to the research, authorship, and/or publication of this article.
Funding
The author(s) disclosed receipt of the following financial support for the research, authorship, and/or publication of this article: This work was supported by the fund of NSFP of Fujian Province (nos 2022J011160, 2022J01132911, 2022J01132905, 2020J05210, and 2021J011105), the Scientific Research Program of Putian University (no. yjs202212), the Putian Science and Technology Plan Project (2023GZ2001PTXY21), the Research Project on Teaching and Learning in Undergraduate Colleges and Universities, the Fujian Provincial Department of Education (no. FBJY20230211), and the Fujian University Students’ Innovation Project (no. S202311498004).