The study of molecular derivatives of biological dyes is of great importance for the green transformation of the printing, dyeing, and textile industries. In this study, B3LYP density functional methods are used to optimize the geometric configuration of the selected molecules and to explore the relationship between the structure and color of biological dye molecules and their color mechanism. This study focuses on the analysis of polyenes, quinones, indoles, and azide biological dyes in colors commonly used in the textile industry: blue, yellow, purple, red, green, and so on. Quantum chemical investigations show that the conjugate structure of a biological dye is directly related to its color and that the group or structure affecting the conjugate structure will in many cases cause a change in color. In addition, time-dependent density functional theory spectral calculations with the CAM-B3LYP functional for UV-Vis spectra show that in the visible band, the color of the remaining band after subtracting the absorption wavelengths was exactly the same as the color of the pigment. These results indicate that the color of the pigment is exactly complementary to the light absorption color of the material. Our study provides theoretical guidance for the design of molecular derivatives of biological dyes and is expected to promote the green transformation of the textile, printing, and dyeing industries to a certain extent.
Over the last century, the textile and dyeing industries have grown from strength to strength thanks to the development of organic synthetic chemical technology. With the further development of the industry and the promotion of the concept of environmental protection in society, the potential environmental problems in the production of some of the traditional chemical dyes in the printing and dyeing industries, and the impact of their production and use process on the health of producers and consumers are gradually coming under scrutiny.1–5 According to a recent market survey, approximately two-thirds of the dyes in the textile sector currently have a considerable environmental impact.1 Therefore, from an environmental point of view, the way in which microbial dyestuffs are replacing some of the traditional chemical dyestuffs in the textile and dyeing industries is of great importance in terms of green chemistry. Biological dyes are small colored molecules produced naturally by microorganisms.6–9 There are four main categories of biological dyestuffs that have been reported: polyenes,10–12 quinones,13,14 indoles,15,16 and azides.17,18 These four main groups of biological dyes cover the colors commonly used in the textile industry: blue, yellow, purple, red, green, and so on.10–18 Quantum chemistry is the branch of chemistry that uses quantum mechanics as a basis for the deductive interpretation of chemical phenomena. Heitler and London’s19 work on the structure of the hydrogen molecule in 1927 was considered to be the beginning of quantum chemistry,20 and subsequently, the basic principles of quantum chemistry became the new theoretical basis for chemists and biologists to understand the chemical structure of matter. The widespread use of quantum chemical calculations in the study of various chemical systems has enabled researchers to elucidate the mechanisms of action of complex systems at the microscopic level. The use of quantum chemical calculations to investigate the relationship between the structure and color of biological dye molecules and their color-forming mechanisms will provide theoretical guidance for the molecular design of derivatives of biological dye molecules and are expected to contribute to the green transformation of the textile and dyeing industries to a certain extent.21–25 Poormirzaei et al.23 reported density functional theory (DFT) calculations on a new red heterocyclic dye based on imidazo[1,2-a]pyridine, and calculations showed the inhibitory activity of the new dye against Gram-positive and Gram-negative bacteria. García-Prieto et al.24 investigated the substituent and solvent effects on the UV-Vis absorption spectrum of the photoactive yellow protein chromophore via the average solvent electrostatic potential/molecular dynamics (ASEP/MD) simulations.
In this study, seven different types of biological dyes (Figure 1) were selected as representative dyes to investigate the relationship between their chemical structure, electronic structure and colors of dye through quantum chemical calculations. Among the molecules shown in Figure 1, Compound 1 (guaiazulene) belongs to the polyene group of biological dyes, 2 (variegatic acid anion), 3 (emodin), and 4 (bostrycoidin) belong to the quinone group of biological dyes, Compound 5 (violacein) belongs to the indole group of biological dyes, and 6 (pyocyanin) and 7 (chlororaphine) belong to the azide group of biological dyes. The colors of these biological dyes relate to those commonly found in the textile industry: blue, yellow, purple, red, green, and so on.
The structures of biological dyes involved in our research.
Results and discussion
Geometry optimization
Polyenes
Compound 1 is a chamomile blue structure. It is a blue, oil-soluble liquid derived from the essential oils of mother chrysanthemum and yarrow, a natural anti-inflammatory ingredient commonly used in anti-allergy cosmetics, which has an anti-inflammatory effect on wounds. However, it is slow acting and may not be effective in time if the skin is already damaged. It also has a soothing effect on sensitive or irritated skin. Structurally, in this molecule, the seven-membered ring and the five-membered ring are in a conjugated state, and the carbon–carbon bond length is 1.39 to 1.41 Å, which is between that of a carbon–carbon single bond of 1.54 Å and that of a carbon–carbon double bond of 1.34 Å, which is typical for a conjugated chemical bond. In addition, Figure 2 shows that the dihedral angles of C1–C2–C3–C4, C2–C3–C4–C5, and C6–C1–C2–C3 are −180.0°, 0.0°, and 180.0°, respectively, which also indicates that the seven-membered and five-membered rings in the molecule are in a conjugated relationship. The blue color of this molecule is also largely related to this conjugation pattern.
Optimized structure of the polyene biological dye (Compound 1).
Quinones
Compounds 2, 3, and 4 all belong to the quinone group of biological dyes. The main color-forming structure of 2 is o-benzoquinone, while the color-forming structure of compounds 3 and 4 is anthraquinone. Compound 2 is made up of three important groups linked together. One is o-benzoquinone, one is maleic anhydride, and the other is o-diphenol. In Figure 3, these three groups are not fully conjugated, although the carbon–carbon bond length is between 1.39 and 1.49 Å, between 1.54 Å for carbon–carbon single bonds and 1.34 Å for carbon–carbon double bonds. The dihedral angle C1–C2–C3–C4 is 0.0°, indicating that o-benzoquinone and maleic anhydride are conjugated to each other. The dihedral angle C5–C6–C7–C8 is 31.7°, indicating that o-diphenol is not in the same plane as o-benzoquinone and maleic anhydride, i.e. o-diphenol is not conjugated to o-benzoquinone and maleic anhydride. This also suggests that the blue–purple color behind the molecule is either associated with the conjugated structure of o-benzoquinone and maleic anhydride or with the structure of o-diphenol.
Geometrically optimized structures of quinone biodyes 2, 3, and 4.
The color development of compounds 3 and 4 is related to anthraquinone, with 3 appearing yellow and 4 red, the difference in color being mainly related to the influence of the substituent groups on anthraquinone. In compound 3, the substituents on anthraquinone are mainly small groups such as methyl and hydroxy groups, which have little effect on the original conjugate structure of anthraquinone, as in the structure of 3 in Figure 3, with dihedral angles C1–C2–C3–C4, C2–C3–C4–C5, C4–C5–C6–C7 and C5–C6–C7–C8 of 180.0°, −179.7°, −179.8° and −178.5°. The whole anthraquinone is a planar structure with good aromaticity. In compound 4, the substituent on the anthraquinone is an isopentyldiol group, which has a high spatial site resistance, resulting in destruction of the planar conjugation of the whole anthraquinone, making it less aromatic but still retaining a certain degree of aromaticity. The structure of 4 in Figure 3 shows the dihedral angles for C1–C2–C3–C4, C2–C3–C4–C5, C3–C4–C5–C6, C4–C5–C6–C7, and C5–C6–C7–O1 are −174.2°, −168.4°, −170.5°, −179.2°, and −179.4°, respectively. Based on the similarities and differences between the structures of 3 and 4, we can conclude that the conjugate structure of a biological dye is directly related to the color it displays and that the group or structure affecting the conjugate structure causes a change in color.
Indoles
The optimized structure of indole-like biological dye molecule 5 is shown in Figure 4. Compound 5 is first purple in color. It is mainly composed of three groups, the left indole structure, the middle pyrrole structure, and the right pyrrole structure, each of which is conjugated and is more aromatic. The left indole structure, the middle pyrrole structure and the right idole structure are less aromatic than each other. The carbon–carbon bond length of the left indole structure is 1.38–1.43 Å, and the dihedral angle C1–C2–C3–C4 is 179.7°, which is a planar structure. The middle pyrrole structure has carbon–carbon bond lengths of 1.40–1.44 Å, carbon-nitrogen bond lengths of 1.35–1.40 Å, and a dihedral angle of −0.7° for C6–N1–C7–C8, which is almost planar. The indole structure on the right has a carbon–carbon bond length of 1.38–1.44 Å and a dihedral angle C9–C10–C11–C12 of 178.6°, which is planar. For the interaction between the indole and pyrrole groups, the dihedral angle C4–C5–C6–N1 is −14.8°, indicating that the left indole group is not in the same plane as the middle pyrrole, and the dihedral angle C7–C8–C9–C10 is 21.3°, indicating that this pyrrole is not in the same plane as the right indole group and its aromaticity is thus influenced. This may be due to the spatial site resistance of the group. The length of the C5–C6 bond between the left indole group and the pyrrole is 1.441 Å. The bond length of the C8–C9 bond between the pyrrole and the right indole group is 1.414 Å. The bond length is between that of a carbon–carbon single bond of 1.54 Å and that of a carbon–carbon double bond of 1.34 Å, indicating that there is still some aromaticity between the indole and pyrrole groups.
Optimized geometry of the indole-like biological dye 5.
Azides
Figure 5 depicts the optimized geometries of azide-based biological dyes 6 and 7. Compound 6 is blue, and 7 is green. Similar to 3 and 4, the difference in the color of the molecules is mainly due to the effect of their substituents on the aromaticity of the main structure, phenazine. In compound 6, the methyl substituent is on the N atom, and the carbon–carbon bond length is 1.37–1.47 Å, between 1.54 and 1.34 Å for the carbon–carbon single bond, 1.37–1.41 Å for the carbon-nitrogen bond, and between 1.46 and 1.28 Å for the carbon–carbon double bond. This indicates the presence of strong aromaticity in 6 phenazine. In addition, the dihedral angles C1–C2–C3–N1, C3–N1–C4–C5, and N1–C4–C5–C6 are −172.3°, 177.2°, and −178.9°. The structure of phenazine 6 is essentially planar with strong aromaticity, and the intermediate position may deviate slightly from the planar structure by the influence of the methyl substituent.
Optimized geometries of azide-based biological dyes 6 and 7.
Compound 7 is one of the few biological dyes that shows a green color. Its green color is mainly influenced by the presence of the amide group on the phenazine conjugate system. In 7, the carbon–carbon bond length is 1.38–1.41 Å, between 1.54 Å for carbon–carbon single bonds and 1.34 Å for carbon–carbon double bonds, and the carbon-nitrogen bond length is 1.39–1.41 Å, between 1.46 Å for carbon–carbon single bonds and 1.28 Å for carbon–carbon double bonds. This indicates that phenazine 7 also has some aromaticity. In addition, the dihedral angles C1–C2–C3–N1, C3–N1–C4–C5, and N1–C4–C5–C6 are 177.2°, −159.9°, and −178.9°. The middle position on phenazine 7 is influenced by the amide substituent, causing its N atom to deviate to a greater extent from the phenazine plane, resulting in a difference in color between 7 and 6.
Dye colors and absorption spectra
The color of the dye is related to the absorption of the molecule in the visible region. Visible light wavelengths are roughly between 380 and 720 nm. The wavelengths of each light color are roughly as follows: red light has the longest wavelength of 720–620 nm, orange light has a wavelength of 590–620 nm, yellow light has a wavelength of 570–590 nm, yellow–green light has a wavelength of 550–570 nm, green light has a wavelength of 500–550 nm, sky blue light has a wavelength of 490–500 nm, blue light has a wavelength of 420–490 nm, and violet light has the shortest wavelength of 380–420 nm. The colors presented by the biological dyes are exactly the opposite of the absorption of light by the substance. If the substance absorbs light at all wavelengths, it is black, if it does not absorb light at all wavelengths, it is white or colorless. If a substance is of a particular color, it absorbs light in all wavelengths except the color it is in, and sometimes the final color of the substance is a superposition of several colors. Based on the principle of color development of the substance, we analyze the colors of these substances by means of the UV-Vis spectrum calculated by time-dependent density functional theory (TDDFT).
Polyenes
The visible absorption spectrum of polyene 1 is shown in Figure 6. In addition, the molecule also absorbs strongly in the violet region at wavelengths of 380–420 nm, but less in the blue region near 431 nm and in the red region above 710 nm, so the results of this calculation are in good agreement with the experimentally observed blue color10–12 and show that the quantum chemical calculation scheme in this work is able to simulate and explain the color of bioorganic molecules better. Of course, solvation effects and interactions between multiple solvent molecules are not taken into account in quantum chemistry simulations, but this bias is negligible to a certain extent.
Visible absorption spectrum of polyene-based biological dye 1.
Quinones
The visible absorption spectra of quinones 2, 3, and 4 are shown in Figure 7. For 2, the visible absorption spectrum differs significantly from the shapes of those of 3 and 4, mainly because structurally, 2 differs from 3 and 4. Compound 2 is mainly a system consisting of o-benzoquinone-maleic anhydride-o-diphenol, and the main structures of 3 and 4 are anthraquinones. For 2, it can be seen from Figure 7 that the wavelength at the main absorption peak is 553 nm, which is relatively broad, and the main area ranges across the green to orange band. This is why the color shown by the dye is either blue or violet, the complementary color to yellow. As shown in Figure 7, although compound 2 still absorbs quite strongly in the 407–465 nm band, the absorption curve shows that the 407–465 nm band is in the trough, so the whole molecule is blue. In addition, the absorption curve of molecule 2 shows weaker absorption in the red band at wavelengths >700 nm, with the red color overlapping with the blue color and eventually appearing blue or light purple. This conclusion is consistent with the experimentally observed blue color.13
Visible absorption spectra of quinone biodyes 2, 3, and 4.
For compounds 3 and 4, the visible absorption spectra are similar. For 3, the main absorption wavelength is 380–437 nm in the blue–violet region, with close to zero absorption in the rest of the band, so 3 exhibits a complementary blue–violet yellow color. For compound 4, its main absorption wavelength is 380–546 nm, with almost no absorption in the remaining orange–red band, so 4 exhibits a mixture of orange and red colors. Again, the color conclusions for 3 and 4 are consistent with experimental observations.14
Indoles
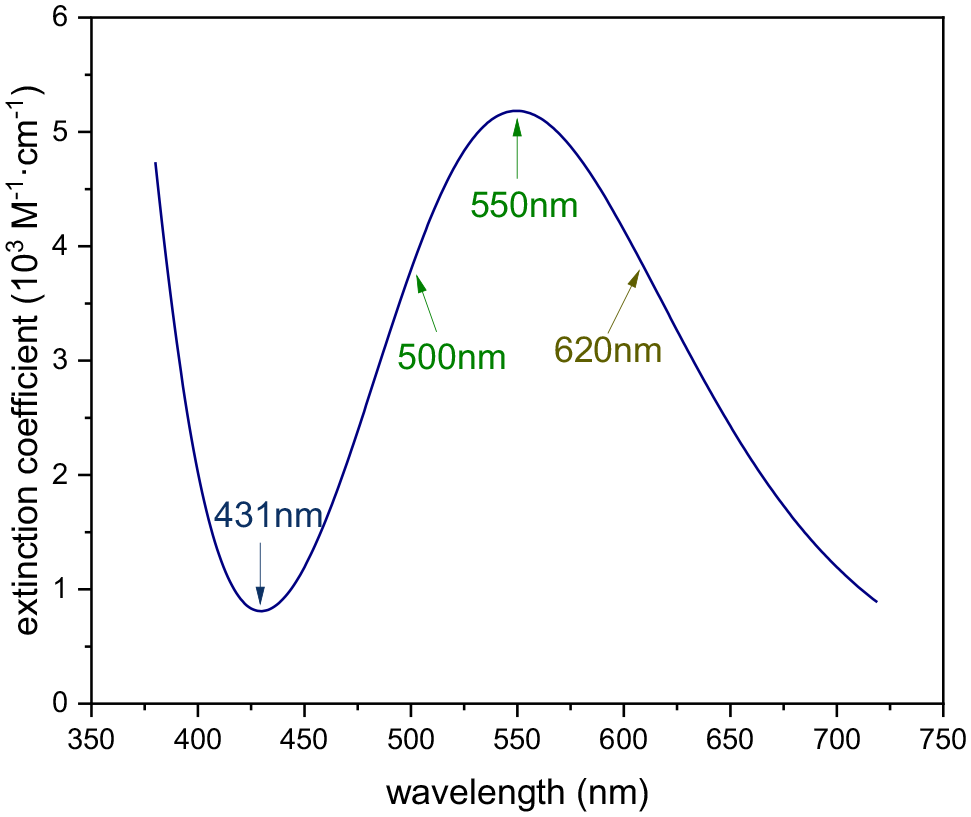
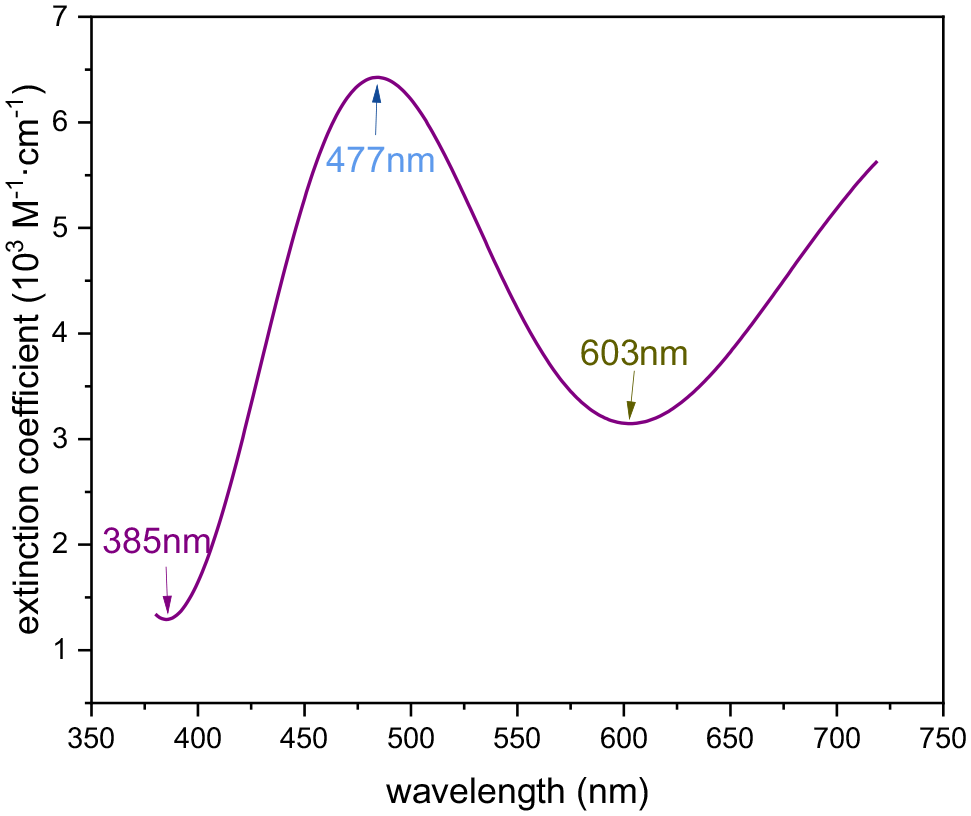
The visible absorption spectrum of the indole-like biological dye 5 is shown in Figure 8. Its main absorption peak is at approximately 477 nm in the blue light region. The color of the dye molecule is related to the troughs of the absorption peaks. In this absorption curve, there are two troughs, one at 385 nm and one at 603 nm. The wavelength of 385 nm is in the violet light region, and that at 603 nm is in the orange light region. The violet absorption at 385 nm is less than the orange absorption at 603 nm, and the biological dye 5 ends up being violet. This conclusion is also consistent with experimental observations.15,16
Visible absorption spectrum of the indole-like biological dye 5.
Azides
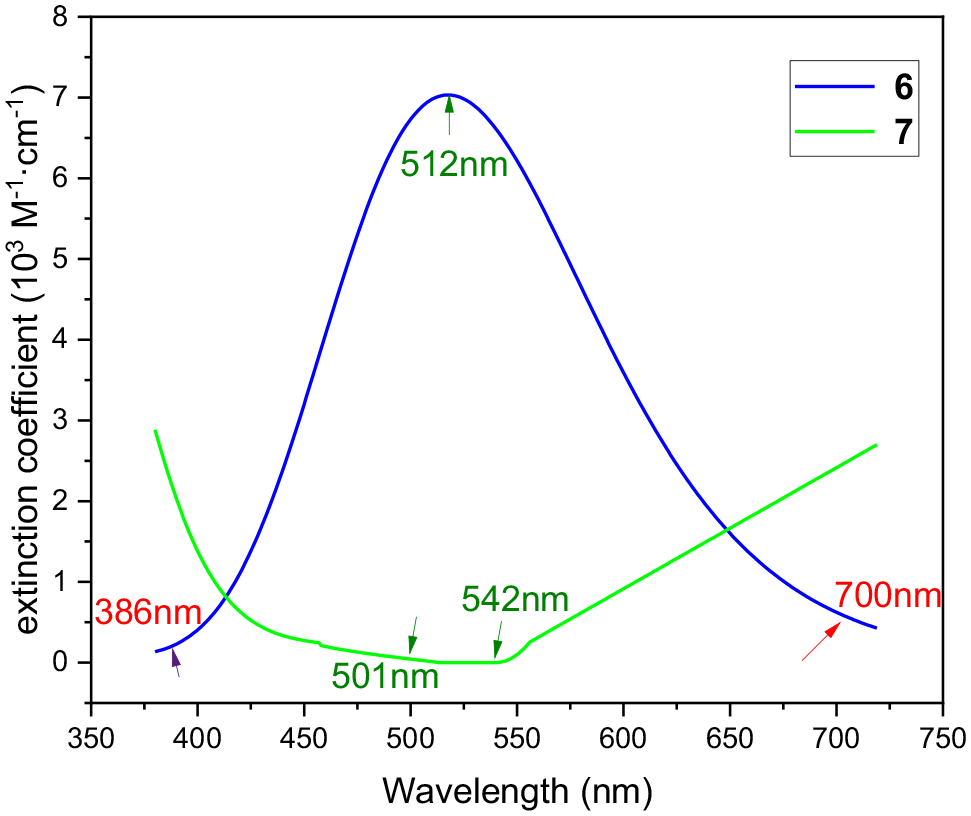
For compounds 6 and 7, although the main color-emitting structure of both molecules is phenazine, the visible absorption spectra differ greatly in shape, mainly because of the difference in the substitution sites of the substituents and the types of substituents. In compound 6, there is a strong absorption in the middle band, with an absorption peak at 512 nm, and close to zero below 386 nm and above 700 nm, so 6 mainly shows purple color. The opposite is true for color of 7, which has a large absorption intensity on both sides of the peak and a small absorption intensity in the middle. In the short wavelength blue–violet range (below 500 nm) and the long wavelength red–yellow range (above 550 nm), the absorption intensity is high, in the green wavelength range (500–550 nm), there is almost no absorption, so the molecule is green (Figure 9).17,18
Visible absorption spectra of azide-based biological dyes 6 and 7.
Conclusion
The relationship between the molecular structure and color of biopigments is discussed in this study from DFT and TDDFT calculations. Quantum chemical calculations are better able to simulate and explain the color genesis of bioorganic molecules. Of course, solvation effects and interactions between multiple solvent molecules are not taken into account in quantum chemical simulations, but the exclusions can be neglected to some extent. Our calculations show that the seven-membered and five-membered rings in compound 1 are in a conjugated relationship, which is related to the color of the dye. In addition, TDDFT spectroscopic analysis shows that the color of biological dye molecules is complementary to their light absorption.
Computational details
Configuration optimization
Gaussian 16 software26 was employed to optimize the geometric configurations of the selected molecules. The hybridization density generalization theory B3LYP/6-31++G(d,p) was used in the calculations to calculate the levels. Previous studies have shown that the B3LYP generalization gives relatively reliable quantum calculations for geometry optimization and the electronic structure relaxation of organic molecules.27–29 After optimization, we used the Gaussview program to read the molecular geometrical configuration and molecular orbitals.
Excited state calculations
The TD-CAM-B3LYP method was selected for the calculation of the energy of the excitation process at the optimized configuration, simulating the absorption spectra of individual biomolecules, using the 6-31++G(d,p) basis group for all atoms. Numerous studies have shown that this method and basis groups are reasonably accurate for the calculation of the excited state energies of biological dye molecules.30–32
Footnotes
Declaration of conflicting interests
The author(s) declared no potential conflicts of interest with respect to the research, authorship, and/or publication of this article.
Funding
The author(s) disclosed receipt of the following financial support for the research, authorship, and/or publication of this article: This work was supported by the NSFP of Fujian Province (No. 2020J05210, No. 2022J01132911, No. 2022J01132911, and No. 2022J01132905), the Fujian Young and Middle aged Teacher Research Project (JAT220303), and the Science and Technology Correspondent of Fujian Province (F2021KTP070). Additional funding was provided by Fujian Provincial Technological Innovation Key Research and Industrialisation Projects (2023G019), the Fujian CAS STS Program (2022T3027), and the Putian Science and Technology Plan Project (2023GZ2001PTXY21).
ORCID iD
Jing Huang
References
1.
NiinimäkiKPetersGDahlboH, et al. Nat Rev Earth Environ2020; 1: 189–200.
2.
BrunoLFávaro-PolonioCZPamphileJA, et al. Biotechnol Res Innov2019; 3(2): 275–290.
3.
SamsamiSMohamadizanianiMSarrafzadehMH, et al. Process Saf Environ2020; 143: 138–163.