
Abstract
Polyaniline is one of the most common electrode materials for supercapacitors. The morphology of polyaniline directly affects the properties of polyaniline. In this paper, a new method for preparing hollow polyaniline nanospheres is described. Polyaniline-S with solid and hollow structures are successfully synthesized by the hydrothermal method, through varying the amounts of the catalyst and oxidant. The prepared hollow nanospheres have uniform particle size, a smooth surface, and uniform wall thickness. The hollow structure provides rapid permeability to the material, facilitating the transfer and transport of charges and ions in the electrolyte, and it can also act as an ion storage tank to increase the accumulation of ions inside. The specific capacitance of polyaniline-S is high at 235 F g-1 at 0.5 A g-1. To reduce the aggregation of polyaniline-S and improve the electrochemical activity, polyaniline-S, and graphene oxide are composited using the interfacial electrostatic interaction. The content of graphene oxide has a significant influence on the electrochemical performance of the composites. The specific capacitance of the polyaniline-S/ graphene oxide composite with a 10% loading amount of graphene oxide reaches 535 F g-1 at 0.5 A g-1, increase of nearly 128% compared to representing a significant polyaniline-S. The specific capacitance retention rate is 93.6% after 10,000 cycles.
Keywords
Introduction
Duo to the rapid development of mobile electronic devices, the search for highly efficient energy storage materials is imperative. At present, the main storage devices include lithium-ion batteries 1 and supercapacitors (SPs). 2 SPs have attracted extensive attention because of their high power density, 3 good cycle stability 4 and environmental friendliness. 5 Electrode materials are the core component of SPs, 6 and their design has become very important. Current SP electrode materials are mainly conductive polymers (CPs), 7 carbon materials, 8 and metal oxides. 9 CPs electrode materials include polyaniline (PANI), 10 polypyrrole (PPy), 11 and polythiophene (PTh) 12 . Among them, PANI has excellent properties, including good electrical conductivity, 13 high chemical activity, and easy synthesis. 14 At present, PANI with different morphologies (such as nanotube, 15 nanofiber, 16 nanorod 17 and so on) have been used as electrode materials and exhibit different electrochemical properties. Though PANI materials can provide high pseudo-capacitance due to redox reactions, they exhibit poor cycling stability during prolonged charging-discharging. 18 Combining with other electroactive materials is an efficient approach to improve the properties of PANIs. Poudel et al. 17 successfully prepared silver-modified MnO2 nanorods (PANI/Ag@MnO2) covering PANI film by the hydrothermal method; the specific capacitance of PANI/Ag@MnO2 was 1028.66 F g-1 at 1 A g-1. Carbon nanomaterials possess a large specific surface area and exhibit excellent stability, however, their low specific capacitance limits their further application. 19 The electrode materials of electric double-layer capacitors (EDLCs) are mainly graphene, carbon nanotubes (CNTs), activated carbon, 20 and so on. Compared to other carbon materials, the unique morphology and structure of graphene can provide distinctive properties such as a larger specific surface area (2630 m g-1), 21 good mechanical properties (~1 TPa), 22 and high electron migration rates (>10,000 cm2 V-1 S-1) 23 . The preparation of PANI/graphene composites is a feasible way to utilize their advantages of them. Besides graphene, graphene oxide (GO) is also used to improve the performance of PANI. GO is a graphene sheet layer with rich oxygen-containing functional groups. 24 The functional groups on GO nanosheets may serve as anchoring sites for the growth of PANI-S and provide stronger interactions between the two components. However, GO with low composite conductivity will affect its electron conduction rate. GO has been shown to be beneficial for the surface modification of CPs owing to the presence of functional active sites on its surface. 25 In addition, the synergistic effect of GO and PANI results in a significant improvement in the electrochemical properties of the composites. 26 The double-layer capacitance of GO and the pseudocapacitance of PANI together provide excellent specific capacitance for PANI/GO composites.
Currently, the synthetic methods for preparing PANI/GO composites include in-situ polymerization,16,27 interfacial polymerization,28,29 electropolymerization,30,31 oxidative polymerization, 32 and so on. Jin et al. 16 combined PANI nanofibers (PANI-NFs) with functionalized reduced GP (FrGO) and prepared a PANI NFs/FrGO composite film by in situ polymerization. This composite film has a uniform thickness, good flexibility, and high stability. The specific capacitance of the PANI NFs/FrGO composite was 692 F g-1 at 1 A g-1. Meng et al. 33 developed a graphene film consisting of PANI nanowire arrays, and its specific capacitance was 385 F g-1 at 0.5 A g-1. Xu et al. 34 prepared GO/PANI composite flakes by in situ polymerization. The specific capacitance of this GO/PANI composite was 425 F g-1 at 0.2 A g-1. In addition, Hao et al. 35 prepared a sandwich-like PANI/BG nanohybrid by in situ polymerization and it specific capacitance was 241 F g-1 at 0.5 A g-1.
In this work, PANI-S was prepared by the hydrothermal method. The morphology of PANI-S was controlled by introducing different amounts of oxidant and catalyst. Afterwards, the PANI-S was compounded with different ratios of GO by interfacial electrostatic interactions. Finally, the effects of the loading of GO on the electrochemical properties of the composites are discussed based on a range of characterization techniques and electrochemical tests.
Experimental
Materials
Aniline was obtained by vacuum distillation. Other chemicals were purchased from Aladdin Co. (China). The improved Hummer method was used to synthesize GO. 36
Synthesis of the PANI-S/GO composites
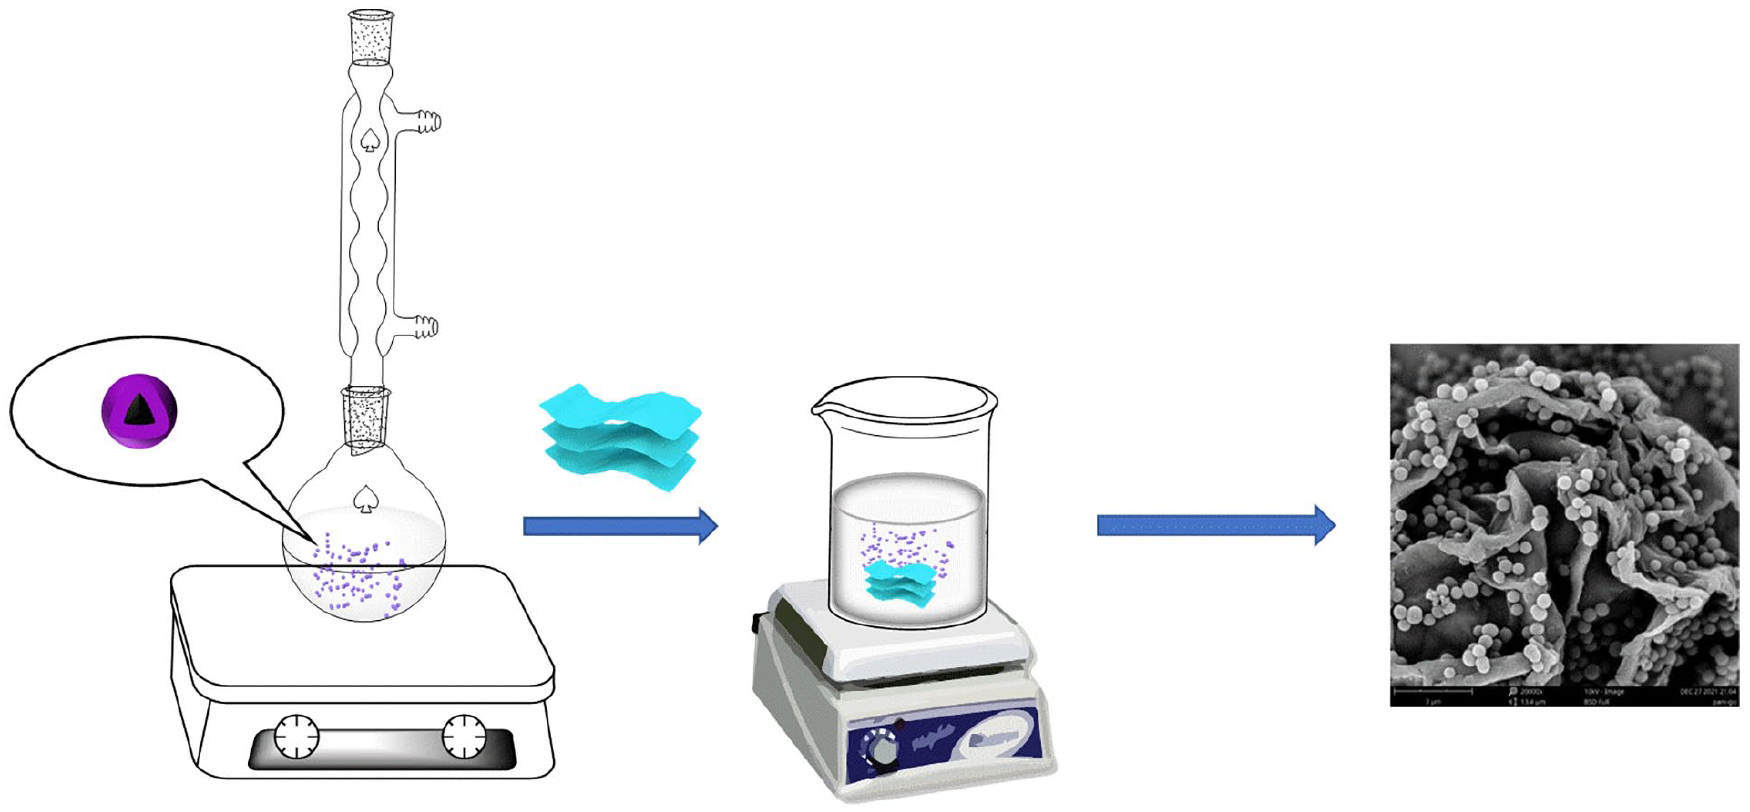
PANI-S were prepared by a reported hydrothermal method 37 by adding 0.1 mL of the aniline monomer to 40 mL of 0.4 M phosphoric acid (H3PO4). Hollow polyaniline nanospheres (PANI-S-a, PANI-S-b) and solid polyaniline nanospheres (PANI-S-c) were prepared with different ratios of 0.1 M FeCl3 (A) and H2O2 (B) (PANI-S-a, 0.04 mL of A and 0.24 mL of B; PANI-S-b, 0.08 mL of A and 0.48 mL of B; PANI-S-c, 0.02 mL of A and 0.12 mL of B). By heating in an oven at 140 °C for 6 h. Finally, the product was gained obtained washing with anhydrous ethanol (EtOH) and deionized water, and then freeze-drying overnight.
PANI-S-a was pretreated with 3-aminopropyl triethoxysilane (APTES) to enrich its surface with positive charges. Using an electrostatic adsorption method similar to that reported in the literature, 38 PANI-S-a/GO composites were prepared by compounding the treated PANI with negatively charged GO through electrostatic interactions. Thus, 0.1 g of the prepared PANI-S-a was dispersed in 100 mL of EtOH and ultrasound was performed for 1 h. Next, 1 mL of APTES was added to the EtOH solution and the mixture was refluxed in an oil bath at 60 °C with stirring for 4 h. After freeze-drying, the pretreated PANI-S-a was mixed with different amounts of GO suspensions and stirred continuously for 1 h at room temperature. The prepared PANI-S/GO composites with different GO loadings (5%, 10%, and 15% GO content) were name PANI-S-a/GO-5%, PANI-S-a/GO-10%, and PANI-S-a/GO-15%, respectively. A flow diagram for the preparation of the PANI-S-a/GO composites is shown in Figure 1.
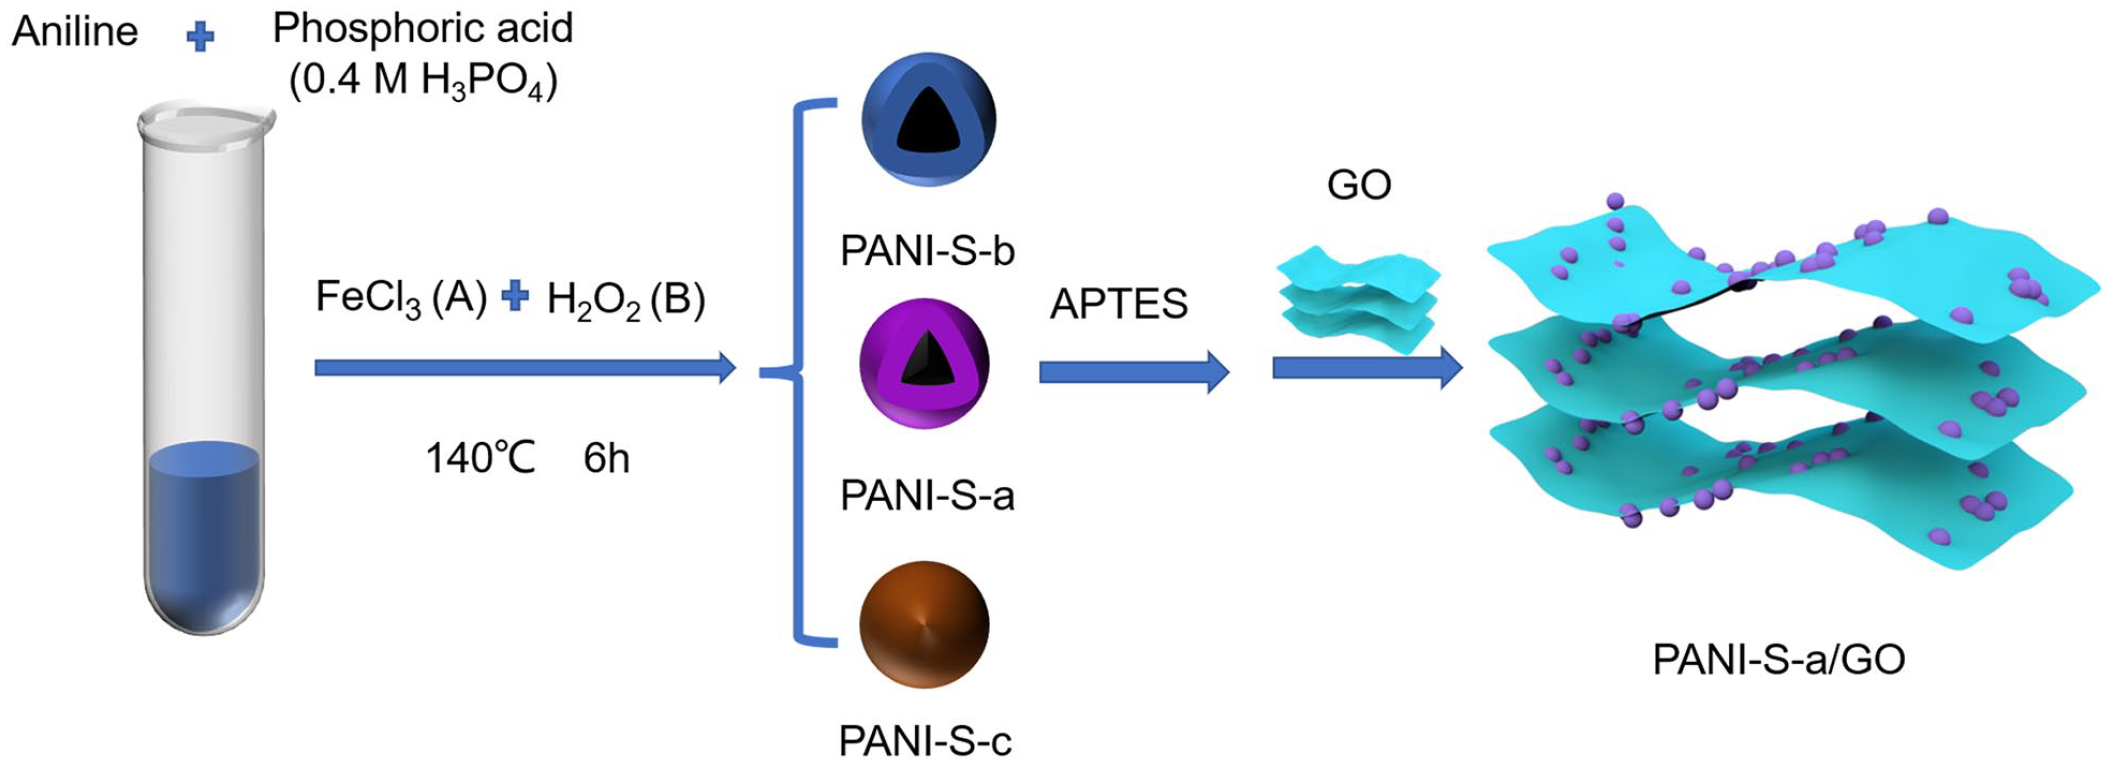
A flow diagram the preparation of the PANI-S/GO composites.
Fabrication of SP electrodes
PANI-S-a/GO composite, acetylene black, polyvinylidene (PVDF) and N,N-dimethylformamide (DMF) were mixed to make the SP electrodes. The active material, conductive carbon black and PVDF were mixed in a mass ratio of 8:1:1 and sonicated to obtain a uniform viscous slurry. The mixture was dispersed with the assistance of ultrasound and then ground to an even paste. The mixture was painted onto graphite paper (1.0 × 4.0 cm2) and dried at 60 °C. The effective area and weight of the electrode material are 1.0 × 1.0 cm2 and 0.8~1.0 mg, respectively.
Characterization
Scanning electron microscopy (SEM) (Phenom/Pro) and transmission electron microscopy (TEM) (JEM 210) were used to observe the microstructures of PANI-S and PANI-S/GO. Fourier Transform Infrared (FTIR) spectra of samples were obtained on a PerkinElmer GX spectrometer using the KBr method. Raman tests were carried out using a laser microscopic confocal Raman spectrometer (inVia Reflex). Using a three-electrode system in a CHI660 electrochemical station allowed estimate the cyclic voltammetry (CV), electrochemical impedance analysis (EIS), and galvanostatic charge-discharge tests (GCD) to be performed. The working electrode is a graphite paper with the active substance. In 1M H2SO4 solution, a Pt plate and a Ag/AgCl electrode were used as the counter electrode and the reference electrode, respectively. The cycle stability was also tested using the same device configuration. The particle size distribution of the three PANI materials was measured using Beckman Coulter laser particle size analyzer (COULTER LS230). The specific surface area and pore structure of materials were obtained by nitrogen adsorption and desorption (BET, Micromeritics, ASAP-2020 automatic adsorption instrument) at 77 K.
Results and discussion
Morphologies and structures of PANI-S
In this paper, PANI-S was prepared using a hydrothermal method. Under the employed reaction conditions, the amount of oxidant agent and catalyst can regulate the morphology of the PANI-S. H2O2 was used as the oxidant, and its decomposition rate could directly affect the shape of the PANI. In the reaction, aniline can form spherical micelles in H3PO4 solution, and most of the micelles can be assembled by accretion to form spherical soft templates. At the same time, Fe3+ can accelerate the decomposition of H2O2 to produce O2 bubbles. 37 The spherical soft template reacts with the generated O2 to form a relatively uniform PANI hollow sphere. The SEM and TEM images of the PANI-S prepared by adding different oxidizing agents and catalysts are show in Figure 2. PANI-S-a is a spherical particle with a uniform size (550 nm) and a smooth surface, and has a hollow structure with a wall of uniform thickness (100 nm) (Figure 2(d)). The internal hollow structure can provide a large capacity for storing an electrolyte. Similarly, PANI-S-b is a hollow sphere structure with a thin wall (80 nm) and a larger size (800 nm). However, some of the hollow spheres have an open structure owing to the too thin wall (Figure 2(b)). Another phenomenon is that some particles are aggregated together, which may have a negative influence on its electrochemical properties. Figure 2(c) and (f) show the solid sphere morphologies of PANI-S-c with diameters of 450 to 600 nm.

SEM images of PANI-S-a, PANI-S-b and PANI-S-c (a, b, c) and the TEM images of PANI-S-a, PANI-S-b and PANI-S-c (d, e, f).
As shown in Figure 3, PANI-S-a, PANI-S-b and PANI-S-c have the same characteristic absorptions at around 758 cm-1, 1177 cm-1, 1376 cm-1, 1497 cm-1, and 1594 cm-1. The signals at 1594 cm-1 and 1497 cm-1 correspond to the stretching vibrations of the C=C bond of the quinone and the benzene ring, respectively. 39 This indicates that the synthesized PANI has quinone and benzene structures with partial oxidation and partial reduction states. The stretching vibrations of the C-N of benzenoid rings appear at 1376 cm-1 and 1117 cm-1. 40 In addition, the peak at 758 cm-1 can be assigned to the C-H out-of-plane bending vibrations of the benzene rings. 41 The similar FTIR spectra of the three synthesized PANI-S confirm that changing the amount of catalyst and oxidant does not change the molecular structure of PANI.

FTIR spectra of PANI-S-a, PANI-S-b, PANI-S-c.
As shown in Figure 4, the particle size of PANI-S-a is mainly around 0.7 µm. The particle sizes of PANI-S-b are mainly around 2 µm and 5.5 µm. PANI-A and PANI-B materials have a large particle size, which is mainly due to the rapid addition rate during the test, resulting in material agglomeration. The particle size of PANI-S-c is mainly around 1 µm.

DLS images of PANI-S-a, PANI-S-b and PANI-S-c.
Electrochemical and capacitive properties of PANI-S
The CV curves of the three PANI-S have different areas, which represent their different electrochemical activities (Figure 5(a)). Among them, PANI-S-a possesses the largest CV area, as well as the highest electrochemical activity. This can be attributed to the hollow structure and uniform dispersion of PANI-S-a. The electrolyte ions can enter inside the PANI-S wall. Moreover, there are two pairs of redox peaks appearing in the CV curve of PANI-S-a, which are due to the transitions of leucoemeraldine/emeraldine and emeraldine/pernigraniline states of PANI. 38 The CV curves of PANI-S-a at different current scanning rates are shown in Figure 5(c). When the current scanning rate increases, the area enclosed by the CV curve increases gradually. This is related to increased charge injection and extraction volume at high current scanning rates. As shown in Figure 5(d), the linear relationship between the peak current density of the redox peak and the current scanning rate, which indicates that the redox process of PANI-S-a is controlled by diffusion. 42

CV curves of PANI-S-a, PANI-S-b and PANI-S-c comparison chart at 25 mV s-1 (a), the trend chart of CV enclosed area of different kinds of PANI (b), CV curves of PANI-S-a at different current scan rates (c), the trend chart of peak current density against current scanning rate (d), GCD curves of PANI-S-a, PANI-S-b and PANI-S-c at 0.5 A g-1 (e), GCD curves of PANI-S-a at various current densities (f).
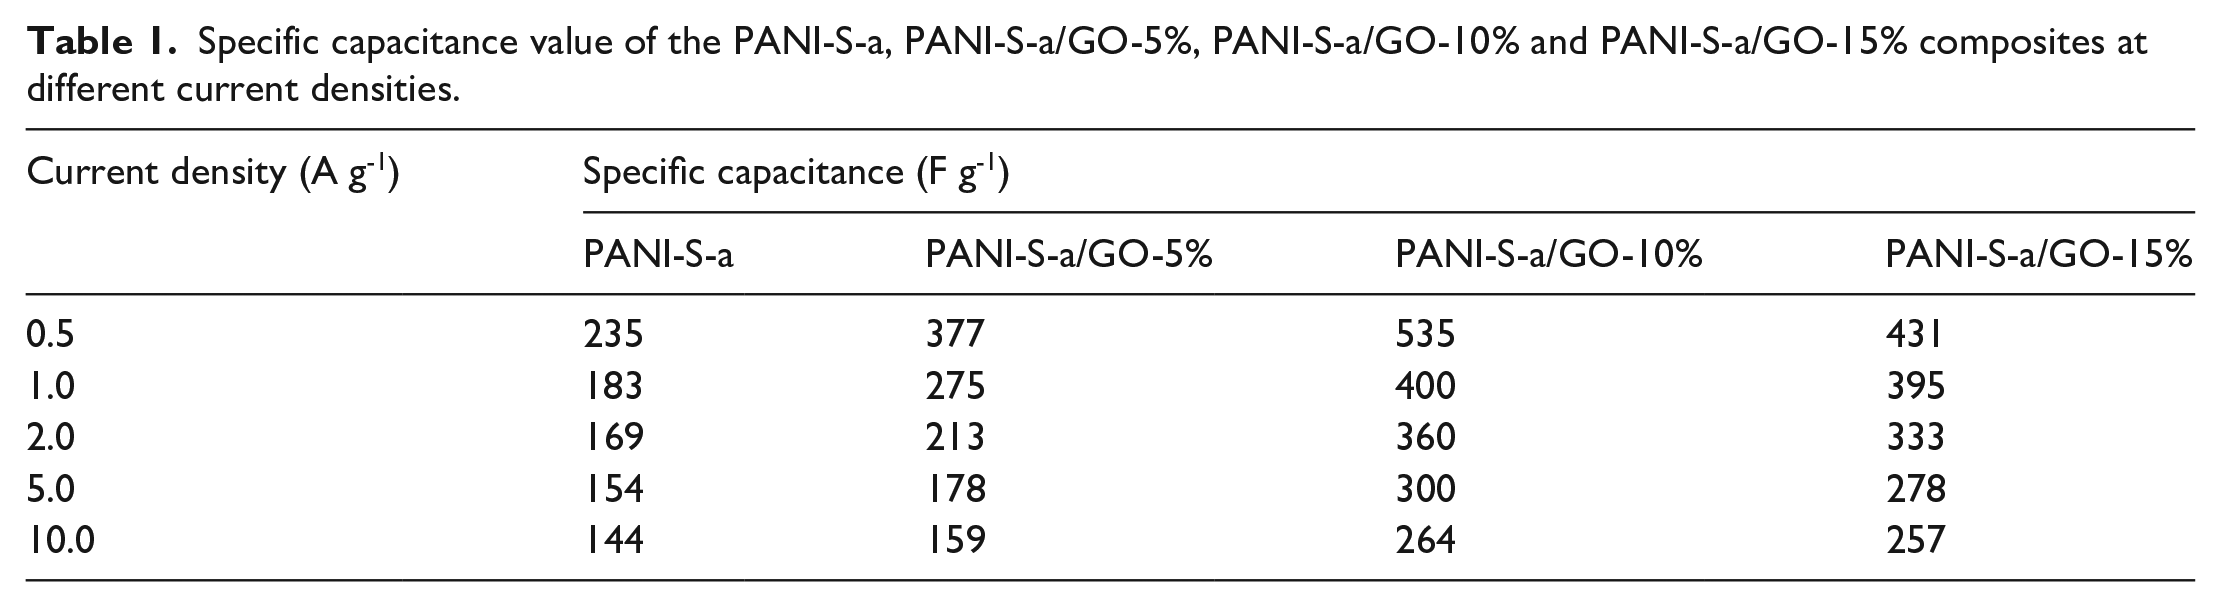
The GCD test is an important method to study the capacitive properties. Figure 5(e) shows the GCD curves of the three PANI-S materials at a current density of 0.5 A g-1. It can be observed that the GCD curve of PANI-S-a has the longest discharge time, indicating that has the highest capacitive performance. The high specific capacitance of PANI-S-a can be attributed to its small size and its dispersed and hollow structure, which supplies a large specific area and richly accessible active sites. The GCD curves of PANI-S-a at different current densities are shown in Figure 5(f). The plateau on the GCD curve is obvious due to the presence of the pseudocapacitance in the Faraday reaction. The specific capacitance of PANI-S-a can be computed using equation (1) and the values are listed in Table 1. Thus, PANI-S-a has the best specific capacitance and electrochemical activity as comparison with PANI-S-b and PANI-S-c. Therefore, PANI-S-a was used to combine with GO in the subsequent study.
Specific capacitance value of the PANI-S-a, PANI-S-a/GO-5%, PANI-S-a/GO-10% and PANI-S-a/GO-15% composites at different current densities.
Morphologies and structures of the PANI-S-a/GO nanocomposite
As shown in Figure 6, we observed that PANI-S-a is attached to the surface of GO individually without obvious aggregation, the folded structure of GO provides more attachment sites for PANI-S-a in a related smaller space. PANI-S-a nanomaterial has unique structural advantages, which can effectively prevent GO nanosheets from stacking with each other. The 3D structure constructed by PANI and GO can effectively avoid the re-stacking of nanosheets.43–46
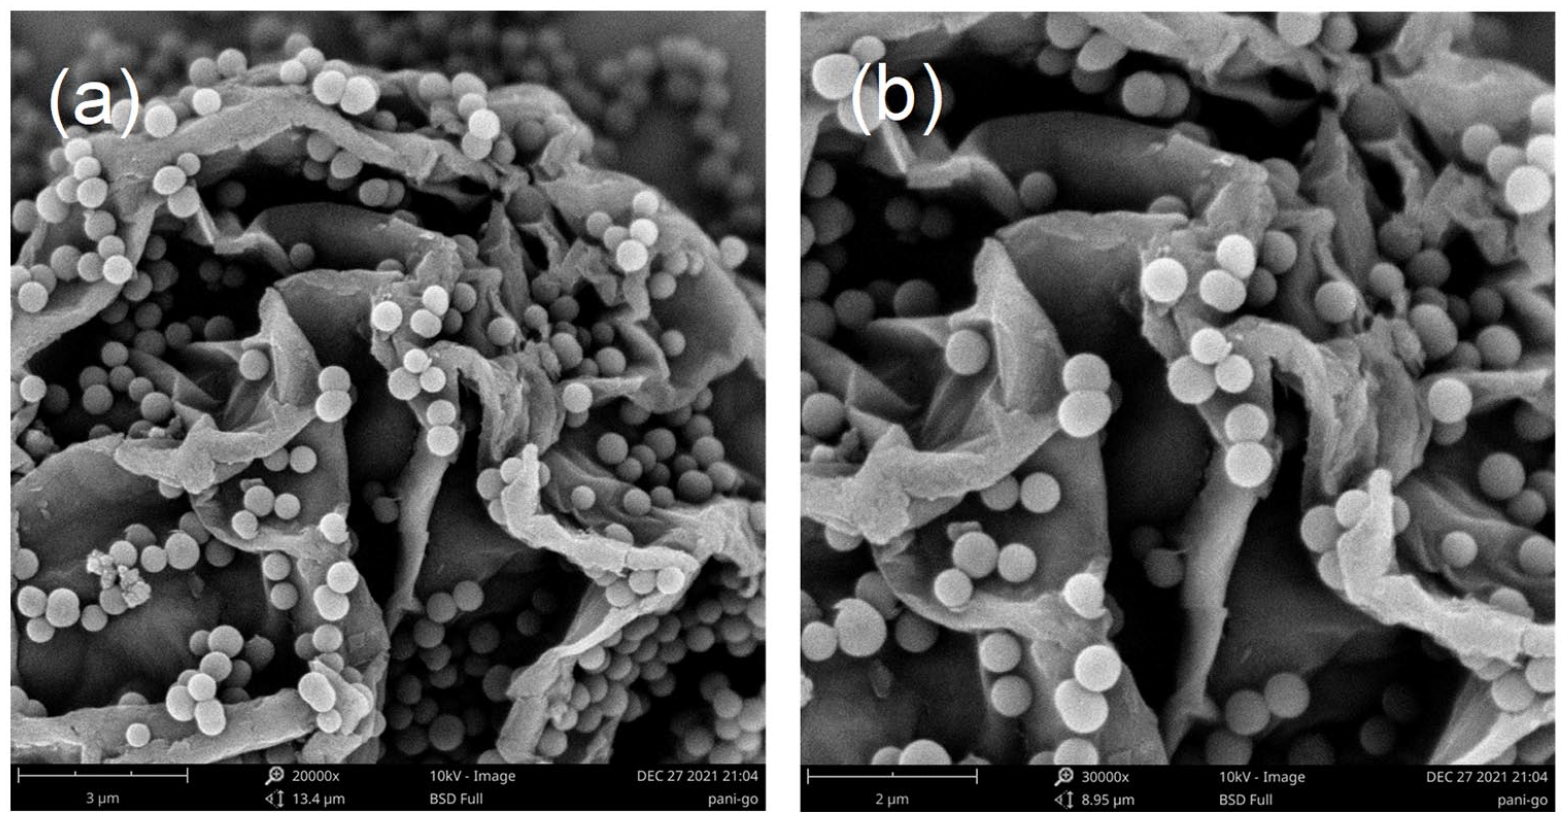
SEM images of PANI-S-a/GO-10% at 20,000 times (a) and 300, times (b).
The Raman spectra of PANI-S-a shows that the peak at 1189 cm-1 corresponds to the C-H bending vibrations of the benzenoid ring (Figure 7(a)). 47 The peaks at 1252 cm-1 and 1553 cm-1 correspond to the stretching vibration of C-N and the N-H bending vibrations of the quinoid rings, respectively. The peaks at 1345 cm-1 and 1595 cm-1 correspond to the C-N+ stretching vibration 48 and C=C stretching vibrations of the quinoid ring. 47 The characteristic peaks of PANI-S-a shows that the signal at 805 cm-1 is due to the benzene ring deformation and 609 cm-1 is associated with the ring plane deformation. The Raman spectra of PANI-S-a/GO-10% and GO show that there are two strong peaks at 1375 cm-1 and 1583 cm-1, which correspond to the D and G bands of GO, respectively. The characteristic peaks of PANI-S are relatively weak, which are overlapped by the strong D and G peaks of GO.

Raman spectra of GO, PANI-S-a and PANI-S-a/GO-10% (a), FT-IR spectra of PANI-S-a and PANI-S-a/GO-10% (b).
Figure 7(b) shows the FTIR spectra of PANI-S-a/GO-10% and PANI-S-a. The absorptions of PANI-S-a at 1610 cm-1 and 1507 cm-1 confirm the presence of benzenoid and quinoid rings, indicating the partial oxidation and partial reduction states of the conducting PANI. 49 The peak at 1083 cm-1 corresponds to the off-domain electrons in PANI. 48 While the peaks at 1380 cm-1 and 765 cm-1correspond to the C-N stretching vibrations of the benzenoid ring 49 and the C-H out-of-plane bending vibration of the benzene ring. 50 The intensity of the peak at 1083 cm-1 was enhanced with the addition of GO and slightly shifted. This displacement implies the interaction between the π-bonds of GO and the conjugated structure of PANI. 49
Figure 8 shows the adsorption and desorption curves of PANI/GO have an adsorption peak before P/Po = 1. There is a certain desorption lag, indicating that the prepared PANI/GO material has a porous structure. The BET surface area of PANI/GO material was calculated to be 20.25 m2 g-1.

The specific surface area of PANI-S-a/GO-10%.
Electrochemical and capacitive properties of PANI-S-a/GO
The CV curves of PANI-S-a compounded with different ratios of GO at 25 mV s-1 are shown in Figure 9(a). It can be observed that the CV curve of PANI-S-a/GO-10% has the largest enclosed CV area and the most obvious redox peak. Figure 9(b) shows an increasing trend followed by a decreasing trend in the area surrounded by the CV curve on increasing the GO content. This indicates that the composite ratio has a significant effect on the performance of the composite. In Figure 9(c), PANI-S-a/GO-10% exhibits similar CV curves at current scanning rates from 5 mV s-1 to 100 mV s-1. With an increase of the current scanning rate, the shape of the CV curve remains unchanged, indicating that the electrochemical properties of the material are not significantly affected within the reported current scanning rate range. As shown in Figure 9(d), the linear relationship between the peak current density of the redox peak and the current scanning rate, which indicates that the electrochemical process of PANI-S-a is influenced by diffusion control.

CV curves of PANI-S-a, PANI-S-a/GO-5%, PANI-S- a/GO-10%, PANI-S- a/GO -15% (a), the trend plot of the CV enclosed area according to the different contents of GO (b), CV curves of the PANI-S-a/GO-10% composites at different scanning rates (c), the trend plot of the peak current density against current scanning rate (d), GCD curves of PANI-S-a, PANI-S- a/GO -5%, PANI-S-a/GO-10% and PANI-S-a/GO-15% at current densities of 0.5 A g-1 (e), GCD curves of PANI-S-a/GO-10% at different current densities (f).
Figure 9(e) shows the GCD curve of PANI compounded with different proportions of GO in 1 mol L-1 of H2SO4 solution at a current density of 0.5 A g-1. The GCD curve of PANI-S-a/GO-10% has the longest discharge time and the best electrochemical performance, indicating that the specific capacitance of PANI-S-a can be increased significantly after compounding with GO. When the amount of compounded GO is too high, the electrochemical capacitance of the composite decreases. The specific capacitance can be calculated from equation (1)
where C,
As shown in Figure 10(a), we observe a relationship between the current density and the specific capacitance of the electrode material. The specific capacitance of both materials tends to decrease with an increase of current density, but the specific capacitance of PANI-S-a/GO-10% is larger than that of PANI-S-a over all the current densities rage.

Charge–discharge current density specific capacitance for PANI-S-a and PANI-S-a/GO-10% (a), electrochemical impedance spectra of PANI-S-a and PANI-S-a/GO-10% (b), the capacitance retention of PANI-S-a and PANI-S-a/GO-10% at 5 A g-1 during 10000 cycles (c) (insets are the GCDs of PANI-S-a and PANI-S-a/GO-10% over the find 10 cycles).
In the field of SPs, EIS is one of the effective methods to measure the charge transport properties of electrode materials. Figure 10(b) shows the Nyquist plot of the PANI-S-a/GO-10% and PANI-S-a electrodes. The straight line in the low-frequency region is close to vertical, indicating a low ion diffusion resistance between the electrode and the electrolyte. The EIS results are simulated using ZSimpWin software by selecting a suitable equivalent circuit. Rs represents the solution resistance of the electrolyte, Rct represents the charge transfer resistance, and W1 represents the Warburg impedance. 2 The Rs, Rct, and Warburg impedance values of PANI-S-a are 3.25, 10.20, and 2.83 Ω, respectively, and those of PANI-S-a/GO-10% are 4.31, 13.49, and 1.78 Ω. The synergistic effect of the composites is the reason for their good electrochemical performance. 52
The cycle stability of the electrode material was tested at 5 A g-1 (Figure 10(c)). After 10,000 cycles, the capacitance retentions of PANI-S-a/GO-10% and PANI-S-a are 93.6% and 92.3%, respectively. The curve of PANI-S-a/GO-10% shows a trend of decrease first and then increasing, which belongs to the activation process of the electrode material. Through a continuous charging and discharging process, ions can be periodically injected into and extracted from the interior of PANI-S-a, thus enhancing the capacitance characteristics. This is consistent with the previous SEM analysis. As a comparison, the capacitive performances of reported PANI/GO composites and our material are listed in Table 2.
The capacitive performances of PANI/GO composites in 1 M H2SO4 as the electrolyte.

Conclusion
PANI-S has been successfully synthesized by the hydrothermal method, and the morphological control of PANI-S was achieved by varying the amount of catalyst and oxidant. Subsequently, PANI-S-a was compounded with GO by interfacial electrostatic interaction. PANI-S-a/GO-10% has amount of active sites and a large storage capacity, which gives it good electrochemical and capacitive properties. In the three-electrode system, the specific capacitance reaches a maximum of 535 F/g at 0.5 A g-1. When the current density is 5 A g-1, the specific capacitance retention rate arrived at 93.6% after 10,000 cycles, which shows good cycle stability. The enhanced properties of the PANI-S-a/GO-10% composite can be attributed to the easy point-to-surface charge conduction mode and the good dispersion of PANI-S on the GO substrate.
Footnotes
Declaration of conflicting interests
The author(s) declared no potential conflicts of interest with respect to the research, authorship, and/or publication of this article.
Funding
The author(s) disclosed receipt of the following financial support for the research, authorship, and/or publication of this article: This work was supported by grants from the National Natural Science Foundation of China (grants nos 52073227) and Shaanxi Province Technological Innovation Guidance Special (2021QFY04-01).