
Abstract
A series of imidazolium and pyridinium-based bridged dicationic ionic liquids have been analysed using X-ray photoelectron spectroscopy. The different electronic environments of the dications have been investigated and a robust fitting model for the carbon C1s region has also been developed. The relative positions of different C1s components and N1s of dications have been determined and their complex C1s photoemission spectra produced from both aromatic and aliphatic carbon states giving photoemission peaks in the binding energy range of 289.0–283.9 eV. A contemporary fitting approach has been applied to a different set of environments which allowing comparison of the binding energies of cationic components of imidazolium and pyridinium-based dicationic ionic liquids. The experimental stoichiometry of all the carbons and nitrogens have also been calculated from XP spectra of the dicationic ionic liquids.

Introduction
X-ray photoelectron spectroscopy (XPS) is a leading technique for the surface analysis of organic and inorganic compounds that provides information regarding surface composition and chemistry.1–3 Not only different electronic environments and chemical states can be identified, 4 but elemental composition can also be quantified, apart from helium and hydrogen. 5 There is characteristic binding energy associated with each element and a small variation in the binding energy occurs due to change in the chemical and electronic environment which corresponds to a slight change in the binding energy of the peak in the XPS spectrum.6,7
As it is an ultra-high vacuum (UHV) based technique, many small-molecule samples cannot be analysed as they would evaporate quickly due to their high volatility under the XPS experimental conditions. 8 Therefore, the most prominent fields where XPS can be exploited include nanomaterials, 9 solid-state chemistry, 10 metal alloys,11,12 polymers, 13 fuel cells 14 and viscous oils. 15 One apparent exception to the restriction on small molecular analysis is ionic liquids (ILs), which are composed entirely of molecular ions. 16 The inherent wide liquid range of ILs and their extremely low vapour pressure have enabled them to be investigated under UHV conditions of XPS. 17 A variety of information about liquid–gas interface 18 and surface enrichment 19 of solutes can also be obtained by investigating ILs using XPS. 20 Significantly, many ILs experience little or no detectable beam damage in laboratory-based XPS instruments, this is due to the dynamic nature of the liquid surface, and spectra from ILs are typically characterized by intense, sharp and reproducible core line signals. 21 Substantial differential charging is also prevented owing to the electrically conducting nature of many ILs, although more viscous ILs can suffer from charging.
XPS core line signals appear complex when an element exists in several chemical states within a sample. An important objective of much XPS analysis is to successfully deconvolute complex core line spectra and accurately identify and quantify the different chemical environments present. Due to the difficulty in measuring small molecules, and challenges of surface contamination seen in many XPS measurements, the development of models of C1s spectra for organic molecules is less developed compared with many inorganic non-molecular materials, or for other core lines apart from C1s. 22 For chemical environments commonly seen in organic molecules, binding energy (BE) chemical shifts are typically smaller than the full width at half maximum (FWHM) of core photoemission lines. 23 To overcome this problem of overlapping peaks in XPS, peak fitting models are used.24,25 There are multiple chemical states of carbon in ILs; for example, aromatic environments will appear at different binding energies to aliphatic environments. 26 Considering commonly used aromatic IL cations, the complexity in XP spectra is due to the covalent bonding and delocalization of charge having alkyl chain lengths and different functional groups and in more viscous ILs, the photoelectron flux has also been noted to cause surface charging. 27 Therefore, an accurate, reliable and robust fitting model for ILs is required to get precise information from the complex XP spectrum. Such models have been introduced for standard monocationic ILs.18,28 Here, we adapt and assess these models for use with dicationic ionic liquids (DcILs).
The chemical properties can be tuned by the chemical variation of ILs to expand their applications and for this reason, they are referred to as neoteric designer solvents.29,30 DcILs are an interesting class of ILs that not only have extended the chemical space but also offer more opportunities to improve their functions by giving many options for chemical modifications with tuneable properties. 31 The incorporation of two charges in DcILs allows more tailoring of the IL with two different anions and more tailoring of the IL with two different anions and they exhibit even higher thermal stability properties. 32 Further studies are also required to exploit the designer feature of ILs as well as the opportunity to expand XPS as an analytical tool.
The aim of this study is to exploit the tuneable nature of DcILs to effect electronic changes specifically in the cations to facilitate the XPS peak fitting. The DcILs presented in this work are based on both symmetric as well as asymmetric imidazolium and pyridinium cations. Their complex C1s photoemission spectra produce from both aromatic and aliphatic carbon states giving photoemission peaks in the BE range 289.0–283.9 eV. So, the goal of this work is to build on the foundations laid before us by modifying existing fitting models and applying them to this previously unexplored class of ILs.
Results and discussion
A series of DcILs based on imidazoles and pyridines have been synthesized and investigated (Table 1). The cations are composed of methyl imidazole, butyl imidazole, pyridine and methyl pyridine with varying alkyl bridges of 2, 5 and 10 carbons long. The X-ray photoelectron spectra of C1s in ILs are usually characterized by the two discrete photoemission envelopes, which correspond to cationic and anionic carbon. In these synthesized DcILs, the anion contains no carbon, so the only contribution to the C1s region should be from the cation. Survey spectra from all samples are shown in the supporting information. Apart from the expected elements, some samples showed low levels of Si. 1H NMR confirmed the purity of all samples. The N1s XPS peak is shown in the Supporting Information for all samples. In each case, this N1s peak appeared as a narrow, symmetric peak, expected for a single nitrogen environment, with peak energies tabulated in Table 2. The amount of N seen is lightly lower in all samples than expected. This may be due to orientation effects of the cations at the surface of the IL droplet, at the vacuum–liquid interface.
Names and structures of DcILs under investigation here.

Binding energies of imidazolium and pyridinium-based DcILs presented in this work.

BE: binding energy.
Note that Villar-Garcia et al. 28 used a charge correction procedure in their work, so the absolute BE is not directly comparable, although the binding energy differences are.
The C1s spectrum was asymmetric in all samples studied here and appears to be comprised of different components which we attempt to model as contributions from carbon environments within the cation. Definition of the BE scale, often described as charge correction, using C1s is typically carried out in the literature; however, this procedure is difficult when the material under analysis itself contains carbon, and so in this work, we have focused on understanding spectral shape in terms of molecular structure, and not absolute binding energies. 28 While charge compensation was used to reduce charging we have not adjusted the as-recorded binding energies and so the absolute binding energies here should not be used alone to characterize carbon environments. In contrast, relative binding energies of each component are a valid tool for understanding chemical environments.
Imidazolium DcILs
The C1s fitting model for these DcILs follows the trend already set in the literature and applies according to the work previously completed in this area of interest.18,22,33 In the case of bis-imidazoles, the first component CA is the ring carbon between the two nitrogen atoms, the second component corresponds to the remaining two carbons within the imidazolium ring labelled as CB and the alkyl carbons bonded directly to nitrogen outside of the aromatic ring are the third component CC. As the cation gets bigger, an increase in substitution on aromatic ring or carbon bridge length introduces a new carbon environment, CD, which corresponds to the sp
3
hybridized carbon that is bonded to the carbon and hydrogen only. We model the C1s region by constraining the relative areas of components A–D according to the molecular formula of the cation. For example, in compound
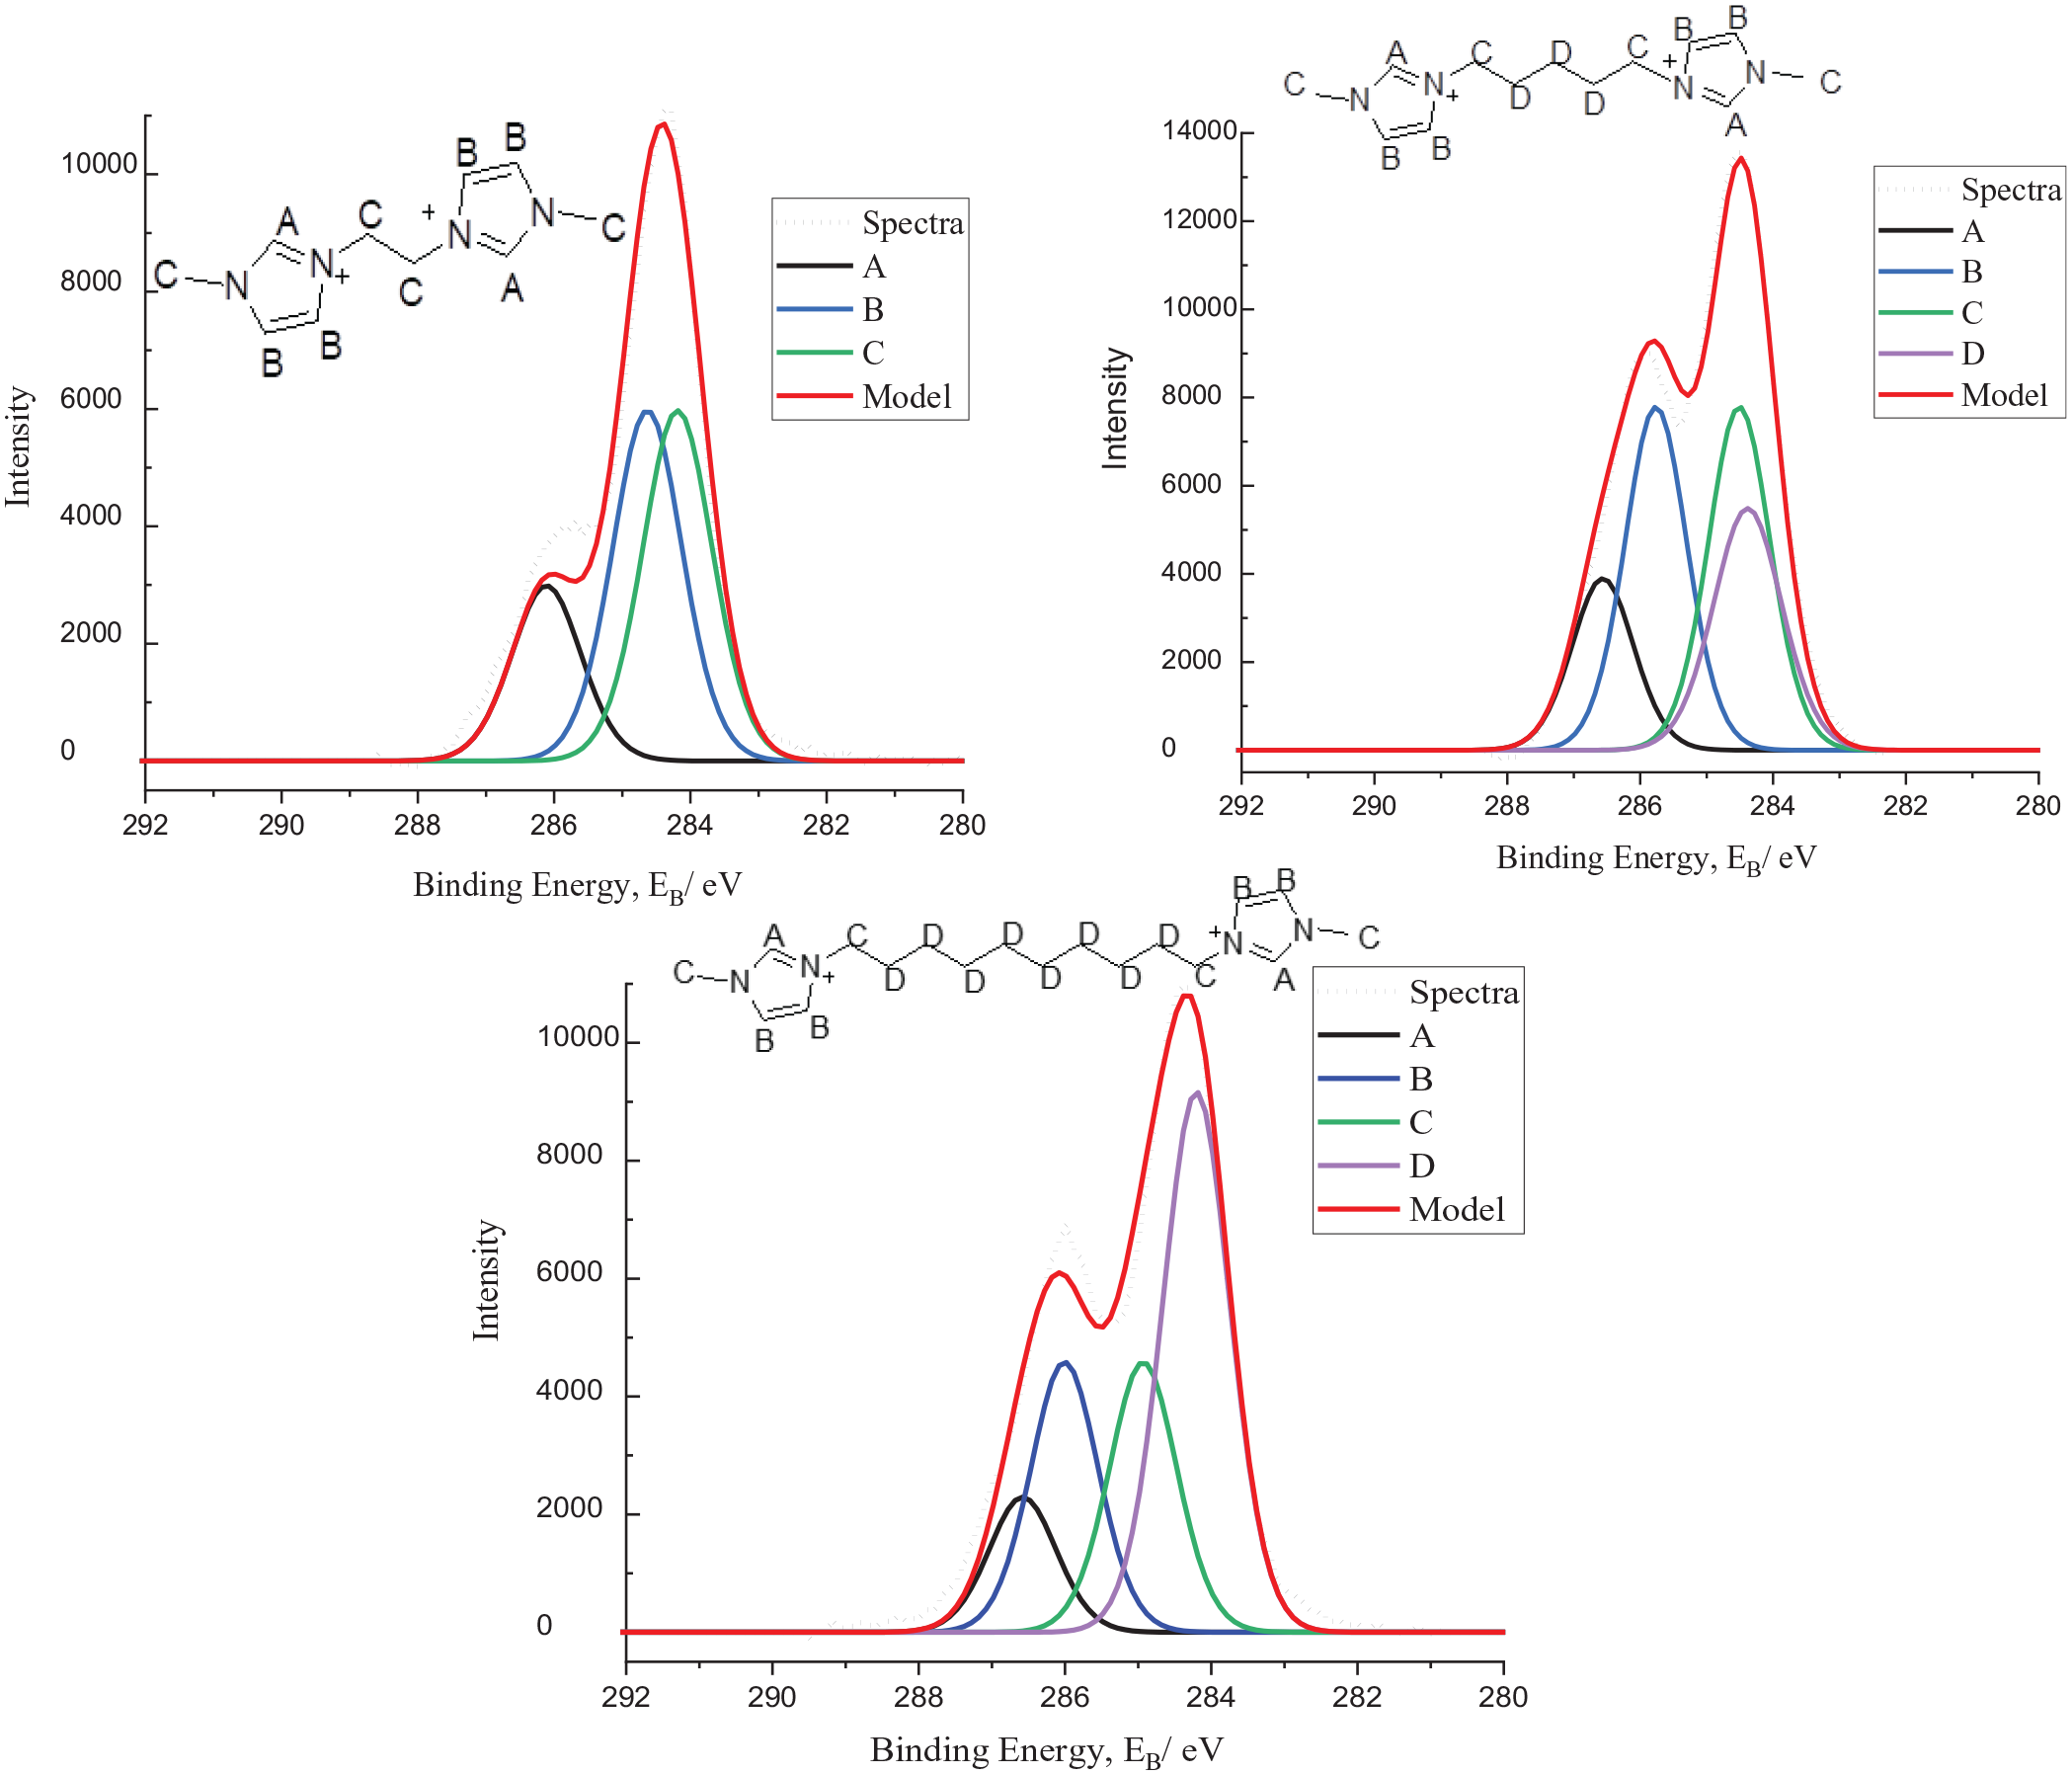
C1s XP spectra of compounds
As depicted in Figure 1, the spectra of compounds
Similarly, butyl imidazolium-based symmetric DcILs are also modelled with the same alkyl bridges of 2, 5 and 10, respectively. The same fitting procedure is applied as before, with the CC component being aliphatic carbons bonded to nitrogen. The difference with these DcILs is that the butyl part of the cation plays a key role in the modelling of the environments too. It is elected that the CD component should also include three atoms on the aliphatic alkyl chain introduced with the butyl group. The DcILs are illustrated in Figure 2.

C1s XP spectra of compounds
In the series of bis-butyl imidazolium-based DcILs, a parallel trend can be seen. As the bridge length is increased the low BE region of the spectrum also increases in intensity, following the patterns seen in compounds
After modelling symmetric DcILs, asymmetric DcILs are now presented. This is completed to assess the robustness of the fitting model applied, staying in the same spirit of the simplest most efficient model. The DcILs are a mix of methyl and butyl imidazolium cations which are shown below in Figure 3 along with their spectra.

C1s XP spectra of compounds
The same rules apply as previously stated, with a four-component model, with the same constraints. As before, as the bridge length is increased, the CD component shifts to a lower BE relative to the other components, typical of aliphatic carbons. In these spectra, the CB and CC components are also displaying subtle changes whereby the binding energies appear to be getting closer together (a smaller difference between the two), this can also be seen for the bis-methyl imidazolium DcILs discussed though the phenomena are difficult to explain based chemically. An early hypothesis could be that the signals are becoming increasingly similar due to the larger influence of the alkyl component in CD. A similar phenomena is found in 1H NMR when alkylating butyl imidazole with a haloalkane longer than four carbons, for example, 10; here focussing on the resulting imidazolium cation, it will appear symmetrical if only considering up to the 4th carbon in the alkyl chain resulting in an aromatic region with only two peaks in a ratio 1:2, whereas in actual fact, one alkyl chain has 10 carbons so the molecule is not symmetrical and the standard 3 aromatic peaks should be present in a 1:1:1 ratio, a similar argument could perhaps be made for these components.
Pyridinium DcILs
Pyridinium (Py) DcILs have been shown in previous work
35
to display better thermal stabilities,
36
lubricative properties
37
as well as higher viscosities
38
and have slightly lower densities,
39
compared with imidazolium-based ILs. A wide variety of Py ILs has been analysed using XPS in the literature and a three-component model was deduced for pyridinium-based ILs by Men et al.
40
We attempted to fit the same four-component model described for the Imidazolium compounds for the pyridinium compounds. In doing this, after fitting the carbon 1s components CC and CD were always found to appear at almost exactly the same BE. Thus, components CD were combined with CC to give a three-component model for the pyridinium compounds. C1s spectra from compounds
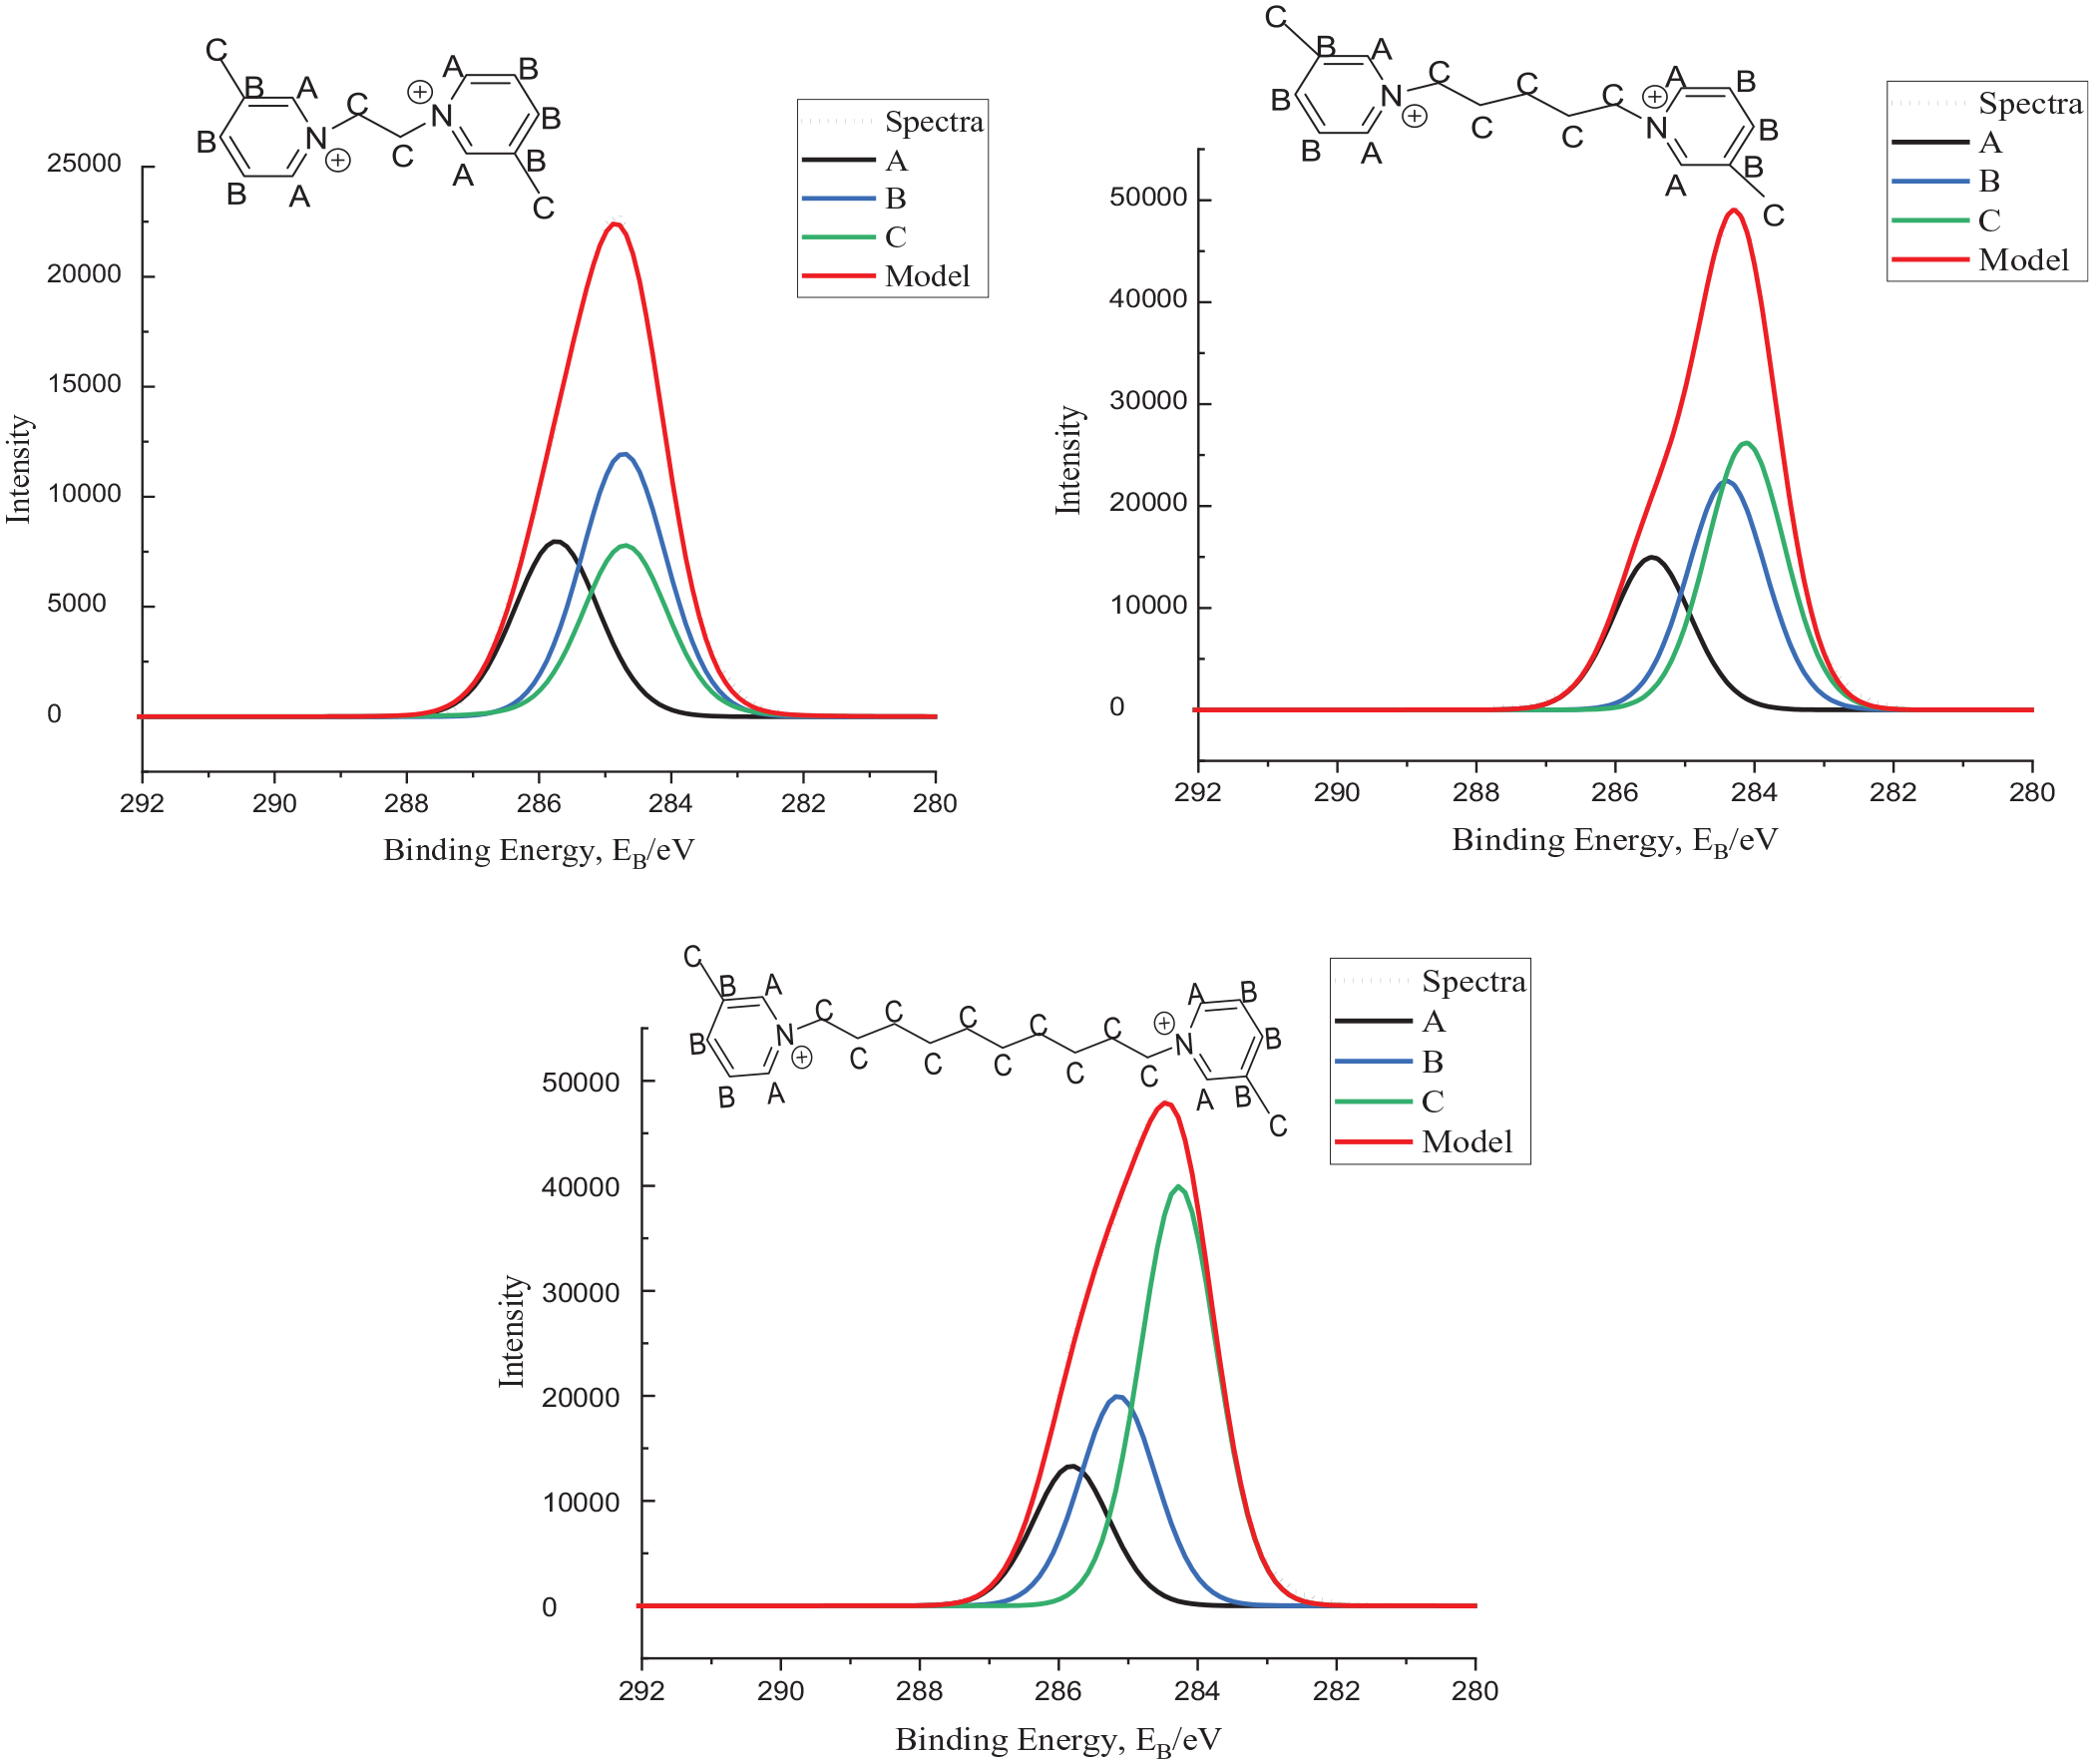
C1s XP spectra of compounds
In previous studies, one of the three components consists of carbons attached directly to N; this represents three carbons for each Py ring.25,40 This provides a good fit for their data; however, we have chosen different approach to our C1s model. To keep consistency with the imidazolium model discussed above, we designate the two carbons in the aromatic ring that are bound to N as carbon environment CA. The other carbon attached to the N, in the alkyl chain, is part of CC, as is the carbon of the methyl group. The remainder of the carbons in the Py ring belong to environment CB. We find this model satisfactorily models the observed spectra shape and for that reason find it adequate for our purposes.
From the spectra set out in Figure 4, it can be clearly seen that as the alkyl chain bridge is increased, the BE for the C component shifts to a lower value relative to the other components. The final set of data is the same pyridinium-based DcILs, without the methyl group present, the models and spectra are shown in Figure 5.
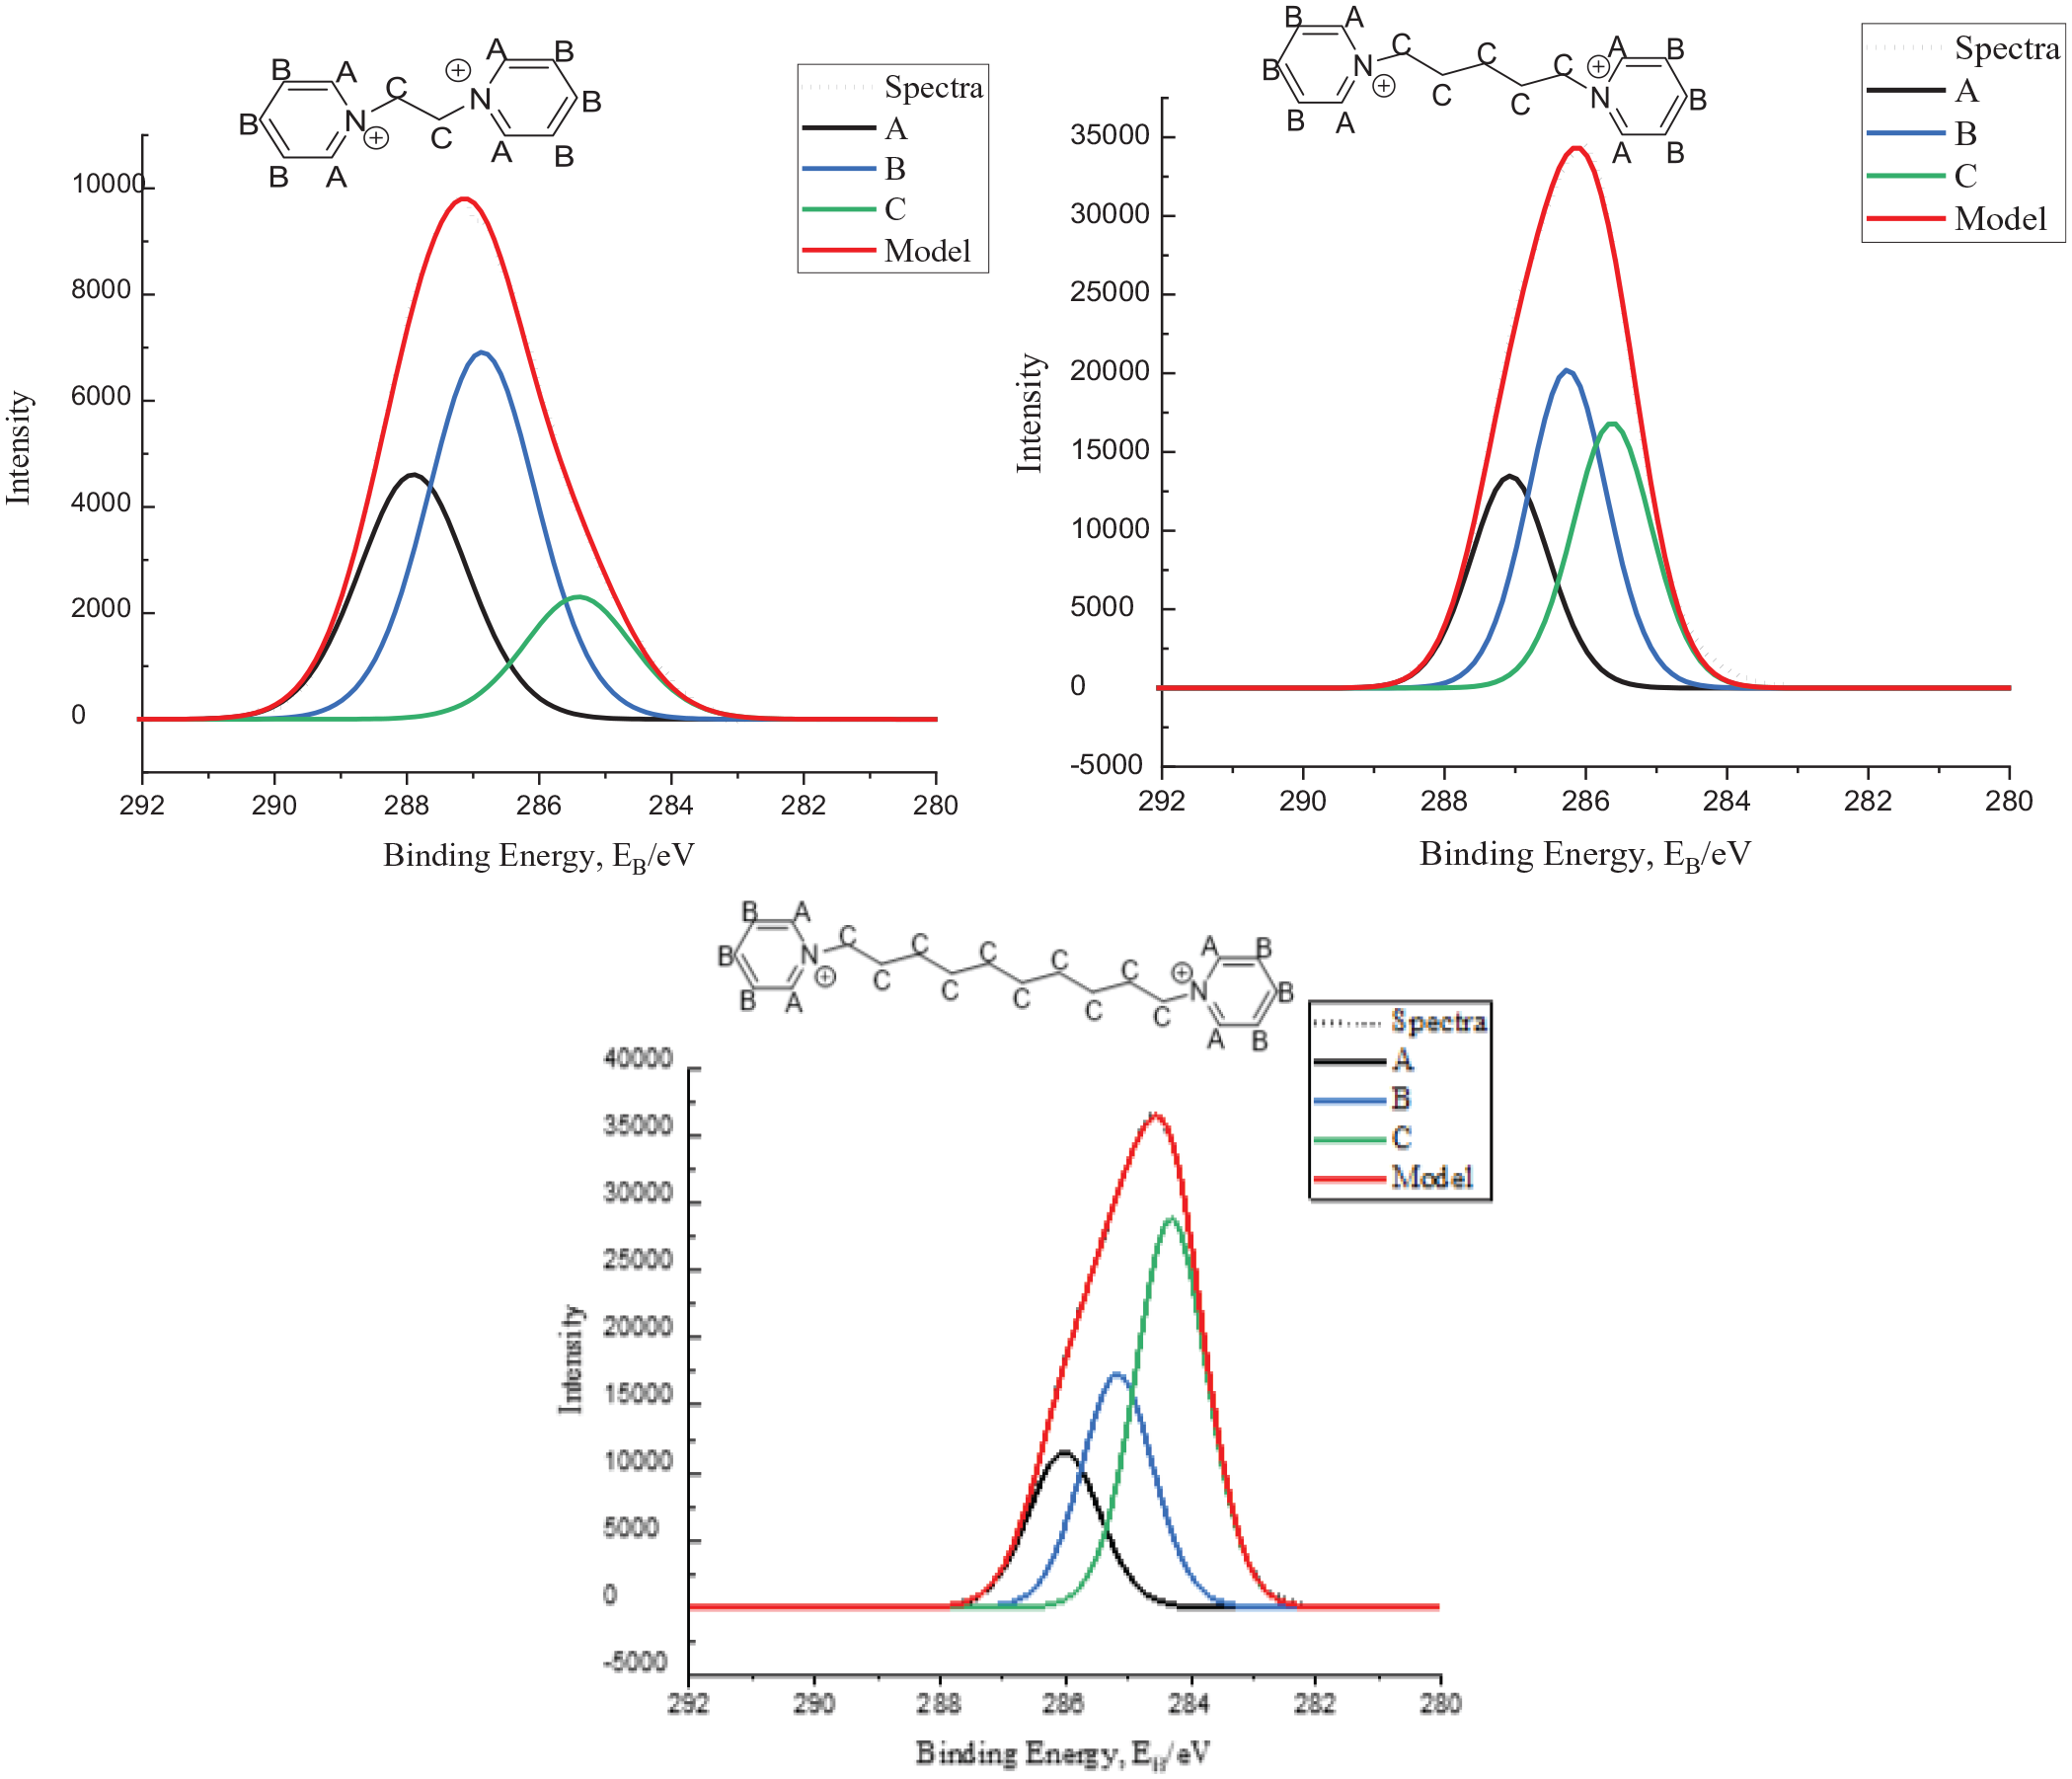
C1s XP spectra of compounds
As can be seen in Figure 5, the same fitting model has been applied as previously and the same trend can also be inferred, increasing the length of the alkyl bridge causing a decrease in BE to that typical of aliphatic carbons. The difference in the last two sets of data is the presence of a methyl group bonded on the pyridinium cation, from the data presented it appears to have been correctly appointed to a CC component.
Table 2 shows the relative positions of the C1s components and the N1s signal for each compound listed here. The C1s components CB–CD are shown relative to the CA component, which is present in each sample. The absolute BE values for the CA component are given but note that these are not corrected to any internal standard, as described in the experimental section, given the difficulty in doing this for carbon containing materials. Instead, we focus on BE differences which we consider a more reliable indicator of chemical environment. For the imidazolium compounds, the N1s BE is on average 114.6 eV above the CA component of the C1s spectrum. Villar-Garcia et al. studied monocationic imidazolium ILs and found an average of 114.8 eV difference between their component CA and the N1s core line, very similar to our result. However, for the pyridinium compounds, the N1s BE is on average 115.5 eV above the CA component of the C1s spectrum. This 0.9 eV difference may represent a greater difference in electron density between the N and CA in the pyridinium versus the imidazolium cation, or it may be due to final state effects which are difficult to interpret without calculation of electronic structure. The separation of each of the components from CA is relatively constant across the series of compounds studied here, except for the cation in compound 1 [C2(C1Im)2]2+. This compound has significantly different component separations compared with the monocationic imidazolium ions studied previously, suggesting that in this compound the very short bridge length causes the two imidazolium rings to interact, affecting the measured BE of the components. At longer chain lengths, the two Im rings appear to show no electronic interaction detectable by XPS.
There are different types of Carbon C1s environment are and visibly seen in the figures above. The C1s and N1s ratio are given below in the table and it has been seen that the ratio of these investigated DcILs has very close experimental values to the nominal ones and could be improved further by considering the shake-up effect of the aromatic ring. 41
Conclusion
The XP spectra of a wide array of DcILs based on imidazoles and pyridines, varying the bridged alkyl chain length of cation, have successfully been analysed. The different electronic environments of these DcILs are identified. A fitting model for the C1s region of imidazolium and pyridinium-based DcILs has been fashioned. The binding energies of different components of the C Is region are determined with high confidence. This research is based on work previously set out by other researchers and applied the models to a different set of circumstances which reveals the comparison of the binding energies of cationic components of imidazolium and pyridinium-based DcILs. This study also favours the fact that the carbon in between two nitrogens (CA) of imidazole is more electropositive than any of the carbon components of pyridinium-based cations. For the pyridinium-based DcILs, it is an early alternative suggested way of modelling that is backed up by our XPS spectra where we intend to apply this model to even more varied structures to prove its worth.
Experimental
XP spectra were recorded using a K-alpha spectrometer equipped with a monochromated, micro-focused, Al K-Alpha X-ray source (1486.6 eV), a quartz crystal monochromator set in a 250-mm Rowland circle, hybrid optics, multichannel plate, hemispherical analyzer and 128-channel sensitive detector. The incident and collection angle were 30° and 0°, respectively, comparative to the surface normal. The base pressure was 10−9 mbar and 180° double-focusing hemispherical analyzer having mean radius 125 mm which was run in constant analyzer energy mode. The pass energies were set to 20 eV for high resolution and 80 eV for survey scans.
Three-point (Au, Ag and Cu) scale was used to regularly calibrate the BE scale of the instrument. Samples were prepared and placed onto a stainless-steel plate. For the liquid samples, a very small drop (≈15–20 mg) was directly placed on stainless-steel plate and for solid a thin film (≈ 0.5–1 mm) was used. After the sample preparation, these were placed immediately into a load-lock to avoid the absorption of volatile impurities and consequently pumping down by reducing the pressure up to 10−7 mbar. The time for the process of pumping down varies and depends on the factors such a volume, viscosity and volatile impurities of the sample. There were no significant bubbling and outgassing observed in this process. After gaining the required pressure, the samples were transported to the main analytic vacuum chamber for analysis. For liquid samples, etching was carried out as they are electrically conducting and not able to experience considerable differential charging. So, 500 eV Ar+ ion dual bean flood gun was used to achieve the charge compensation.
Data analysis
The data for all the samples were converted into VAMAS (.vms) format and imported to Casa XPS for peak fitting and quantitative analysis. A Shirley background subtraction was used for the interpretation of data and GL(30) lineshapes, a combination of a Gaussian (70%) and Lorentzian (30%) was used for the peak fitting. 42 This lineshape was used throughout to match the experimental lineshapes for the IL systems. The C1s region was modelled using components assigned to different carbon chemical environments, following the work of Villar-Garcia et al. 28 These components are labelled A–D, using the priority rule which was already set in the literature. 40 The full width half maximum (FWHM) for every component was kept constant within each model but could vary between models. The relative areas of A–D were initially constrained to the expected ratios according to the molecular structure and were allowed to vary from this starting point. To calculate the atomic percentages, relative sensitivity factor (RSF) was used. 43 In this study, the experimental stoichiometries calculated form XP spectra for all ILs were well in agreement with the experimental error of nominal stoichiometries attained from their empirical formulae (Table 3).
Quantitative analysis of XP spectra imidazolium and pyridinium-based DcILs presented in this work.

Footnotes
Declaration of conflicting interests
The author(s) declared no potential conflicts of interest with respect to the research, authorship and/or publication of this article.
Funding
The author(s) disclosed receipt of the following financial support for the research, authorship, and/or publication of this article: The authors acknowledge the Commonwealth Scholarship and the Franz Sondheimer Bursary received form University College London.