
Abstract
Nitrogen-doped carbon dots were synthesized using citric acid monohydrate and glutathione as raw materials. The synthesized nitrogen-doped carbon dots were characterized by multiple analytical techniques, including transmission electron microscopy, Fourier transform infrared spectroscopy, ultraviolet–visible absorption spectroscopy, X-ray photoelectron spectroscopy, X-ray diffractometry, and fluorescence spectra. The fluorescence intensity of the nitrogen-doped carbon dots gradually quenched with different concentrations of Cu2+ ions. The effect of the pH value, the nitrogen-doped carbon dot concentration, and the reaction time on the fluorescence intensity of the N-CDs-Cu2+ system was investigated, and the experimental conditions were optimized. A rapid and sensitive method for the determination of Cu2+ ions was established that exhibited a good linearity in the concentration range 0.20–200.0 μM with a detection limit of 0.27 nM. Meanwhile, the fluorescence quenching mechanism of the interaction between nitrogen-doped carbon dots and Cu2+ was preliminarily discussed. The method was used to detect trace Cu2+ in tap water and lake water, with recoveries ranging from 98.1% to 102.0%. Furthermore, due to low cytotoxicity and good biocompatibility, nitrogen-doped carbon dots as a probe were also successfully used in bioimaging.
In this work, nitrogen-doped carbon dots were synthesized using citric acid monohydrate and glutathione as raw materials. The fluorescence intensity of the nitrogen-doped carbon dots gradually quenched with different concentrations of Cu2+ ions. The quenching mechanism of the interaction between the nitrogen-doped carbon dots and Cu2+ is mainly static quenching. Furthermore, due to low cytotoxicity and good biocompatibility, the nitrogen-doped carbon dots as a probe were also successfully used in bioimaging.

Introduction
Carbon dots (CDs) are a new emerging fluorescent carbon nanomaterial with a particle size distribution below 10 nm, which are almost quasi-spherical and well dispersed. CDs have drawn much attention owing to their unique characteristics, such as good optical properties, easy surface modification, good biocompatibility, and low cytotoxicity among others. They have been widely used in the fields of fluorescence probes, biological imaging, drug analysis, and so on. However, the relatively low quantum yield (QY) and intrinsic low emission efficiency have limited their applications.1–4 Researchers have improved the shortcomings of CDs through element doping or surface functionalization. Heteroatom doping is easy and green, attracting research’s interests. For example, Jia et al. 5 synthesized B-doped carbon dots (B-CDs) via the hydrothermal method using phenylboronic acid (PBA), with the B-CDs being developed to determine sorbate and vitamin B12. Qian et al. 6 synthesized Si-CDs for Fe3+ detection as a label-free multifunctional nanosensor and for cellular imaging. Based on the fluorescence quenching of S-CDs prepared from vitamin B1, Wu et al. 7 developed a method to determine the content of Fe3+ ions. Shah et al. 8 used nitrogen-doped carbon dots (N-CDs)/H2O2 chemiluminescence system for selective detection of Fe2+ in environmental samples.
It is well known that copper is an essential trace element present in the human body.9–11 The copper concentration is about 1.4–2.1 mg kg−1 in normal humans. Copper-containing enzymes in the human body play a critical role in various biological reactions;12–14 low Cu2+ in the body is related to reduced activity of copper-containing enzymes, which can cause anemia and other diseases.15,16 In addition, excess copper can also cause various diseases such as gastrointestinal disorders, various neurodegenerative diseases, and deterioration of liver and kidney function.17–25 Therefore, the development of methods for detecting Cu2+ ions has received extensive attention.
At present, there are many methods for the detection of copper ions, such as electrochemical methods,
26
inductively coupled plasma mass spectrometry (ICPMS),
27
atomic absorption spectroscopy (AAS),
28
and atomic emission spectroscopy (AES).
29
However, these methods have associated problems, including complicated sample processing, long detection times, and high cost, which make their applications limited. Hence, rapid, sensitive, and simple methods for the detection of Cu2+ ions are still required. Recently, nanoparticle-based fluorescence probes have been developed to widely detect Cu2+ owing to their high sensitivity and simplicity.30–35 For example, Zhao et al.
36
synthesized highly luminescent, surface-different, N-CDs using ionic liquids as precursors for the detection of Cu2+ and cell imaging. Tian et al.
37
developed a highly efficient fluorosensor based on ultrathin graphitic carbon nitride (g-C3N4) nanosheets for the detection of Cu2+. Europium-decorated graphene quantum dots (Eu-GQDs) were prepared via strong acid treatment, and Lin et al.
38
used Eu-GQDs as a fluorescent probe to detect Cu2+ and
In this work, N-CDs are synthesized by using citric acid monohydrate and glutathione as raw materials. The fluorescence intensity of the N-CDs can be quenched significantly by Cu2+ ions. Moreover, the prepared N-CDs exhibit greater sensitivity and selectivity for Cu2+ ion. Thus, N-CDs are used as a fluorescent probe to determine Cu2+ ion concentrations in tap water and lake water. Finally, the fluorescence quenching mechanism of the interaction between N-CDs and Cu2+ is discussed in detail. Meanwhile, the N-CDs show low cytotoxicity and are utilized in cell-imaging, in vitro, of HepG2 cells.
Results and discussion
Characterization of the N-CDs
The N-CDs were characterized by transmission electron microscopy (TEM), Fourier transform infrared (FTIR) spectroscopy, ultraviolet–visible (UV-Vis) absorption spectroscopy, X-ray diffractometry (XRD), X-ray photoelectron spectroscopy (XPS), and fluorescence spectroscopy. Figure 1 is a TEM image of the N-CDs. It can be seen from the figure that the N-CDs are well dispersed and there is no phenomenon of agglomeration. The diameter of the N-CDs is about 4.5 nm and the N-CDs are nearly spherical in shape.

TEM image of N-CDs.
Figure 2 presents the FTIR spectrum of the N-CDs. The stretching vibrations O–H and N–H in the figure appear around 3200–3500 cm−1. The absorption peak at 2893 cm−1 corresponds with the C–H stretching vibration. The absorption peaks at 1700 and 1576 cm−1 are attributed to the stretching vibrations of the C=O and N–H, respectively. The absorption peak at 1300 cm−1 is due to the C–H of the amide. In addition, the absorption peaks at 1200 cm−1 are caused by C–O–C stretching vibrations. Supplemental Figure S1 illustrates the fluorescence emission spectra of the N-CDs at different excitation wavelengths, from 325 to 35 nm, in which the maximum emission wavelength of the N-CDs was centered at 420 nm, when the excitation wavelength was 345 nm. While the excitation wavelength continues to increase, the emission wavelength of the N-CDs decreases with increasing excitation wavelength. Supplemental Figure S2 shows the UV-Vis absorption and fluorescence excitation and emission spectra of the N-CDs. The maximum absorption peak at 340 nm is attributed to the typical n-π* absorption of the C=O bond.

FTIR spectrum of N-CDs.
As shown in Figure 3, the XRD spectrum of the N-CDs exhibited a broad peak at 2θ = 20°, which is ascribed to a highly disordered carbon core. The data suggest that the N-CDs are amorphous. Figure 4 shows the X-ray photoelectron spectrum of the surface compositions, and elemental analysis of the N-CDs shows that they contain mainly S2p, C1s, N1s, and O1s core levels. In Figure 4(a), the XPS full spectrum of the N-CDs showed that the S2p, C1s, N1s, and O1s peaks were distributed at 150.00, 285.08, 400.08, and 531.08 eV, respectively. The spectrum of S2p is distributed at around 162.9 eV (S2p1/2 C–S–C), 163.6 eV (S2p3/2 C–S–O), 164.00 eV (–S=O), and 167.5 eV (N–S=O) (Figure 4(b)). The C1s peak of the NCDs (Figure 4(c)) could be deconvoluted into four obvious absorption peaks, which corresponded with C–C at 284.60 eV, C–N at 285.20 eV, C=O at 287.80 eV, and O–C=O at 288.30 eV. The N1s peak (Figure 4(d)) attributed to the nitrogen atom of N–H, pyrrolic-like N and pyridinic-like N groups, is distributed at 400.30, 399.70, and 399.30 eV, respectively. Furthermore, the O1s spectrum (Figure 4(e)) shows three peaks corresponding to O–C, O=C–O, and O–H at ca. 530.70, ca. 531.50, and ca. 532.70 eV, respectively. 39 Supplemental Figure S3 shows the change in fluorescence intensity of the N-CDs after 48 h of exposure to sunlight. With an increase in time exposed to sunlight, the fluorescence intensity of the N-CDs basically remains unchanged, indicating that the N-CDs have resistance to photobleaching. According to the experimental results of TEM, FTIR, UV-Vis, XRD, and XPS, the N-CDs have been successfully prepared.
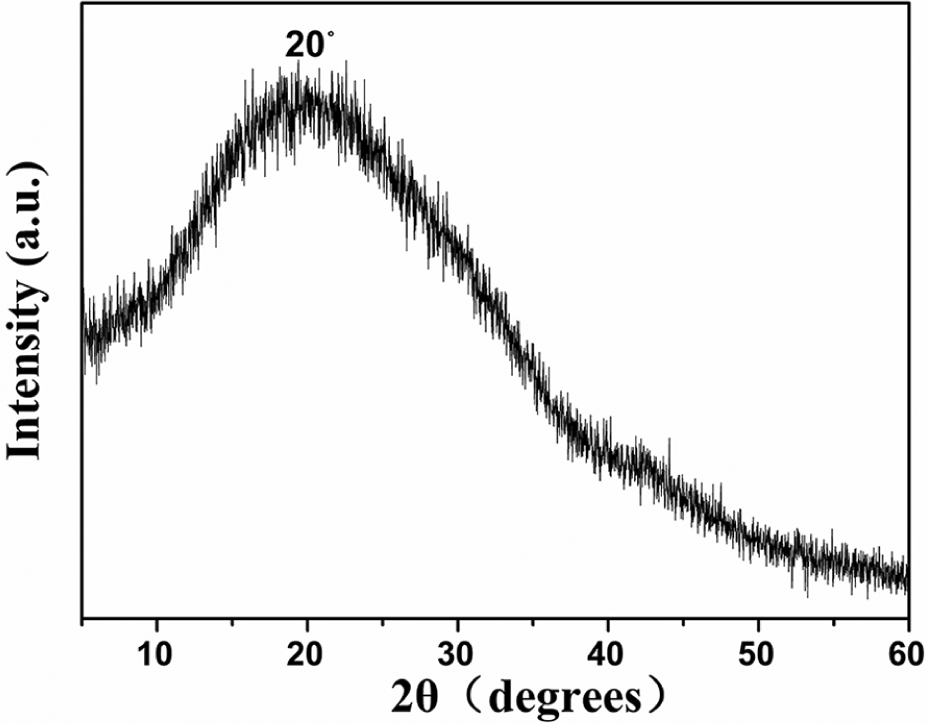
XRD patterns of the N-CDs.

(a) Survey of the XPS spectra of N-CDs. High-resolution (b) S2p, (c) C1s, (d) N1s, and (e) O1s spectra of the N-CDs.
Optimization of the detection conditions
The effects of pH
The effects of the pH in the range from 4 to 10 on the fluorescence intensity of the N-CDs and Cu2+-N-CDs system were investigated. The results are shown in Supplemental Figure S4, in which F0 and F are the fluorescence intensities of the N-CDs in the presence or absence of Cu2+, respectively. It can be seen from the figure that from a pH value of 4 to 7, the fluorescence intensity of F0 and (F0–F) markedly increased and reached maximum values at pH 7. When the pH continued to rise from 7 to 11, the fluorescence intensity of F0 and (F0–F) decreased. Therefore, pH 7 was selected as optimal for detecting copper ions. Interestingly, this value is same as the optimal pH value of the human physiological environment.
The effects of different concentrations of N-CDs
The effect of different concentrations of N-CDs on the fluorescence intensities of the Cu2+-N-CDs reaction system is shown in Supplemental Figure S5. The figure displays a linear relationship between F0/F and the concentration of copper ions, in which F0 and F are the fluorescence intensities of the N-CDs in the absence or presence of Cu2+, respectively. With an increase in the concentration of N-CDs in the range from 2.3 × 10⁻² mg mL−1 to 2.6 × 10⁻² mg mL−1, the slope of the curve increases and reaches the highest at 2.6 × 10⁻² mg mL−1. The slope of the curve decreased when the concentration of the N-CDs further increased in the range from 2.6 × 10⁻² mg mL−1 to 3.2 × 10⁻² mg mL−1. Therefore, a concentration of 2.6 × 10⁻² mg mL−1 of the N-CDs was applied in subsequent experiments.
The effect of reaction time
The reaction time also affects the fluorescence quenching of the Cu2+-N-CDs system. As can be seen in Supplemental Figure S6, the fluorescence quenching of N-CDs by Cu2+ was completed in 2 min. The fluorescence intensity of the Cu2+-N-CDs reaction system remains stable over the next 60 min. Therefore, 2 min was selected as the best reaction time for Cu2+-N-CDs system.
Fluorescence quenching of N-CDs by Cu2+
Figure 5 indicates the change in fluorescence intensity of the N-CDs when different concentrations of Cu2+ were added under optimized experimental conditions. With the continuous addition of Cu2+, the fluorescence intensity of the N-CDs decreased gradually. The experimental results show a good linear relationship between the fluorescence intensity of the N-CDs, and the concentration of Cu2+ is established in the range 0.2–5 μM and the linear correlation coefficient (R2) is 0.9987. The relative standard deviation (RSD), after 11 experiments repeated, was 0.13% with an LOD of 0.207 nM, indicating that this method has good reproducibility. Compared with other experimental methods (Table 1), our probe, used to detect Cu2+, is feasible.40–43

The effects of different concentrations of Cu2+ on the fluorescence intensity of N-CDs; the concentration of Cu2+ was 0.2, 0.4, 0.6, 0.8, 1, 1.2, 1.6, 2, 3, 4, and 5 μM.
A comparison of the N-CDs with previously reported methods for Cu2+ detection.

a-GQDs: amino-functionalized graphene quantum dots; N-CDs: nitrogen-doped carbon dots; LOD: detection limit; LAA-CQDs:
Study on the selectivity of N-CDs toward Cu2+
The effect of ions and biomolecules on the selectivity of N-CDs for detecting Cu2+ was evaluated. Figure 6 shows a linear relationship between F0/F and various ions and biomolecules, where F and F0 are the fluorescence intensities of the N-CDs with and without ions or biomolecules. The results show that only copper ions have an effect on the fluorescence intensity of N-CDs, while other ions and biomolecules have no or weak effects on the fluorescence intensity of the N-CDs. Meanwhile, Figure 6 also shows the effect of common interference ions and biomolecules on the fluorescence intensity of the Cu2+-N-CDs system. The fluorescence intensities of the Cu2+-N-CDs system are not affected by common ions and biomolecules, indicating that the N-CDs have good selectivity for Cu2+ ions and can be used to detect concentration of Cu2+ ions.

(a) The effect of copper ions (2.0 × 10⁻⁶ M) and other cation ions (2.0 × 10⁻⁵ M) on the fluorescence intensity of N-CDs and the N-CDs-Cu2+ system and (b) the effect of copper ions (2.0 × 10⁻⁶ M) and other anions/biomolecules (2.0 × 10⁻⁵ M) on the fluorescence intensity of N-CDs and the N-CDs-Cu2+ system.
Quenching mechanism
The interaction process between a fluorescent substance and a quenching agent is generally described by a static quenching process or a dynamic quenching process. In the static quenching process, the quencher and the ground state molecules of the fluorescent substance can form a new complex. An increase in temperature will affect the stability of the complex and lead to a decrease of the quenching constant (KLB). The quenching process conforms to the Lineweaver–Burk equation (formula 1). For a quenching process, by adding the quencher, the absorption spectra of the fluorescent molecules presents change, and the fluorescence lifetimes are almost unchanged


The process of dynamic quenching is in accord with the Stern–Volmer equation (formula 2). Dynamic quenching is related to collisions between the quencher and fluorescence substance; there are no new complex forms during the process. The absorption intensity of the fluorescent molecules remains constant and the lifetime of the fluorescent system is reduced for dynamic quenching.
Figure 5 shows that the fluorescence quenching of N-CDs by Cu2+ ion fits well with the Lineweaver–Burk equation (formula 1). Supplemental Figure S7 shows that the UV-Vis absorption spectrum of the N-CDs changes with an increase in Cu2+ ions, indicating that the ground state molecules of N-CDs react with Cu2+, producing a new complex. In Figure 7, the fluorescence lifetime of excited N-CDs molecules does not change with an increase in Cu2+ concentration. With increasing temperature, the slope of the line decreases, indicating that the quenching constant (KLB) decreases in Supplemental Figure S8.

The effects of different concentrations of Cu2+ on the fluorescence lifetimes of N-CDs.
In summary, the above phenomena show that the quenching mechanism of the interaction between N-CDs and Cu2+ is mainly static quenching. The quenching process can involve holes produced in the valence band to form electron–hole pairs when the valence band electrons of the N-CDs are excited into the conduction band. Cu2+ as an electron acceptor blocks the link between electrons and holes, resulting in fluorescence quenching of the N-CDs. The specific process is shown in Scheme 1.
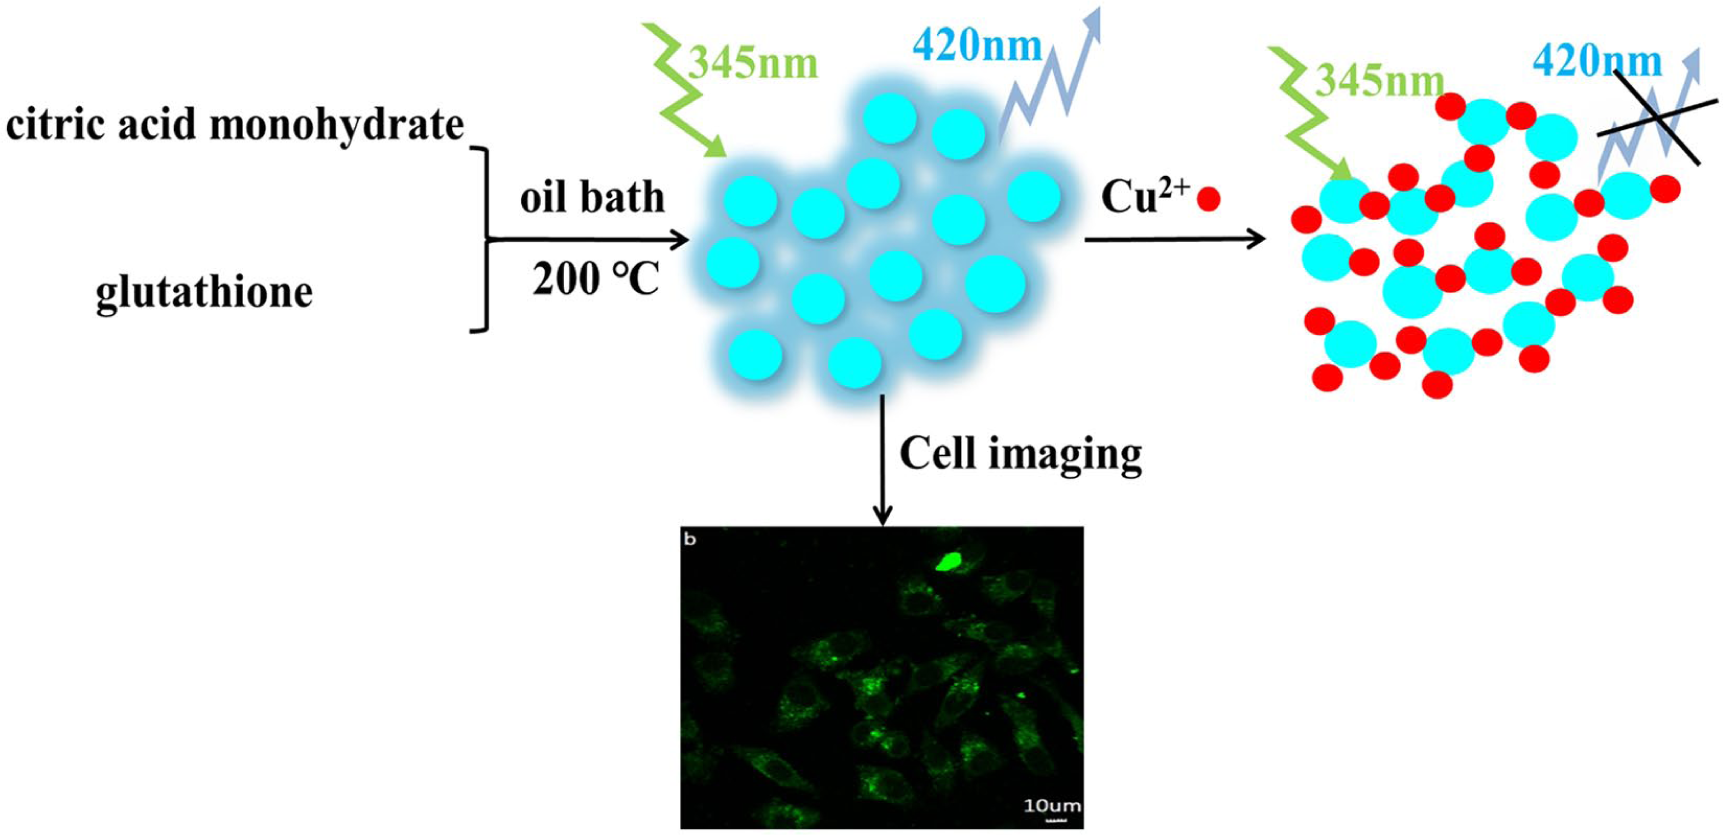
Schematic illustration of the fluorescence quenching mechanism of N-CDs by Cu2+ and cell imaging of HepG2.
Determination of samples
In order to investigate the feasibility of N-CDs as a fluorescent probe for practical application, N-CDs were applied to detect Cu2+ in environmental water samples. Table 2 shows that the recoveries of Cu2+ ions in tap water and lake water are within the range of 98.2%–102.0%, which indicates that the method can be applied for the determination of Cu2+ in environmental water samples.
Analytical results of copper ion recovery in water samples.
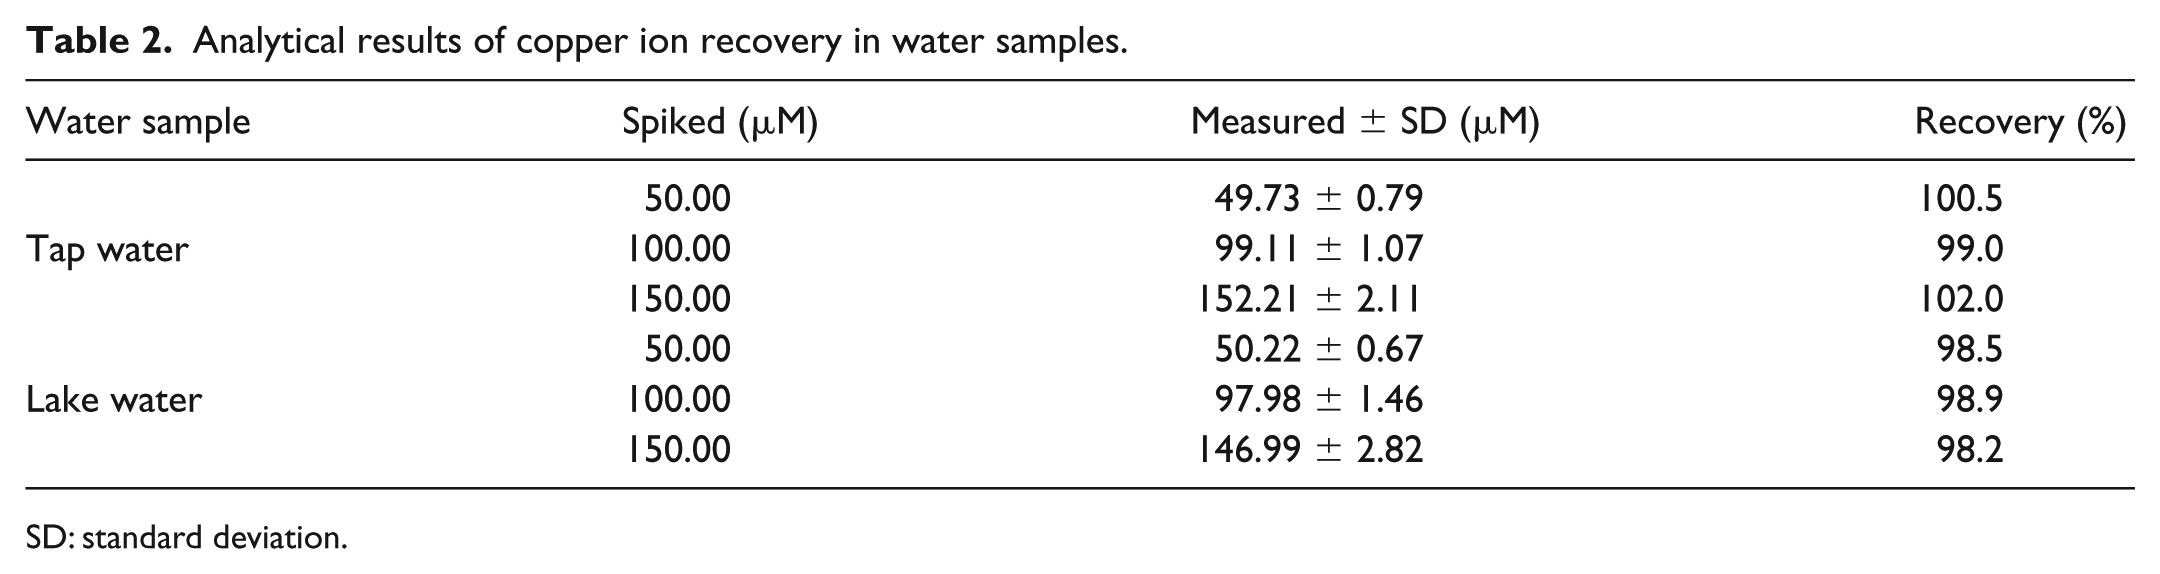
SD: standard deviation.
The toxicity of N-CDs and their bioimaging application
In order to evaluate the cytotoxicity of N-CDs in the application of bioimaging, the viability of HepG2 cells after treatment with different concentrations of N-CDs (0–300 µg mL−1) for 24 h was measured by the MTT (3-(4,5-dimethylthiazol-2-yl)-2,5-diphenyltetrazolium bromide) assay. As shown in Figure 8, when the concentration of N-CDs was up to 300 μg mL−1, the survival rate of the cells was over 80%, indicating that the N-CDs had very low toxicity toward HepG2 cells.

The viability of HepG2 cells after incubation with N-CDs.
The above results indicated that the N-CDs can be applied for cell imaging of HepG2. Figure 9 shows the confocal fluorescent images of HepG2 cells incubated with 200 µg mL−1 N-CDs for 2 h at an excitation wavelength of 488 nm. It can be seen that the HepG2 cells incubated with N-CDs exhibited bright green fluorescence indicating that the N-CDs were successfully internalized into the HepG2 cells.

Laser scanning confocal microscopy images of HepG2 cells incubated without or with N-CDs (200 g /mL) under 488 nm excitation.
Conclusion
In this paper, N-CDs were synthesized successfully by a one-step and green method using citric acid monohydrate and glutathione as raw materials. The prepared N-CDs were characterized by multiple analytical techniques, including TEM, FTIR, UV-Vis, XPS, XRD, and fluorescence spectra. The fluorescence intensity of the N-CDs is quenched by Cu2+ ions, and a sensitive and green fluorescent probe for the quantitative determination of Cu2+ ions has been established. The N-CDs showing a response to Cu2+ ions had a good linearity in the concentration range 0.20–200 μM, with an LOD of 0.27 nM. Meanwhile, the fluorescence intensity of N-CDs was not or only weakly affected by other metal ions. N-CDs as a probe have been successfully applied for the determination of Cu2+ in actual water samples. The main quenching mechanism between N-CDs and Cu2+ ions involves a static quenching process. Finally, the synthesized N-CDs were less toxic to HepG2 cells. Furthermore, the N-CDs were applied for fluorescent cellular imaging of HepG2 as a non-toxic probe. N-CDs will be further explored to apply other analytes based on their excellent characteristics of biocompatibility and low toxicity.
Experimental
Reagents
Citric acid monohydrate (C6H8O7·H2O, 99%) and glutathione (98%) were purchased from Aladdin Chemical (Shanghai, China); NaOH, NaH2PO4·2H2O, Na2HPO4·2H2O, and Na3PO4·12H2O were purchased from Tianjin Beichen Chemical Reagent factory (Tianjin, China); anhydrous ethanol was obtained from Tianjin Chemical Reagent Factory (Tianjin, China); penicillin–streptomycin, DMEM medium, and 4% paraformaldehyde were obtained from Solarbio Science & Technology Co. (Beijing, China). Trypsin-ethylenediaminetetraacetic acid (EDTA) solution (0.25%) was obtained from Life Technologies (CA, USA), and MTT was purchased from Nanjing Infogate Biochemical Technology Co. (Nanjing, China). Other chemical reagents were analytical grade, and deionized water was used.
Apparatus
TEM images of N-CDs were recorded on a JEOL JEM-1011 transmission electron microscope (Tokyo, Japan); UV-Vis absorption spectra of N-CDs were measured on a TU-1901 dual-beam UV-Vis spectrophotometer (Beijing, China). FTIR spectra were obtained using a Perkin-Elmer Paragon 1000 FTIR spectrometer (Waltham, MA, USA). The fluorescence spectra of N-CDs were recorded on a Hitachi F4500 spectrofluorometer (Tokyo, Japan). The pH values were measured using pHS-3C pH meter (Shanghai Rex Instrument Factory, Shanghai, China). XPS was obtained using an AXIS Ultra DLD X-ray photoelectron spectrometer (Kratos, Tokyo, Japan); molecular fluorescence imaging instrument (MFI-10).
Preparation of N-CDs
Citric acid monohydrate (0.1030 g) and glutathione (0.1530 g) were dissolved in doubly distilled water (2 mL) in a flask and mixed well by ultrasonic agitation. The mixture was evaporated in a water bath at 70 °C over 12 h until dry. The resulting thick syrup was heated in an oil bath at 200 °C for 10 min. The product was again heated in an oil bath at 200 °C for 10 min to give a brown syrup. This was immediately dissolved in doubly distilled water (2 mL). After cooling to room temperature, the solution was centrifuged at 15,000 rpm for 15 min to remove the non-fluorescent deposit. The supernatant was neutralized with 1 moL L−1 NaOH and then filtered through a 0.22-μM microporous filter membrane to remove the larger product. Finally, the filtrate was collected by dialysis against deionized water through a dialysis membrane (1000 MWCO) for 24 h. The obtained N-CDs were stored in the dark at 4 °C. 44
Detection of copper ions
A certain amount of N-CDs solution were diluted to 2.0 mL with phosphate buffer solutions (pH 7.0, 10 mM), and different concentrations of copper ion stock solutions were added to the above solution. After thorough mixing at room temperature for 2 min, the fluorescence was recorded. The parameters of the fluorescence spectrometer were set as follows: the excitation wavelength was 345 nm, the scanning wavelength range was 380–540 nm, the excitation and emission slit widths were set as 5 nm, the scanning voltage was 700 V, and the scanning speed was 1200 nm min−1.
Cell culture
HepG2 cells were cultured in DMEM medium with 10% (v/v) fetal bovine serum and 1% (v/v) penicillin–streptomycin at 37 °C in a 95% air and 5% CO2 incubator.
Cell viability assay
The cell viability of N-CDs was determined by the MTT assay. HepG2 cells were seeded at a density of 5 × 10³ cells per well in 96-well plates for 24 h and then incubated with N-CDs with different concentrations of N-CDs from 0 to 300 µg mL−1. After 24 h, 100 μL of MTT solution was added to each well and incubated for 4 h. The culture media containing MTT were discarded and 150 µL of DMSO (dimethyl sulfoxide) was added to each well. The absorbance value of each well was noted by a microplate reader at 570 nm, and the cell activity was analyzed according to the following equation

Cell imaging
The HepG2 cells were incubated with N-CDs (200 µg mL−1) for 2 h. Confocal fluorescence images of HepG2 cells were taken by a laser scanning confocal microscope at an excitation wavelength of 488 nm.
Supplemental Material
Supplementary_Material – Supplemental material for Nitrogen-doped carbon dots as a probe for the detection of Cu2+ and its cellular imaging
Supplemental material, Supplementary_Material for Nitrogen-doped carbon dots as a probe for the detection of Cu2+ and its cellular imaging by Ning Wang, Xuebing Li, Xuefang Yang, Zenglian Tian, Wei Bian and Weihua Jia in Journal of Chemical Research
Footnotes
Declaration of conflicting interests
The author(s) declared no potential conflicts of interest with respect to the research, authorship, and/or publication of this article.
Funding
The author(s) disclosed receipt of the following financial support for the research, authorship, and/or publication of this article: This work was supported by the Natural Science Foundation of Shanxi Province of China (201601D011018), the PhD Start-up Foundation of Shanxi Medical University (03201514), and the Shanxi Medical University of Science and Technology Innovation Fund (01201312).
Supplemental material
Supplemental material for this article is available online.
References
Supplementary Material
Please find the following supplemental material available below.
For Open Access articles published under a Creative Commons License, all supplemental material carries the same license as the article it is associated with.
For non-Open Access articles published, all supplemental material carries a non-exclusive license, and permission requests for re-use of supplemental material or any part of supplemental material shall be sent directly to the copyright owner as specified in the copyright notice associated with the article.