
Abstract
Chalcopyrite is the most abundant, but also one of the most refractory, copper sources. One way to enhance chalcopyrite’s electrochemical dissolution is by mixing it with pyrite. To understand how and to what extent pyrite affects chalcopyrite’s electrochemical dissolution at different potentials, the electrochemical behaviors of chalcopyrite, pyrite, and chalcopyrite–pyrite couples in pH 1.8 H2SO4 were studied by potentiodynamic and electrochemical impedance spectroscopy. Potentiodynamic curves showed their different electrochemical reaction states and electrode surface characteristics. From open-circuit potential to 470 mV (vs saturated calomel electrode), chalcopyrite–pyrite was passivated with Cu1−xFe1−yS2

Introduction
Chalcopyrite is the most abundant, but also one of the most refractory, copper sources. The leaching kinetics of chalcopyrite are slow and have remained a challenge to date. 1 The mechanisms involved in chalcopyrite dissolution have intrigued researchers, and extensive studies have been done over the past several decades, in which electrochemical studies were commonly used to study the evolution of chalcopyrite surface species because of its high sensitivity.2,3 Present studies showed various species such as impermeable sulfur, 4 insoluble iron salts, 5 metal-deficient sulfide, 6 copper-rich polysulfide layers CuS x , 7 and nonstoichiometric sulfide Cun−1Fen−1S2n may form during chalcopyrite dissolution. 8 The results of previous studies also showed that different layers with different chemical compositions could occur at different potentials. Warren et al. 9 investigated the electrochemical characterization of CuFeS2 from various locations in 1 M H2SO4. They found that a passive region occurred in the potential range 0.6–0.9 V (vs standard hydrogen electrode (SHE)). They claimed that in the passive region, chalcopyrite reacted initially to form an intermediate defect structure, Cu1−xFe1−yS2−z, termed S1
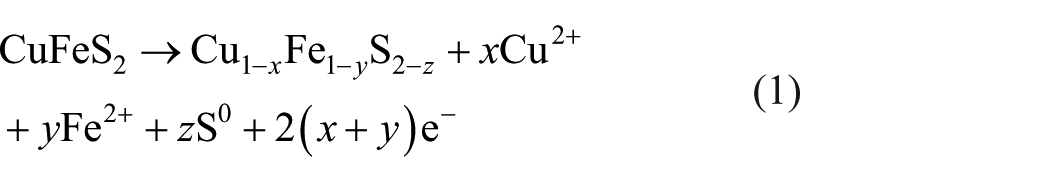
The intermediate S1 decomposed further to form a second intermediate, CuS(n−s), termed S2

They proposed S1 and S2 were bornite (Cu5FeS4) and covellite (CuS), respectively. Besides that, Nava and Gonźalez studied carbon paste electrodes with chalcopyrite in 1.7 M H2SO4. They found the initial dissolution occurred at 0.615 V ⩽ Eanod < 1.015 V versus SHE, forming a nonstoichiometric polysulfide (Cu1−rFe1−sS2−t) by the reaction

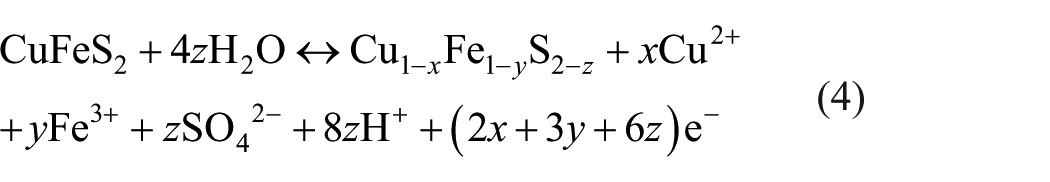
At 1.015 V ⩽ Eanod < 1.085 V versus SHE, the passive product decomposed to form porous layers of nonstoichiometric polysulfide (Cu1−xFe1−yS2−z) that allowed diffusional transport of charged species and the dissolution of the mineral
At 1.085 V ⩽ Eanod < 1.165 V versus SHE, covellite (CuS) formation was identified by the following reaction

And at E > 1.165 V versus SHE, CuS was unstable and gave rise to the complete dissolution of the chalcopyrite 10

In the most recent research, Ghahremaninezhad et al.
11
investigated a massive chalcopyrite electrode’s electrochemical behavior in 0.5 M sulfuric acid solution. They prompted a thin layer of Cu1−xFe1−yS2

At higher potentials of 100−300 mV (vs MSE), the previously formed surface layer partially dissolved and a second passive layer (Cu1−x−zS2) formed

At last, by increasing the potential to 500 mV (vs MSE), another pseudo-passive CuS was believed to form according to reaction (5).
In nature, chalcopyrite and pyrite always coexist, and the presence of pyrite usually affects the chalcopyrite’s geochemical process, hydrometallurgy, and the galvanic effects, 12 even to the passivated chalcopyrite. 13 However, how and to what extent pyrite affects the electrochemical dissolution of chalcopyrite at different potentials is still not clear. In the paper, the effect of pyrite on chalcopyrite’s electrochemical behavior at different potentials in sulfuric acid was investigated by potentiodynamic polarization and electrochemical impedance spectroscopy (EIS) methods, with an attempt to characterize the surface properties of the chalcopyrite electrode at different anodic potentials and understand the growth sequence of surface layers. Furthermore, we attempt to make clear how and to what extent pyrite affects the chalcopyrite’s electrochemical dissolution.
Results and discussion
Potentiodynamic study
Chalcopyrite and chalcopyrite–pyrite potentiodynamic study
Figure 1(a) and (b) shows the potentiodynamic curves for the chalcopyrite and chalcopyrite–pyrite coupled electrodes at a scan rate of 0.5 mV s−1, respectively. The results show that the potentiodynamic E-I profiles have similar results to the work done by Ghahremaninezhad et al. 11 The chalcopyrite–pyrite showed similar E-I profiles as chalcopyrite, which means that the two initial sample surfaces have similar electrochemical interaction mechanisms, and both E-I profiles showed four different potential ranges. When the potentials were above ~0.325 V, the anodic current density of the chalcopyrite–pyrite was obviously higher than that of the chalcopyrite, which showed the coupled pyrite prompted the electrochemical activity of the chalcopyrite electrode. Meanwhile, in the potential below ~0.325 V, the results were inverted, which can be explained later with the EIS result.

Potentiodynamic curves for (a) chalcopyrite, (b) pyrite–chalcopyrite, and (c) pyrite electrode couple in H2SO4 electrolyte (pH 1.8) at a scan rate of 0.5 mV s−1.
From OCP to 470 mV, there was a passive area, which could be due to the formation of a thin surface layer (Cu1−xFe1−yS2) via reaction (7).7,10
There were trans-passive dissolution and a passive area at 470−580 mV, where the previous surface layer Cu1−xFe1−yS2 transformed into another surface layer Cu1−x−zS2, 7 as shown in reaction (8).
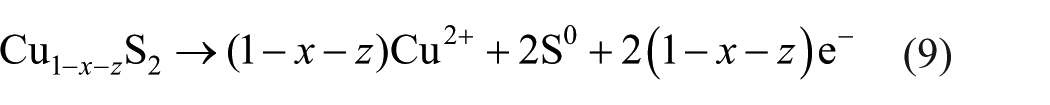
With the anodic potential increasing from 580 to 700 mV, all the surface layer(s) dissolved, the electrodes were in an active area, and the most likely reactions were (9)–(11)7,14,15


When the potential exceeded 700 mV, a further oxidation of chalcopyrite took place, according to Nava and Gonźalez, 10 producing a pseudo-passive film, which was possibly CuS, according to reaction (5).
Pyrite potentiodynamic study
Figure 1(c) shows the potentiodynamic curve for the pyrite electrode at a scan rate of 0.5 mV s−1. The “passive region” as reported by Antonijević et al. 16 could not be distinguished clearly. However, with a closer look at the curve, four different potential ranges similar to those of chalcopyrite could be identified.
From OCP to ~500 mV, it is generally believed that anodic oxidation of pyrite in sulfuric acid solution would produce S0 according to reaction (12)17,18

This reaction indicates there should be a surface layer, but a clear passive region cannot be identified in Figure 1. A possible explanation is that there is only a very narrow potential gap between the passive and trans-passive regions, so, according to Chander et al.,
19
S0 might have transformed into

At a higher anodic potential area, from approximately 500–600 mV, the passive layer was oxidized. During this trans-passive region, a range of thio-complexes formed as intermediates via the following reactions20,21


When the anodic potential exceeded 600 mV, the entire surface layer(s) dissolved via reactions (16) and (17), and the pyrite electrode was in an active potential region (600−850 mV). When the anodic potential was above 850 mV, the curve indicated another anodic reaction,

The overall anodic interaction was

Based on the above discussion, it can be concluded that the anodic potential profoundly affects pyrite and chalcopyrite electrochemical behaviors, inducing the formation and dissolution of electrode surface layer(s).
EIS study
In this work, EIS was used to understand the mechanism of the electrochemical anodic reactions of chalcopyrite and chalcopyrite–pyrite in pH 1.8 sulfuric acid solution at different anodic potentials, which represents the different anodic regions of potentiodynamic E-I curves.
Figures 2 and 3 show the Nyquist and Bode plots for the phase angle of the chalcopyrite and chalcopyrite–pyrite at different anodic potentials, respectively. It is interesting that the shape of the Nyquist and Bode plots of the chalcopyrite and chalcopyrite–pyrite couple is similar at all potentials, indicating they have a similar electrochemical anodic interaction at the same potential. Therefore, the similar electrical equivalent circuit (EEC) could be used to simulate their EIS data at one potential.

Nyquist plots of the chalcopyrite electrode (○; ×) (red) and the chalcopyrite–pyrite electrode (○; ×) (blue) at different anodic potentials, with (○) experimental and (×) simulated results.
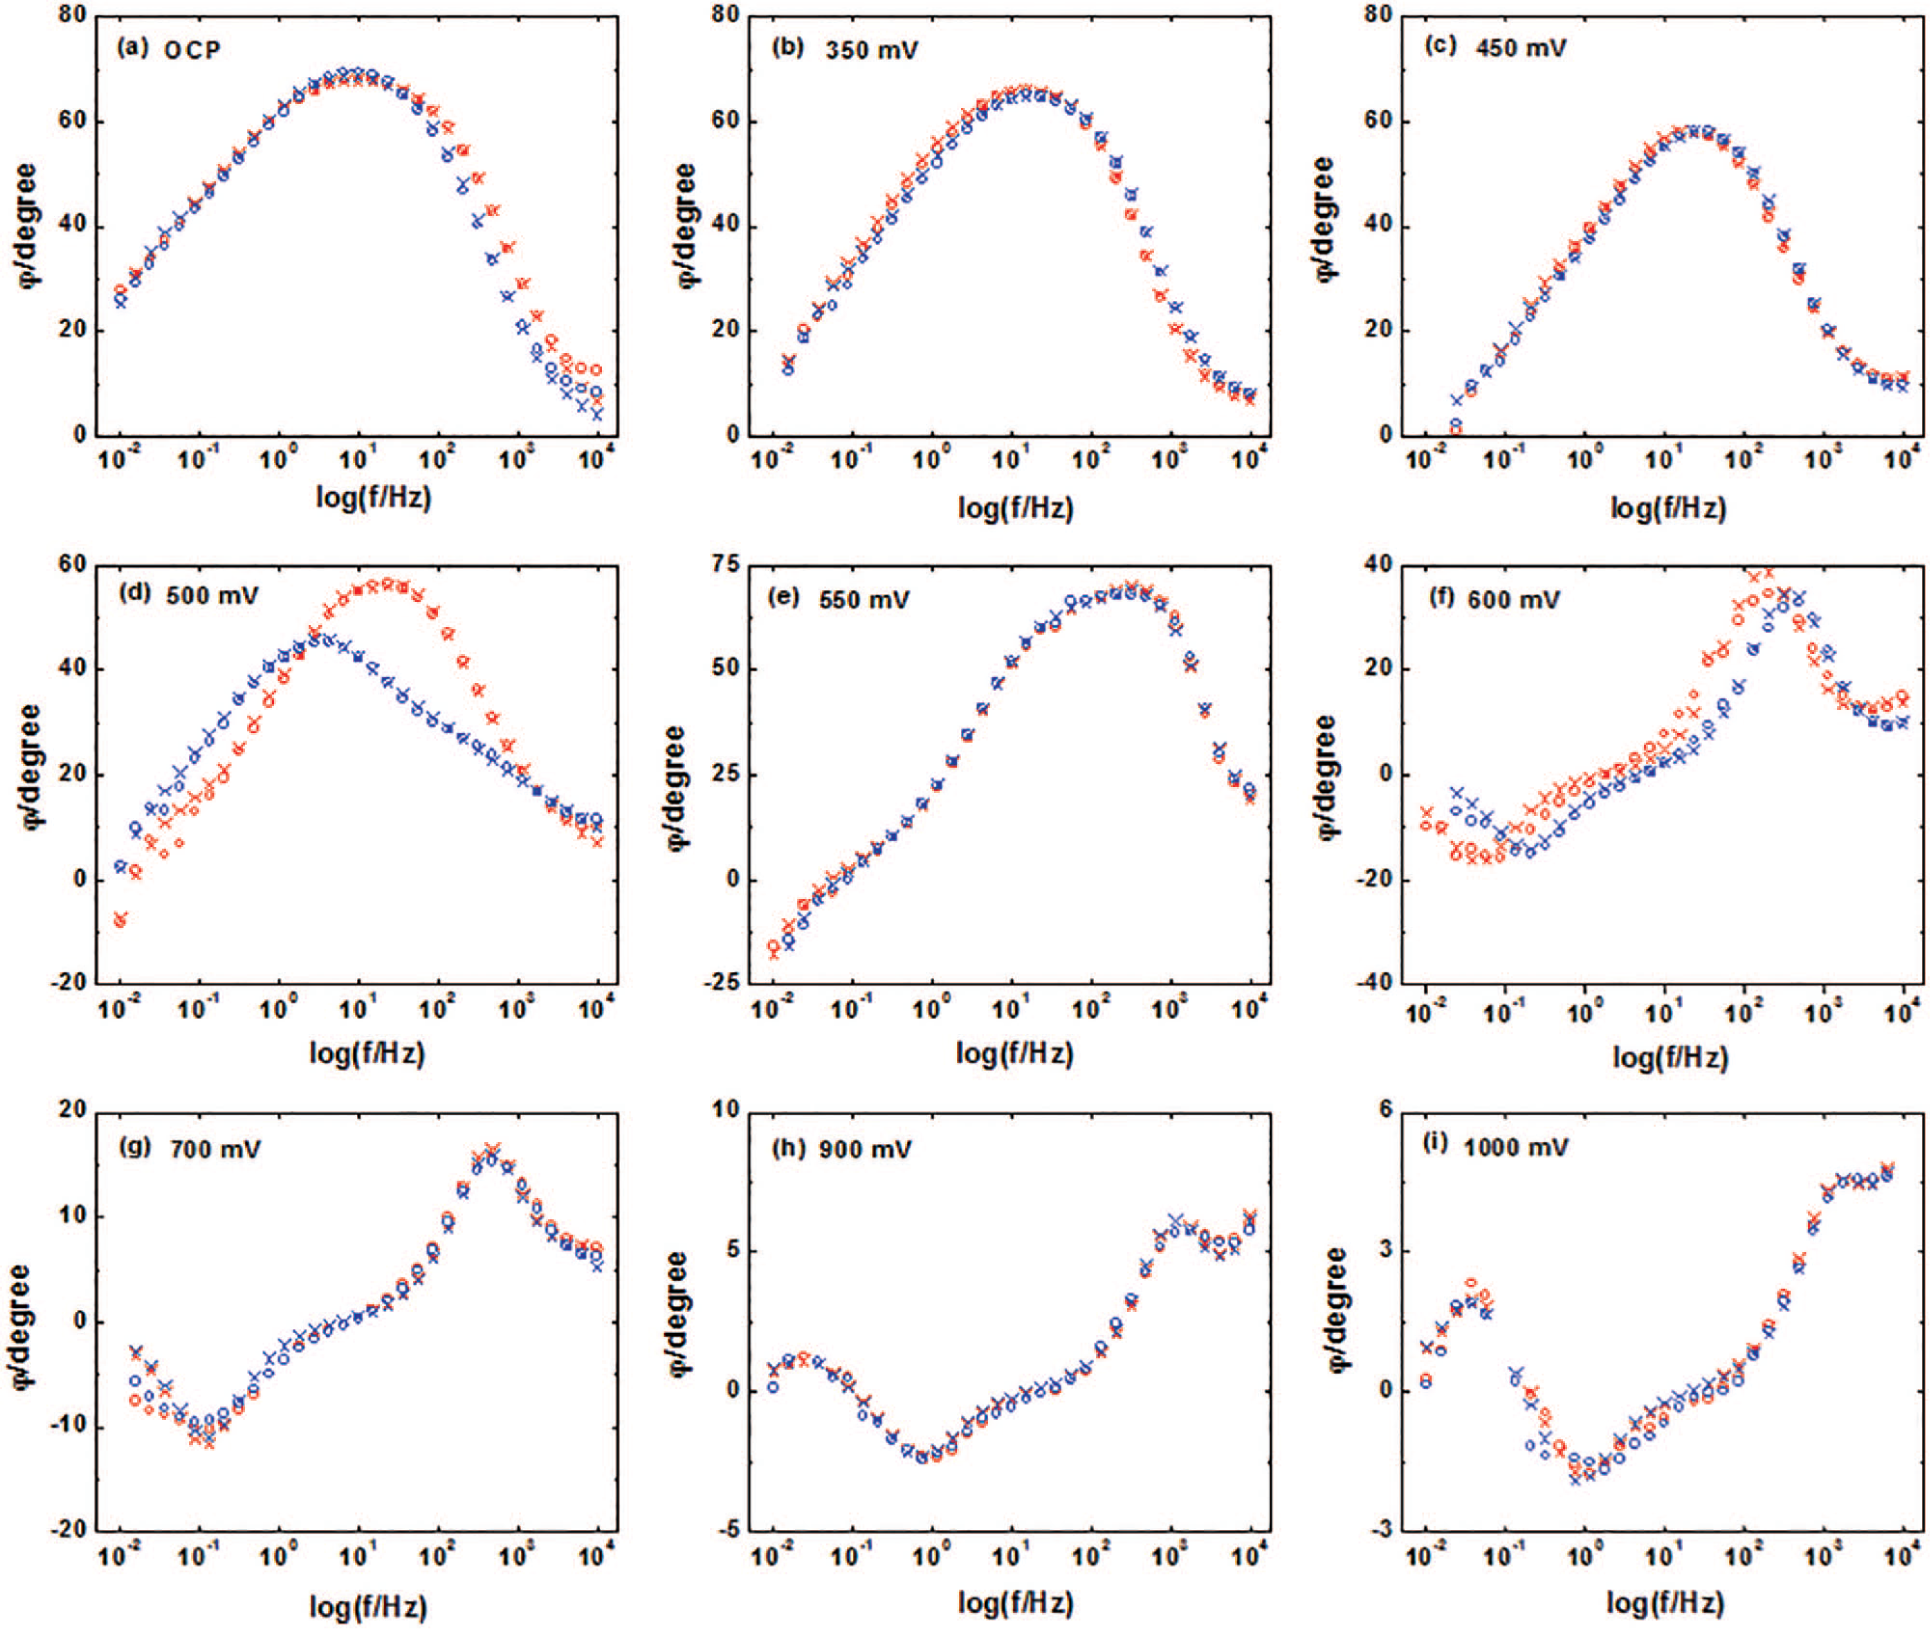
Bode plots of the chalcopyrite electrode (○; ×) (red) and the chalcopyrite–pyrite electrode (○; ×) (blue) at different anodic potentials, with (○) experimental and (×) simulated results.
Low anodic potentials (OCP to 470 mV)
At OCP, Bode plots in Figure 3(a) show a distorted semicircle in the middle frequency range, indicating a passive surface layer formed. Figure 4(a) shows the equivalent circuits employed to fit the experimental data. Rs is the electrolyte and other ohmic resistance to the respective electrochemical circuit; CPE is the constant phase element, which corresponds to the double-layer capacitance; RSC is the charge transfer resistance in the space charge region, and, here, the space charge region is a double-layer region; the Cp/Rp pair represents the capacitive and resistive behavior of the passive film. At OCP, the film is considered to be Cu1−xFe1−yS2.10,11 Here, the impedance of CPE is defined by Macdonald
22
as
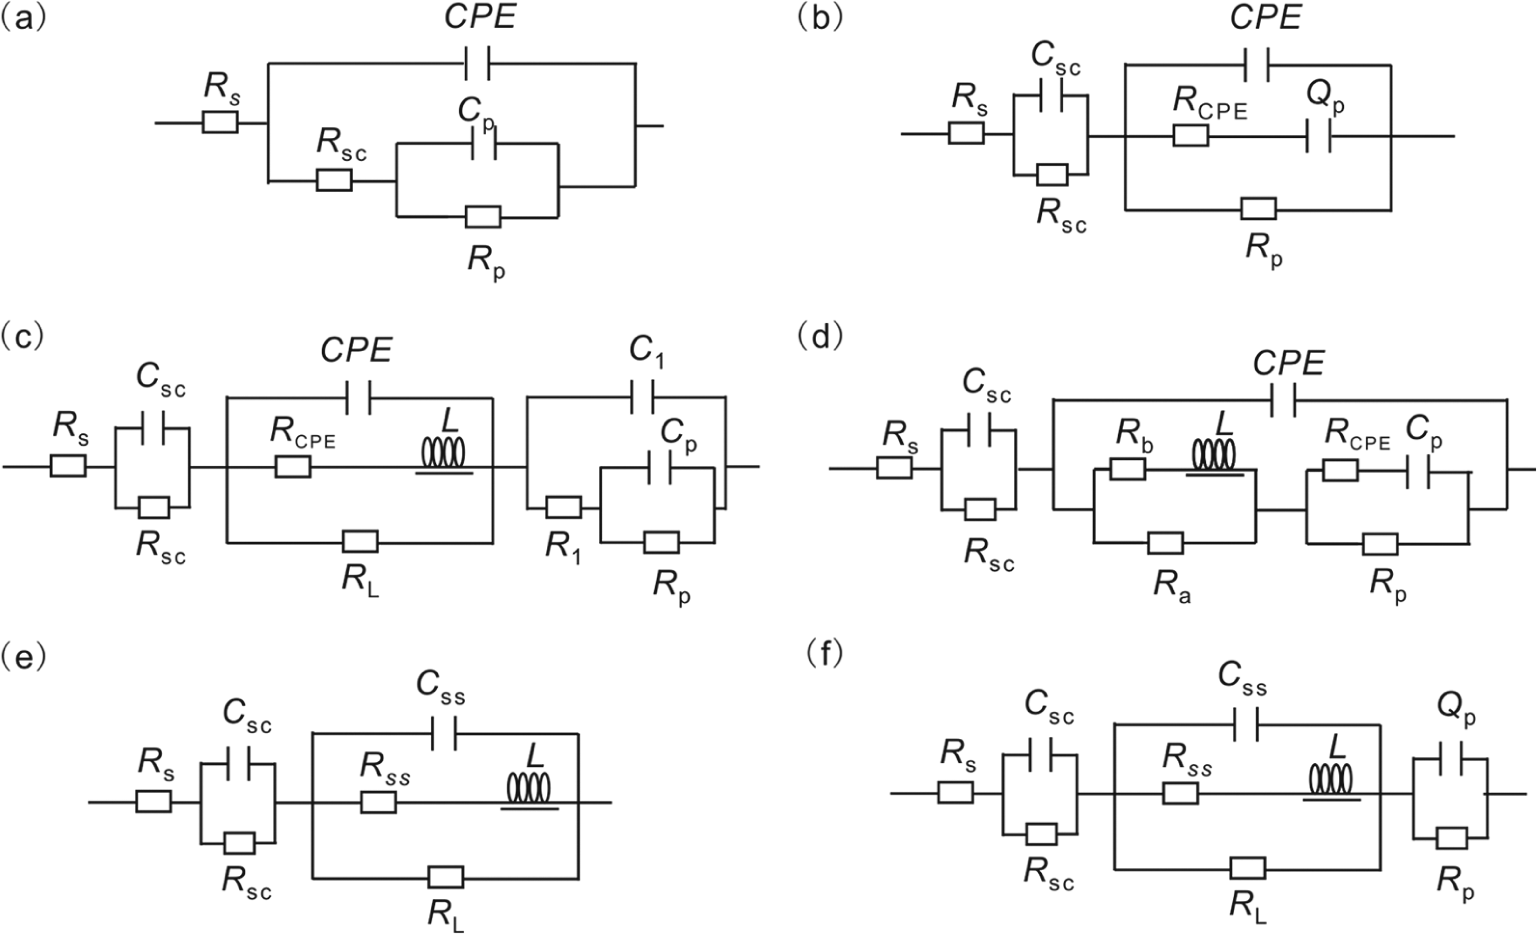
Equivalent circuits for the mineral electrode/electrolyte at different anodic potentials.
Model parameters for the equivalent circuit of Figure 4(a).
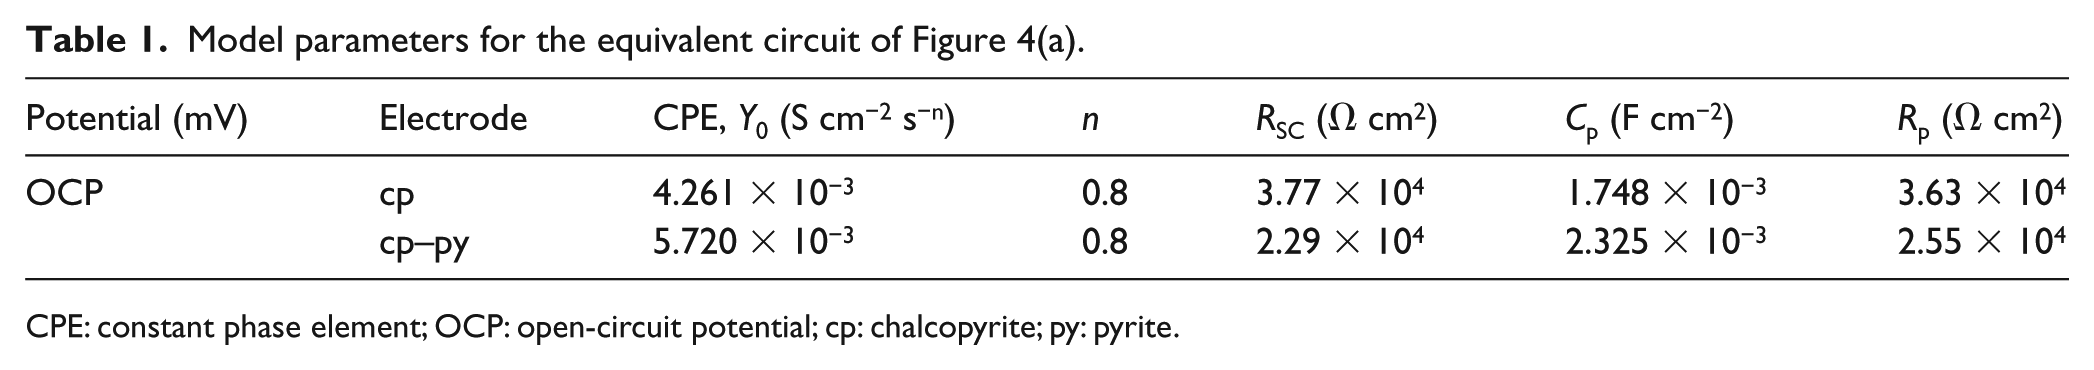
CPE: constant phase element; OCP: open-circuit potential; cp: chalcopyrite; py: pyrite.
Figures 2(b) and (c) and 3(b) and (c) show Nyquist and Bode plots of chalcopyrite and chalcopyrite–pyrite at the anodic potentials 350 and 450 mV, respectively. They are similar to those obtained by Asselin et al. 25 and Ghahremaninezhad et al. 11 Compared to OCP, the higher positive potential was beneficial for charge transfer between the double-layer regions. Figure 4(b) depicts the modeled circuit for the potentials 350/450 mV. In this model, the CSC/RSC pair represents the charge transfer capacitive and resistive behavior in the space charge region, respectively. CPE is the constant phase element, which most probably comes from the electrode’s roughness, and its resistance is RCPE. 26 The Qp/Rp pair represents the capacitive and resistive behaviors of the passive film, and, considering the defects in the passive layer, Qp is substituted for capacitor Cp to give a more accurate fit.27,28 The values of the different elements in the equivalent circuit at 350/450 mV are shown in Table 2.
Model parameters for the equivalent circuit of Figure 4(b).

CPE: constant phase element; cp: chalcopyrite; py: pyrite.
According to the above analysis, at OCP to 470 mV, chalcopyrite was in a passive area, and higher potentials may result in passive film roughness (such as pit corrosion), that is, passivity and dissolution occur side by side in the chalcopyrite and chalcopyrite–pyrite electrodes, and the critical potential may occur at ~0.325 V. That is why chalcopyrite had a slightly higher current density than the chalcopyrite–pyrite couple below ~0.325 V.
Mid-potential region (470–580 mV)
Figures 2(d) and 3(d) present the Nyquist and Bode plots of the chalcopyrite and chalcopyrite–pyrite at 500 mV, respectively. The two figures show the EIS data have spread to the fourth quadrant, indicating inductance occurred, which corresponds with passive layer depletion. This result is consistent with the potentiodynamic curves. At this potential, the electrodes were in the trans-passive dissolution area, and the surface layer would be porous. 29 Figure 4(c) shows the equivalent circuits employed to fit the 500 mV experimental data, where the CSC/RSC pair represents the charge transform capacitive and resistive behavior in the space charge region. L is an equivalent inductance, which represents absorbed ion transfer from the electrode surface due to surface layer depletion, and its resistance is RL. CPE is the constant phase element, which is most probably from the electrode surface faults, and its resistance is RCPE. The C1/R1 pair refers to the passive layer at sections with maximum thickness, and the Cp/Rp pair refers to the passive layer at sections with minimum thickness. The values of the different elements in the equivalent circuit at 500 mV are shown in Table 3. When coupled with a pyrite electrode, the inductance L increased from 5.19 × 10⁶ to 6.0 × 10⁶ H cm−2, and the resistance RL increased from 6.98 × 10⁻⁸ to 7.46 × 10⁻⁸ Ω cm2, which indicates more charges were involved in the relaxation process due to surface layer depletion, resulting in the passive layer resistance Rp decreasing from 2860 to 1129 Ω cm2.
Model parameters for the equivalent circuit of Figure 4(c).
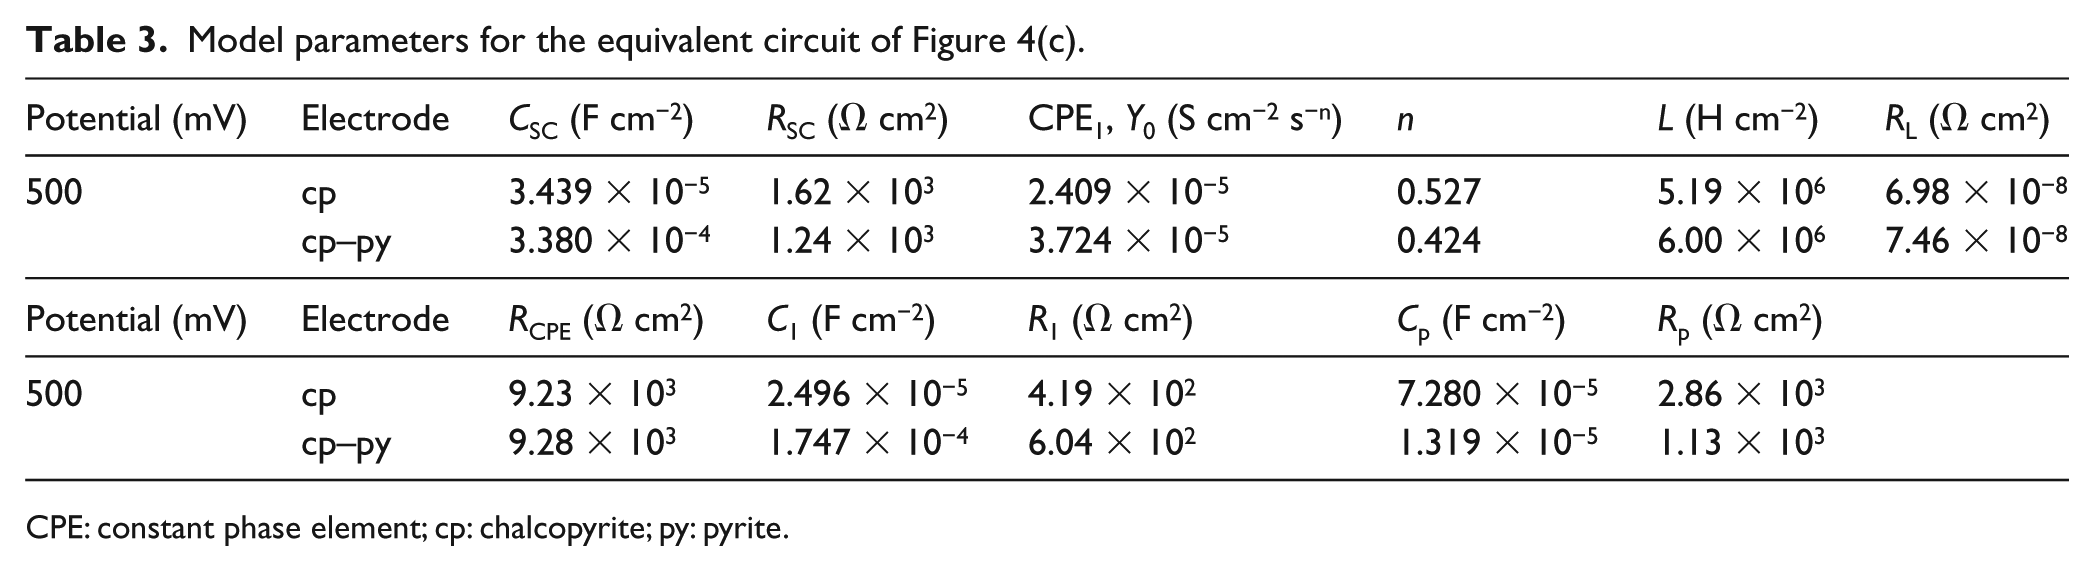
CPE: constant phase element; cp: chalcopyrite; py: pyrite.
With the anodic potential increasing continuously, the surface layer defects increased, and a new surface layer occurred. Figures 2(e) and 3(e) show the Nyquist and Bode plots for the chalcopyrite and chalcopyrite–pyrite at the anodic potential of 550 mV. The reaction (7) and (8) as mentioned above is proposed to describe the electrochemical processes 7
Reaction (7) was fast, and an intermediate disulfide phase, Cu1−xFe1−yS2 (
Model parameters for the equivalent circuit of Figure 4(d).

CPE: constant phase element; cp: chalcopyrite; py: pyrite.
High-potential region (580–700 mV)
In the region of 580−700 mV, active dissolution occurred on the chalcopyrite and chalcopyrite–pyrite electrodes. Figures 2(f) and (g) and 3(f) and (g) show the Nyquist and Bode plots for the chalcopyrite and chalcopyrite–pyrite at the anodic potentials 600 and 700 mV, respectively. The high-frequency impedance loop was the result of charge transfer resistance and double-layer capacitance coupling. The mid-frequency impedance loop and low-frequency inductive impedance loop are characteristic of the anodic dissolution of semiconductor electrodes.30,31 In this potential range, electrochemically active dissolution of the electrode occurred, and none of the passive layers formed at lower potentials were stable. By comparing Figures 2(f) and (g) and 3(f) and (g), we found that increasing the potential from 600 to 700 mV caused a decrease in the total impedance by orders of magnitude. Simultaneously, a decrease of the phase angle at the same potential occurred, revealing the capacitive behavior of the electrode. All these show that an obvious anodic dissolution of the electrode occurred. An equivalent circuit, shown in Figure 4(e), was employed to fit the experimental data, where the CSC/RSC pair represents the charge transform capacitive and resistive behavior in the space charge region, respectively. The CSS||RL||(LRSS) section of the model represents the dissolution of the semiconductor electrodes in which CSS and RSS contribute to the surface (or interface) states on the electrode, RL corresponds to the resistance associated with the accumulation of superficial species, and the element L is an equivalent inductance that indicates the ongoing reaction process. The values of the different elements in the equivalent circuit at 600 and 700 mV are shown in Table 5. At the two potentials, we can see (a) the CSC value of the chalcopyrite–pyrite couple had a dramatic increase from 1.189 × 10⁻⁸ to 1.079 × 10⁻⁶ F cm−2 at 600 mV and from 2.703 × 10⁻⁸ to 4.069 × 10⁻⁶ F cm−2 at 700 mV, whereas the RSC value decreased from 17.228 and 8.402 to 15.336 and 6.836 Ω cm2, respectively. (b) The chalcopyrite–pyrite couple had a higher capacitance CSS and a lower resistance RSS, which indicates the coupled pyrite accelerated electrode surface dissolution. (c) The chalcopyrite–pyrite couple’s RL decreased from 170.4 to 130.16 Ω cm2 at 600 mV and from 40.74 to 37.46 Ω cm2 at 700 mV, accompanied with an equivalent L value drop from 19,675 to 9255 H cm−2 and from 1470 to 1305.5 H cm−2, respectively. A lower accumulation resistance value RL and lower transfer inductance L indicate it was difficult for chemicals to accumulate on the superficial film, and they could easily cross the double layer, which reveals that the coupled pyrite improved the chalcopyrite electrode electrochemical dissolution. (d) At this active potential range, for both the chalcopyrite and chalcopyrite–pyrite electrode couple, a higher positive potential resulted in lower values of RL, L, and RSS, which confirmed that a higher positive potential was beneficial for the chemicals to cross the double layer.
Model parameters for the equivalent circuit of Figure 4(e).
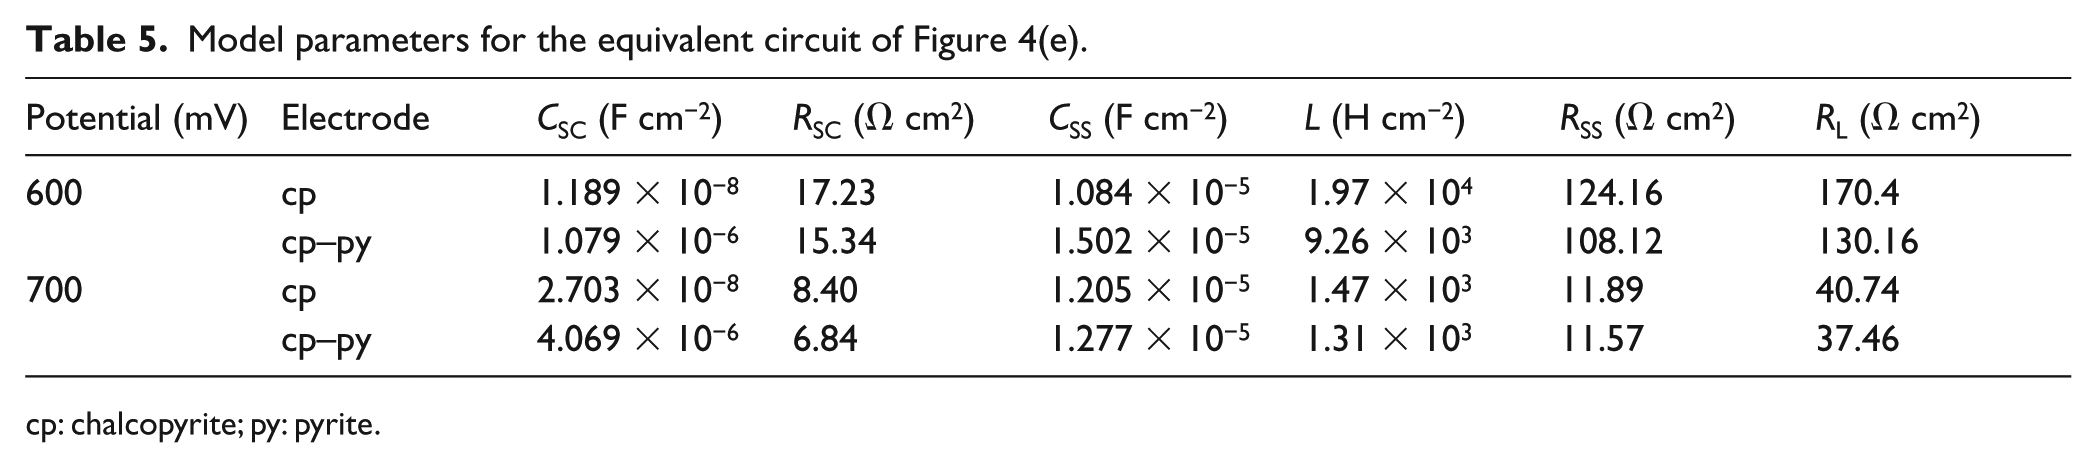
cp: chalcopyrite; py: pyrite.
Higher potential (700–1000 mV)
When the anodic potential was above 700 mV, according to the potentiodynamic curve results, the chalcopyrite surface changed from active to pseudo-passive. Figures 2(h) and (i) and 3(h) and (i) show the Nyquist and Bode plots for the chalcopyrite and chalcopyrite–pyrite at the anodic potentials 900 and 1000 mV, respectively. Comparing the two Nyquist plots with those at 700 and 800 mV, we found an additional small capacitive loop in the low-frequency region. Figure 4(f) shows the model applied for the 900 and 1000 mV Nyquist plots. In this model, the circuit components Qp and Rp represent the formation and associated properties of the surface layer on the electrode, and the physical explanation of the other circuit components is similar to those in Figure 4(e). The values of the different elements in the equivalent circuit at 900 and 1000 mV are shown in Table 6. They clearly show the following results: (a) CSC of the chalcopyrite–pyrite couple was considerably bigger than that of the chalcopyrite electrode. (b) The passive resistance Rp of chalcopyrite–pyrite ranged from 2.298 to 13.334 Ω cm2, with the small Rp well matched to the pseudo-passive character. Furthermore, the chalcopyrite–pyrite electrode had a smaller passive resistance Rp and bigger capacitance CPE Y0. The results revealed that the chalcopyrite electrode surface layer had a poor passivation capability when coupled with pyrite. (c) In contrast to the results of 900 and 1000 mV, with increasing potential, the passive layer resistance also increased. Interestingly, at 900 mV, the passive film Qp dimensionless number n was 1. An ideal capacitance can explain the distribution of interfacial capacitance, whereas with a potential increasing to 1.0 V, the dimensionless number n changed to less than 1. All these results indicate that increasing the atomic layers involved in the electrochemical interaction caused a growing surface layer, and the layer may have become more porous. (d) Contrary to active dissolution, RL and L of the chalcopyrite–pyrite electrode increased, which showed the species could accumulate on the film surface, whereas the reaction became moderately more difficult, namely a pseudo-passivation occurred. The passive layer attracted species to accumulate on its surface, just like a capacitor. The chalcopyrite–pyrite electrode had a smaller value of passive resistance Rp and a bigger capacitance CPE Y0, which were favorable for species accumulating on its surface, which explained the increased RL and L of the chalcopyrite–pyrite electrode.
Model parameters for the equivalent circuit of Figure 4(f).

CPE: constant phase element; cp: chalcopyrite; py: pyrite.
The CSC/RSC represents the charge transform capacitance and resistance in the space charge region and reflects how easily the ions can diffuse through the electric double layers. As a result, the CSC/RSC pair can be used to represent the mineral electrochemical anodic dissolution. In addition, the Cp/Rp pair represents the capacitive and resistive behavior of the passive layer, and their values reveal to what extent they can inhibit mineral dissolution. Hence, it is critical to compare and analyze these parameters to understand the chalcopyrite and chalcopyrite–pyrite electrochemical anodic dissolution.
The effect of pyrite
At each anodic potential, the chalcopyrite–pyrite couple had a smaller charge transfer resistance RSC and a bigger charge transfer capacitance CSC. A general conclusion that can be drawn from these results is that the coupled chalcopyrite had better charge transfer in the space charge region, thus further enhancing the chalcopyrite electrochemical dissolution. By a further comparison of RSC, we can see (a) with the anodic potential increasing, RSC decreased, which revealed positive potential was beneficial for charge transfer and (b) when the anodic potential changed from 500 to 550 mV, the RSC values decreased dramatically, from 1619.4 to 62.18 Ω cm2 for chalcopyrite and from 1243.2 to 42.72 Ω cm2 for the chalcopyrite–pyrite couple. When the potential increased from 700 to 900 mV, the RSC values increased slightly. All these data correspond well with previous potentiodynamic curves results, indicating the electrode surface was trans-passive at 470−550 mV. Moreover, at 600 mV, the RSC values continued to decrease from 62.18 to 17.228 Ω cm2 for chalcopyrite and 42.72 to 15.336 Ω cm2 for the chalcopyrite–pyrite couple. This result means when the potential increased from 550 to 600 mV, the passive surface dissolved. However, when the potential changed from 700 to 900 mV, the electrode surface changed from active to pseudo-passive, which restrained the charge transfer and caused the RSC values to increase.
Similar to the CSC/RSC, in most cases, the chalcopyrite–pyrite couple had a smaller Rp but a bigger Cp. These results confirmed that the coupled pyrite could prompt dissolution of the passive layer. More specifically, from OCP to 500 mV, Rp of the Cu1−xFe1−yS2 layer on chalcopyrite and the chalcopyrite–pyrite couple decreased from 36,340 and 25,500 Ω cm2 to 2860 and 1129 Ω cm2, respectively, indicating a depletion of the passivation layer. The chalcopyrite surface changed from passive into trans-passive. When the potential changed from 500 to 550 mV, the Rp values decreased dramatically to 16.59 and 16.86 Ω cm2, respectively. These characteristics are well in accordance with the trans-passive character. In addition, compared with other potentials, the Rp values at 900 and 1000 mV were very small. Undoubtedly, these characteristics well matched the pseudo-passive character. At this region, the CuS passive layer resistance increased from 2.346 and 2.298 Ω cm2 to 13.334 and 6.676 Ω cm2, respectively. The higher positive potential prompted more atomic layers to be involved in the electrochemical interaction, which caused an increasingly passive layer. Conversely, passive layer depletion was easier in the higher potential region. Interestingly, at 450 and 550 mV, the Rp value of the chalcopyrite–pyrite couple electrode was slightly bigger than that of chalcopyrite. This was possibly due to a thicker surface layer, which was quite passive, forming on the bulk chalcopyrite in a faster reaction when the pyrite was coupled.
Conclusion
Electrochemical studies revealed that, for chalcopyrite and chalcopyrite–pyrite, a thin surface layer Cu1−xFe1−yS2
Potentiodynamic and EIS results showed the chalcopyrite and chalcopyrite–pyrite couple had similar E-I profiles, as well as similar Nyquist and Bode plots, confirming they had a similar electrochemical interaction mechanism. However, smaller charge transfer resistances and passive resistance revealed why chalcopyrite dissolution was enhanced when coupled with pyrite.
Experiment section
Mineral preparation
Chalcopyrite and pyrite were obtained from Mt Lyell, Australia, and North Dakota, USA, respectively. The concentrates had less than 4% impurities, confirmed by powder X-ray diffraction and chemical analysis. 32 Pyrite and chalcopyrite electrodes were prepared by cutting the natural pyrite and chalcopyrite samples into cubes with working areas of 0.2 cm2 and, as much as possible, with no visible imperfections.
The specimens were placed into an epoxy resin and were connected to a copper wire by silver paint on the back face, leaving only one top face of the electrode exposed to the solution. Before each test, the exposed face of the electrode was polished, and a fresh surface was used. MilliQ-treated water was used for sample preparation.
Electrochemical measurements
Electrochemical measurements were performed using a computer-controlled electrochemical measurement system PARSTAT 2273 (Princeton Applied Research) on a conventional three-electrode electrolytic cell with platinum (or pyrite when the mixed pyrite’s effect was investigated) as an auxiliary electrode (AE). Before the electrochemical measurements, the chalcopyrite–Pt electrode couple or the chalcopyrite–pyrite couple was first dipped into the electrolyte for 400 s as a short-circuited model galvanic cell. The working electrode (WE) was the chalcopyrite. A saturated calomel electrode (SCE) was used as a reference electrode for all the electrochemical tests, and all further potentials quoted in this study are with respect to SCE (0.242 V vs SHE) if not otherwise mentioned. The reference electrode was connected to a Luggin capillary to minimize the ohmic voltage drop. The AE and WE were located in separate compartments, joined by an anion exchange membrane. The working, auxiliary, and reference electrodes were each situated in the same way to ensure the same spatial relation in each experiment. The WE compartment contained pH 1.8 H2SO4, while the AE compartment contained 3 g L−1 Fe3+, using H2SO4 to achieve pH 1.8.
Prior to each test, the mineral electrodes were polished with no. 1200 carbide paper to get fresh surfaces and then degreased with alcohol, rinsed with deionized water, and finally, dried in a stream of N2. The electrode potential was allowed to stabilize for 400 s before starting the measurements, and, in order to ensure reproducibility, tests were begun only after reaching the same open-circuit potential (OCP) within ±10 mV. For all the electrodes used in the experiments shown, the OCP of pyrite, chalcopyrite, and the chalcopyrite–pyrite couple was 329 ± 10, 237 ± 10, and 268 ± 10 mV, respectively. All the experiments were conducted at 25 ± 1 °C.
Potentiodynamic curves and EIS were utilized for studying pyrite, chalcopyrite, and the chalcopyrite–pyrite couple’s electrochemical anodic dissolution properties. These methods permit the study of electrochemical interactions between the electrode and electrolyte and how these interactions vary with different applied potentials. At first, the OCP of the samples was measured, and, afterward, the potentiodynamic polarization curves were obtained by changing the electrode potential automatically from 150 to 1000 mV at a scan rate of 0.5 mV s−1. EIS tests were conducted at different potentials and in the frequency range of 0.01–10,000 Hz with a peak-to-peak amplitude of 10 mV. In all the EIS tests, the potential was applied via potential step, away from the OCP. ZSimpWin 3.20 (2004) software was used for fitting the impedance data.
Footnotes
Declaration of conflicting interests
The author(s) declared no potential conflicts of interest with respect to the research, authorship, and/or publication of this article.
Funding
The author(s) disclosed receipt of the following financial support for the research, authorship, and/or publication of this article: This work was supported by Australian CSIRO OCE Science Leader Program, China Scholarship Council, NSFC (40803017) and 135 Program of the Institute of Geochemistry, CAS.