
Abstract
Background:
The no-reflow phenomenon refers to the absence of microvascular reperfusion despite macrovascular reperfusion.
Aim:
The aim of this analysis was to summarize the available clinical evidence on no-reflow in patients with acute ischemic stroke.
Methods:
A systematic literature review and a meta-analysis of clinical data on definition, rates, and impact of the no-reflow phenomenon after reperfusion therapy was carried out. A predefined research strategy was formulated according to the Population, Intervention, Comparison, and Outcome (PICO) model and was used to screen for articles in PubMed, MEDLINE, and Embase up to 8 September 2022. Whenever possible, quantitative data were summarized using a random-effects model.
Results:
Thirteen studies with a total of 719 patients were included in the final analysis. Most studies (n = 10/13) used variations of the Thrombolysis in Cerebral Infarction scale to evaluate macrovascular reperfusion, whereas microvascular reperfusion and no-reflow were mostly assessed on perfusion maps (n = 9/13). In one-third of stroke patients with successful macrovascular reperfusion (29%, 95% confidence interval (CI), 21–37%), the no-reflow phenomenon was observed. Pooled analysis showed that no-reflow was consistently associated with reduced rates of functional independence (odds ratio (OR), 0.21, 95% CI, 0.15–0.31).
Conclusion:
The definition of no-reflow varied substantially across studies, but it appears to be a common phenomenon. Some of the no-reflow cases may simply represent remaining vessel occlusions, and it remains unclear whether no-reflow is an epiphenomenon of the infarcted parenchyma or causes infarction. Future studies should focus on standardizing the definition of no-reflow with more consistent definitions of successful macrovascular reperfusion and experimental set-ups that could detect the causality of the observed findings.
Introduction
Advances in endovascular stroke therapy have yielded high macrovascular reperfusion rates, yet > 50% of all treated stroke patients do not achieve functional independence (defined as modified Rankin scale (mRS) score 0–2).1,2 There are many reasons why patients may not regain functional independence despite successful reperfusion (e.g. late treatment, established infarcts).3,4 Still, this discrepancy has also prompted the idea of analyzing tissue or microvascular reperfusion, as successful macrovascular reperfusion does not necessarily entail microvascular reperfusion.5–7 Macrovascular reperfusion (usually assessed on digital subtraction angiography or computed tomography (CT) angiography) without microvascular reperfusion (usually assessed on perfusion imaging) has been named the “no-reflow” phenomenon.5,6 Preclinical studies on no-reflow phenomenon in the brain confirmed its existence 50 years ago.8–10 Despite this evidence, clinical observational studies have reported heterogeneous results.8–13 Recently, a randomized-controlled trial found a clinical benefit of additional administration of intra-arterial alteplase after macrovascular reperfusion. 14 No such benefit was seen in patients with myocardial infarction, 15 suggesting that findings in acute ischemic stroke (AIS) need replication and also pointing toward no-reflow phenomena in the heart and brain potentially being distinct phenomena. Moreover, this preliminary evidence in AIS patients suggest that therapeutic strategies aiming at improving microvascular hypoperfusion may also improve outcomes.
In order to summarize the available information on the definition, prevalence, and impact of the no-reflow phenomenon, we performed a systematic literature review and a meta-analysis of clinical observational data on the no-reflow phenomenon in patients with AIS caused by large vessel occlusion in the anterior circulation undergoing reperfusion therapy.
Methods
The results of this study-level meta-analysis are presented according to the Preferred Reporting Items for Systematic Reviews and Meta-Analyses (PRISMA) and Meta-analyses Of Observational Studies in Epidemiology (MOOSE) guidelines. Ethics approval and patient consent were not required for the present study as it is based exclusively on published or presented manuscripts. All presented data and numeric values were extracted from already published literature.
Search strategy and study selection
A predefined research strategy was formulated according to the Population, Intervention, Comparison, and Outcome (PICO) model, and was used to screen for articles in the PubMed, MEDLINE, and Embase databases (Supplemental Tables S1 and S2). All full-text articles and conference abstracts registered in these databases up to 8 September 2022 were included. Search strategy details are available in the Supplemental materials (Supplemental Methods S1).
Macrovascular reperfusion
For the present analysis, successful macrovascular reperfusion was defined as an antegrade reperfusion of ⩾ 50% of the target downstream territory distal to the occlusion site. 16 However, different reperfusion scales have different definitions of successful macrovascular reperfusion. Thresholds and definitions of successful macrovascular reperfusion across different scales are available in the Supplementary materials (Supplemental Methods S2).
Microvascular reperfusion
To obtain rates of microvascular reperfusion, we first checked how microvascular reperfusion was evaluated and which thresholds were used to discriminate between microvascular hypoperfusion and reperfusion. Microvascular reperfusion status was commonly evaluated with two-dimensional maps of contrast bolus passage along the microvascular network within the brain parenchyma. These maps were calculated from perfusion images obtained on computed tomography (CTP) or magnetic resonance perfusion imaging (MRP). After acquisition, raw perfusion images required post-processing in order to calculate hemodynamic functional parameters related to the blood passage in the tissue based on the indicator dilution theory. 17 These parameters include time to maximum or maximum of the tissue residue function (Tmax), relative cerebral blood flow (rCBF), relative cerebral blood volume (rCBV), or mean transit time (MTT) lesion volume maps. Details on these parameters are available in Supplementary materials (Supplemental Methods S3). After obtaining methods of estimating microvascular reperfusion, we differentiated between the studies that supplied qualitative, quantitative, or both of these measurements. Finally, we checked whether the authors reported additional methodological safeguards when evaluating no-reflow (e.g. use of pre-interventional imaging to exclude prior infarct in the region of interest).
Functional independence
We analyzed how patient outcome was evaluated and at what time intervals these evaluations were performed. Functional independence was almost always reported with an mRS score 0–2, evaluated 3 months after the index event.
Statistical analysis
Primary study outcomes were the evaluation of no-reflow rates and the association between 3-month functional independence (mRS score 0–2) and the no-reflow phenomenon. When odds ratios (OR) were not reported, they were calculated from the number or proportion of patients included in the analysis of the published data. Two independent raters (A.M. and J.K.) extracted all the data needed for statistical analysis. If study data were presented in a format that did not permit easy extraction, they were summarized only in the form of a narrative review and excluded from the meta-analysis. Results are presented for binary outcomes both in total summation and across different subgroups using a random-effects model applying the Mantel–Haenszel method. For these outcomes, I2 was used to quantify heterogeneity between the studies and subgroup differences. I2 provides an extent to which the percentage of variability in results across studies is due to real differences and not due to chance. If I2 was ⩾ 50%, we considered the estimates heterogeneous. Summations of point estimates and their 95% confidence intervals (CI) derived from the random-effects model were used to evaluate the association between no-reflow and functional independence at 3 months. The Cochrane tool was used to assess the risk of bias for non-randomized studies included in systematic reviews or meta-analyses. 18 This tool comprises seven domains each of which is evaluated with a 4-point scale: serious, moderate, low risk of bias, or no information provided. Publication bias for the primary endpoint was assessed visually with funnel plots and quantified with the Luis Furuya-Kanamori (LFK) index where values from –1 to +1 indicate no publication bias. This meta-analysis was performed using the meta v6.0 and metasens v1.5 packages from R v4.0.0. The same packages were used for visualization of the results, except for the figure summarizing the risk of bias, which was generated online with an open-access robvis tool. 19
Results
The database search and citation tracking identified 76 publications, of which 53 were screened as potentially relevant for the present review. Duplicates and manuscripts that did not meet the inclusion criteria were excluded (Supplemental Figure S1). The final analysis included only publications that reported both macro- and microvascular reperfusion rates. This yielded a final total of 11 original article publications and two conference abstracts, with a total number of 719 patients included across all studies. Median age was 70 years (interquartile range (IQR) 65–71), 51.5% were female, and admission National Institutes of Health Stroke Scale (NIHSS) score was 16 (IQR 14–17). In seven studies which reported thrombolysis rates, 286 (45%) patients had received intravenous thrombolysis (IVT) prior to mechanical thrombectomy. Other baseline characteristics are presented in Supplemental Table S3.
Macrovascular and microvascular reperfusion
Thresholds for defining successful macrovascular reperfusion were consistent across the majority of studies (n = 11/13) with reperfusion of > 50% of the initial target downstream territory denoted as successful macrovascular reperfusion. Microvascular reperfusion was evaluated on perfusion maps: six studies used Tmax, two used rCBF and rCBV maps, and one used MTT maps. Two studies used transcranial Doppler (TCD) imaging to determine the microvasculature resistance in the vascular territory supplying the previously infarcted territory. Finally, two studies used other measurements for microvascular reperfusion. Most studies (n = 9/13) included only patients with successful macrovascular reperfusion and six studies reported no-reflow rates stratified by the Thrombolysis in Cerebral Infarction (TICI) score.
The interval between the intervention and follow-up imaging varied considerably across the studies (30 min–30 days after the intervention). When defining Intervention-to-Follow-Up time, authors usually chose the end of the intervention as the starting point, except for one study which chose IVT administration as its starting point. 20 Conversely, the end point was usually chosen arbitrarily, or according to the predefined institutional protocols, which resulted in inconsistent time windows for the observation of microvascular reperfusion across the studies.
Semiquantitative and qualitative analysis
Ten studies used CTP or MRP imaging on the follow-up examination for determining rates of no-reflow, and two studies used TCD imaging for no-reflow evaluation.21,22 Seven studies used both quantitative and qualitative measurements for assessment of no-reflow, while only six reported volumes of tissue that exhibited persistent microvascular hypoperfusion. Most studies had two raters evaluating microvascular reperfusion, and one study used an independent core-lab. 12 Use of admission imaging was mostly restricted to measurement of infarct growth, and almost all studies (n = 10/13) evaluated the presence of no-reflow in areas that had already undergone infarction.
Further reperfusion details and other study characteristics are reported in Table 1.
Studies included in the final analysis.
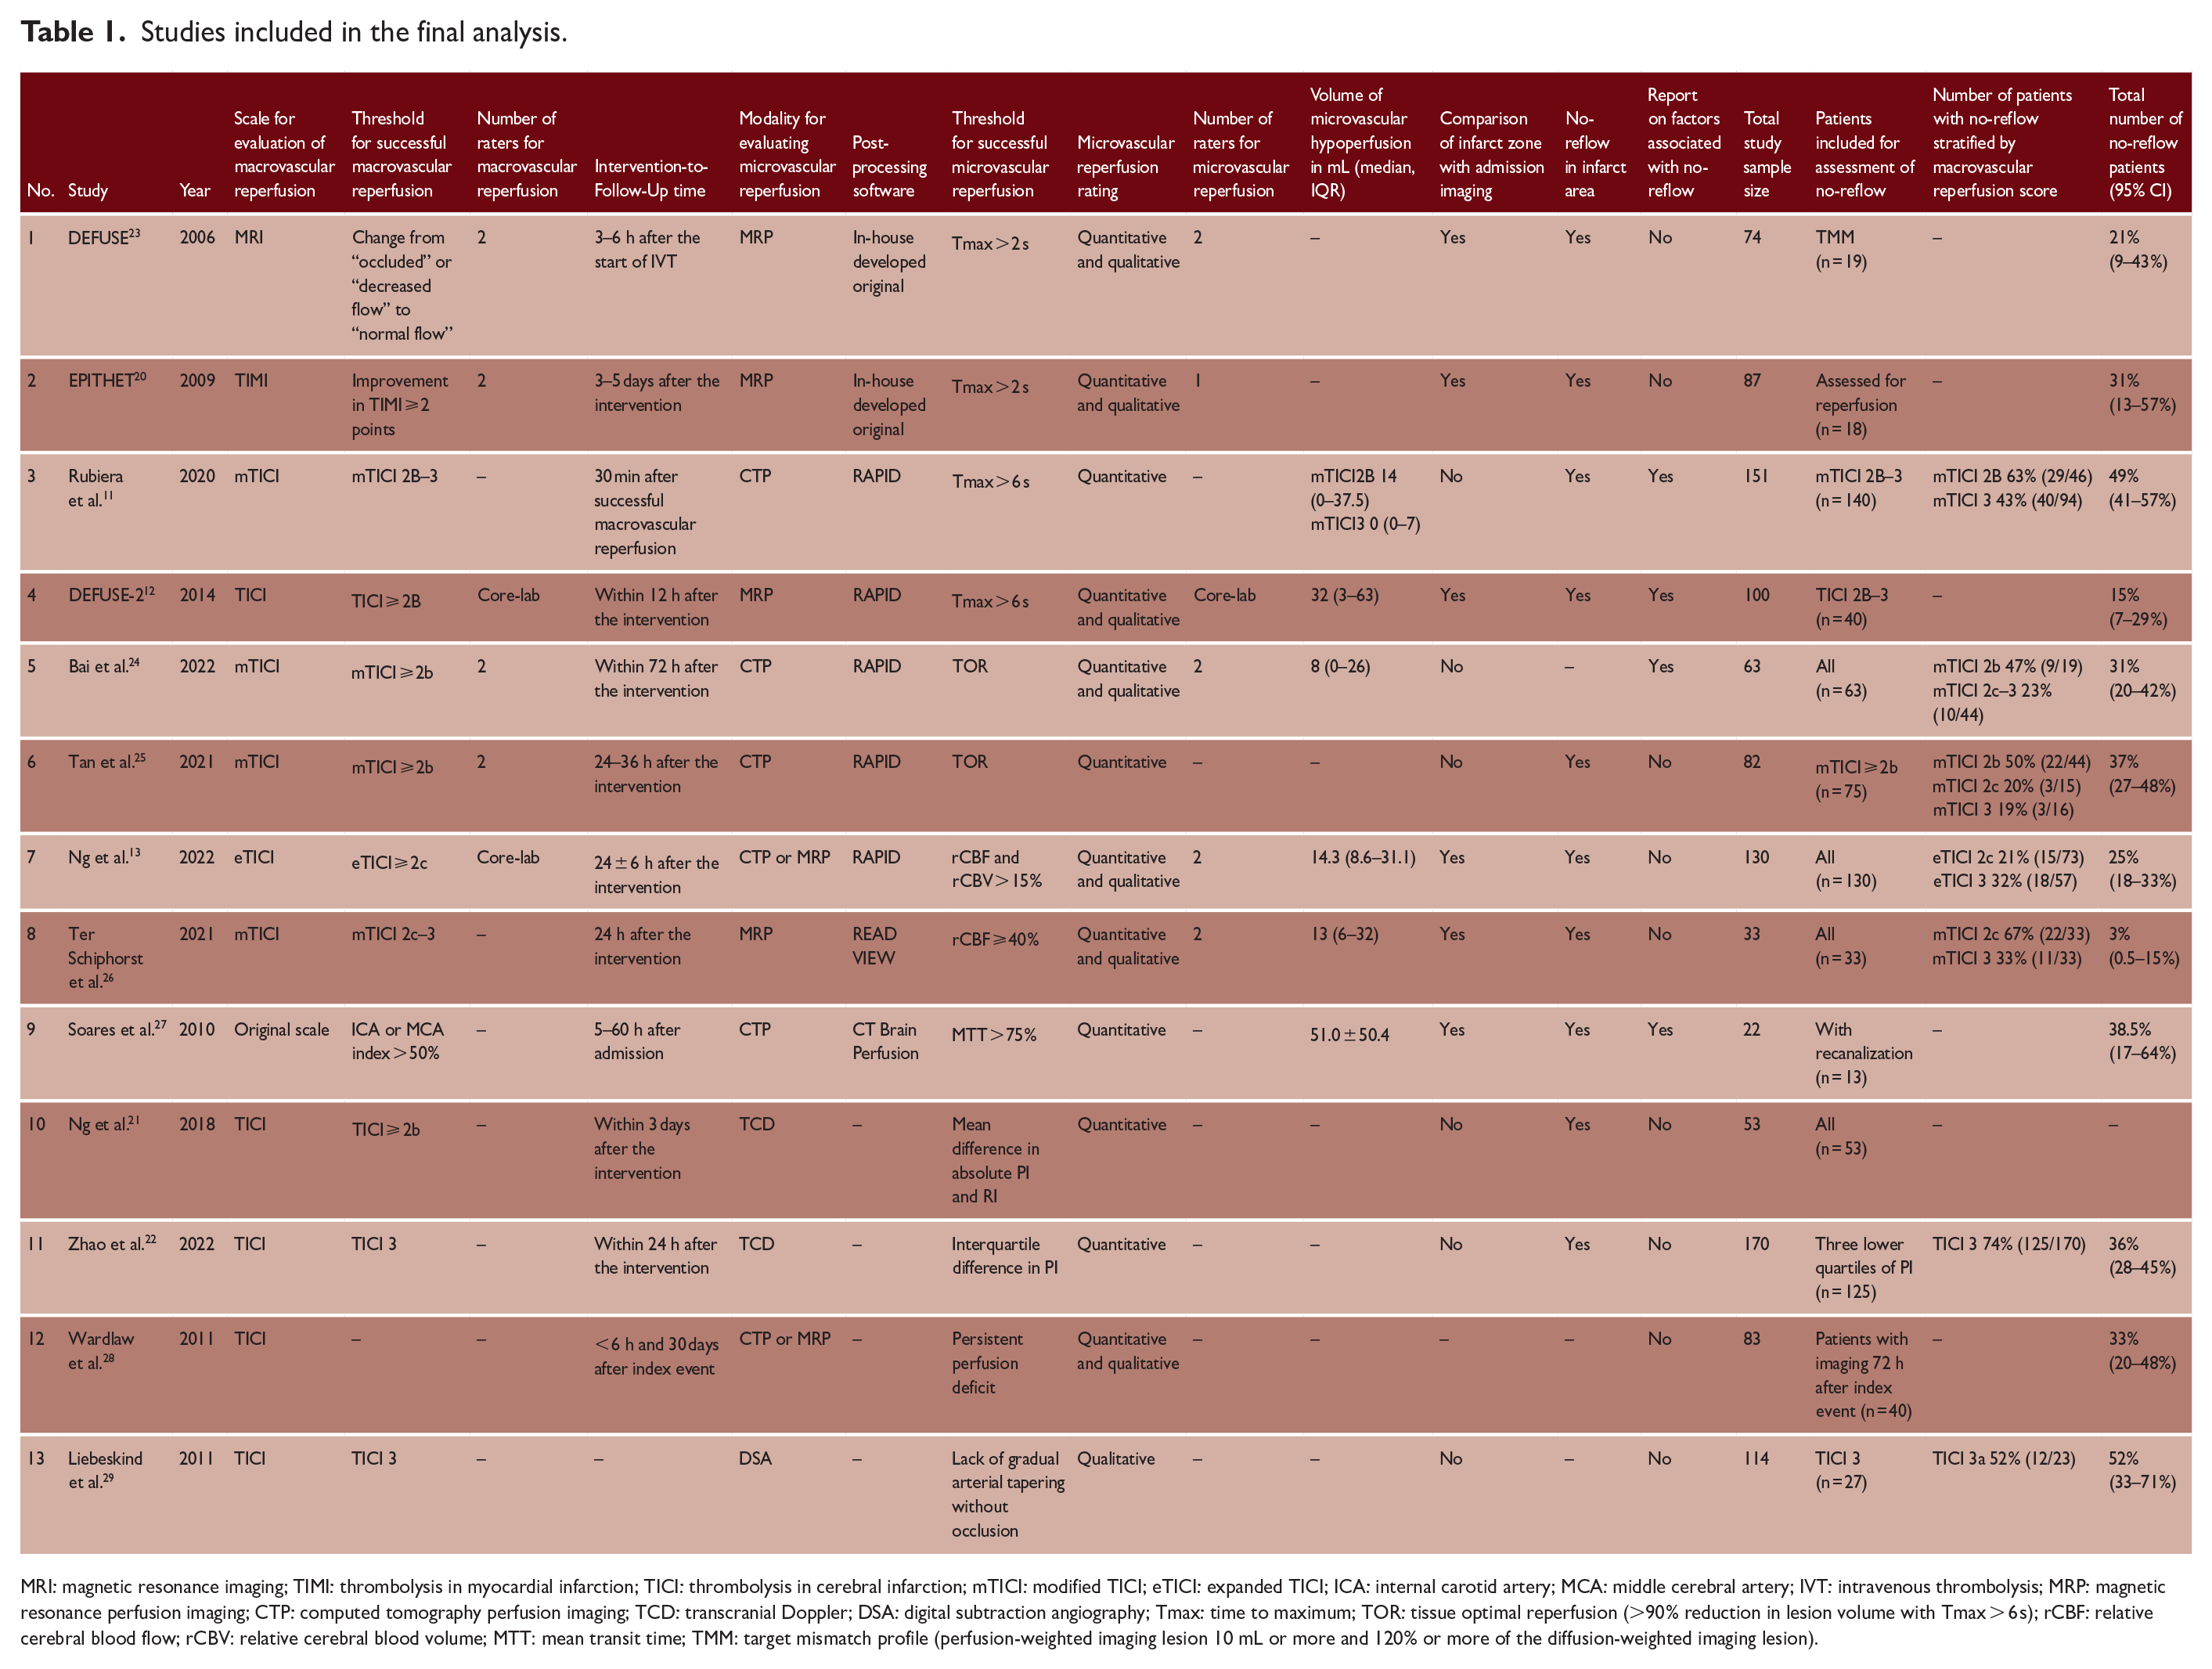
MRI: magnetic resonance imaging; TIMI: thrombolysis in myocardial infarction; TICI: thrombolysis in cerebral infarction; mTICI: modified TICI; eTICI: expanded TICI; ICA: internal carotid artery; MCA: middle cerebral artery; IVT: intravenous thrombolysis; MRP: magnetic resonance perfusion imaging; CTP: computed tomography perfusion imaging; TCD: transcranial Doppler; DSA: digital subtraction angiography; Tmax: time to maximum; TOR: tissue optimal reperfusion (>90% reduction in lesion volume with Tmax > 6 s); rCBF: relative cerebral blood flow; rCBV: relative cerebral blood volume; MTT: mean transit time; TMM: target mismatch profile (perfusion-weighted imaging lesion 10 mL or more and 120% or more of the diffusion-weighted imaging lesion).
No-reflow rates
Pooling data across all definitions, about one-third of stroke patients who achieved macrovascular reperfusion experienced the no-reflow phenomenon (29%, 95% CI, 21–37%; Figure 1). Prevalence of no-reflow was comparable between different subgroups based on perfusion imaging modality, except when no-reflow was evaluated on rCBF and rCBV perfusion maps (18%, 95% CI, 0–36%). There was wide heterogeneity in prevalence of no-reflow across all the studies (I2 = 86.1%), as well as when heterogeneity was evaluated within subgroups (e.g. I2 = 75% for Tmax) and between subgroups (I2 = 77.7%).
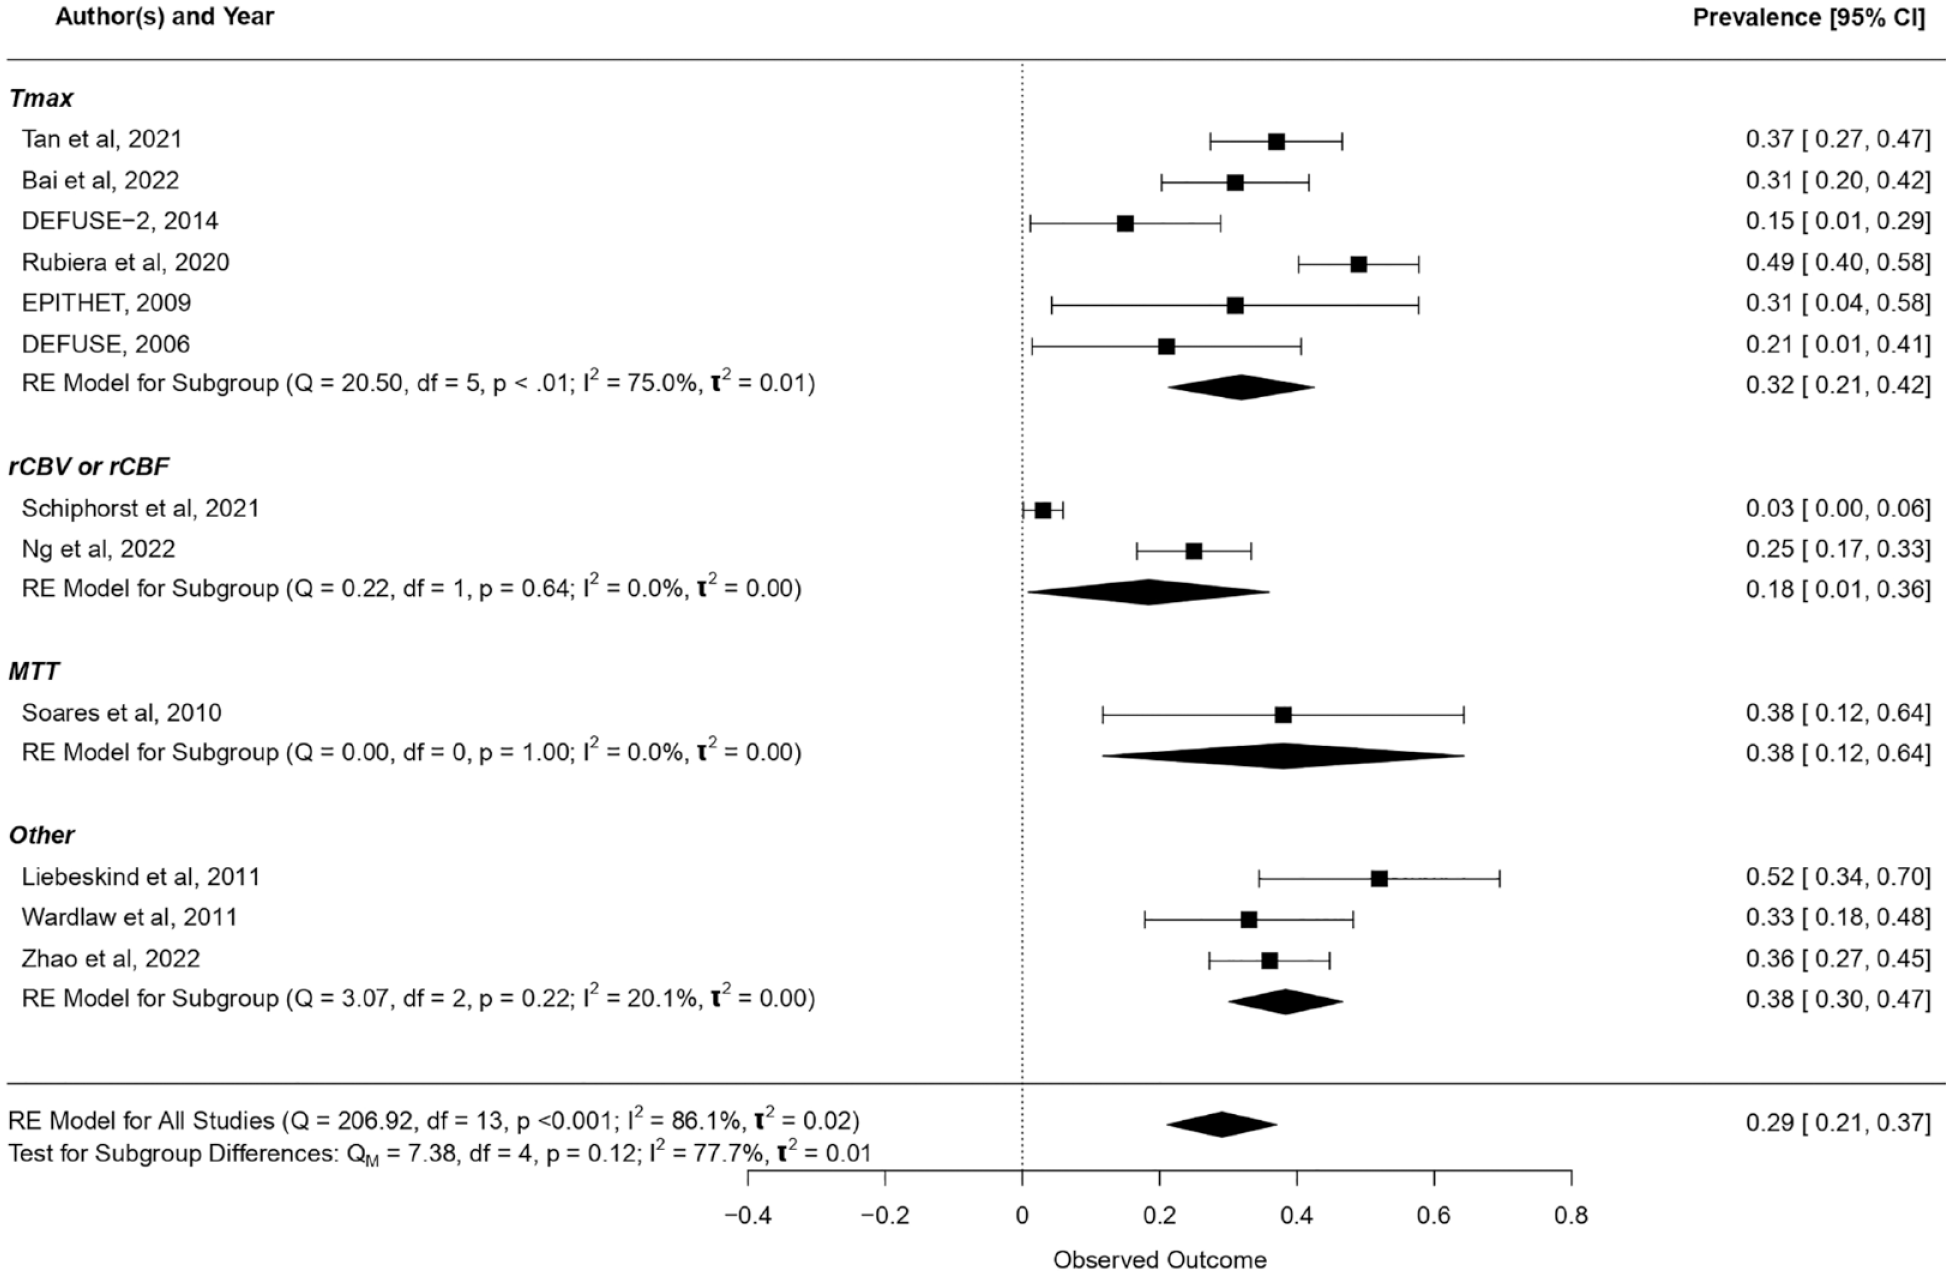
Prevalence of no-reflow. Tmax: time to maximum; rCBF: relative cerebral blood flow; rCBV: relative cerebral blood volume; MTT: mean transit time. One-third of stroke patients who achieved macrovascular reperfusion experienced the no-reflow phenomenon (29%, 95% CI, 21–37%). Prevalence of no-reflow was comparable between different subgroups that were stratified by the perfusion imaging modality used to evaluate microvascular reperfusion, except when no-reflow was evaluated on rCBF and rCBV perfusion maps (18%, 95% CI, 0–36%).
No-reflow rates were high in the TICI2b subgroup (55%, 95% CI, 45–66%), being more than double the rates of TICI2c (21%, 95% CI, 15–27%), and TICI3 (24%, 95% CI, 0–41%), as shown in Figure 2 and Supplemental Figure S2. Sub-analysis restricted to studies where Intervention-to-Follow-up time was up to 24 h showed comparable prevalence rates (Figure S3).
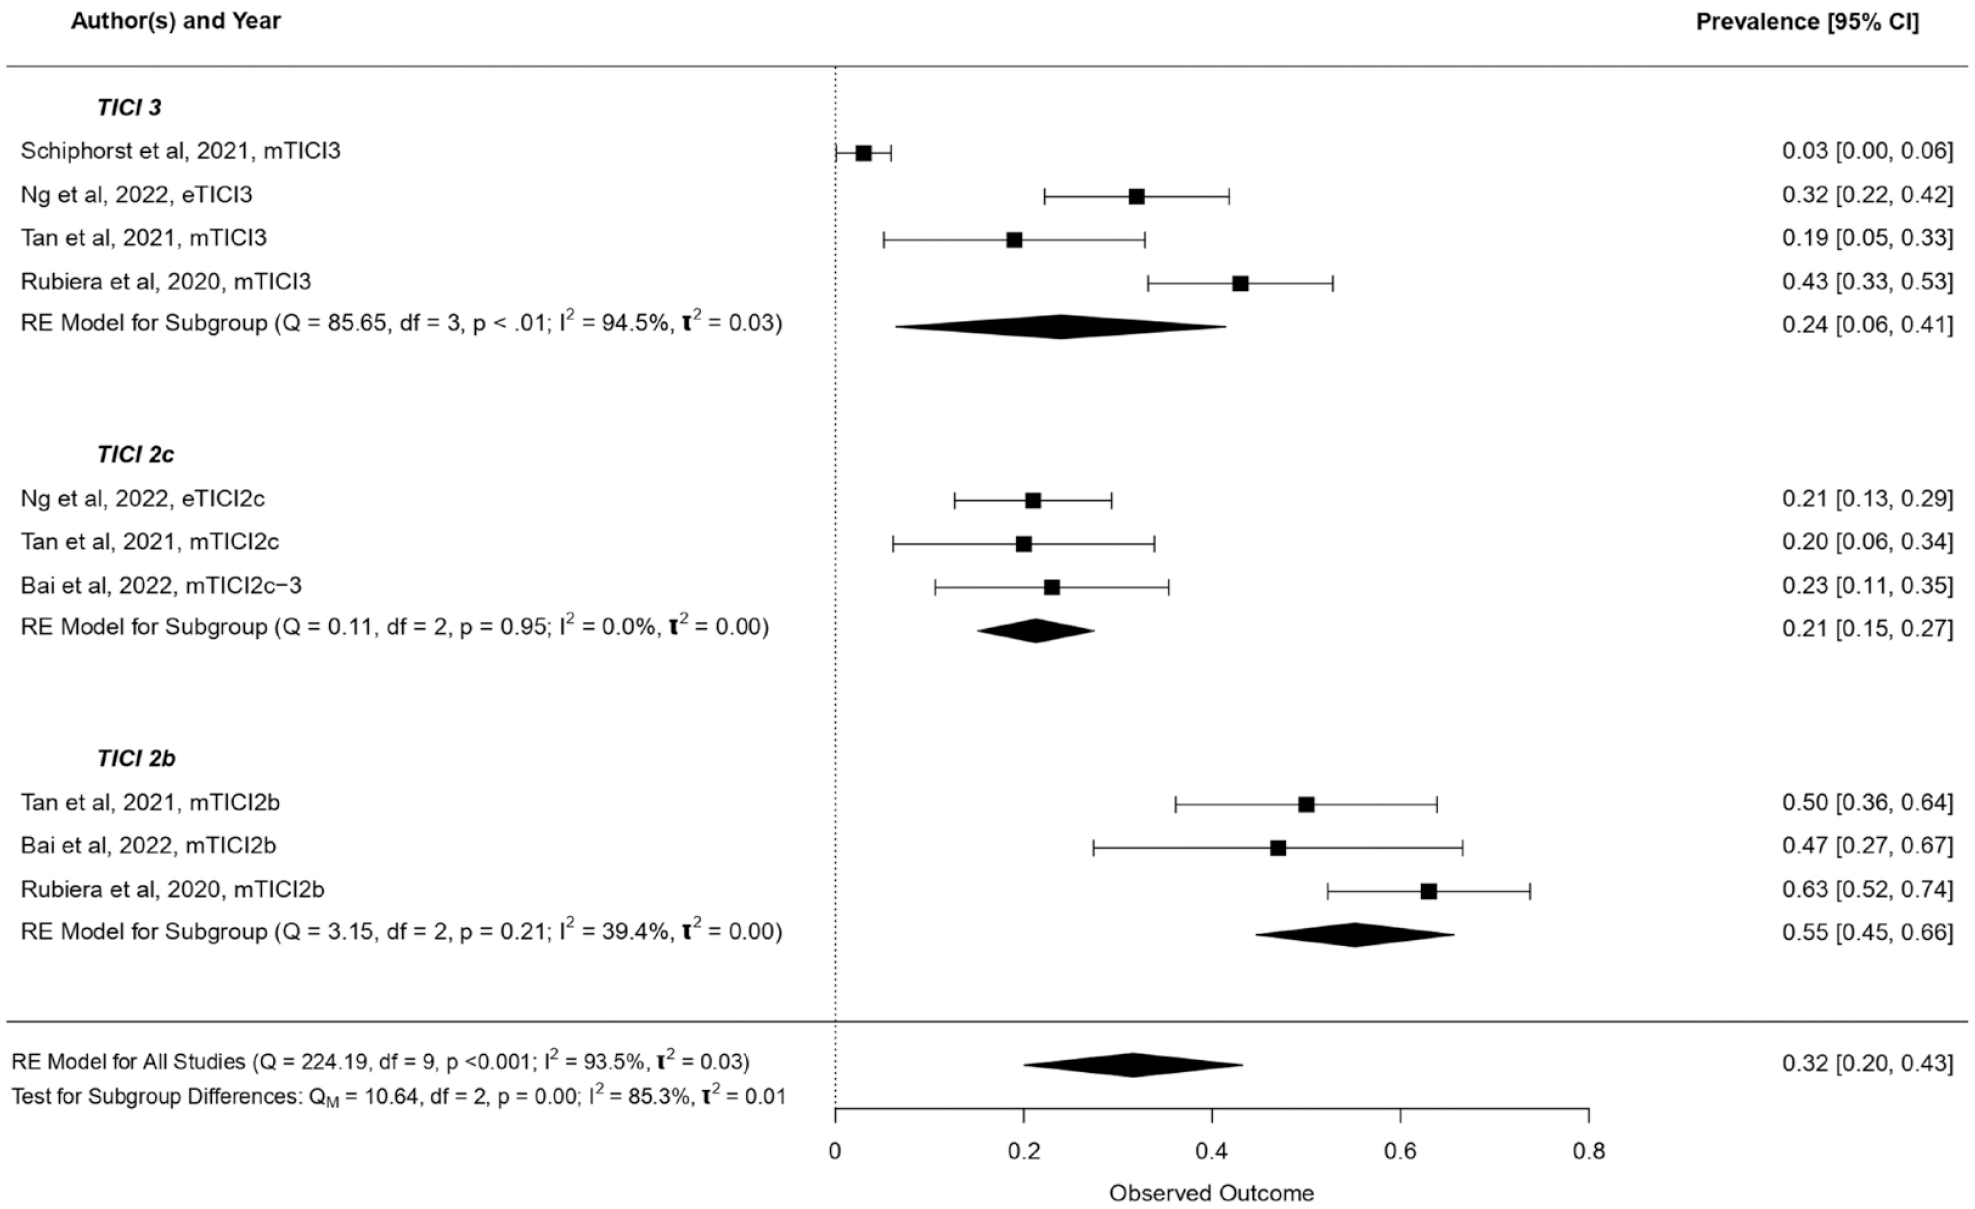
Prevalence of no-reflow stratified by macrovascular reperfusion score. TICI: thrombolysis in cerebral infarction. When stratified across the TICI scale, no-reflow prevalence rates were very high in the TICI2b subgroup (55%, 95% CI, 45–66%), being more than double the rates observed in the TICI2c (21%, 95% CI, 15–27%) and TICI3 subgroups (24%, 95% CI, 0–41%).
Functional independence
A pooled analysis of all studies that reported 3-month functional independence rates (n = 8/11) showed that no-reflow was associated with lower rates of functional independence at 3 months after the index event (OR 0.21, 95% CI, 0.15–0.31; I2 = 0%, Figure 3). Subgroup analysis on different perfusion map modalities (Supplemental Figure S4), definitions of functional independence (Supplemental Figure S5), and follow-up times (Supplemental Figure S6) showed comparable point estimates. Meta-regression analysis showed no association between Intervention-to-Follow-Up time and no-reflow rates (OR 0.99, 95% CI, 0.97–1.02 per additional hour of increase, Supplemental Figure S7). We found no evidence of publication bias on the funnel plot analysis, with LFK index = 0.63 (Supplemental Figure S8). Overall, studies showed a moderate risk of bias, mainly related to the evaluation of no-reflow in all patients undergoing reperfusion therapy as shown in Supplemental Figure S9.
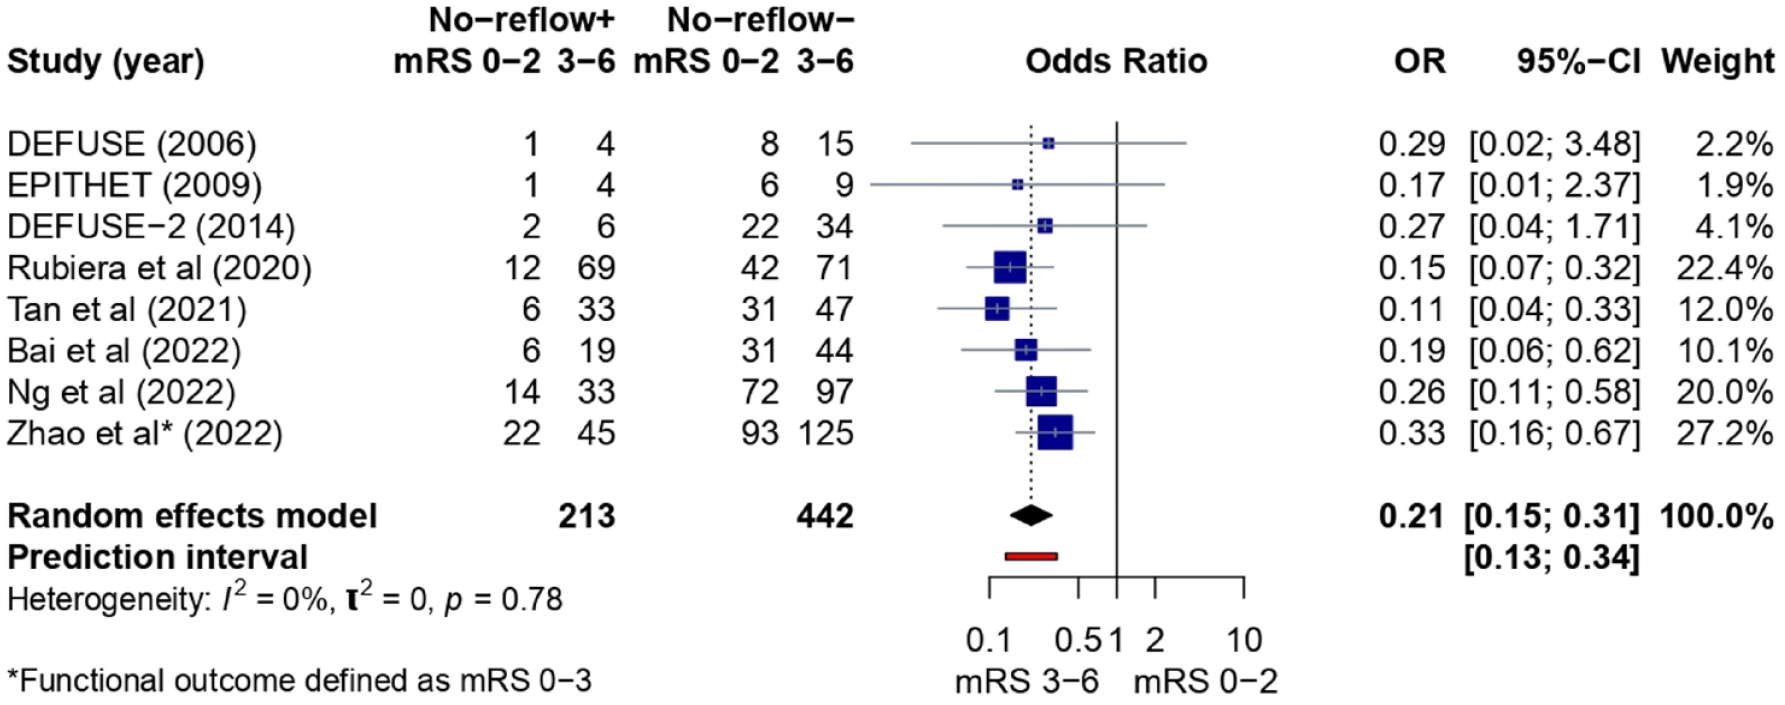
Pooled analysis summary for functional independence rates in patients with (+) and without (–) no-reflow phenomenon. mRS: modified Rankin scale. A pooled analysis of all the studies that reported 3-month functional independence rates (n = 9/11) showed that no-reflow was associated with lower rates of functional independence at 3 months after the index event (OR 0.21, 95% CI, 0.15–0.31 for mRS 0–2 at 3 months).
Discussion
The main findings of this systematic review and meta-analysis are as follows: (1) A clear definition of how to assess and measure no-reflow is lacking. (2) Prevalence of no-reflow varied across the studies, but could be expected in roughly one out of three patients with successful macrovascular reperfusion and in one out of four patients with complete macrovascular reperfusion. (3) Studies reporting no-reflow in patients with TICI2b-2c may have included perfusion abnormalities related to persistent vessel occlusion rather than the no-reflow phenomenon. (4) Irrespective of the definition and modality, the evidence points to a consistent association between no-reflow and lower rates of functional independence at 3 months.
Perfusion imaging modalities
The current standard for evaluating critically hypoperfused tissue in AIS patients before the intervention is with Tmax, rCBF, and rCBV lesion volume maps.30,31 For Tmax, the delay of > 6 s has been suggested as the most accurate threshold for identifying hypoperfused tissue. 30 For rCBV and rCBF maps, a decrease in blood volume or blood flow ⩽ 30% relative to brain tissue with preserved perfusion has been reported to accurately identify the tissue that is likely to be irreversibly damaged. 31 Similar maps and thresholds have also been proposed for the evaluation of microvascular hypoperfusion on follow-up imaging.
Previous studies have used Tmax > 2 s, but this threshold was found to overestimate the volume of hypoperfused tissue.20,23 More recent studies have used Tmax > 6 s as it is more specific for the detection of residual hypoperfusion.11,12 Another parameter is tissue optimal reperfusion (TOR), defined as > 90% reduction in lesion volume with a Tmax > 6 s between baseline and follow-up imaging.24,25 TOR was proposed due to its high correlation with final volume of hypoperfused tissue. 32 Other studies have argued that rCBV and rCBF might be more sensitive for identifying microvascular hypoperfusion than Tmax.33,34 A decrease of ⩽ 15% in rCBV or rCBF maps has been reported as the lower boundary for evaluating tissue hypoperfusion 13 ; however, using a more conservative measure of ⩽ 40% decrease, it was possible to identify critically hypoperfused tissue with higher sensitivity and specificity 26 even when compared with Tmax > 6 s. 34 In summary, it is not yet clear which perfusion maps are best suited to detect no-reflow. This is reflected by the variety of definitions used in the included studies and underlines the need to establish consensus criteria.
Six studies reported volumes of tissue with persistent microvascular hypoperfusion; however, none of the included studies reported volume cutoffs when defining no-reflow. This affects all perfusion-based modalities as there is a lack of clear cutoff as to how many neighboring voxels should show critical hypoperfusion in order for it to be defined as the no-reflow phenomenon. Per the original definition, no-reflow presents a patchy phenomenon with small regions of absent or reduced flow in a tissue with normal macrovascular perfusion. 9 However, all studies included in this review reported no-reflow as a dichotomized outcome (present or absent). This also raises the questions on the sensitivity of perfusion imaging to measure small deficits on the microvascular level.
Time metrics in no-reflow
The Intervention-to-Follow-Up time also varied considerably between studies.11,12,23 The percentage of patients with no-reflow across different perfusion maps seems to numerically decrease the longer the time since the intervention13,24–26; however, that decrease was not significant in a study-level meta-analysis. This seems consistent with the findings of no-reflow in myocardial infarction cases. 15
This decrease could suggest that transient events, such as vasospasms or autolysis of small emboli, might be responsible for the varying prevalence of microvascular hypoperfusion over time. 5 However, as this decrease was mild, it could be hypothesized that more persisting intra- and perivascular events, such as pericyte disruption, endothelial cell inflammatory response, or leukocyte and neutrophil aggregation, are responsible for microvascular hypoperfusion. 6 True no-reflow rates might also be partially masked by more common findings of hyper-, rather than hypo-, perfusion after successful reperfusion therapy. 35 It would be difficult to determine whether microvascular hypoperfusion occurred during or after the macrovascular occlusion if perfusion imaging was not performed immediately after the intervention. 7 Therefore, the true rates of no-reflow might be assessed most accurately when tissue perfusion status is observed both immediately after the intervention and again within the following 24 h, as all of the aforementioned microvascular events are most likely to occur within the 24-hour timeframe.5,6
Patients included for no-reflow assessment
Another factor that hinders the determination of true no-reflow rates is the choice of patients included in studies. Earlier studies included only a small percentage of their total study sample for no-reflow assessment, whereas most recent studies included a larger percentage of their cohort. This could partially be explained by changes in scales and definitions of successful macrovascular reperfusion across time. Most recent studies used the TICI scale as it has become an accepted convention for grading macrovascular reperfusion. However, evaluating no-reflow in patients who achieved 50% macrovascular reperfusion of the target territory (i.e. patients with TICI2b) might be ineffective, as these patients are expected to have a substantial perfusion deficit due to incomplete macrovascular reperfusion. 36 In those cases, perfusion abnormalities observed on the follow-up imaging are true persistent macrovascular perfusion deficits. They do not provide evidence of a mismatch between macro- and microvascular reperfusion (i.e. no evidence of no-reflow), as there is hypoperfusion on both the macro- and microvascular level. 36 This would explain why higher rates of no-reflow were observed in patients with lower TICI scores (e.g. TICI2b vs 2c-3). Even in cases of near-complete reperfusion (TICI2c), the hypoperfusion observed on the follow-up perfusion imaging may just correspond to non-reperfused distal vessel occlusion and, again, would not be evidence of true no-reflow. 36
The optimal approach would be to evaluate no-reflow only in patients with complete reperfusion (TICI3). Ideally, TICI grading would be performed by an independent core-lab, as treating physicians tend to overestimate the extent of reperfused tissue in acute care settings. 37 A core-lab would be able to evaluate reperfusion success impartially and, in patients graded as TICI3 by the core-lab, any findings of microvascular hypoperfusion could not be explained by the presence of distal occlusions and would therefore represent true no-reflow. The most frequently cited causes of bad outcome despite successful macrovascular reperfusion are large initial infarct core (ASPECTS < 5) and hemorrhagic transformation after the intervention.3,4 However, once factors known to be associated with bad outcome are excluded or accounted for, presence of no-reflow in TICI3 patients could also inform reasons for not achieving functional independence despite complete macrovascular reperfusion. 38
Functional independence and no-reflow
We found a strong positive association between the presence of no-reflow and lower rates of functional independence after the index event. Point estimates seemed consistent across all subgroup analyses that reported rates of tissue hypoperfusion.
Microvascular reperfusion has already been reported as a better predictor of clinical outcome than macrovascular reperfusion.20,23 Microvessels are known to respond to focal ischemia, and changes happening in the microvasculature can permanently alter tissue status. 5 This response is rapid and linked to neuron damage, which can translate into a long-term loss of functional independence. Future studies on AIS patients with complete macrovascular reperfusion should consider the problem of persistent microvascular hypoperfusion. The Intraarterial Alteplase Versus Placebo After Mechanical Thrombectomy (CHOICE) trial reported higher rates of microvascular reperfusion in patients with TICI2c–3 following local administration of intra-arterial alteplase, which also translated to higher rates of functional independence. 14 Four planned randomized-controlled trials (TECNO (clinicaltrails.gov; NCT05499832), IA TREAT (P. Khatri, personal communication, 3 November 2022), IA RESCUE (J. M. Olivot, personal communication, 5 November 2022), and CHOICE2 (A. Chamorro, 20 November 2022)) will also look at the effects of locally administered intra-arterial lytics and rates of microvascular reperfusion, providing more information on strategies to tackle no-reflow.
Limitations
This analysis reported results from retrospective observational studies with inherent-related biases. We performed a pooled analysis of the available data, despite heterogeneities in definitions and assessment methods for measurement of the no-reflow phenomenon. Although we tried to account for this heterogeneity by using a more conservative statistical approach and additional sub-analyses, discrepant ways of reporting no-reflow may hinder the analysis regarding a true association between no-reflow and 3-month functional independence. Inclusion of patients with TICI2b reperfusion may have overestimated the proportion of patients with no-reflow phenomenon related to interval infarction of the territory supplied by the persistently occluded distal vessel.
Conclusion
Although the definition of no-reflow varied substantially across studies, it may be a relatively common phenomenon according to the pooled estimates reported here. Currently, some of the cases defined as no-reflow may simply represent persisting vessel occlusions, and it remains unclear whether no-reflow is an epiphenomenon of the infarcted parenchyma or causes infarction despite macrovascular reperfusion. Future studies should focus on standardizing the definition of no-reflow with more consistent reporting definitions of successful macrovascular reperfusion and experimental set-ups that are able to shed light on the causality of the observed findings.
Supplemental Material
sj-pdf-1-wso-10.1177_17474930231180434 – Supplemental material for No-reflow phenomenon in stroke patients: A systematic literature review and meta-analysis of clinical data
Supplemental material, sj-pdf-1-wso-10.1177_17474930231180434 for No-reflow phenomenon in stroke patients: A systematic literature review and meta-analysis of clinical data by Adnan Mujanovic, Felix Ng, Thomas R Meinel, Tomas Dobrocky, Eike I Piechowiak, Christoph C Kurmann, David J Seiffge, Susanne Wegener, Roland Wiest, Lukas Meyer, Jens Fiehler, Jean Marc Olivot, Marc Ribo, Thanh N Nguyen, Jan Gralla, Bruce CV Campbell, Urs Fischer and Johannes Kaesmacher in International Journal of Stroke
Footnotes
Acknowledgements
For English language support, we would like to thank Ms Susan Kaplan.
Declaration of conflicting interests
The author(s) declared the following potential conflicts of interest with respect to the research, authorship, and/or publication of this article: TD reports consultancy for Medtronic. JMO reports consultancy for Bioxodes, Abbvie, and Acticor, and speaker fees from Boehringer Ingelheim and Bristol Myers Squibb. JG reports a Swiss National Funds grant for MRI in stroke. UF reports research grants from Medtronic BEYOND SWIFT registry, the Swiss National Science Foundation, and the Swiss Heart Foundation; consulting fees from Medtronic, Stryker, and CSL Behring (fees paid to institution); has membership of a data safety monitoring board for the IN EXTREMIS trial and the TITAN trial; and was on the advisory board for Portola (Alexion; fees paid to institution). JK reports financial support from Medtronic for the BEYOND SWIFT registry (fees paid to institution); and research grants from the Swiss National Science Foundation supporting the TECNO trial (fees paid to institution), Swiss Academy of Medical Sciences supporting MRI research (fees paid to institution), and Swiss Heart Foundation supporting cardiac MRI in the aetiological work-up of stroke patients (fees paid to institution).
Funding
The author(s) received no financial support for the research, authorship, and/or publication of this article.
Supplemental material
Supplemental material for this article is available online.
References
Supplementary Material
Please find the following supplemental material available below.
For Open Access articles published under a Creative Commons License, all supplemental material carries the same license as the article it is associated with.
For non-Open Access articles published, all supplemental material carries a non-exclusive license, and permission requests for re-use of supplemental material or any part of supplemental material shall be sent directly to the copyright owner as specified in the copyright notice associated with the article.