
Abstract
Background and purpose
Validation of automatically derived acute ischemic volumes (AAIV) from e-ASPECTS on non-contrast computed tomography (NCCT).
Materials and methods
Data from three studies were reanalyzed with e-ASPECTS Version 7. AAIV was calculated in milliliters (ml) in all scored ASPECTS regions of the hemisphere detected by e-ASPECTS. The National Institute of Health Stroke Scale (NIHSS) determined stroke severity at baseline and clinical outcome was measured with the modified Rankin Scale (mRS) between 45 and 120 days. Spearman ranked correlation coefficients (R) of AAIV and e-ASPECTS scores with NIHSS and mRS as well as Pearson correlation of AAIV with diffusion-weighted imaging and CT perfusion-estimated ischemic “core” volumes were calculated. Multivariate regression analysis (odds ratio, OR with 95% confidence intervals, CI) and Bland–Altman plots were performed.
Results
We included 388 patients. Mean AAIV was 11.6 ± 18.9 ml and e-ASPECTS was 9 (8–10: median and interquartile range). AAIV, respectively e-ASPECTS correlated with NIHSS at baseline (R = 0.35, p < 0.001; R = −0.36, p < 0.001) and follow-up mRS (R = 0.29, p < 0.001; R = −0.3, p < 0.001). In subsets of patients, AAIV correlated strongly with diffusion-weighted imaging (n = 37, R = 0.68, p < 0.001) and computed tomography perfusion-derived ischemic “core” (n = 41, R = 0.76, p < 0.001) lesion volume and Bland–Altman plots showed a bias close to zero (−2.65 ml for diffusion-weighted imaging and 0.45 ml forcomputed tomography perfusion “core”). Within the whole cohort, the AAIV (OR 0.98 per ml, 95% CI 0.96–0.99) and e-ASPECTS scores (OR 1.3, 95%CI 1.07–1.57) were independent predictors of good outcome
Conclusion
AAIV on NCCT correlated moderately with clinical severity but strongly with diffusion-weighted imaging lesion and computed tomography perfusion ischemic “core” volumes and predicted clinical outcome.
Introduction
The initial lesion volume is a strong predictor of clinical outcome in acute ischemic stroke patients. 1 The most accurate assessment of acute ischemia is obtained by diffusion-weighted magnetic resonance imaging (DWI). 2 Up to date measurements of acute ischemic volumes on non-contrast-enhanced (NCCT) are not established in clinical routine, since signs are more subtle and human assessment is highly variable. 3 In the meantime, automated and standardized evaluation of NCCTs is available through the e-ASPECTS software (Brainomix, Oxford, UK, www.brainomix.com), an Alberta Stroke Program Early CT Score (ASPECTS) scoring tool. The performance of e-ASPECTS is non-inferior to expert neuroradiologists, and e-ASPECTS scores are independent predictors of outcome and symptomatic intracranial hemorrhages in patients undergoing mechanical thrombectomy or intravenous thrombolysis.4–7 The latest version of e-ASPECTS also offers quantification of automatically derived acute ischemic volumes (AAIV) in the territory of the middle cerebral artery. In this study, we aimed to validate AAIV by correlation with measures of clinical stroke severity and outcome. In a subset of patients, we also correlated AAIV with DWI lesion volumes and estimated ischemic “core” lesion volumes derived from CT perfusion imaging.
Methods
Non-contrast-enhanced CT imaging and e-ASPECTS
For this analysis, NCCT scans from three previously published studies4,5,7 were reanalyzed with e-ASPECTS version 7.0, which includes an improved algorithm and measurements of AAIV. The selection process of the included patients can be found in the original papers.4,5,7 Two patients that were previously excluded due to imaging artefacts were now included as well. Scans were obtained from seven different scanners of four different manufacturers: TOSHIBA (Tokyo, Japan): Aquilion, Phillips (Amsterdam Netherlands): Brilliance, GE Healthcare (Chalfont St Giles, Great Britain): LightSpeed VCT and Siemens (Munich, Germany): SOMATOM Definition AS+, SOMATOM Definition Flash, Sensation 16. Slice thickness varied from 0.625 mm to 5 mm and in-plane resolution varied from 0.39 to 0.53 mm (matrix of 512 × 512 for all scans). The e-ASPECTS image processing algorithm follows an artificial intelligence approach, with a combination of traditional 3D graphics and statistical methods, and machine learning classification techniques. The input DICOM data are first resampled to correct any gantry tilt and standardize the input resolution. Then, a fast proprietary registration approach is applied to re-align the data, removing any tilt and rotation. This ensures the image is presented in a standard reference frame, which simplifies human interpretation of the scan. A scoring module uses a machine learning classifier to identify both early and non-acute signs of ischemia in order to derive a voxel-wise probability map. A patient-specific segmentation of the ASPECTS regions is computed, and finally, the output score and result images are generated by classifying each region according to the evidence contained within the probability map. Within e-ASPECTS (version ≥7.0), volume maps associated with acute ischemic signs (e.g. red map on Figure 1(a) and (b_ right images) and non-acute hypodensities are generated. The derived volumetric values are given for the left and the right hemispheres separately. Usually, the non-affected hemisphere shows an AAIV equal or close to zero. The maps are generated with a combination of advanced image processing and machine learning algorithms that integrate local and non-local features but each voxel probability (of belonging to the acute ischemic map) remains strongly driven by the Hounsfield Unit (HU) hypodensities in the NCCT. The final acute map highlights the voxels in the image that are typical of early ischemic signs and the sum of the voxels is converted into a volumetric value in milliliters (ml). AAIV was calculated in all scored ASPECTS regions of the hemisphere detected by e-ASPECTS.
Example of a patient with an NIHSS of 17 at the time of imaging (a). NCCT (middle) was taken 2 h after the onset and DWI (left) 31 min after NCCT. e-ASPECTS processed NCCT with scored regions and red heat maps indicating early ischemic damage (right). Example of a patient with an NIHSS of 21 and an M1 occlusion scanned 140 min after onset of symptoms (b). On CTP (left) the ischemic “core” lesion map (red) indicated 29.18 ml and AAIV was 24.17 ml derived from e-ASPECTS (right).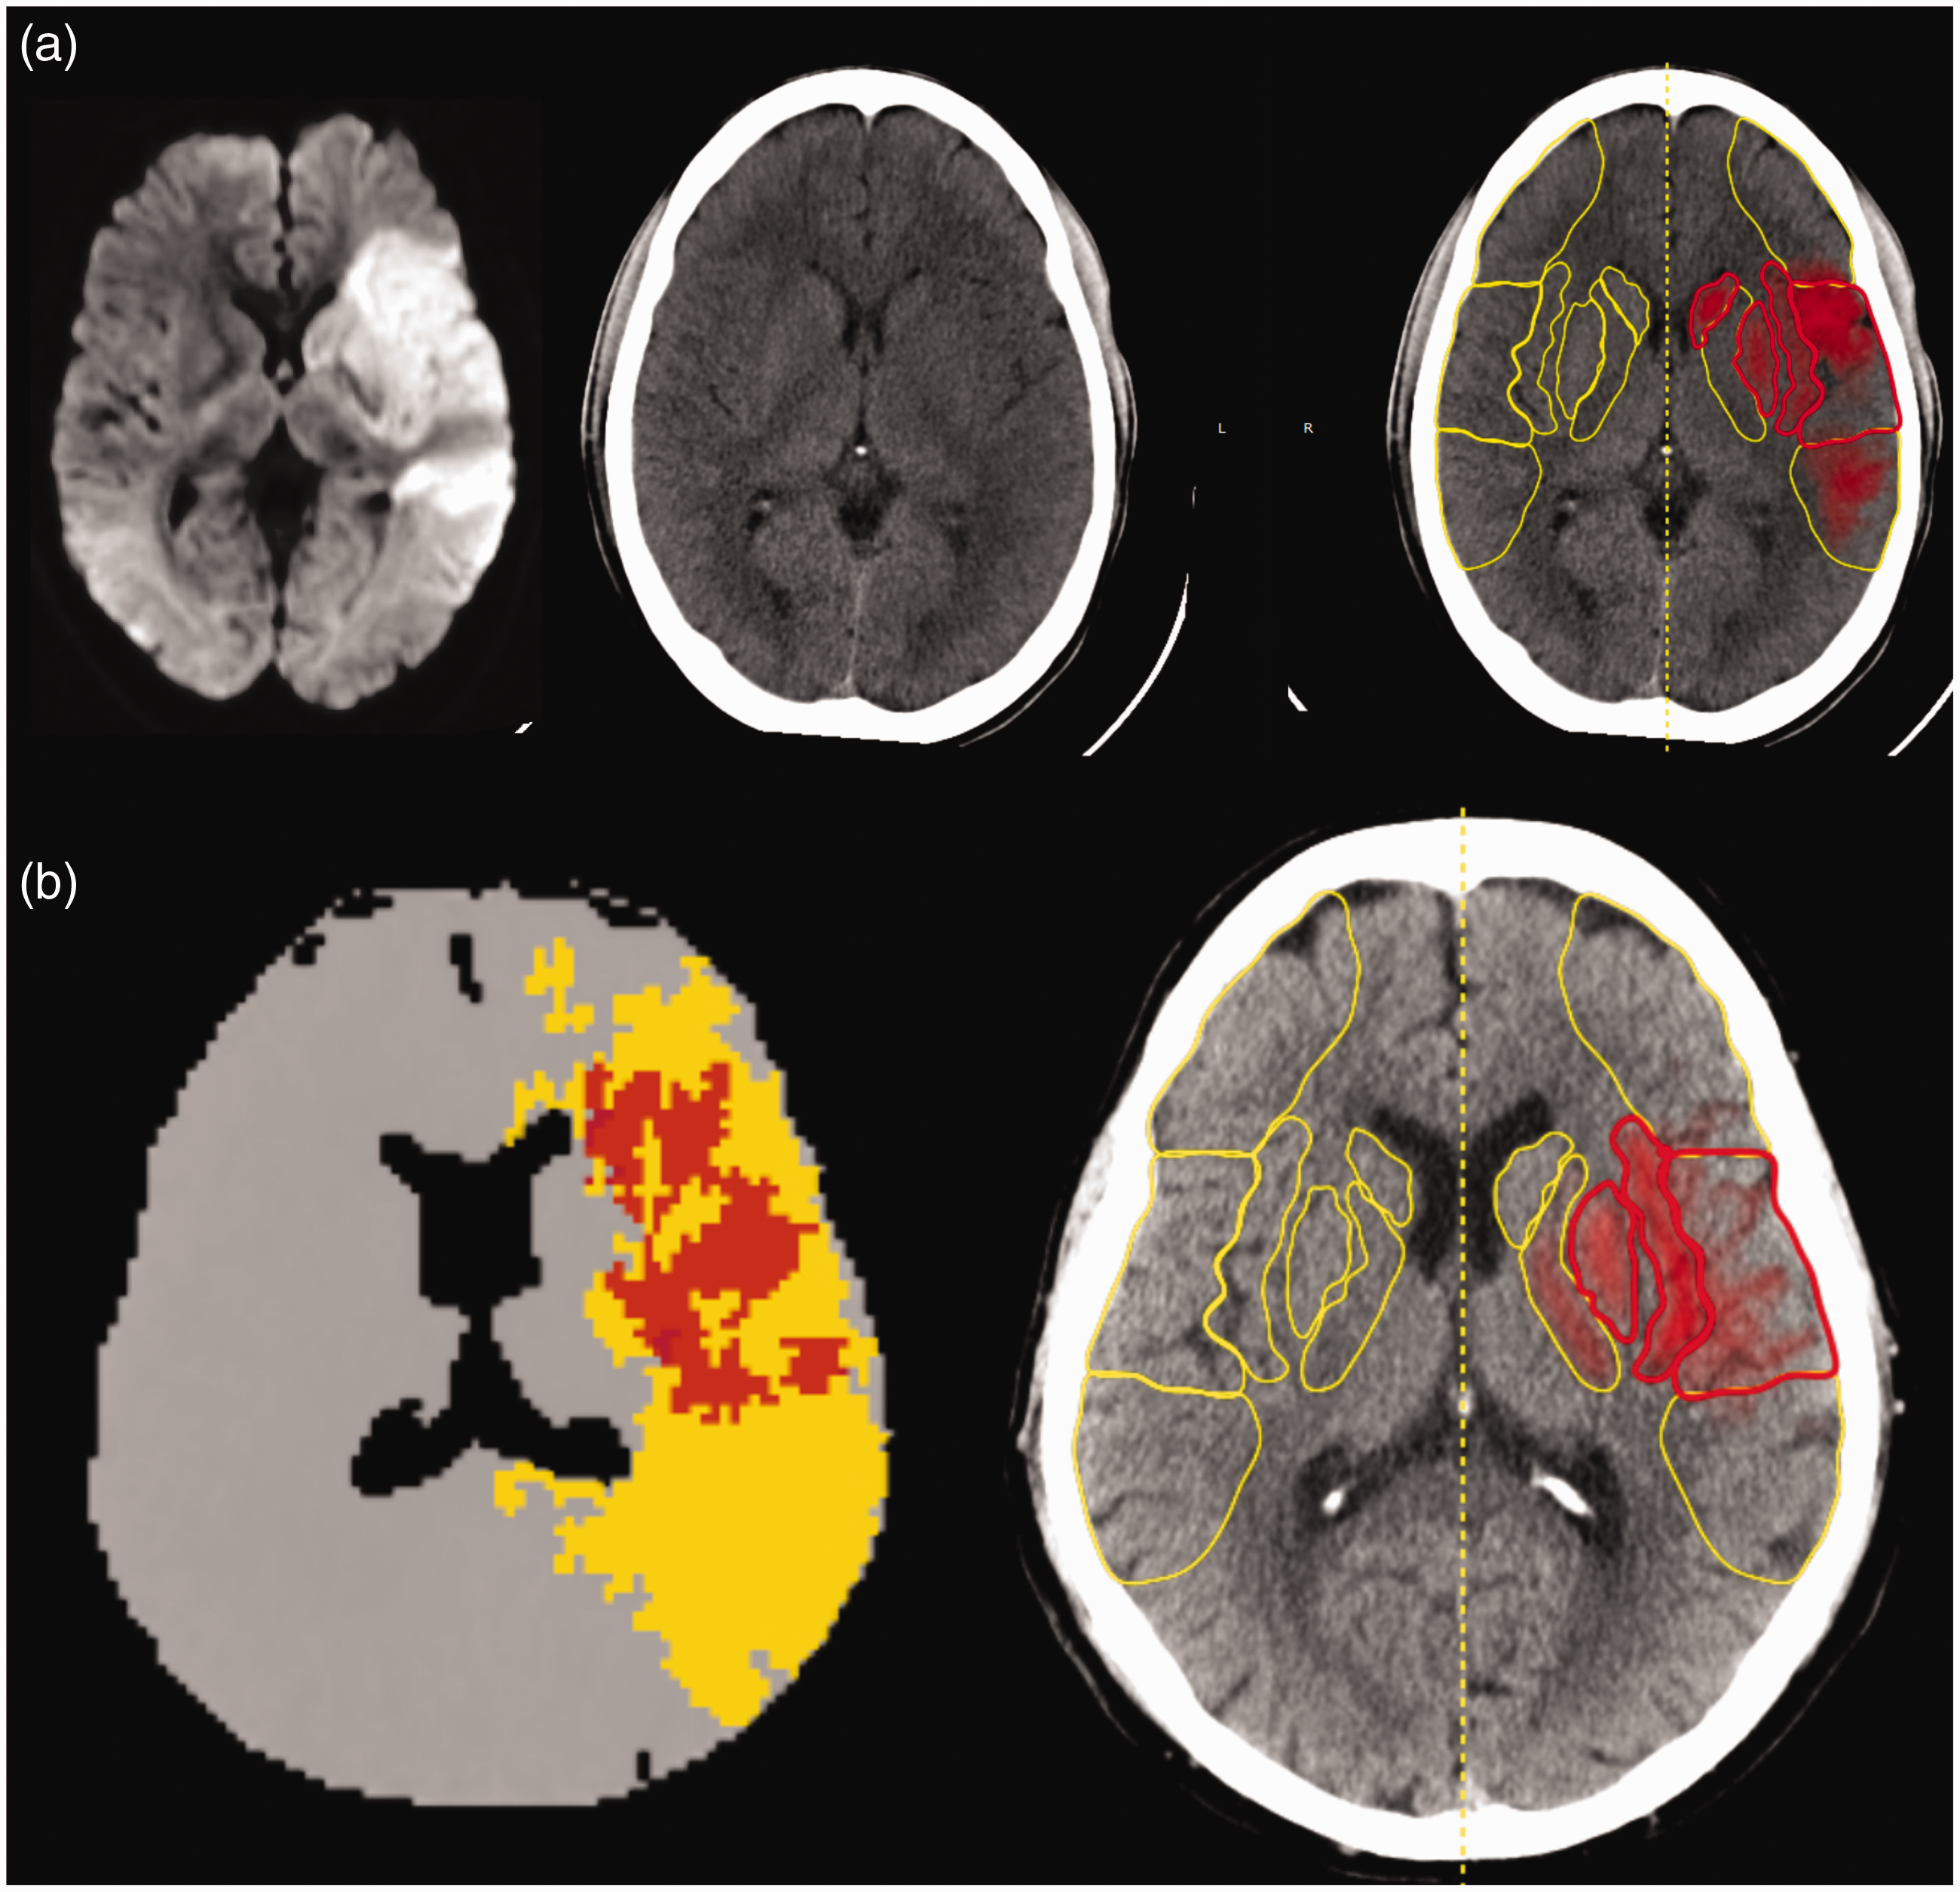
CT perfusion imaging
Forty-five patients received CTP directly after NCCT imaging within the same scanner and in 41 patients CTP data were of sufficient quality to perform automated quantification of ischemic “core.” This was performed with Olea Sphere® (V3.0-SP14) software (Olea Medical, La Ciotat, France) using default settings. Several publications have specifically assessed the performance and utility of the CTP module of Olea Sphere®.8–11 Hemodynamics maps were computed using circular singular value decomposition (cSVD) deconvolution method and ischemic “core” volume using a relative regional cerebral blood flow (rCBF) of less than 40% from the contralateral side combined with time-to-maximum of the residue function (Tmax) higher than 2 s. The Tmax>2 s is only another constraint when Olea Sphere® detects the severe relative CBF (40%) deficit (region associated with “core”) to ensure there is at least a mild delay. We did not look at the volume of general hypoperfused tissue in this study, which is defined as Tmax>6 s in Olea Sphere®. (Figure 1(b) left image).
Magnetic resonance imaging
For a subset of 37 patients, DWI was also acquired (within 2 h of NCCT) and available for semi-automated segmentation. In this analysis, we therefore looked at the correlation of AAIV with DWI-apparent diffusion coefficient (ADC) semi-automated segmented lesions. MR imaging was performed with either a 1·5 Tesla or a 3 Tesla whole-body scanner (Symphony or Trio, Siemens, Erlangen, Germany) using a dedicated stroke protocol with different sequences including DWI (b-values of zero and 1000) and apparent diffusion coefficient (ADC) maps. ADC maps were generated using FSL (FMRIB, Oxford, UK; http://www.fmrib.ox.ac.uk/fsl/) and the final DWI-ADC volume was computed as the intersection of hypersignal on the DWI (www.itksnap.org, using a region growing algorithm 12 and ADC < 620 × 10−6 mm2/s). 13 For an example of a DWI image, see Figure 1(a) left image.
Outcomes
Clinical baseline characteristics, imaging times and findings, as well as procedural/therapeutic and outcome data were recorded. Outcome was measured using the modified Rankin scale (mRS) after 45, 90, or 120 days, obtained through rehabilitation reports, outpatient assessments or a standardized interview by an unblinded investigator. The latest available time point is presented and was used for further analysis. sICH was defined according to the criteria of the European Co-operative Acute Stroke Study-II (ECASS II) as blood at any site in the brain and clinical deterioration with an increase in the National Institute of Health Stroke Scale (NIHSS) of at least four points compared to the lowest value within the first seven days or any ICH leading to death.
Statistics
Spearman ranked or Pearson correlation coefficients (R) were calculated where appropriate. Two different stepwise forward multivariate regression models for good outcome (mRS 0-2) were calculated, one including e-ASPECTS and the other including AAIV (due to interdependency of both variables). The variables included in both models were age, NIHSS, occlusion site, time to scan (TTS), and acute treatment as other baseline parameters. Since we only had in the minority of patients data available from DWI and CTP-derived lesion volumes of acute ischemic tissue, we did not include these variables within the model. Odds ratios (OR) are presented with 95% confidence intervals (CIs). Bland–Altman (BA) plots were generated to illustrate the distribution of the differences in volumetric measurements (ml) between AAIV and DWI-ADC volume and CTP “core” volume, respectively. The BA plots enable to assess visually the bias (mean difference in values obtained between the paired measurements), data scatter, and the relationship between magnitude of difference and size of measurement. The horizontal lines above and below the bias line represent 95% limits of agreement (LOA), and are defined with LOAs = bias ± 1.96 standard deviation. P-values < 0.05 were considered statistically significant.
Results
Clinical and radiological baseline characteristics as well as outcome parameters
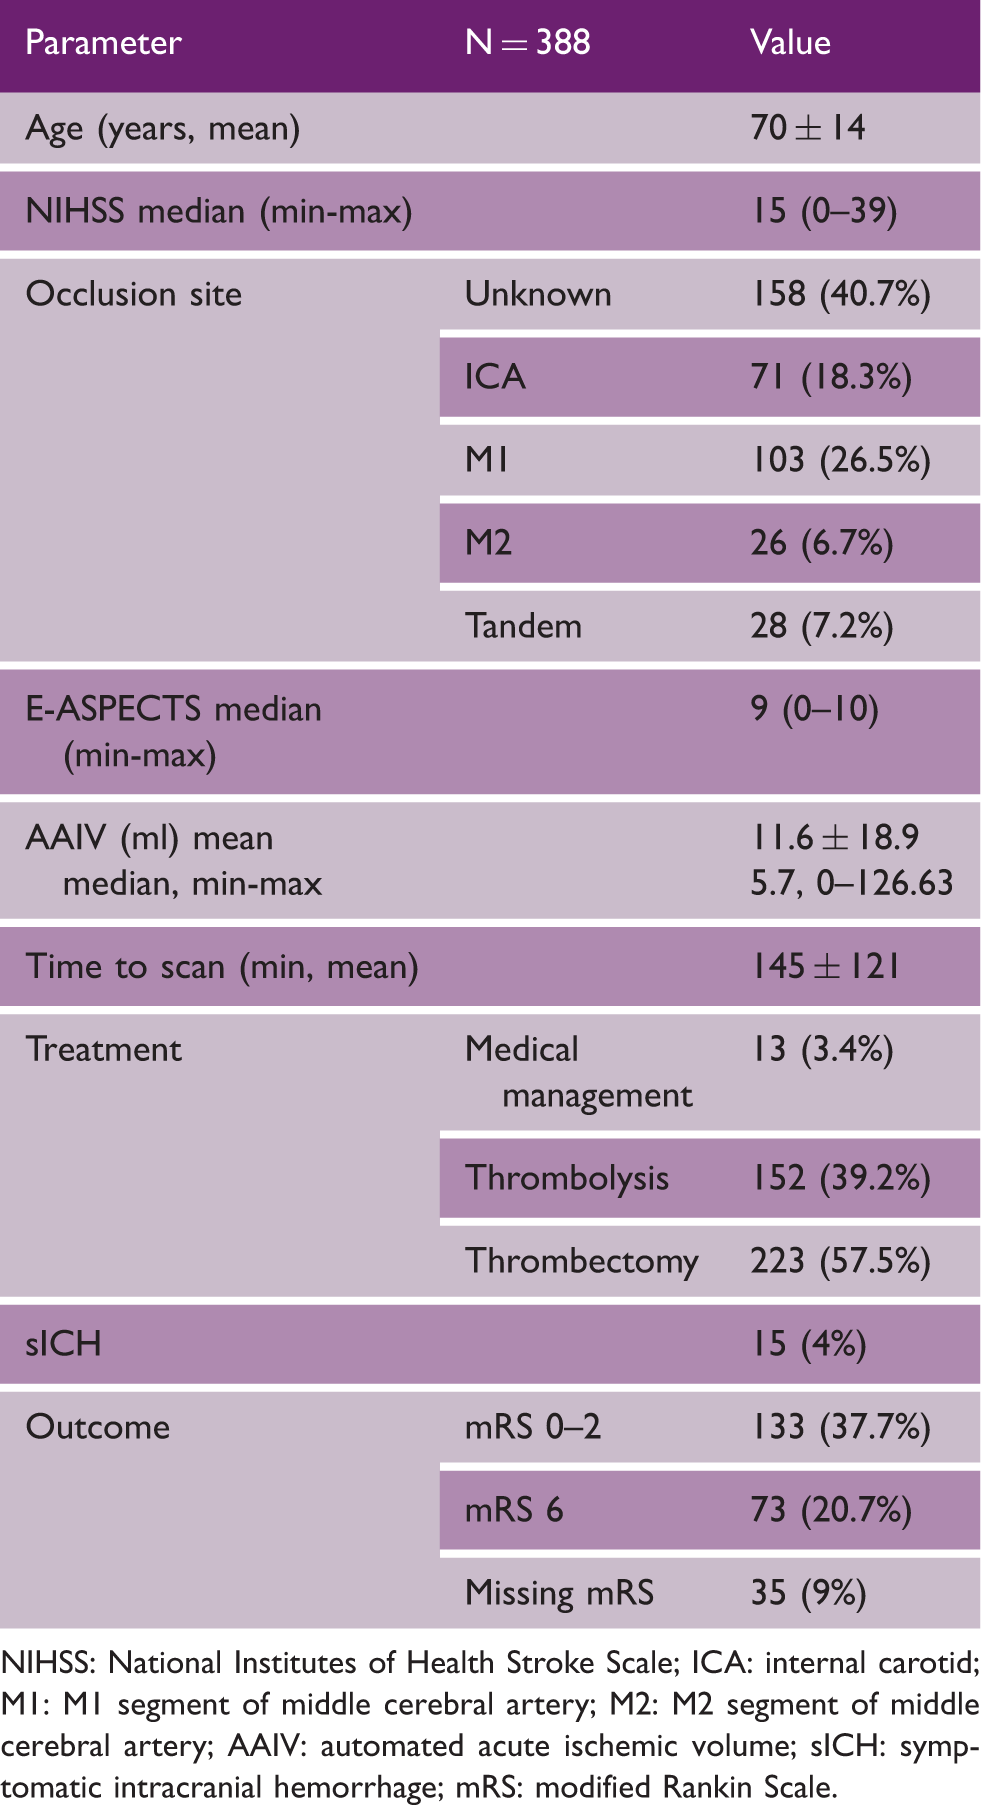
NIHSS: National Institutes of Health Stroke Scale; ICA: internal carotid; M1: M1 segment of middle cerebral artery; M2: M2 segment of middle cerebral artery; AAIV: automated acute ischemic volume; sICH: symptomatic intracranial hemorrhage; mRS: modified Rankin Scale.
Mean AAIV was 11.6 ± 18.9 ml (min-max 0–126 ml), median e-ASPECTS was 9 (range 0–10) and mean TTS was 145 ± 121 min. AAIV and e-ASPECTS correlated strongly (R = −0.86, p < 0.001). AAIV and e-ASPECTS correlated moderately with NIHSS (R = 0.35, p < 0.001; R = −0.36, p < 0.001, Figure 2) and follow-up mRS (R = 0.29, p < 0.001; R = −0.3, p < 0.001).
Scatter plots, regression line (in grey) with 95% CI (bootstrapping, n = 1000) and density plot (blue) indicating distribution and correlation of AAIV (a) and e-ASPECTS (b) with NIHSS at baseline.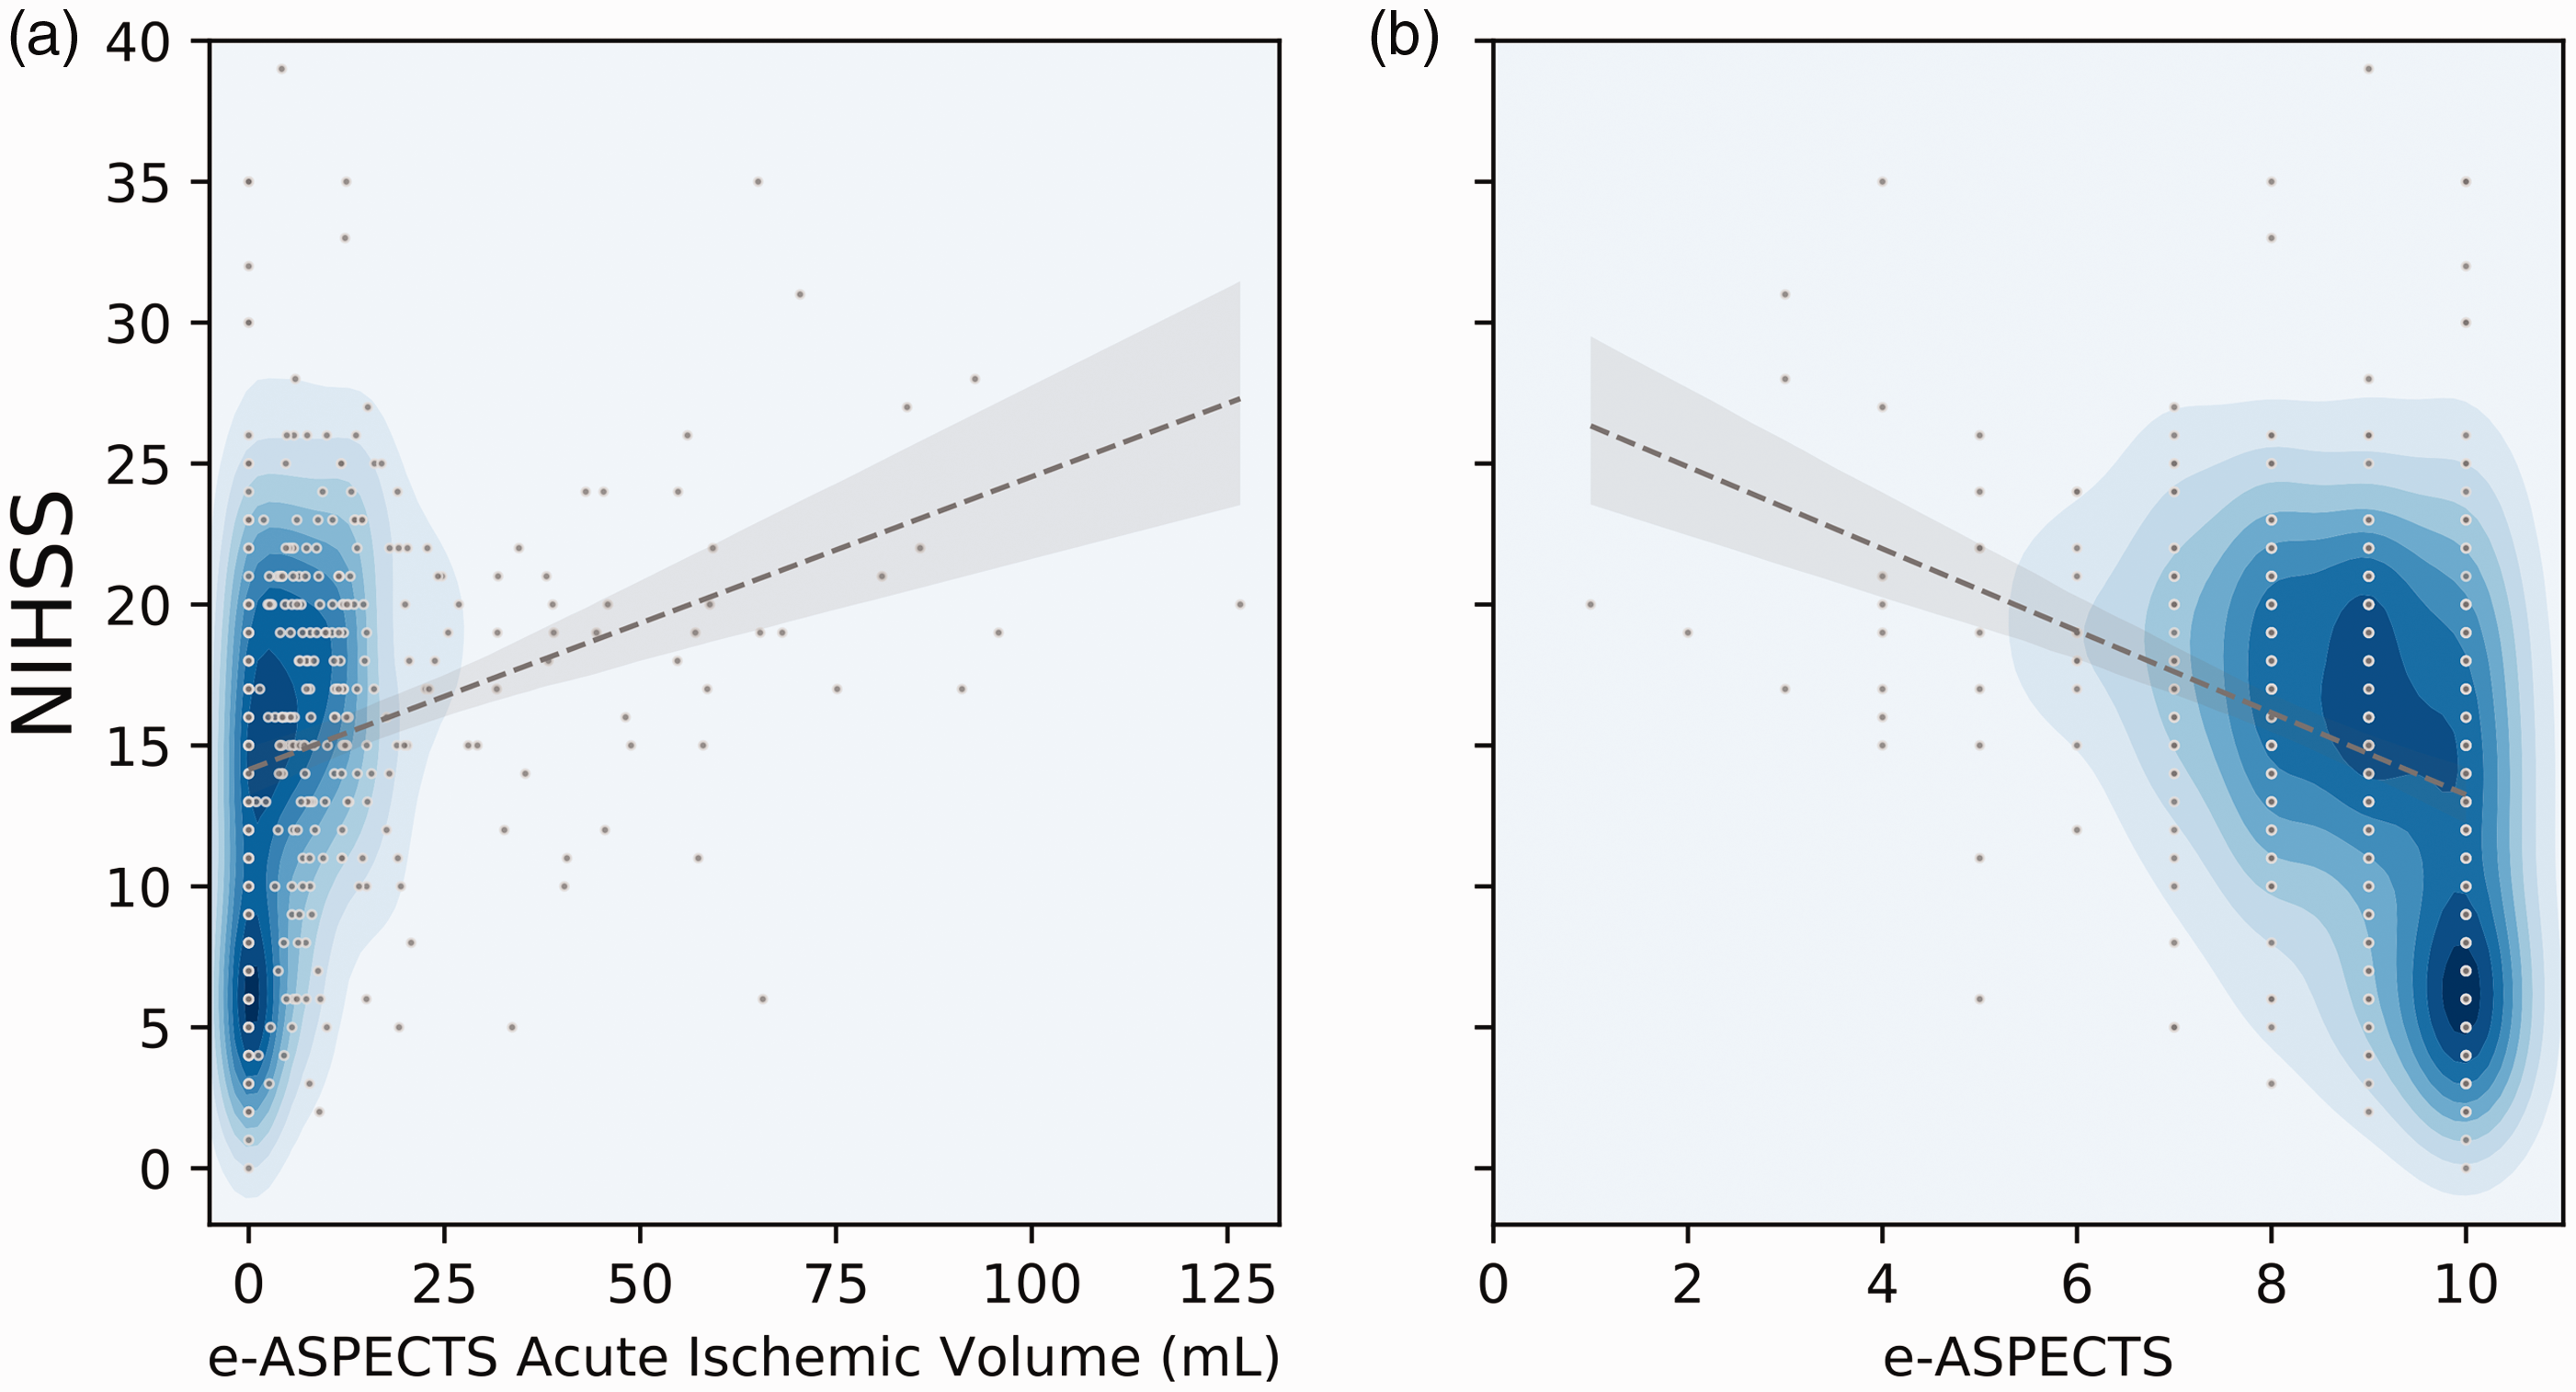
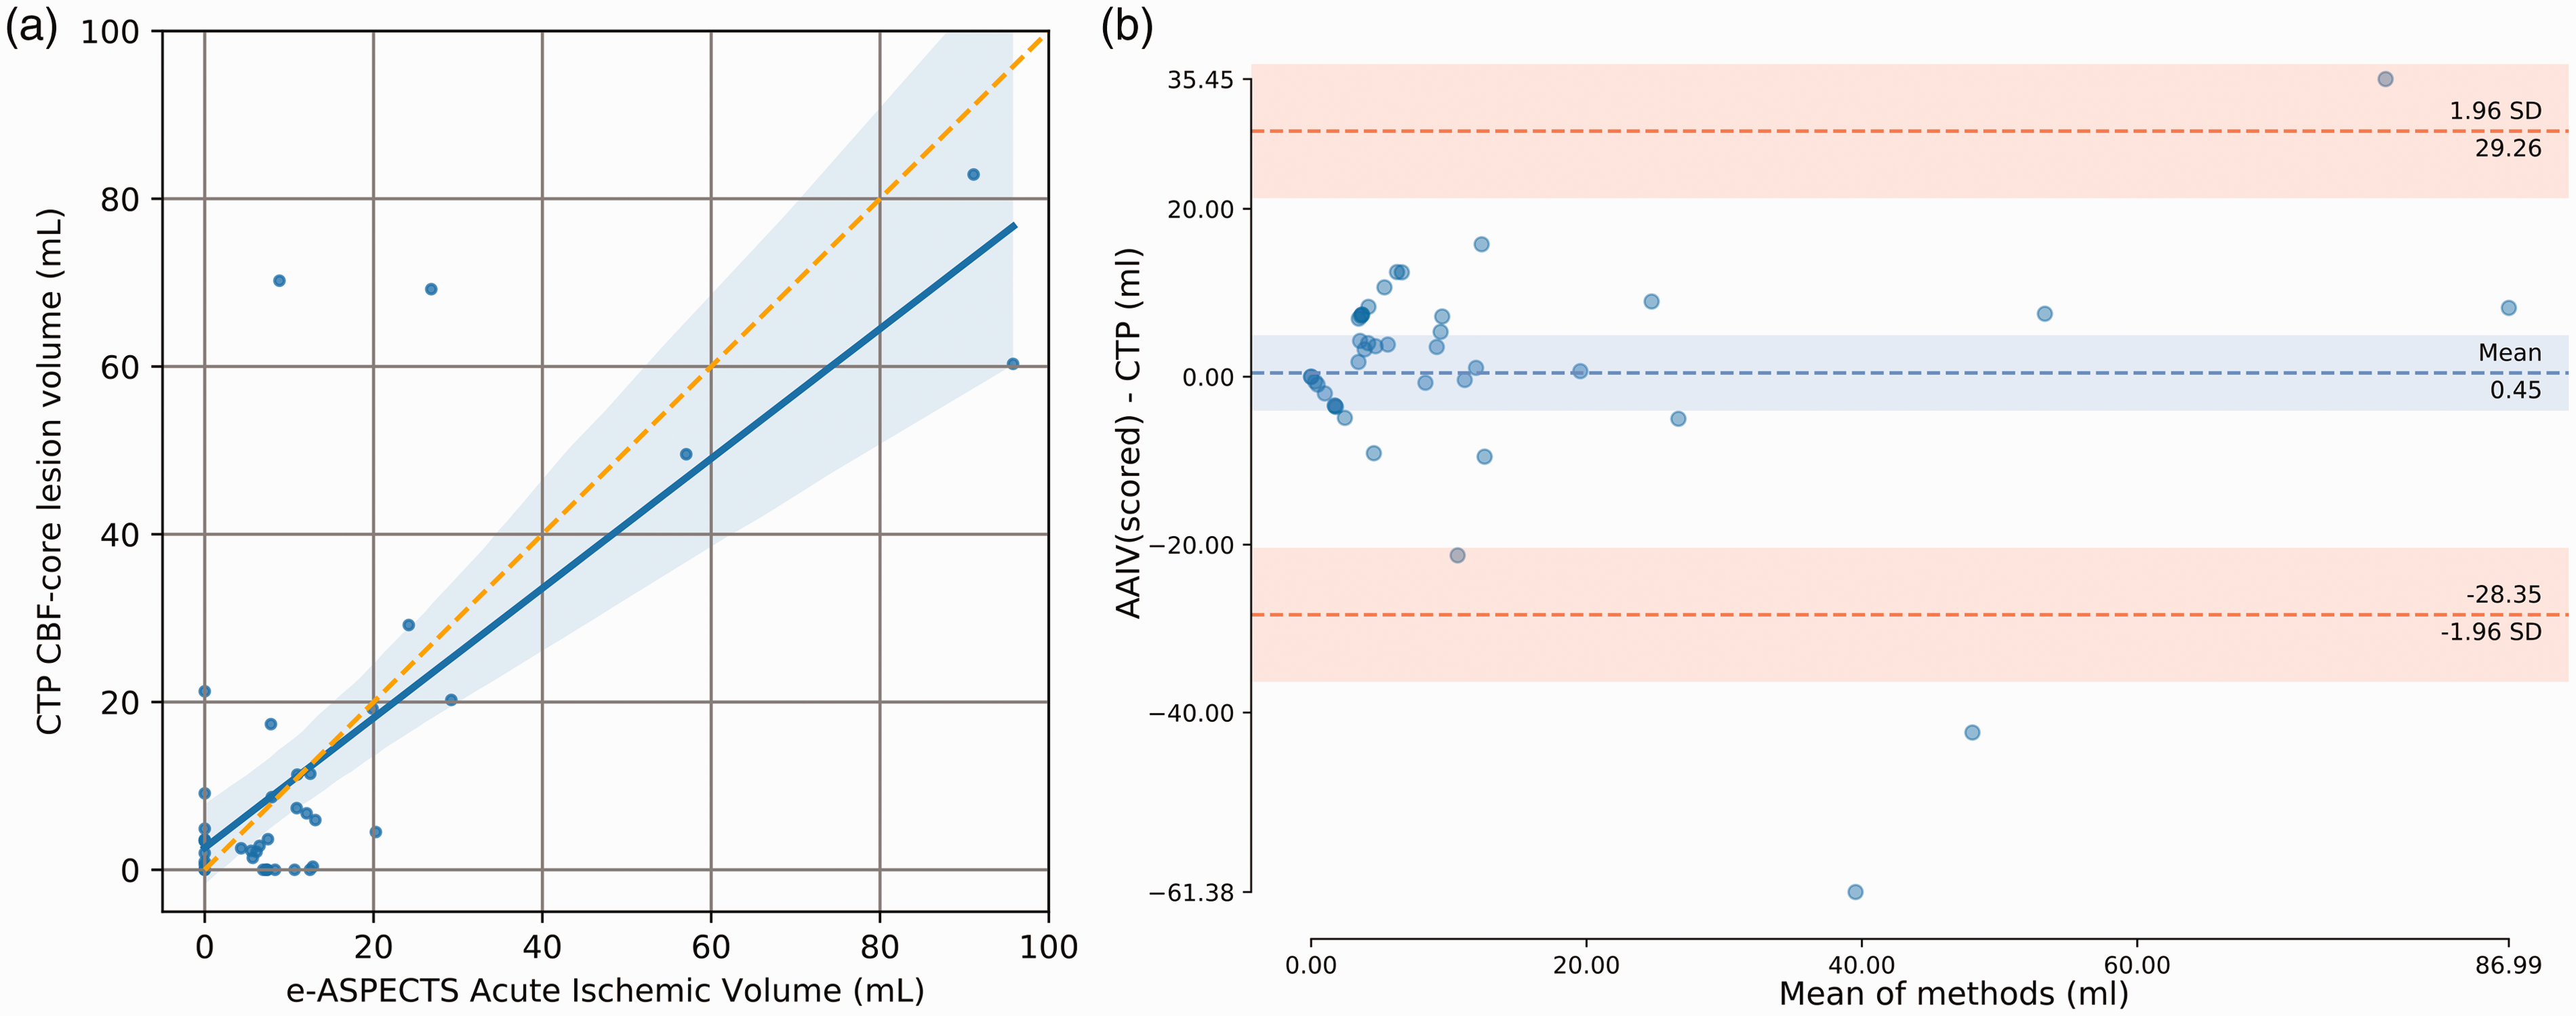
We found a significant correlation of AAIV with DWI-ADC volume (n = 37; R = 0.68, p < 0.001, slope = 0.82, Figure 3(a)). Mean volumes for DWI-ADC and AAIV in these cases were: 14.29 ± 21.26 ml vs. 11.64 ± 15.55 ml. Following the same approach, we correlated AAIV with CTP ischemic “core” volumes in 41 patients. Similarly, we found a strong correlation between CTP “core” volume and AAIV (R = 0.76, p < 0.001, slope = 0.77; Figure 4(a)). Mean volumes for CTP and AAIV within this subset were: 13.14 ± 21.58 ml vs. 13.59 ± 21.16 ml. BA plots show the mean difference (bias) and LOAs line with 95% CI. BA plots show a bias close to zero (−2.65 ml for DWI-ADC and 0.45 ml for CTP-CBF-“core”) and the 95% limit of agreement was [−36.03; 30.73] ml with DWI-ADC and [−28.35, 29.26] ml with CTP-CBF “core” (Figures 3(b) and 4(b)).
Scatter plots indicating correlation of AAIV for scored regions (a) with DWI lesion volumes at baseline (n = 37). The blue shaded line is the 95% confidence interval as estimated with bootstrapping (n = 1000). (b) Bland–Altman plot of the difference between DWI lesion volumes and AAIV. Scatter plots indicating correlation of AAIV for scored regions (a) with CTP ischemic “core” volume (n = 41). The blue shaded line is the 95% confidence interval as estimated with bootstrapping (n = 1000). (b) Bland–Altman plot of the difference between CTP-CBF “core” lesion volumes and AAIV.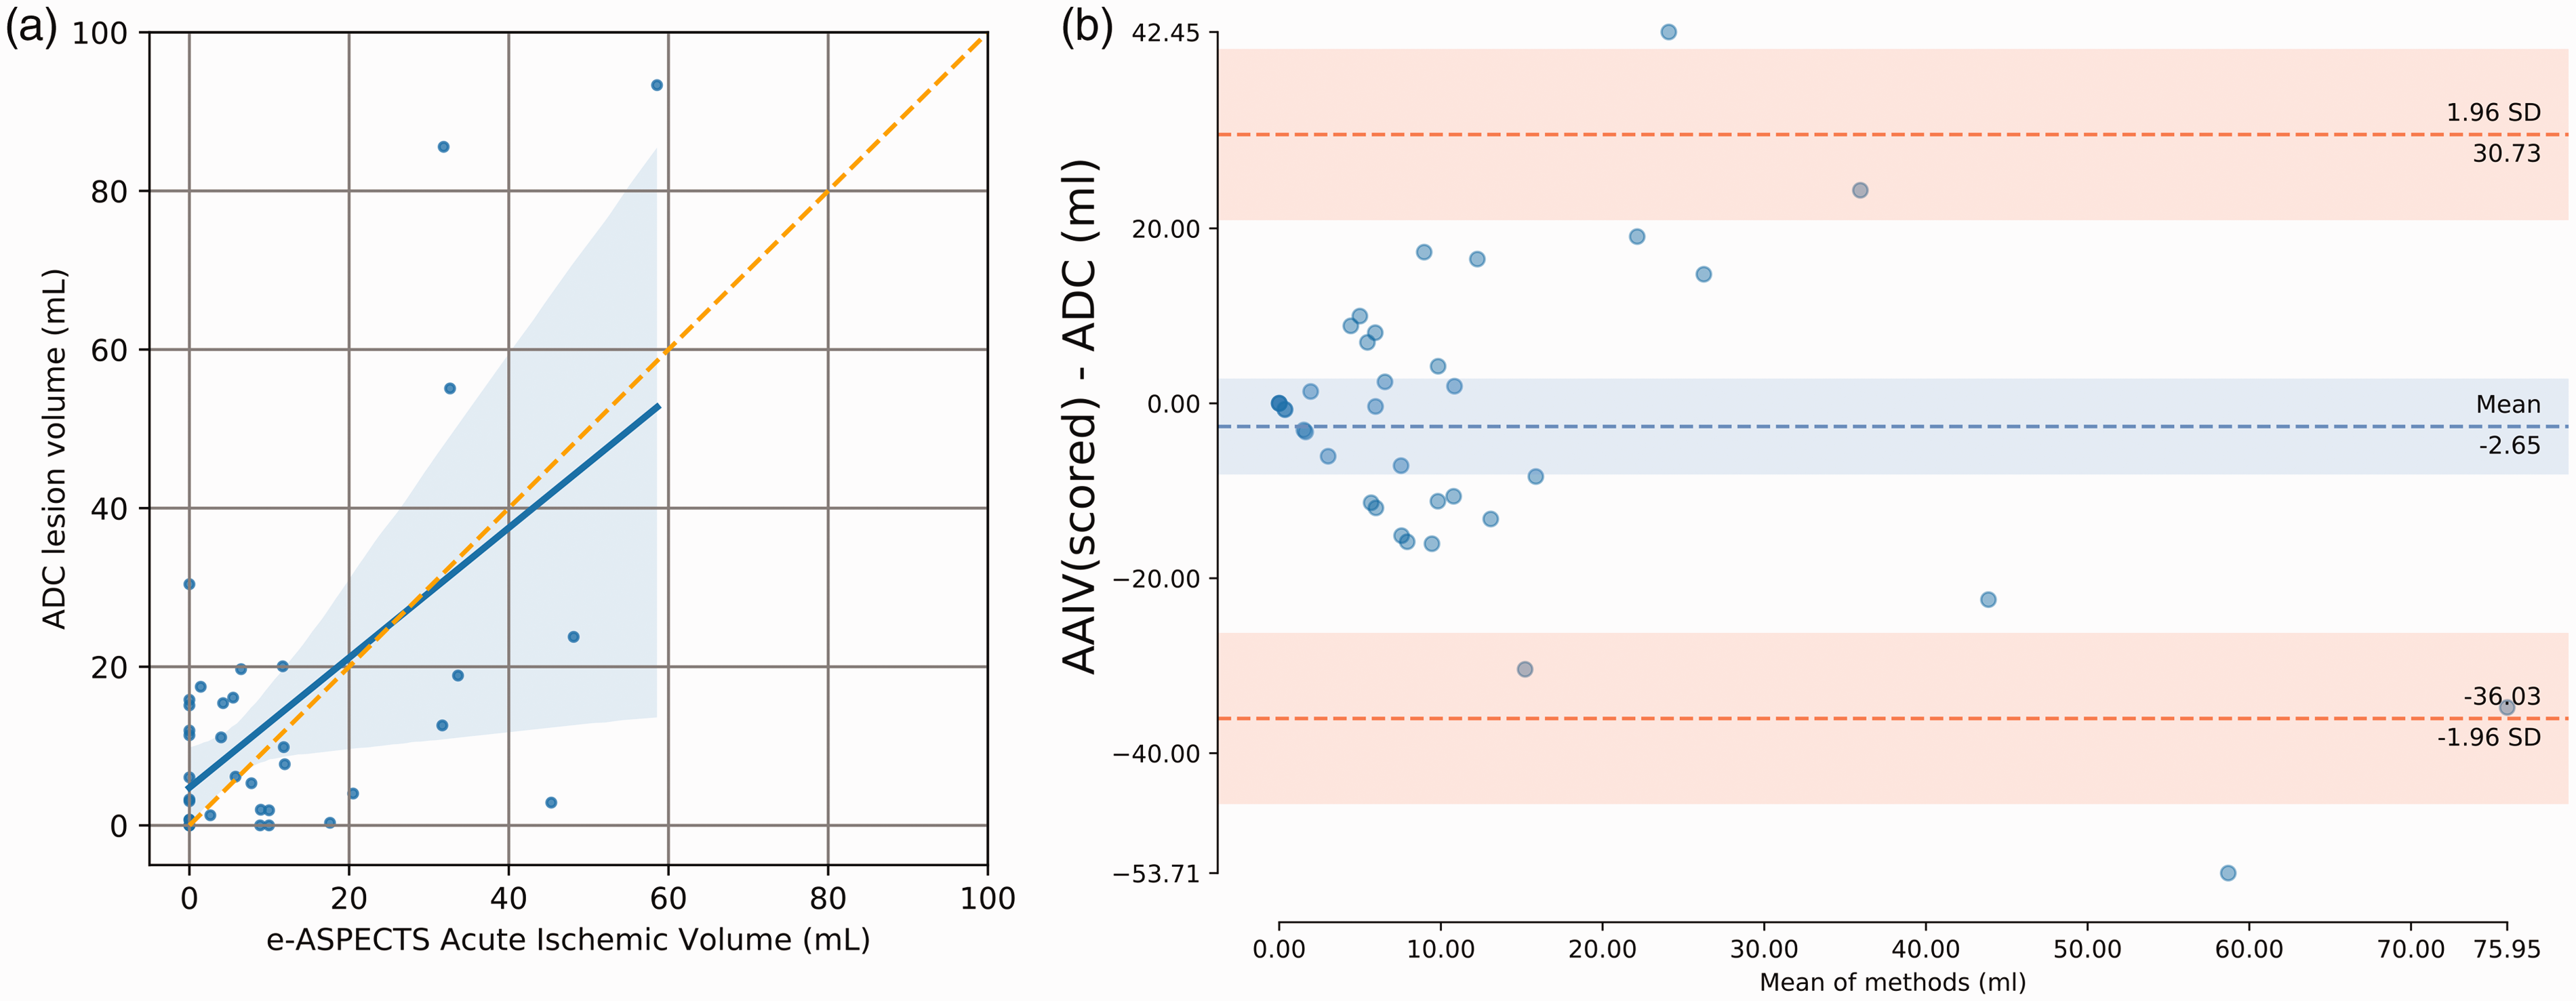
After multivariate analysis, only NIHSS (model 1: OR 0.86, 95%CI 0.82–0.89, model 2: OR 0.86 per point, 95% CI 0.82–0.9), age (model 1: OR 0.97 per year, 95% CI 0.95–0.99, model 2: OR 0.97, 95%CI 0.95–0.99) and either AAIV (model 1: OR 0.98 per ml, 95% CI 0.96–0.99) or e-ASPECTS (model 2: OR 1.3, 95%CI 1.07–1.57) independently correlated with good outcome. The other parameter in the models, i.e. occlusion site, acute treatment modality, TTS were not significantly associated with clinical outcome.
Discussion
In this analysis of 388 selected patients with acute ischemic stroke and different treatment strategies, we found that AAIV and e-ASPECTS scores independently predicted good outcome in this cohort. In subsets of patients, AAIV correlated significantly and strongly with DWI lesion volume as well as CTP-derived estimates of ischemic “core” volumes. BA plots demonstrated a very small bias (between methods) whether we compared AAIV with DWI-ADC or AAIV with CTP-CBF “core”. The LOA were in absolute values between 28.35 ml and 36.03 ml and were slightly narrower for CTP than DWI. It remains difficult to conclude on the full interchangeability of the measurements with LOAs>20 ml. However, for a given patient with <20 ml of AAIV, there is a 95% confidence that the lesion defined by either DWI-ADC or the CTP-CBF is <50 ml which means that for relatively small AAIV lesions, the CTP or DWI defined “core” is likely to be not exceeding 50 ml. Although the average DWI volumes were larger than AAIV, in some cases, AAIV was larger than DWI (or CTP)-derived “core” volume, which makes less physiologic sense than the converse case. The reasons for this can include false positives in the AAIV map due to image artifacts, noise, poor scanner calibration, or comorbidities leading to hypodensity features in the image that are not due to acute ischemia. Furthermore, e-ASPECTS scores and AAIV correlated only weakly to moderately with markers of clinical stroke severity (NIHSS), indicating a significant proportion of patients with a clinical “core” mismatch.
e-ASPECTS is the first imaging software that measures acute ischemic or ischemic volumes on NCCT. The ischemic “core” is commonly estimated by CTP imaging using cerebral blood volume (CBV) or flow (CBF) maps, or restricted diffusion on DWI. However, thresholds for CBV and CBF to determine irreversible ischemic damage do vary between studies.2,14,15 Moreover, reversibility of CBV, CBF, and DWI lesions has been described.16–18 CTP is clearly more sensitive than NCCT to detect cerebral ischemia in the early time frame after symptom onset but CTP may also overestimate the ischemic “core,” 19 and both CTP and DWI are not widely available in all centers. Interestingly, we found a strong correlation of AAIV with both CTP and DWI-derived ischemic “core” volumes in this dataset comprising of patients with a mean symptom to imaging time of under two and a half hours. This highlights a rather good sensitivity of e-ASPECTS in detecting early sings of ischemia on NCCTs. In patients presenting with large vessel occlusions within 6 h after symptom onset, guidelines state, that NCCT is considered sufficient to select patients for mechanical thrombectomy 20 and e-ASPETCS might further assist the clinician in his judgement of the extent of the acute stroke lesion.
AAIV is not expected to strongly correlate with NIHSS especially within the first hours after symptom onset. This is highlighted by a substantial fraction of patients with a clinical “core” mismatch (upper left corner in Figure 1(a)). Functional outcome as measured by the mRS is not only related to baseline ischemic volume but also to the site of occlusion and recanalization success. In this mixed cohort with a large proportion of patients with unknown site of occlusion and unknown treatment success, we still expect further infarct growth after baseline imaging. Hence, the observed correlation of mRS with AAIV was only weak to moderate as well.
This study does have some limitations with the most prominent ones being its retrospective design, and the limited amount of patients with either DWI or CTP imaging for comparison with NCCT. The wide range of clinical baseline severity and treatment modalities can be seen both as a strength (wider applicability) and a weakness (less consisted results) of the analysis. Outcome was not assessed in a blinded fashion and time points varied. Furthermore, ischemic volumes were rather small in this cohort (i.e. small lesions mean less volumetric difference between the applied methods of measurement) and for larger AAIV lesions (>20 ml) we have no reliable data on the volumetric differences between other measures of “core” ischemic estimation. The use of other softwares for DWI lesion and CTP “core” measurements or other thresholds for CBF might have led to different results. More studies are needed to validate our results and establish more generalizable thresholds of AAIV for various patients’ profiles. However, using ischemic volume on NCCT as a continuous variable, as compared to ASPECTS as an ordinal variable, might introduce statistical power and improve utility as a surrogate for treatment eligibility and prediction of outcome in future studies.
In conclusion, e-ASPECTS scores and e-ASPECTS-derived AAIV from NCCT independently predicted clinical outcome in acute ischemic stroke patients and AAIV correlated strongly with DWI lesion volumes as well as CTP ischemic “core” volumes in subsets of patients. AAIV on NCCT using artificial intelligence support may become an interesting biomarker both in clinical trials and routine practice, in particular when DWI or CTP imaging is not available or possible.
Footnotes
Declaration of conflicting interests
The author(s) declared the following potential conflicts of interest with respect to the research, authorship, and/or publication of this article: Personal fees, travel support, speaker honoraria, or research grants were received from Acandis (MAM), Bayer (SN), Brainomix (SN, CH), BMS Pfizer (SN), Boehringer Ingelheim (SN), Codman (MAM), Medtronic (MAM, SN), Microvention (MAM), Phenox (MAM), Stryker (CH, JP, MAM), Siemens (JP) and Stryker (CH, JP, MAM). OJ is a senior clinical scientist at and IQG is cofounder of Brainomix.
Funding
The author(s) received no financial support for the research, authorship, and/or publication of this article.