
Abstract
Background and aims
Clinical predictive models for stroke recovery could offer the opportunity of targeted early intervention and more specific information for patients and carers. In this study, we developed and validated a patient-specific prognostic model for monitoring recovery after stroke and assessed its clinical utility.
Methods
Four hundred and ninety-five patients from the population-based South London Stroke Register were included in a substudy between 2002 and 2004. Activities of daily living were assessed using Barthel Index) at one, two, three, four, six, eight, 12, 26, and 52 weeks after stroke. Penalized linear mixed models were developed to predict patients’ functional recovery trajectories. An external validation cohort included 1049 newly registered stroke patients between 2005 and 2011. Prediction errors on discrimination and calibration were assessed. The potential clinical utility was evaluated using prognostic accuracy measurements and decision curve analysis.
Results
Predictive recovery curves showed good accuracy, with root mean squared deviation of 3 Barthel Index points and a R2 of 83% up to one year after stroke in the external cohort. The negative predictive values of the risk of poor recovery (Barthel Index <8) at three and 12 months were also excellent, 96% (95% CI [93.6–97.4]) and 93% [90.8–95.3], respectively, with a potential clinical utility measured by likelihood ratios (LR+:17 [10.8–26.8] at three months and LR+:11 [6.5–17.2] at 12 months). Decision curve analysis showed an increased clinical benefit, particularly at threshold probabilities of above 5% for predictive risk of poor outcomes.
Conclusions
A recovery curves tool seems to accurately predict progression of functional recovery in poststroke patients.
Introduction
Stroke is the most common cause of adult physical disability and the third most common cause of death worldwide.1–3 It is estimated that 25–74% of the 50 million stroke survivors worldwide require some assistance or are dependent on caregivers for activities of daily living.4–6
Despite the introduction of effective treatments for acute stroke, early rehabilitation and secondary prevention, the majority of stroke survivors have medical comorbidities, physical, and/or cognitive impairments that require ongoing active assessment and management. 3 Clinical prediction of the recovery is an important medical aim for the many people who survive stroke. First, it could help early planning of rehabilitation and longer term management. Second, it might provide early warnings or triggers for those who fail to recover as predicted. Third, knowing in advance when a poor health outcome might occur would allow survivors and their carers to plan accordingly. Therefore, a practical and accurate tool to assist in predicting functional recovery after stroke at patient level could provide significant aid for patient management and cost of health delivery.7,8 Furthermore, a prediction model of functional recovery trajectory can be useful as a tool for clinical research, health economics policy making, and clinical decision support. 9
Recent published prognostic tools for stroke functional recovery include the ASTRAL (90% accuracy for classifying modified Rankin Scale (mRS) > 2 at three months), 9 the PLAN score (89% accuracy for predicting mortality and mRS 5–6 combined at discharge), 10 six simple variables model (84% accuracy for mortality and mRS < 3 combined at six months), 11 and the iScore (79% accuracy for mortality or mRS 3–5 combined at 30 days). 12 However, these studies used predictions for one specific time point which does not allow for the complexity of changes of functional recovery over time or for the variety of confounders that may alter the functional recovery trajectory. Furthermore, they do not distinguish between whether higher functional ability is due to an overall improved functional ability that is already present at the early stage, or due to improved functional recovery over time, or due to both. Thus, they have limited utility for clinical applications which require ongoing active assessment and monitoring of stroke patients.
Stroke recovery is a complex process in its nature, and individual functional recovery patterns differ across subpopulations and time. 13 Current practice makes use of clinicians’ expert judgments based on a number of factors at the onset such as age, stroke severity, consciousness, and stroke subtype. A recovery curve predictive model could potentially provide an equivalent prognostic tool that could support decision-making process at any time after stroke. Detailed longitudinal data and methods may be more appropriate to accurately capture stroke recovery with the aim of designing a tool that could assist in planning immediate and midterm care for individual patients.14,15 Several studies have hypothetically suggested that recovery of body function and activities could be predictable after stroke.14–16 In this study, we developed and validated a novel patient-specific predictive model of functional stroke recovery trajectories over time and evaluated its clinical utility.
Materials and methods
Case ascertainment
Four hundred and ninety-five patients from the ongoing population-based South London Stroke Register (SLSR) between the period August 2002 and October 2004 were included in the development cohort. One hundred and forty-nine new patients registered between August 2005 and October 2011 were included in the validation cohort. The methods of the SLSR data collection have been described previously in detail5,17 and are summarized here. All patients with a first ever stroke after 1 January 1995 and residing in a defined inner-city area of South London were eligible to be registered into the prospective, ongoing register. According to the 2011 Census this area (northern parts of Southwark and Lambeth; n = 357,308) comprises a distinctly multiethnic population with a large proportion of black Caribbean and African residents (25.3%). Stroke was defined according to WHO definition of stroke. 18 Case ascertainment was estimated as 88% complete by a multinominal-logit capture–recapture model. 5
Outcome measure and prognostic indicators of functional recovery
The functional recovery was evaluated using Barthel Index (BI) 19 with total possible scores range from 0 to 20, with lower scores indicating increased disability. BI was measured at weeks one, two, three, four, six, eight, 12, 26, and 52 after stroke. In the development cohort, patients were followed for a mean duration of 28.5 weeks and were measured on a mean of five occasions (range 1–9). Patients with fewer than two observations (n = 31) were excluded from the modeling procedure. The external temporal cohort includes data of 1049 newly registered stroke patients between 2005 and 2011 with Barthel measured at up to three time points, one, 12, and 52 weeks. The final model was built using 2416 observations across 462 patients from the development cohort. All potential predictors of functional recovery were considered in the model variable selection, including demographics (age, sex, ethnicity, premorbid disability, socioeconomic status), stroke characteristics (subtype based on the Oxford classification (lacunar infarct (LACI), total anterior circulation infarcts (TACI), partial anterior circulation infarcts (PACI), posterior circulation infarcts (POCI), and hemorrhagic stroke), presence of cerebellar symptoms, case-mix variables (Glasgow coma score (GCS), NIH stroke scale (NIHSS)). 20 These predictors were screened for practicality based on their clinical availability, ease of measurement, prevalence in academic literature, and on biological reasoning, resulting in a set of candidate prognostic factors.
Model development and validation
Penalized mixed models 21 were adapted to develop recovery trajectories model which predicts the functional recovery for a patient with the selected prognostic factors. An additional inverse square root term of time was included into the model as it significantly increased the prediction of the recovery model. Repeated random subsampling cross-validation methods were used to select best competing models and model parameter. 22 Missing values were imputed using Markov chain Monte Carlo methods. 23 Leave-one-out cross-validation was used to assess the performance of the developed prognostic recovery curve model. R2, absolute mean error, and root-mean-square deviation (RMSD) were considered together to estimate the predictive error in both, the development and the external validation cohorts. Patient age, sex, NIHSS, GCS (dichotomized: 15; or less than 15), stroke subtype (LACI, PACI, POCI, TACI, hemorrhage), and interactions between predictor variables and the inverse square root term of time in weeks were identified as good independent predictors of recovery over time. The resulting multivariable model of predicted BI is described in the online material (Appendix 1).
Clinical utility
We plotted recovery curve trajectories to visually inspect different well-defined at-risk subgroups. Average predicted recovery patterns were analyzed by age, stroke subtype, GCS, and NIHSS. 16 To assess the prognostic effectiveness and clinical utility of predicted recovery curves to identify different functional outcomes at different time points, we dichotomized functional recovery using three thresholds (8, 12, and 17). These thresholds correspond to poor outcome if BI < 8 (representing complete dependence on others), good outcome if BI > 12 (transition from complete dependence to assisted independence), and independence if BI > 17 (representing independence with minor assistance as could be reasonably provided in a community setting). 24 We then evaluated the clinical utility at these thresholds of the predicted recovery curves to classify good, poor, and independent outcome at both three and 12 months. These were evaluated in the external cohort using area under the receiver operator curves for discrimination and using calibration plot and Hosmer–Lemeshow test for calibration.
Decision curve analysis (DCA)25,26 method was performed in order to evaluate further the clinical usefulness of recovery curves in prognostication of poor outcome at both three and 12 months. DCA is a method to assess the added value of information provided by a prognostic test across a range of a patient’s risks and benefits to facilitate clinical decisions, without the need for actually measuring these for individual patients. The DCA is expressed graphically as a curve, with the clinical net benefit on the vertical axis and probability thresholds on the horizontal axis. The net benefit of prediction models was then evaluated by adding the benefits (true positives) and subtracting the harms (false positives). The weight assigned to true positives and false positives was derived from the threshold probability of the outcome. When the curve is at its highest over the range of probability thresholds, the associated intervention would be the best decision.
Ethics
Patients, or for patients with communication problems their relatives, gave written informed consent to participate in stroke-related studies within the SLSR. The design was approved by the ethics committees of Guy’s and St Thomas’ NHS Foundation Trust, Kings College Hospital, Queens Square, and Westminster Hospitals (London).
Results
Characteristics of stroke patients

BI: Barthel Index; IQR: interquartile range; LACI: lacunar infarct; NIHSS: NIH stroke scale; PACI: partial anterior circulation infarcts; POCI: posterior circulation infarcts; TACI: total anterior circulation infarcts.
The predictive recovery curves showed an excellent fit and prediction. In the internal cross-validation, predictive error RMSD over all time points was 3 BI points, mean absolute error 2 BI points, and a R2 of 77%. Predictive accuracy of the model was also good in the external validation cohort with a RMSD of 2.83 BI points, mean absolute error of 1.72 BI points, and a R2 of 83%. Figure 1 presents the average predicted recovery patterns with comparison to the average observed BI after stroke.
Average observed and predicted recovery patterns trajectories after stroke.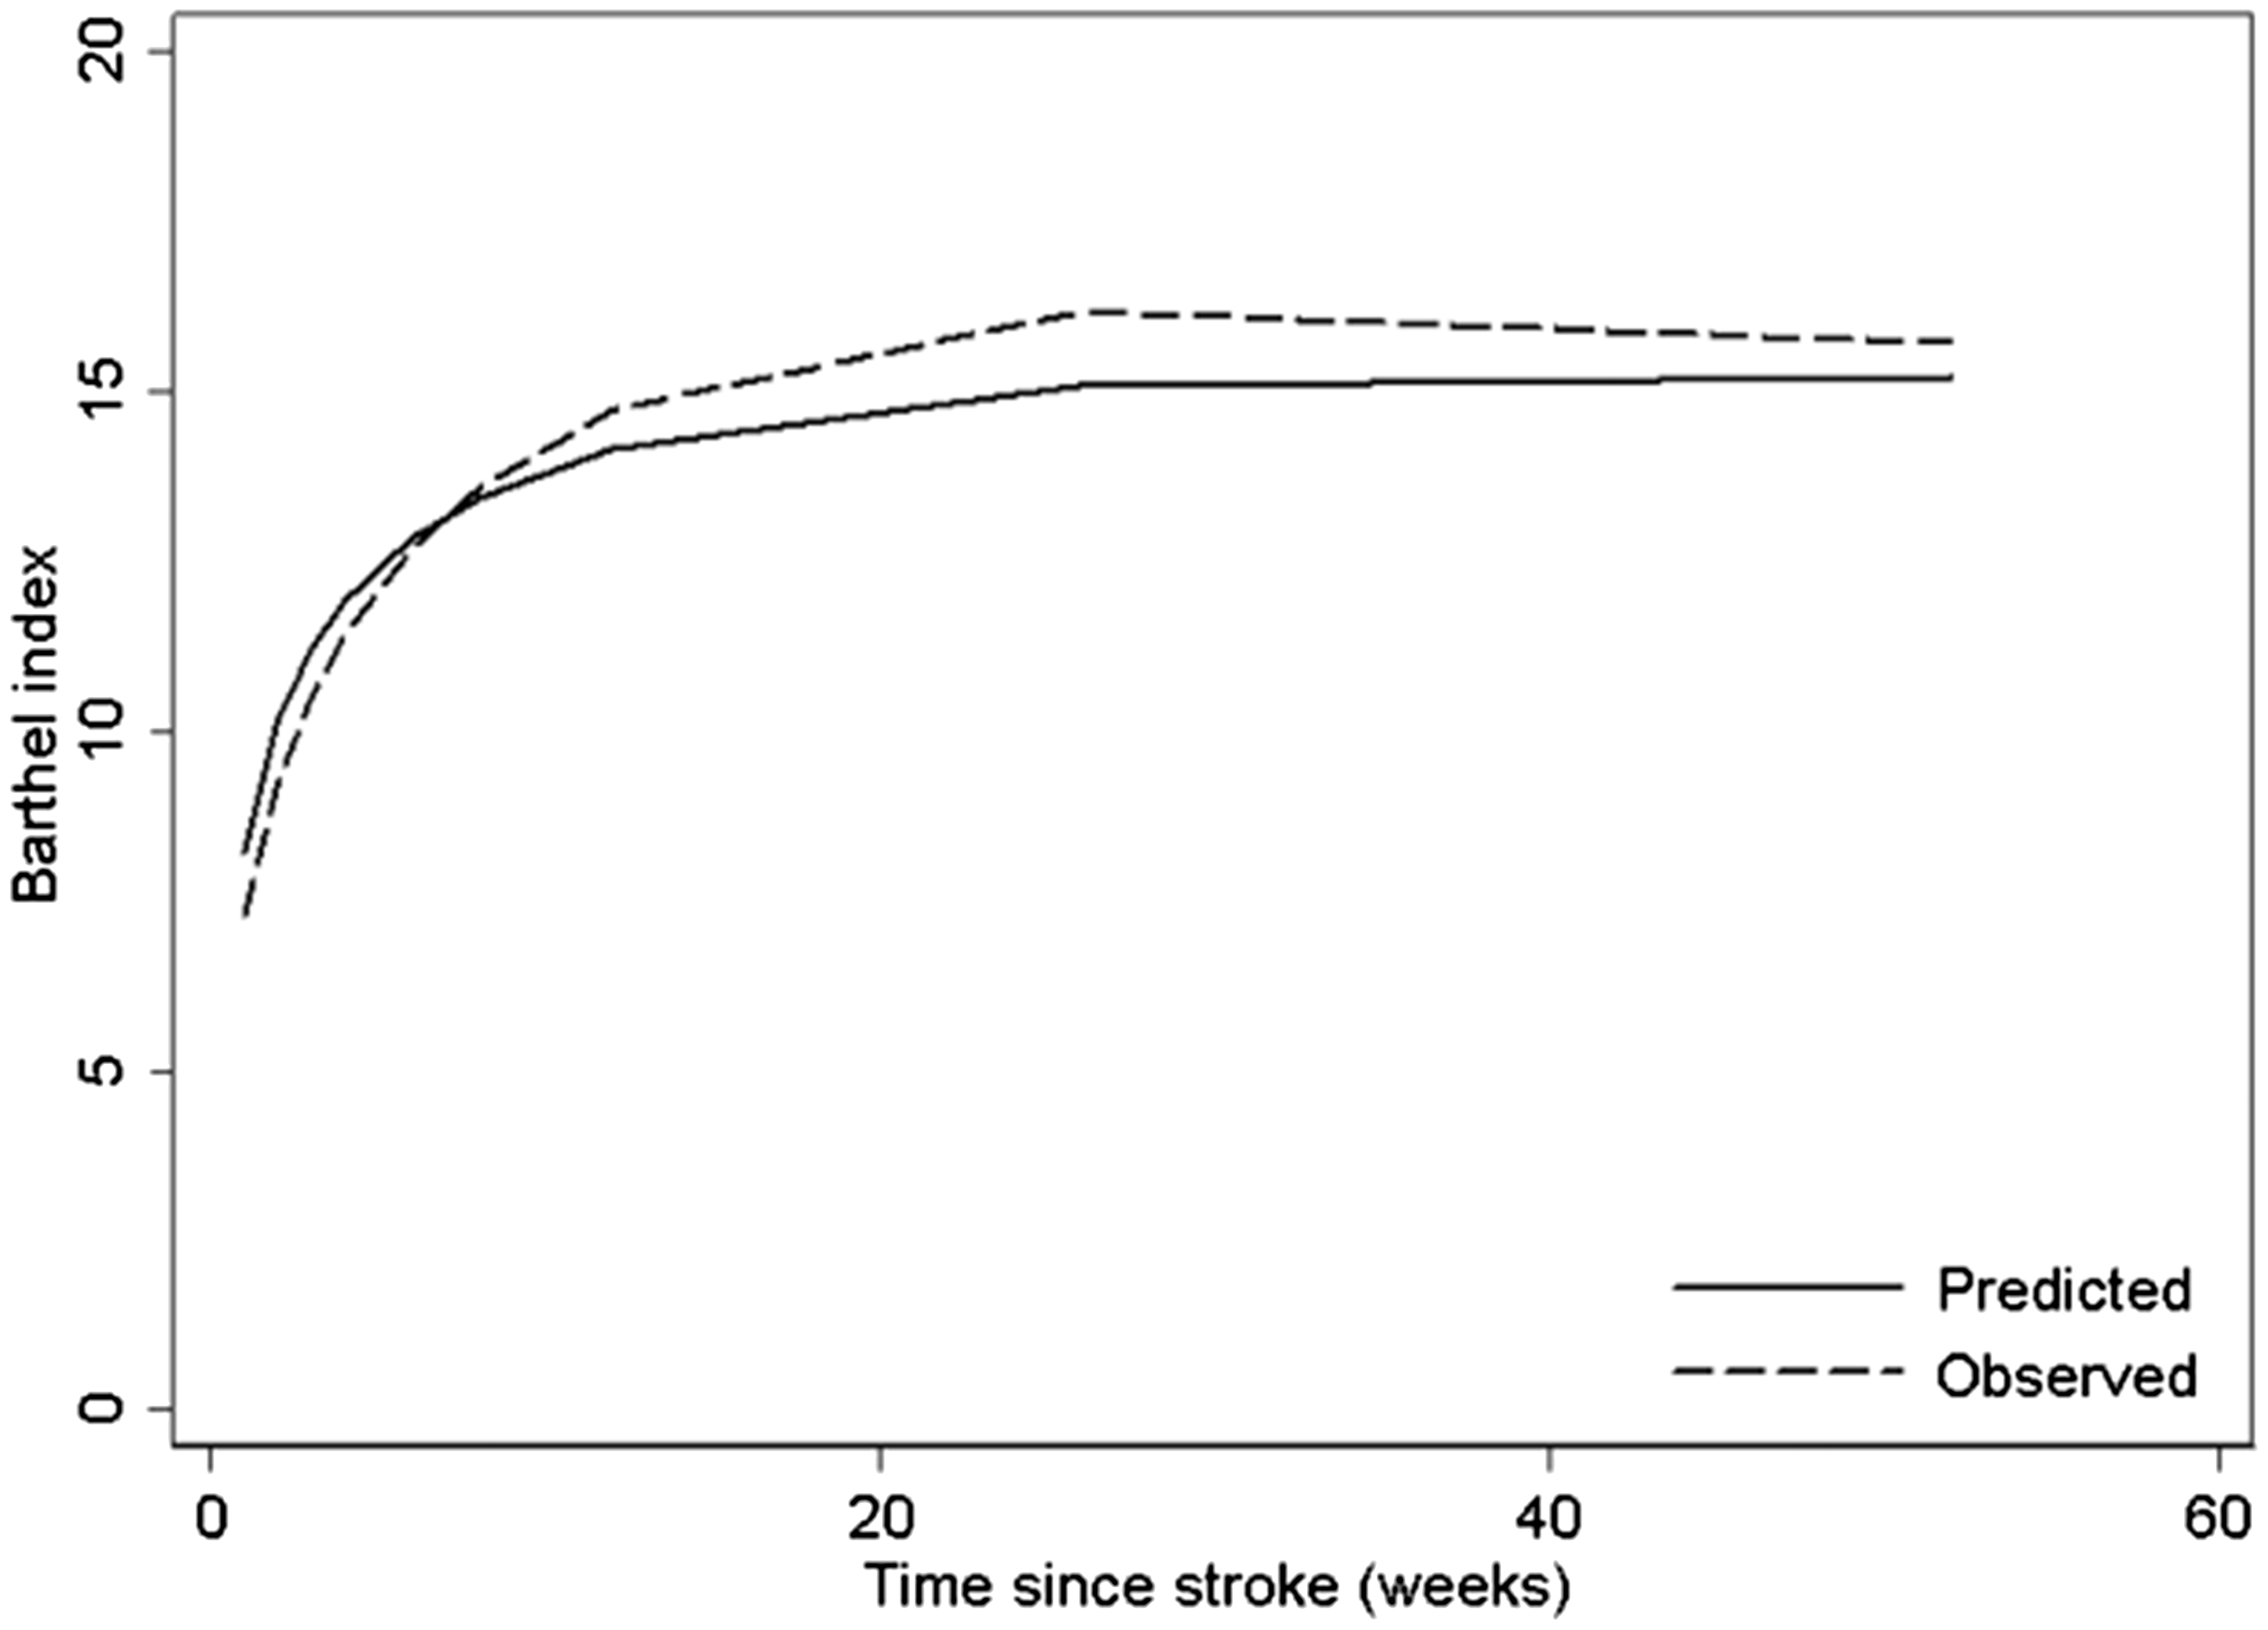
Average recovery was characterized by a steep increase in BI over the first eight weeks followed by a more gradual period of recovery reaching its apex at around 12 weeks. Depending on patient characteristics considered in the model, predictive curves showed peaks ranging from 8 to 32 weeks. Recovery was inversely associated with NIHSS and age, and had a positive association with GCS. Subtype had a variable influence on recovery, with POCI and LACI showing the most immediate (∼8 weeks) recovery with the highest, and roughly equivalent, peaks. Hemorrhage and PACI showed the next quickest and complete recovery, by 12 weeks. TACI showed longer spontaneous neurological recovery, peaking at around 32 weeks and a marked decline subsequently. Figure 2 presents recovery patterns after stroke stratified by age group, stroke subtype, GCS, and NIHSS.
Average predicted recovery patterns after stroke stratified by age, stroke subtype, GCS, and NIHSS. GCS: Glasgow coma score; NIHSS: NIH stroke scale.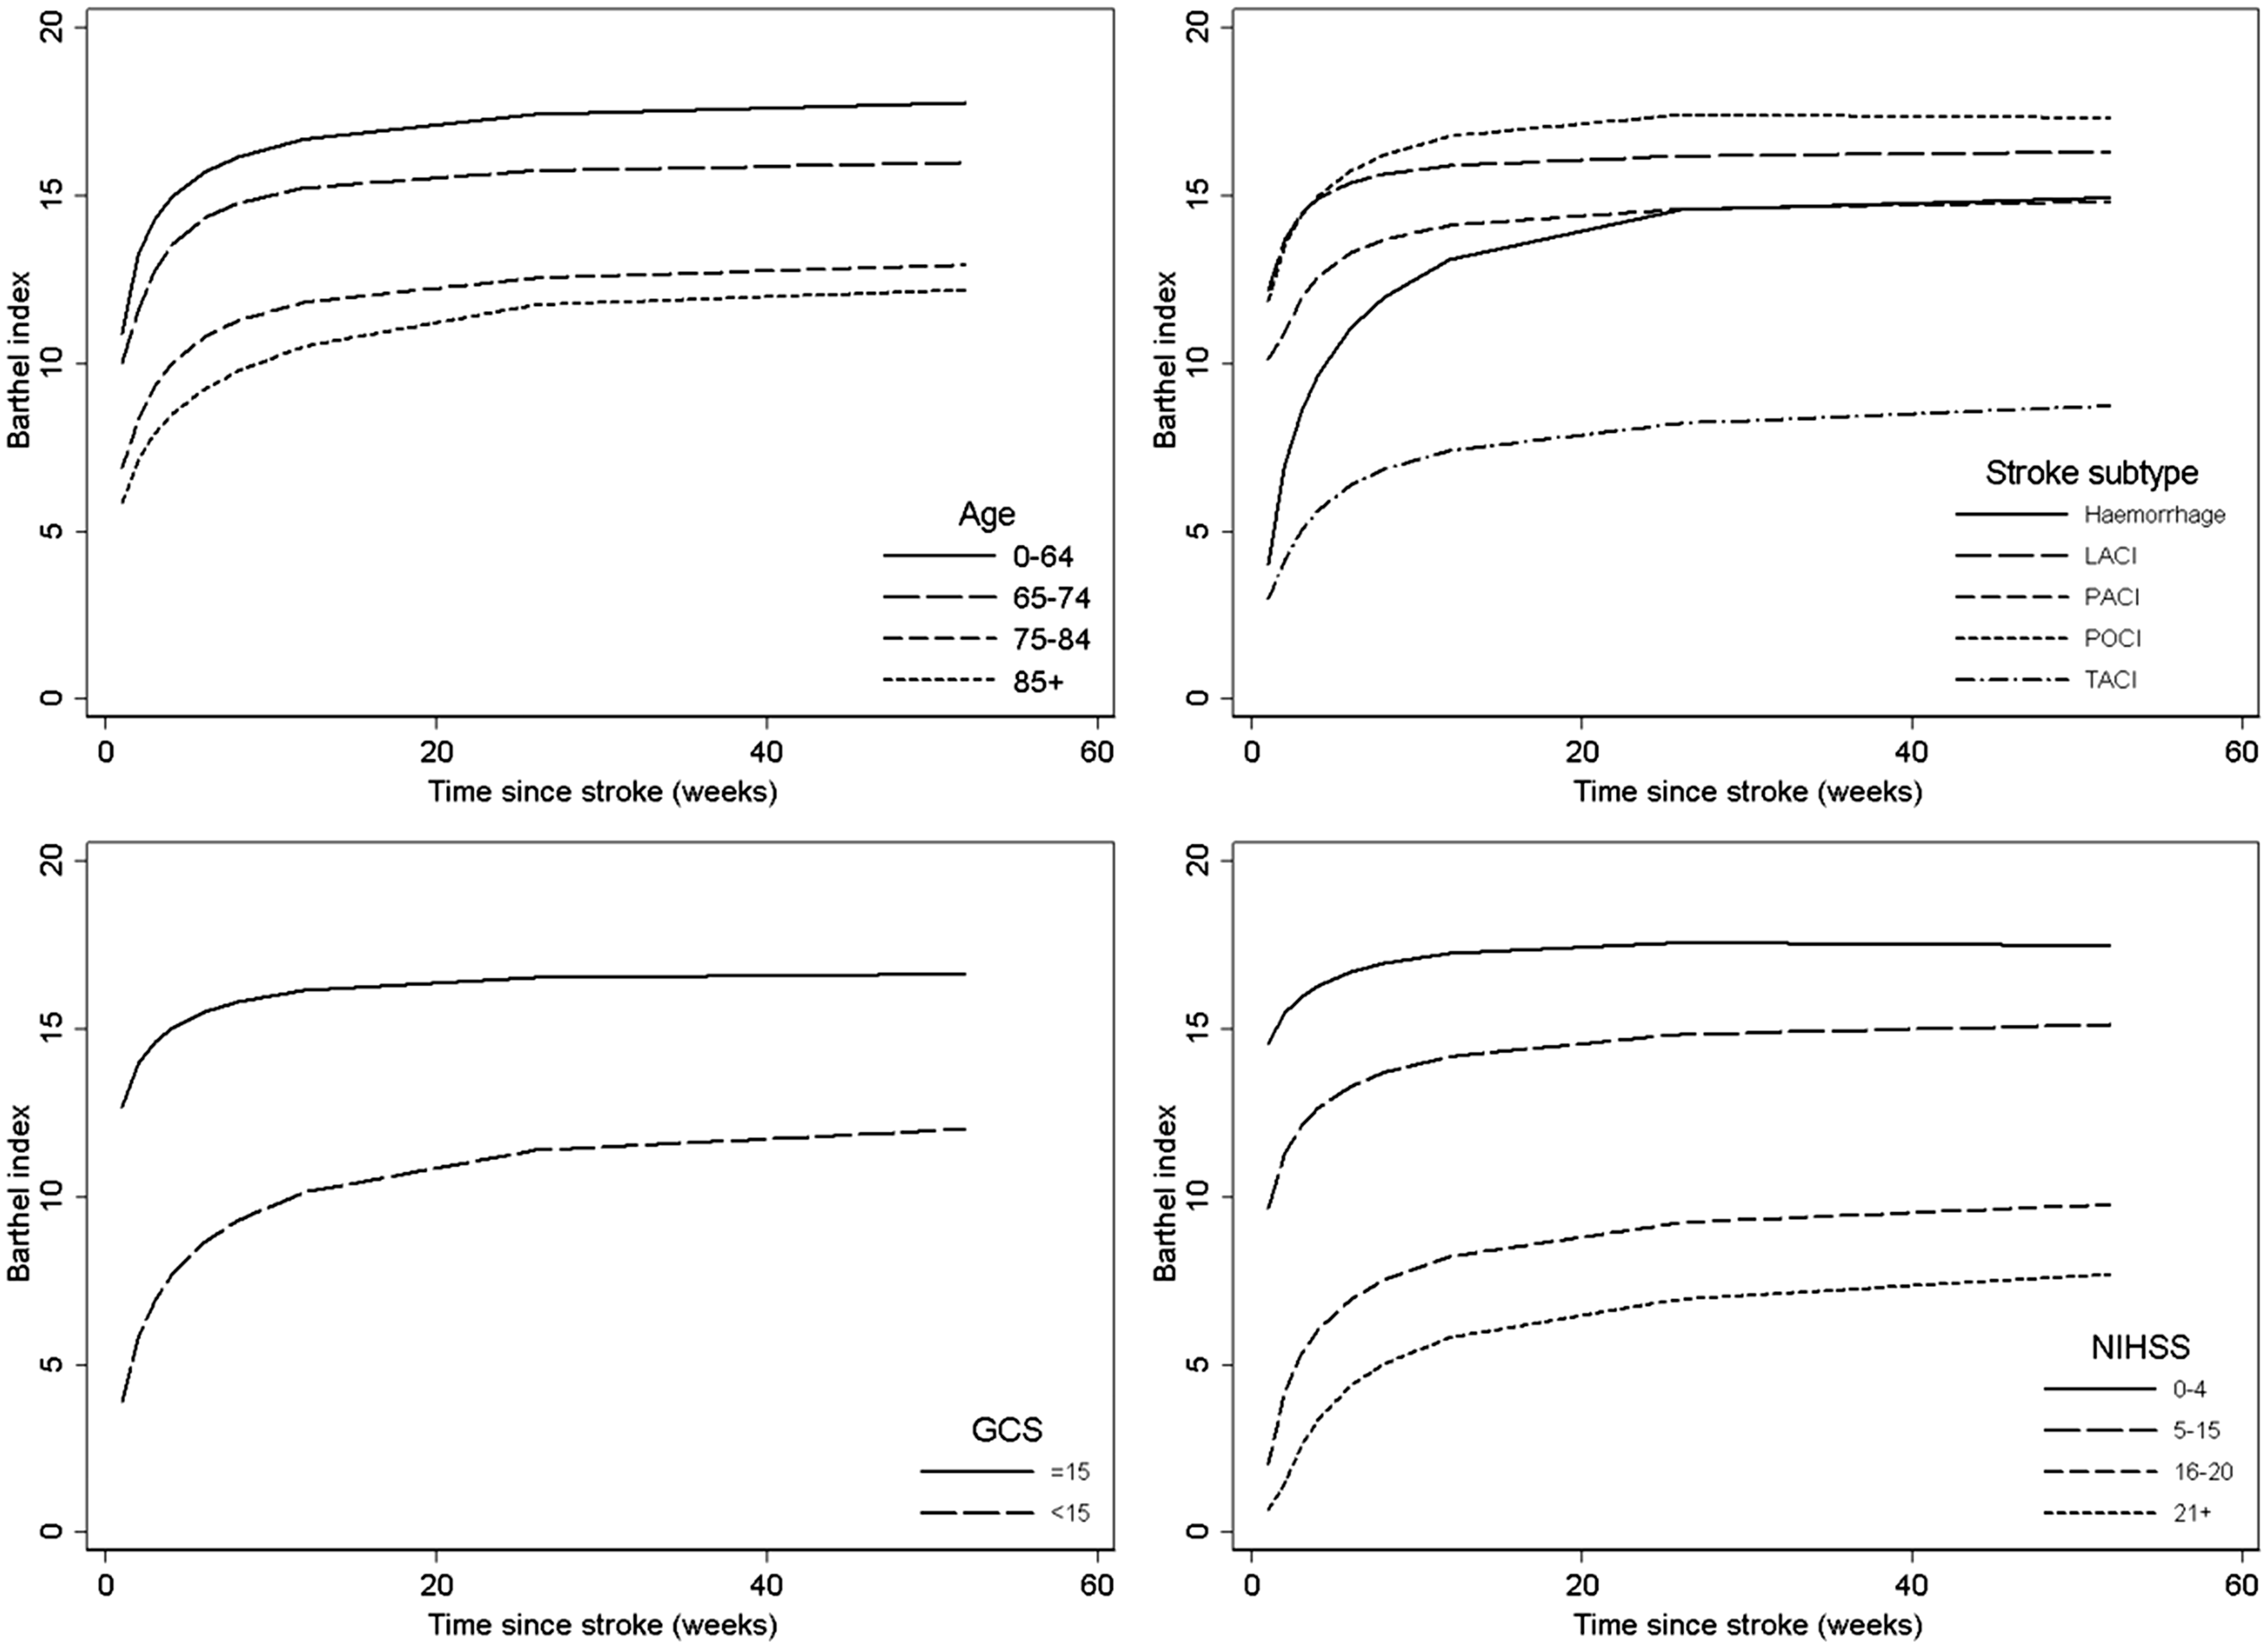
Recovery curve models were further evaluated to define a set of rules with appropriate sensitivity and specificity to usefully identify patients with poor recovery patterns. Figure 3 presents discrimination and calibration analyses of predicting functional outcomes at three and 12 months in the temporal external validation cohort. The sensitivity and specificity in the external validation at three months were excellent: 71 [58.8–81.3] and 96 [93.6–97.4] for poor outcome, 88 [84.3–90.7] and 82 [73.7–89.0] for good outcome, and 80 [74.9–83.7] and 83 [77.2–87.9] for community independence.
Receiver operating characteristic (top) and calibration plots (bottom) of recovery at three (left) and 12 (right) months in the validation cohort.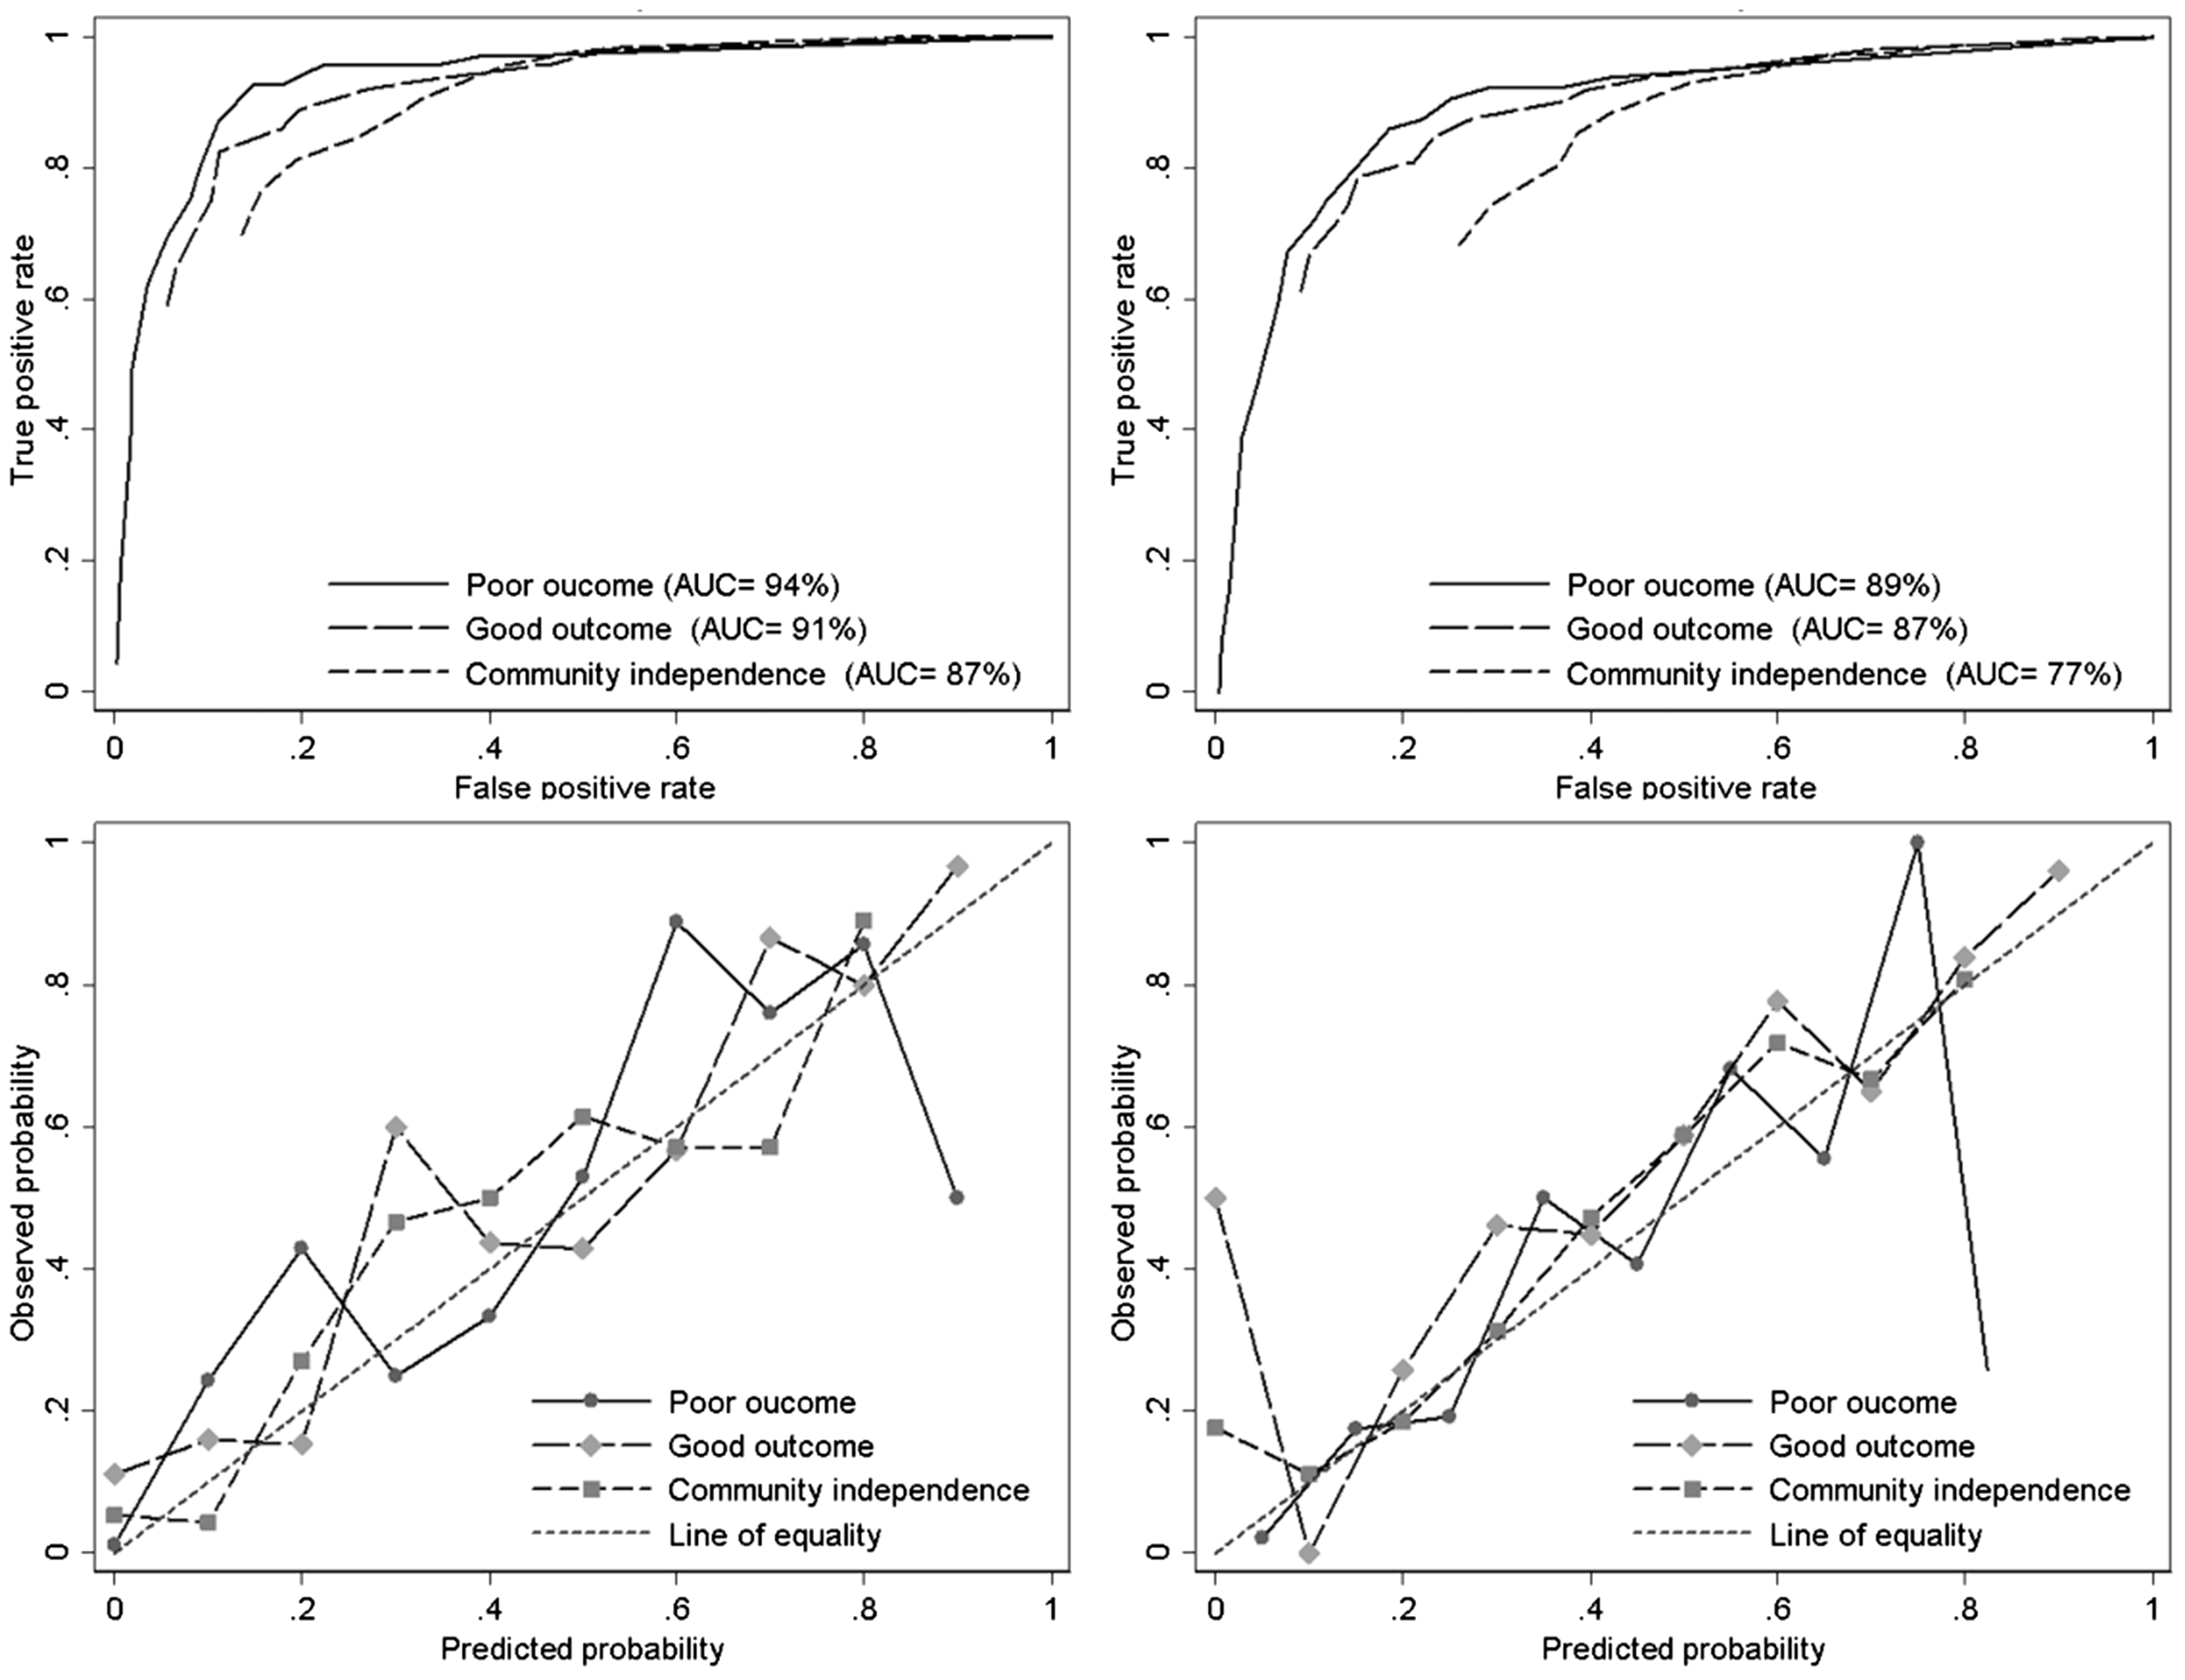
Prognostic performance and clinical utility for recovery outcomes at three and 12 months in the validation cohort

AUC: area under the curve; BI: barthel index; HL: HosmerLemeshow; LR: likelihood ratio; NPV: negative predictive value; PPV: positive predictive value.
The net benefit as a function of a threshold probability of poor outcomes at three and 12 months was illustrated in Figure 4. The gray line was drawn to reflect the strategy of “assume all patients have poor outcomes” (i.e. recommend intervention for all), and the black line was drawn to reflect the strategy of “assume all patients would have good outcomes” (i.e. do not recommend any intervention). As expected, these two lines cross at the prevalence of poor outcome, 13% for three months and 11% for 12 months. The net benefit was maximized by the recovery curves predictive model (dash line) with threshold probabilities of 5–71% at three months and 7–57% at 12 months. For higher thresholds (>71% for three months or >57% for 12 months) where the concerns are more about unnecessary interventions than missed prognosis, the option to not intervene was preferred. In this case, strategies aided by recovery curves prediction have no value.
Decision curves for recovery curves to predict poor functional recovery in stroke survivors at three (top) and 12 (bottom) months. Dashed line: Prediction model. Gray line: assume all patients have poor recovery. Black line: assume no patients have poor recovery.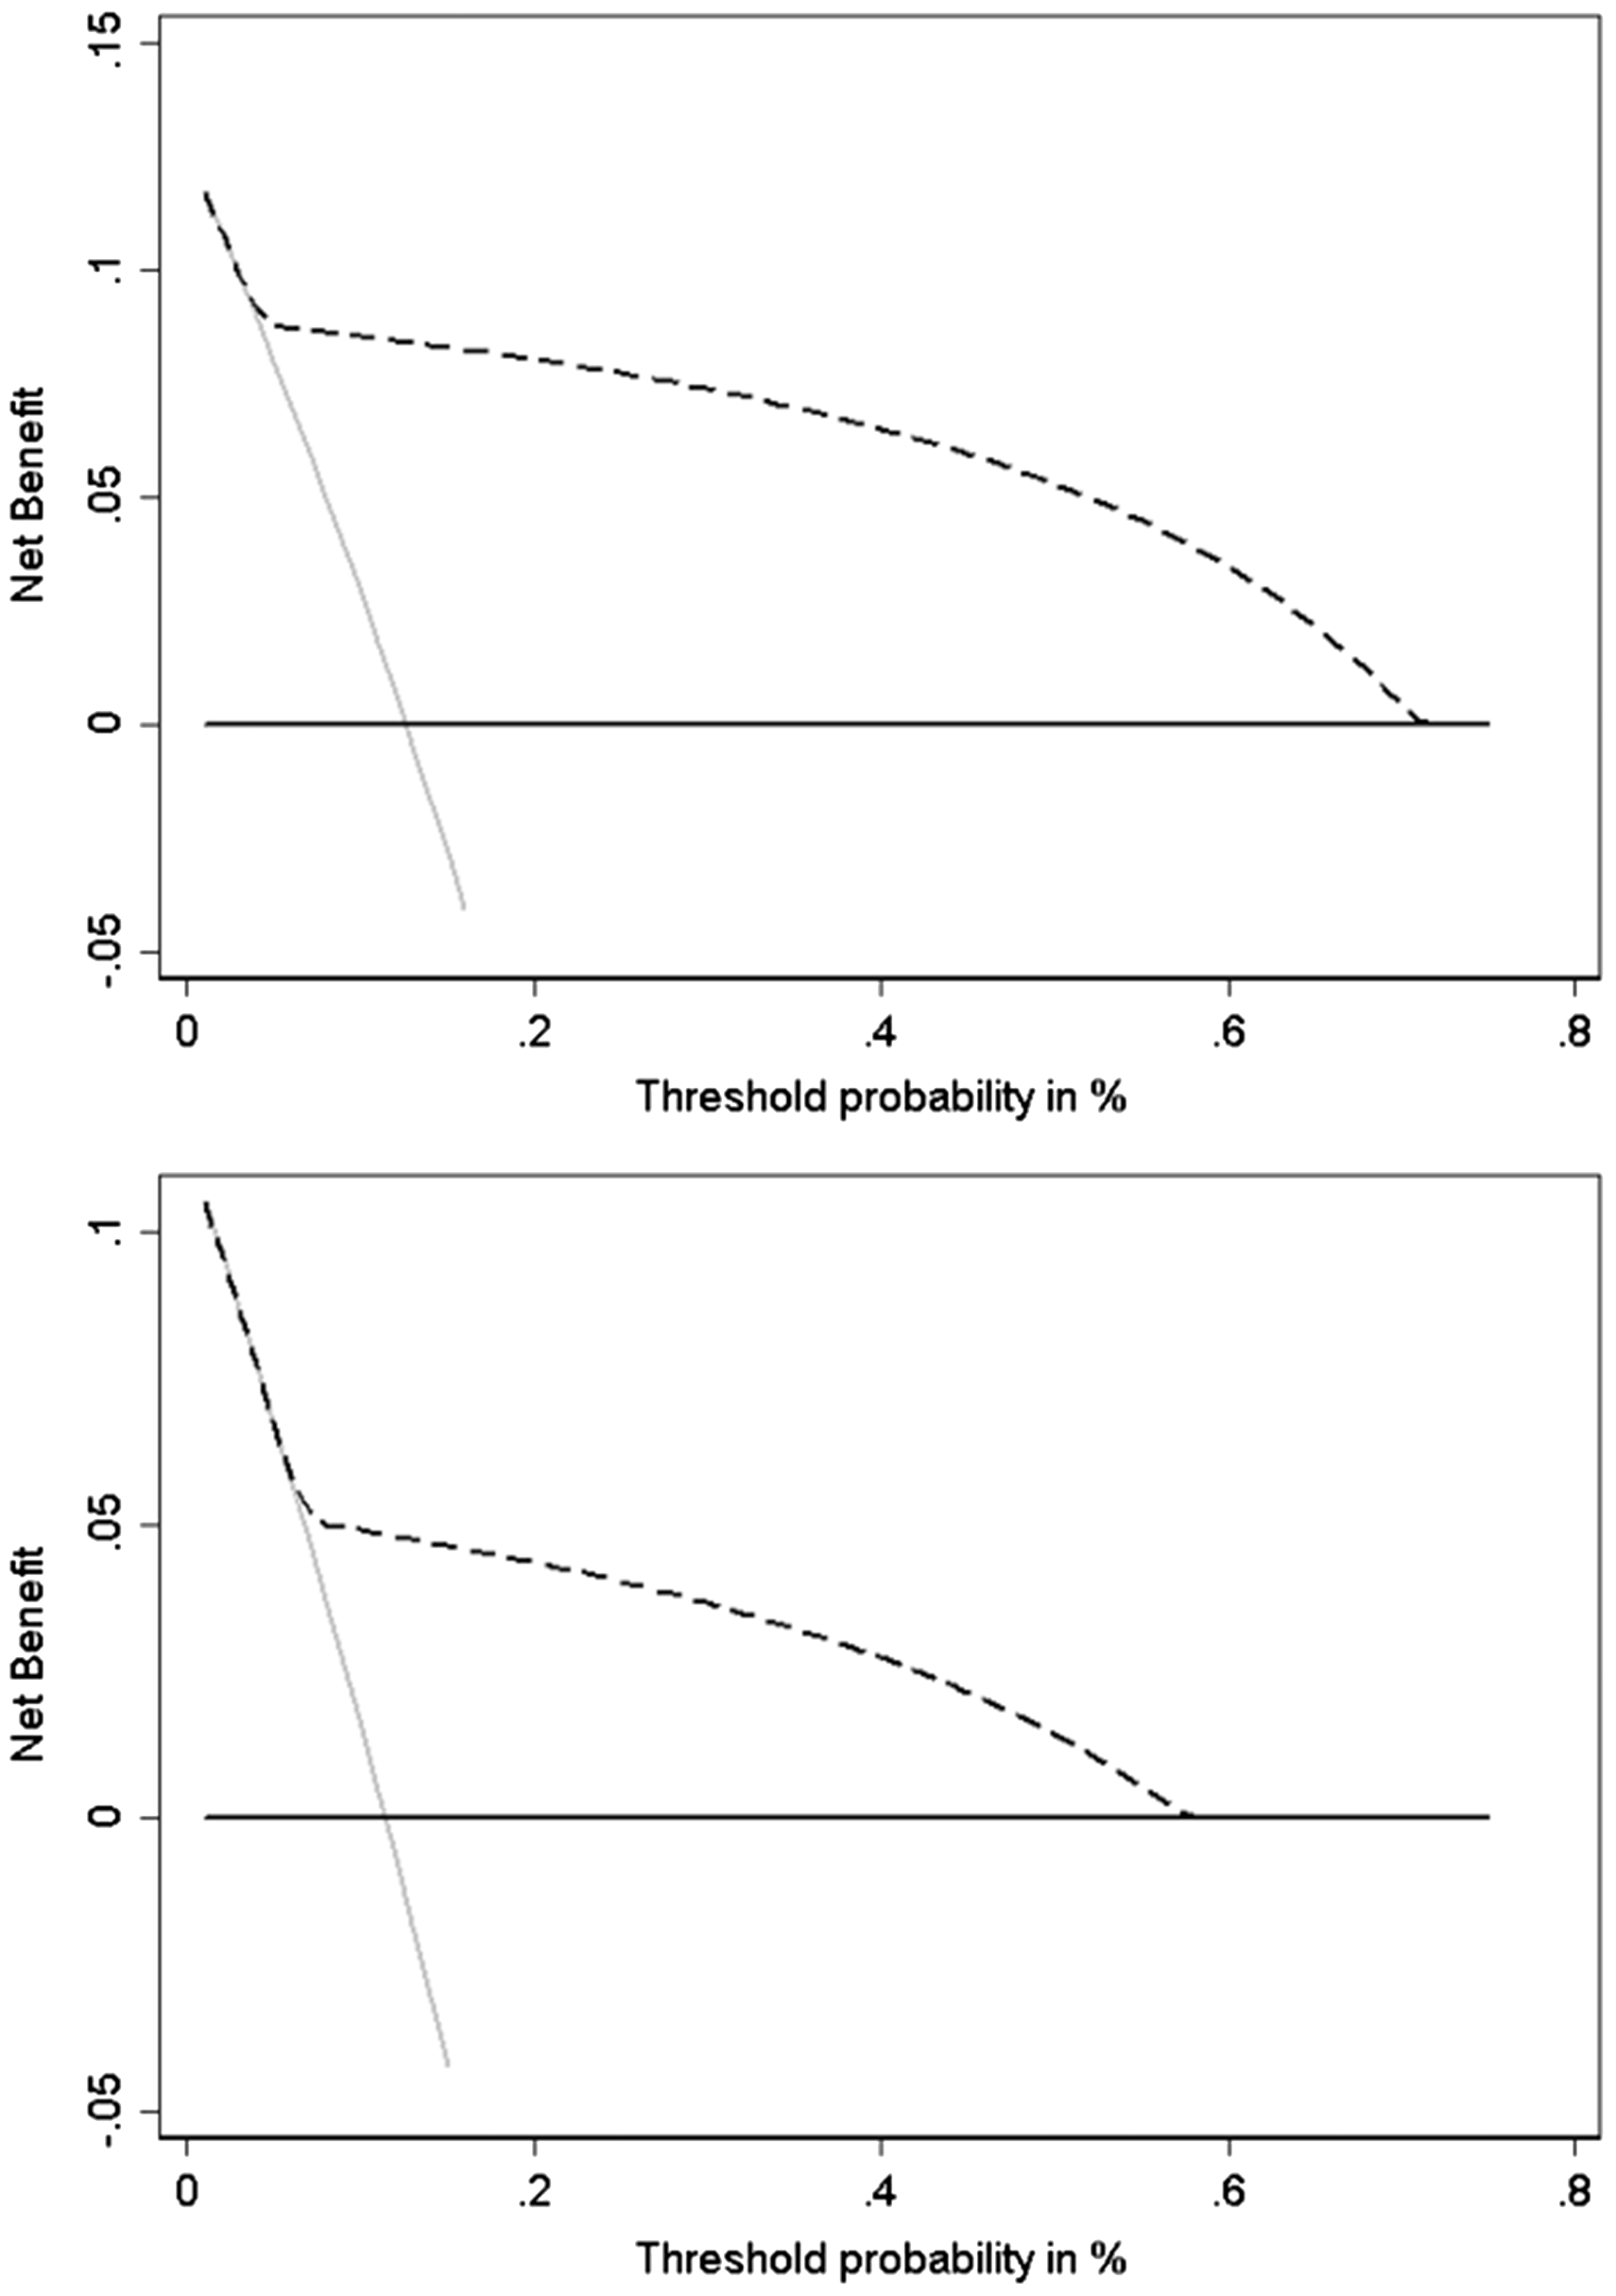
Discussion
In this study, we have developed and validated a dynamic patient-specific prognostic tool of functional recovery poststroke in a population-based cohort. The proposed patient-centered model is the first that enables recovery to be predicted using a continuous score, derived from a combination of individual patient characteristics, and makes available adjusted functional trajectories up to 12 months. At predefined time points, the accuracy of this model has been shown to be superior compared to other exiting prediction models.9–12
Patterns of functional recovery in a general unbiased stroke population demonstrate sharp improvements in the first weeks after stroke and then plateau. Patients with varying severity, different stroke subtype, and risk factors experience different recovery courses that plateaued at different levels and time. Although the general pattern of recovery from stroke, including functional and neurological impairments, has already been discussed and illustrated at population level in previous studies,14,27 our proposed model is patient specific and has additionally provided the ability to predict accurately recovery trajectories up to one year poststroke. This could be useful for early rehabilitation and discharge planning, by predicting whether a patient is likely to be dependent, require some assistance, or be independent, at a certain time poststroke. To give a practical example, when considering functional recovery shortly after admission, the predictive recovery curves show similarities between hemorrhage and TACI stroke but large differences three months later; conversely, dissimilarities were observed between hemorrhage and PACI at the baseline but recovery after three months was comparable. This could be explained by the different rate of recovery between stroke types and reconfirms that survivors of hemorrhagic stroke have a greater chance for recovering function than those who suffer ischemic stroke as suggested in previous studies. 28 Another case that we have tested is when patients have different, or combinations of risk factors, clearly distinct trajectories with different recovery rates can be expected and we can begin to predict poor functional outcomes. For instance, we have shown that changes in recovery do not vary between different age groups. There was a sharp initial increase in recovery which plateaued earlier in younger patients compared to older ones. But despite the slow recovery rate observed in old patients, we would expect improvement to the same level as that of younger patients. This would suggest that specialized stroke rehabilitation may be beneficial for all ages. It also confirms that older patients may need longer rehabilitation and are less likely to be discharged earlier. Interestingly, the change in recovery rate in severe stroke (poor GCS or NIHSS at onset) showed inverse relationship with recovery. This suggests that apart from old age, factors such as onset stroke severity should also be taken into consideration when planning interventions and rehabilitation after stroke. Therefore, this patient-specific recovery curve pattern prediction could potentially inform tailored discharge planning for stroke survivors including those with “hidden” impairments that have not been recognized by the medical team, for example in patients with communication problems. It could also be used to provide early warning of the development of stroke sequelae, such as medical complications, poorly managed risk factors, or inadequate rehabilitation. Evidence from a recent systematic qualitative review 29 showed that rehabilitation could be improved by fostering patients’ autonomy through genuinely patient-centered care and more effective communication and information. Recovery curve predictions may play an important role not only to risks of poor recovery identification, but also to inform a joint physician–patient decision making for effective delivery of preventive and therapeutic interventions.
Generally, subjects’ stratification is often based on one characteristic variable at a specific time point, such as stroke severity at the onset of stroke, which may limit the clinical utility of their predictiveness. We have shown that using a dynamic (time-dependent) multivariate patient-specific predictive model, we can make individual recovery profiles and accurately classify future risks of outcomes. By maintaining this accuracy in differing patient populations, we believe that the recovery curve model is sufficiently robust and DCAs suggest it may be used clinically.
Although the general pattern of recovery from stroke, including functional and neurological impairments, has already been discussed and illustrated in previous studies,14,27 our proposed model has additionally provided the ability to predict at any time the recovery of individuals up to one year poststroke. These patient-specific recovery curves predictions could allow more insight into both spontaneous and directed neurological recovery after stroke. Practically, this could offer the potential to use recovery curves to chart an individual’s recovery and identify when and why there is significant variance from the normal population curve in much the same way as normal growth curves are used to monitor the development of children. This prognostic information is important for clinicians, stroke survivors, and their carers.
In clinical research, this could also be applied as an aid in assessing the beneficial effects of evidence-based interventions and care settings. As a research tool, this could be used to test novel interventions or to identify enriched samples, reducing the reliance on the need for expensive and often impractical randomized controlled trials. This predictive enrichment strategy is of importance for designing future trials as it enables the enrollment of the most suitable patients thereby permitting the use of a smaller study population. Another potential application could be to derive a set of preliminary cost weights on resource uses which could help to build personalized patient care and funding models.
A key strength of the current study is that the models were built and externally validated using a prospective unbiased population-based cohort of first ever strokes. This is preferable over a hospital-based population, which may result in case-mix-specific models, or over aggregate data from clinical trials, which usually represent selected patients, and thus nonrepresentative populations. Notwithstanding, the study could be strengthened further if the model were to be validated in a completely independent holdout population in different poststroke care setting, preferably from another country. A limitation of this study is the effectiveness and usefulness of recovery curves as a low-cost predictive-based intervention still needs to be confirmed. An impact study needs to be conducted in a randomized control trial (RCT) setting to confirm whether being able to predict recovery and the resulting intervention could make a difference to the patient. Nevertheless, the current pilot study has now allowed us to recognize how recovery curves could be implemented and planned for use in stroke care. Estimates and variations from this study will serve to inform the design of the RCT study on how recovery curves and its software as a management tool could improve functional recovery.
Conclusion
Prognostic risk classification based on recovery curves can be clinically useful. This tool makes prognostic information available which could support the development of more tailored management and assist the implementation of more effective care models. Recovery curves tool could provide a useful framework for clinical and public health practice.
Footnotes
Acknowledgments
We wish to thank all the patients and their families and the health care professionals involved. Particular thanks to all the fieldworkers and the whole team who have collected data since 1995 for the South London Stroke Register. The views expressed are those of the authors and not necessarily those of the NHS, the NIHR or the Department of Health.
Declaration of conflicting interests
The author(s) declared no potential conflicts of interest with respect to the research, authorship, and/or publication of this article.
Funding
The author(s) disclosed receipt of the following financial support for the research, authorship, and/or publication of this article: The study was funded by Stroke Association (grant Reference: TSA 2009/02). CDAW and AD acknowledge financial support from the National Institute for Health Research (NIHR) Biomedical Research and from the NIHR Collaboration for Leadership in Applied Health Research and Care South London at King’s College Hospital NHS Foundation Trust.
Authors’ contribution
CDAW, AGR conceived the study. KT, SJS, CM, and AD provided study design guidance, JG and AD performed statistical work for the study. AD drafted the manuscript and all authors contributed substantially to its revision.
References
Supplementary Material
Please find the following supplemental material available below.
For Open Access articles published under a Creative Commons License, all supplemental material carries the same license as the article it is associated with.
For non-Open Access articles published, all supplemental material carries a non-exclusive license, and permission requests for re-use of supplemental material or any part of supplemental material shall be sent directly to the copyright owner as specified in the copyright notice associated with the article.