
Abstract
Multiple findings suggest that human visual perception exhibits extensive size invariance (i.e., insensitivity to retinal image size changes) for multiple object categories. This is often investigated when retinal image size changes following real-world image size changes, but viewing distance is kept constant, a situation that does not reflect daily vision where objects retain their real-world size and their image size on the retina changes as a function of viewing distance. Here, we measured face discrimination performance to parametrically growing face differences and assessed size invariance by examining whether performance was sensitive to retinal image size changes employing multiple methods (e.g., human performance deviation from that of the ideal observer). Importantly, retinal image size changes were applied either naturalistically (when faces kept their world size but were more distant) or lab-like (where faces changed their world size while viewing distance was constant). We found that (i) the difference detection threshold (DT) was not influenced by retinal size changes or viewing distances we manipulated, (ii) face discrimination was significantly worse for smaller retinal image sizes (for both naturalistic and for lab-like conditions), (iii) worse face discrimination performance at smaller retinal image sizes were significantly associated between naturalistic and lab-like conditions. Our results indicate that face discrimination shows imperfect invariance to retinal size and, importantly, this appears independent of viewing distance. Since face perception may rely on face-specific mechanisms, future work should examine whether these results generalize to additional object categories.
Introduction
Human visual perception displays extensive size invariance to multiple object categories (i.e., insensitivity to retinal image size changes) and this has been shown across multiple studies (e.g., Furmanski & Engel, 2000; Guo, 2013; Han et al., 2020; Lee et al., 2006). Size invariance, similar to other experimental examinations, is typically investigated under lab-based conditions where the viewer is typically viewing all stimuli at the same viewing distance and only the retinal image size changes at that viewing distance (Furmanski & Engel, 2000; Guo, 2013; Gur, 2018; Rolls & Baylis, 1986). However, during naturalistic visual behavior most objects keep their world size while their size on the retina changes as a function of their changing viewed distance. This indicates that lab-based paradigms modulating image size at a fixed distance may not represent the transformations the visual system is usually tuned to (Chen et al., 2019).
One category of objects that has been extensively investigated with respect to size invariance is faces. Indeed, in real life, higher levels of size invariance to face stimuli is evident in certain aspects such as for example in the ability to recognize familiar faces from near and from far viewing distances and in the ability to estimate the age and gender of a face from various viewing distances. Across different studies, it has been shown that face perception abilities display certain levels of size invariance to stimulus size (Guo, 2013; Gur, 2018; Lee et al., 2006). However, as we indicated above, size invariance to face has not been typically tested in conditions resembling retinal image size changes during naturalistic-like visual behavior.
To address this, here we assessed how sensitive face discrimination performance is to retinal size changes. To assess face discrimination performance we employed a well-established morph paradigm (Gilaie-Dotan, Gelbard-Sagiv, & Malach, 2010; Gilaie-Dotan & Malach, 2007) that gradually increases only face identity differences (as all faces were of young men and had neutral expression, see Figure 1A) and participants were required to report whether the faces were the same or different. These prior behavioral and neuroimaging studies show that in this paradigm people start noticing between-face differences at morph levels of 30% to 40% morph when faces are presented at near (~60 or 110 cm) viewing distances. To estimate the sensitivity to retinal size changes we adopted the ideal observer framework that has been used as a benchmark to test human visual performance against (Geisler, 1989). This framework is commonly considered task-specific (i.e., there does not seem to be an “across the board” single ideal observer for all visual functions) and it allows to examine how close humans come to optimal use of available visual task-relevant information. An example of such ideal performance would be of constant failure to detect a stimulus with energy levels below the absolute threshold, but constant success once there is sufficient stimulus energy (above the absolute threshold) which could be represented as a step-function (Hecht et al., 1942). However, even in low-level visual tasks (as detecting light), human performance does not usually strictly follow ideal observer performance (Buckley et al., 1996; Geisler, 1989). These deviations from the ideal observer are typically used to characterize human visual functions and biases. The ideal observer framework has mostly been used to assess low to mid-level visual functions (Buckley et al., 1996; Geisler, 1989) and here we adopted this to higher-level face perception abilities. We used the ideal observer framework to test how sensitive face discrimination is to variations in retinal image size. The ideal observer concept served as a baseline benchmark allowing us to examine how performance in each condition (manipulating retinal size and viewing distance) deviates from this benchmark. We computed the mathematical distance (which we term “deviation”) between the expected ideal observer face discrimination performance and that of every condition we tested, where a bigger deviation from the ideal observer performance indicated on poorer human performance. In addition to the deviation from the ideal observer, we also assessed more standard measures (as just-noticeable-difference [JND] and error rate).
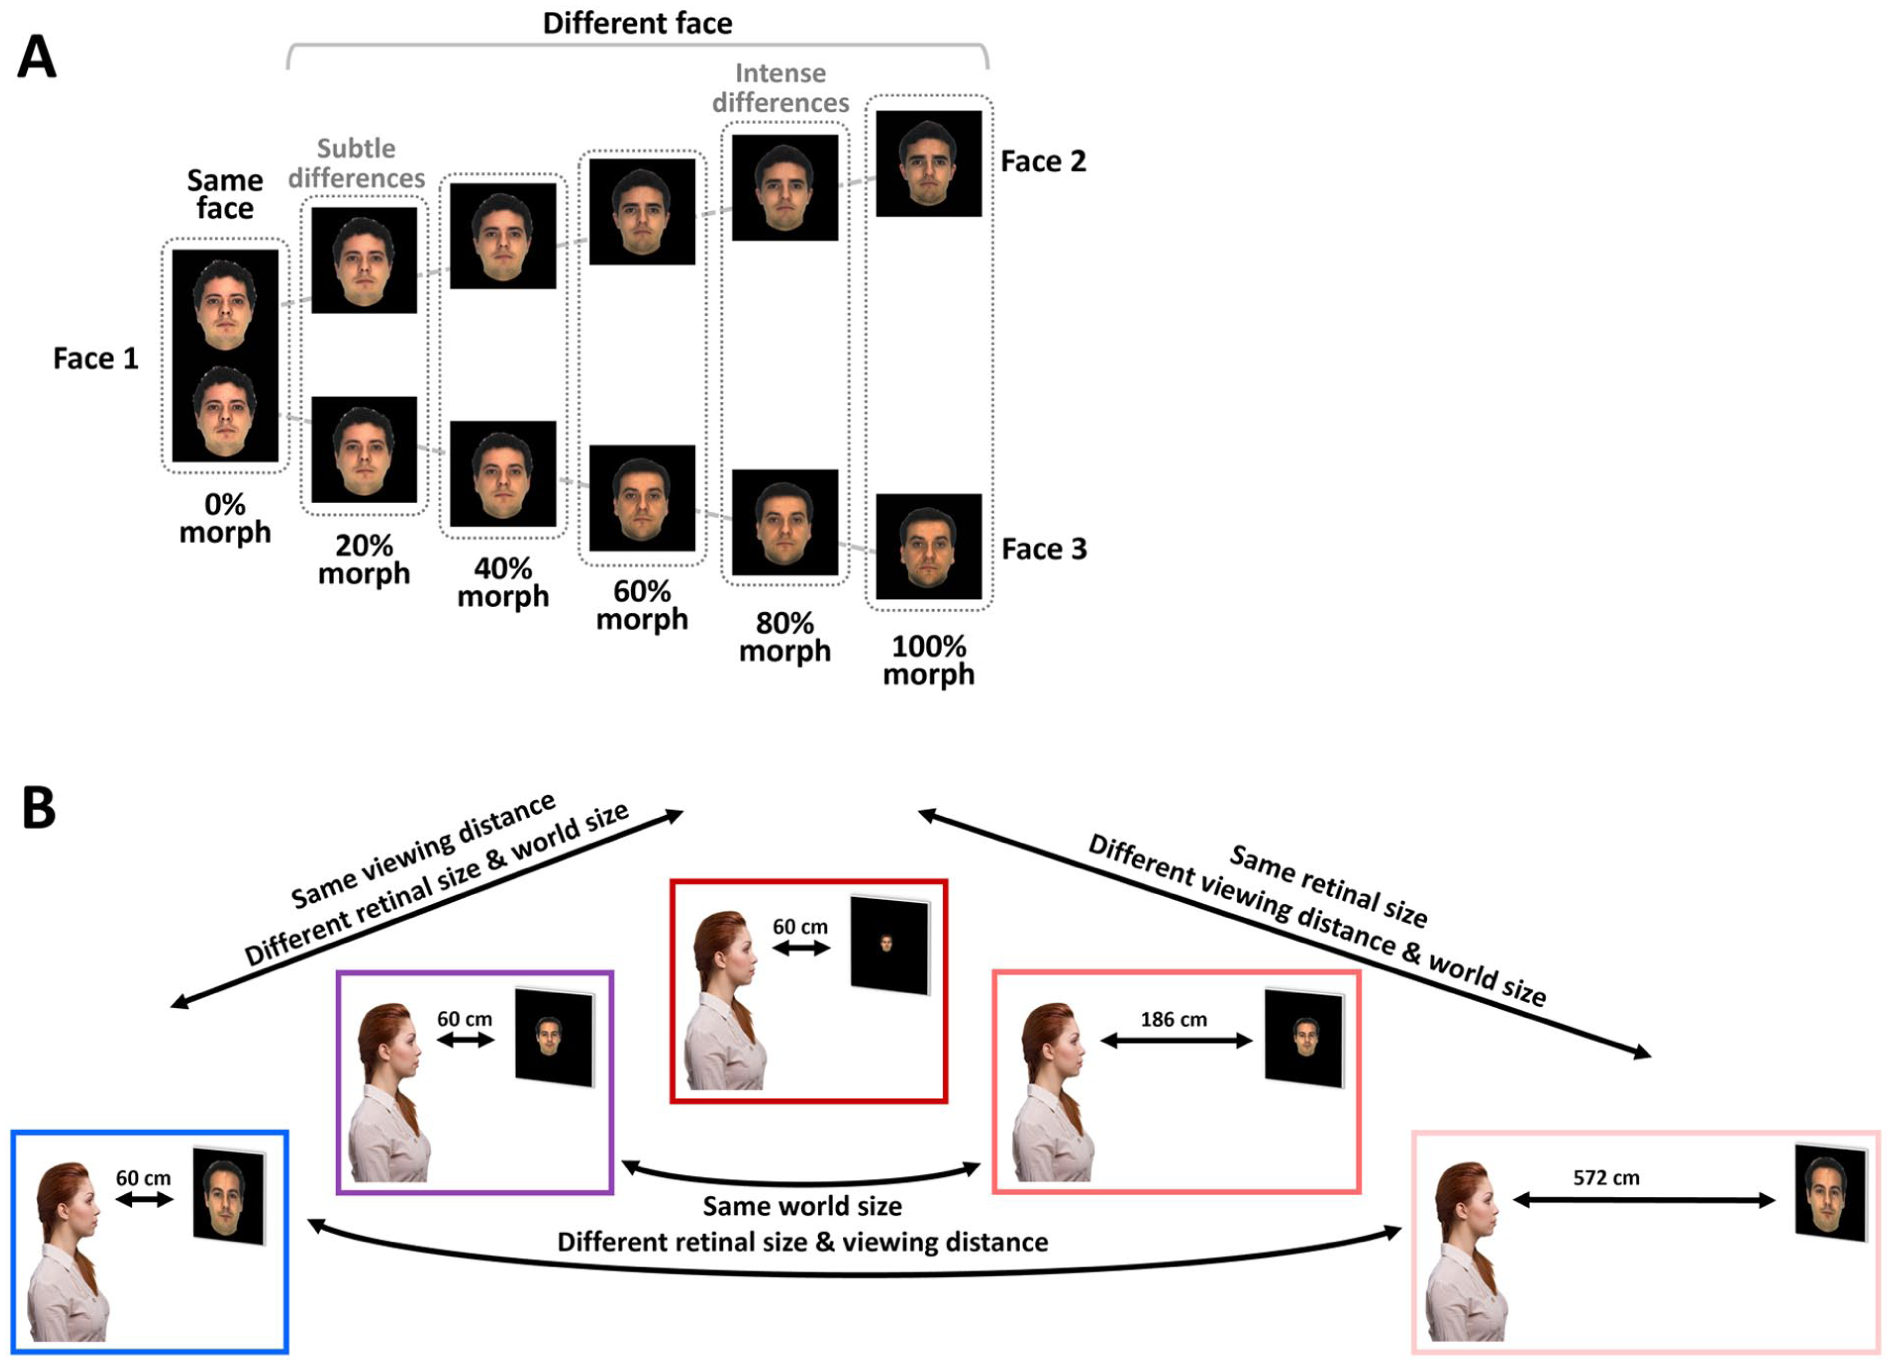
Experimental design: (A) Two morph sequences are displayed from an original (source) face (on left) to two different target faces (on right). Face differences increased with increasing amount of morph as a face transformed from an original face to the two other different faces. A trial consisted of a pair of faces at the same morph level from the original face (as demonstrated by the dotted lines) that were presented sequentially. (B) Experimental conditions were presented at viewing distance of 60 cm ([i] on left in blue – Regular Near, [ii] 2nd on left in purple – Small Near, [iii] 3rd on left in red – Tiny Near), 186 cm ([iv] 2nd on right in pink – Tiny Mid), and 572 cm ([v] on right in light pink – Tiny Far). Each experimental condition included all the morph levels depicted in (A). More details about each experimental condition (e.g., world size, retinal size, and viewing distance) can be found in Table 1.
Description of Study Experimental Conditions. Each row describes an experimental condition according to its viewing distance (in cm), stimulus world size (in cm), and retinal size (in visual degrees). Conditions (i–iii) manipulated retinal size similar to typical lab-based experiments (same viewing distance), conditions (iii–v) manipulated viewing distance and world size at the same time, and conditions (i and v) and (ii and iv) manipulated viewing distance and retinal size similar to typical naturalistic-like visual experience where larger viewing distance reduces retinal size while world size is kept constant.
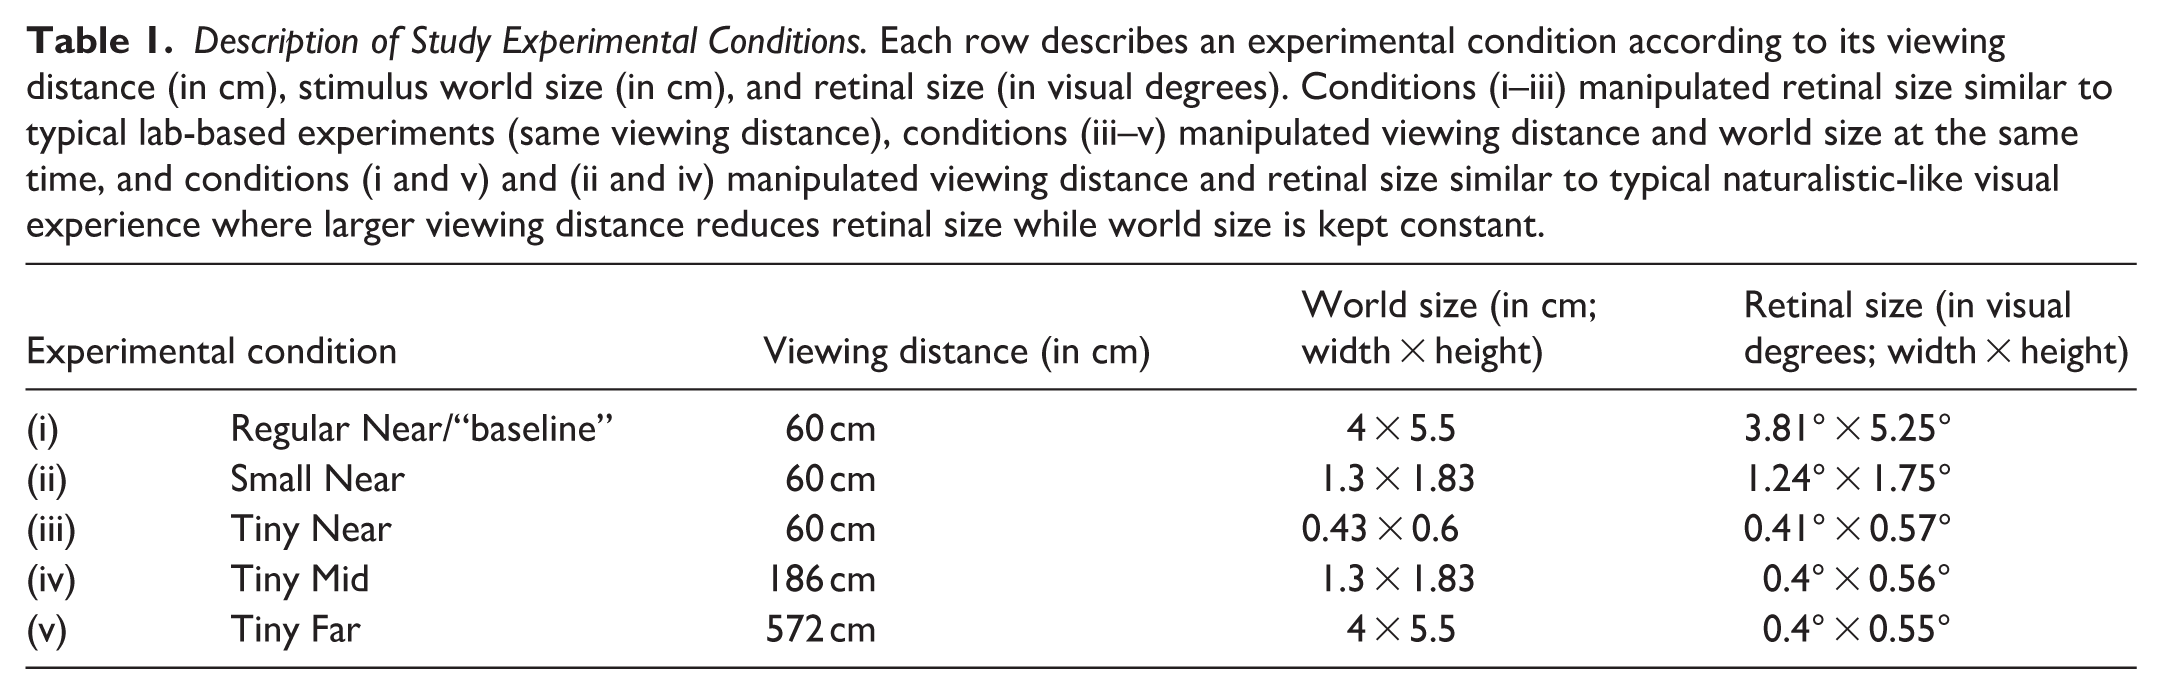
We tested face discrimination sensitivity to retinal image size in 5 experimental conditions manipulating both retinal image size and viewing distance (see Figure 1B and Table 1 for details). Our design enabled us to examine how retinal and world size changes affect face discrimination at near viewing conditions similar to typical lab-based retinal-size manipulations and also to examine these effects under manipulations that resembled more naturalistic visual behavior where retinal size changed as a function of viewing distance. Our design also allowed us to examine how performance (e.g., deviation from the ideal observer) is affected by viewing distance changes where the retinal size stays constant. Specifically, the study conditions were: (i–iii) when faces were presented at near viewing distance at either regular (i), small (ii) or tiny (iii) world (and retinal) sizes, (iv) when small world sized faces were presented at mid-distance (effectively tiny retinal size), or (v) regular world sized faces were presented at far distances (effectively tiny retinal size). Note that while conditions (i–iii) manipulated the retinal and world size changes at near viewing distance, retinal size changes as a function of viewing distance (but same world size) included conditions (i) and (v) and also conditions (ii) and (iv), and retinal size stayed constant for conditions (iii), (iv), and (v).
Face perception skills are considered to be higher-level visual functions and, therefore, are assumed to be much less dependent on the physical aspects of the stimuli (Gilaie-Dotan, Silvanto, et al., 2010). However, we assume that the physical aspects of visual stimuli, including higher-level visual functions as perception and memory of faces and objects, are also dependent to some extent on the physical aspects of the visual inputs (e.g., see Brook et al., 2024; Kreichman et al., 2025; Masarwa et al., 2022). Therefore, here we assumed that retinal image size would also influence face discrimination. Specifically, we predicted that for unfamiliar faces, a smaller retinal image size would adversely affect face discrimination performance and that this would be evident in near and in far vision (e.g., bigger deviations from ideal observer performance).
Methods
Participants
A group of 35 healthy university students (12 men, 23 women, 32 of them right-handed) aged 28.57 ± 6.92 (SD) with normal or corrected to normal vision for near and for far, with no history of neurological disorders, participated in the experiments. Near and far visual acuity (VA) were measured for all participants (except for four of them for which we were not able to obtain near VA measurement and one of them for far VA measurement due to technical limitations) using standard optometric procedures (Gilaie-Dotan et al., 2009; Lev et al., 2015; Masarwa et al., 2022; Yitzhak et al., 2018) before the face discrimination experiments began. Additional information on VA testing and on the Cambridge Face Memory Test (Duchaine & Nakayama, 2006) that evaluated face recognition abilities can be found at https://osf.io/cax52/. The study was approved by the Bar-Ilan University Interdisciplinary Research Unit Ethics Committee on 17 April 2016. Each participant signed a written informed consent form before their participation.
Face Discrimination Experiments
Each participant underwent five face discrimination experiments (see Table 1). Participants started with a practice session at a viewing distance of 60 cm that included trials of different face sizes (according to the different experimental conditions at 60 cm). We checked that participants performed the practice with at least 80% accuracy before continuing to the main experiments. All participants started with the 60 cm experiments (all except one started with the normal or small faces experiment) in a different order and different versions, which were followed by the experiments at 186 cm and 572 cm viewing distances. Importantly, the first experiment was at 60cm and not of the smallest retinal size in order to make sure participants familiarized themselves with the task with relatively easier-to-perceive stimuli.
The face discrimination experimental stimuli were the same as those used in our earlier studies investigating sensitivity to face differences in human visual cortex (Gilaie-Dotan, Gelbard-Sagiv, & Malach, 2010; Gilaie-Dotan & Malach, 2007). In short, these stimuli were all colored face pictures of unfamiliar men with neutral expressions, presented on a black background (see Figure 1A). To evaluate the participants’ sensitivity to face differences, the face differences were parametrically manipulated from a no-difference level (identical face images) to completely different faces. Stimuli were created by a technique of face morphing that transforms one source face to another target face in a perceptually and physically continuous fashion, where 0% morph is the original (“source”) face, 100% morph is the target face, and all intermediate morph levels (0–100) created a normally looking face that is perceived to be on a continuum between the original face and the target face. The face images used in this study across all experiments (see below) were created from different face identities of real people ([Gilaie-Dotan & Malach, 2007] i.e., from images taken from the CVL and AR face image datasets [A. Martinez & Benavente, 1998; Peer, 1999] and examples of three of them can be seen in Figure 1A [Face 1, Face 2 and Face 3]). Specifically, our study relied on morph stimuli created from 48 different identities and 73 different morph sequences between these 48 identities (from 12 unique source identities to 41 unique target identities). Our stimuli were 264 distinct face stimuli derived from these morph sequences, each from one of the 0%, 20%, 40%, 60%, 80%, or 100% morph levels. An example of 11 such images can be seen in Figure 1A and more details about images of each experimental version can be found below.
Each trial included two consecutive face images that were drawn from different morph sequences originating from the same face (see Figure 1A), and both from the same morph level out of the following six levels (each morph level determining the amount of facial difference): 0% morph (identical faces), 20% morph (very similar faces), 40% morph (somewhat similar faces), 60% morph (somewhat different faces), 80% morph (different faces), and 100% morph (very different faces). Each of the 6 morph-level conditions was repeated 12 times in each experiment, resulting in 72 trials per experiment, with 144 face images (72trials × 2images/trial) per experiment. Importantly, the 12 repetitions of each morph level were based on 12 different face pairs (this resulted in 72 different face pairs). Trials of the different morph levels appeared in mixed order across each version of the experiment (see more details about the experimental versions below). The participant was required to report if the two presented images were the same (“same” response) or different (“different” response). The first face was presented for 200 ms, followed by a black screen of 100 ms, and then the second face image was presented for 200 ms. Responses were provided via wireless remote mouse keys (response time was limited to 1,800 ms after the second face stimulus presentation). The following trial started 1,800 ms afterwards. A few longer inter-trial periods were included across the experiment. The duration of each experiment was approximately 3 min.
To reduce familiarity, priming, and expectations, 3 versions of the experiment were used. The order of trials was changed across the versions, and some of the face images were changed between versions. Specifically, the first version included 122 different face stimuli created from 27 different face identities, the second version included 126 different face stimuli created from 33 different face identities, the third version included 123 different face stimuli created from 30 different face identities; 18 face identities were used for creating the stimuli in both the first and the second versions, 25 face identities were used for creating the stimuli in both the second and the third versions, and 13 face identities were used for creating the stimuli in both the first and the third versions. For each participant, the three different experimental versions were used for the visual angle manipulation as well as for the viewing distance manipulation. The experimental versions and their order were counterbalanced across participants (for specific version per condition per participant information, see Supplemental Material at https://osf.io/cax52/).
The experiments were run on “Presentation” version 19.0 software (Neurobehavioral Systems, Inc.) on a Windows-based laptop (screen width 29 cm, screen height 19 cm). The room was dimly lit but the weak lighting was likely sufficient to allow perceiving the room they were in and where the screen was situated relevant to them. Thus, participants likely had distance cues from the surrounding room.
Analyses
For each participant and each morph level in each experiment we estimated the proportion of trials (out of the 12 trials) that were perceived as different faces (responded “different”). This resulted in an individual psychometric function per experiment (perceived as different as a function of morph levels, see Figure 2A).
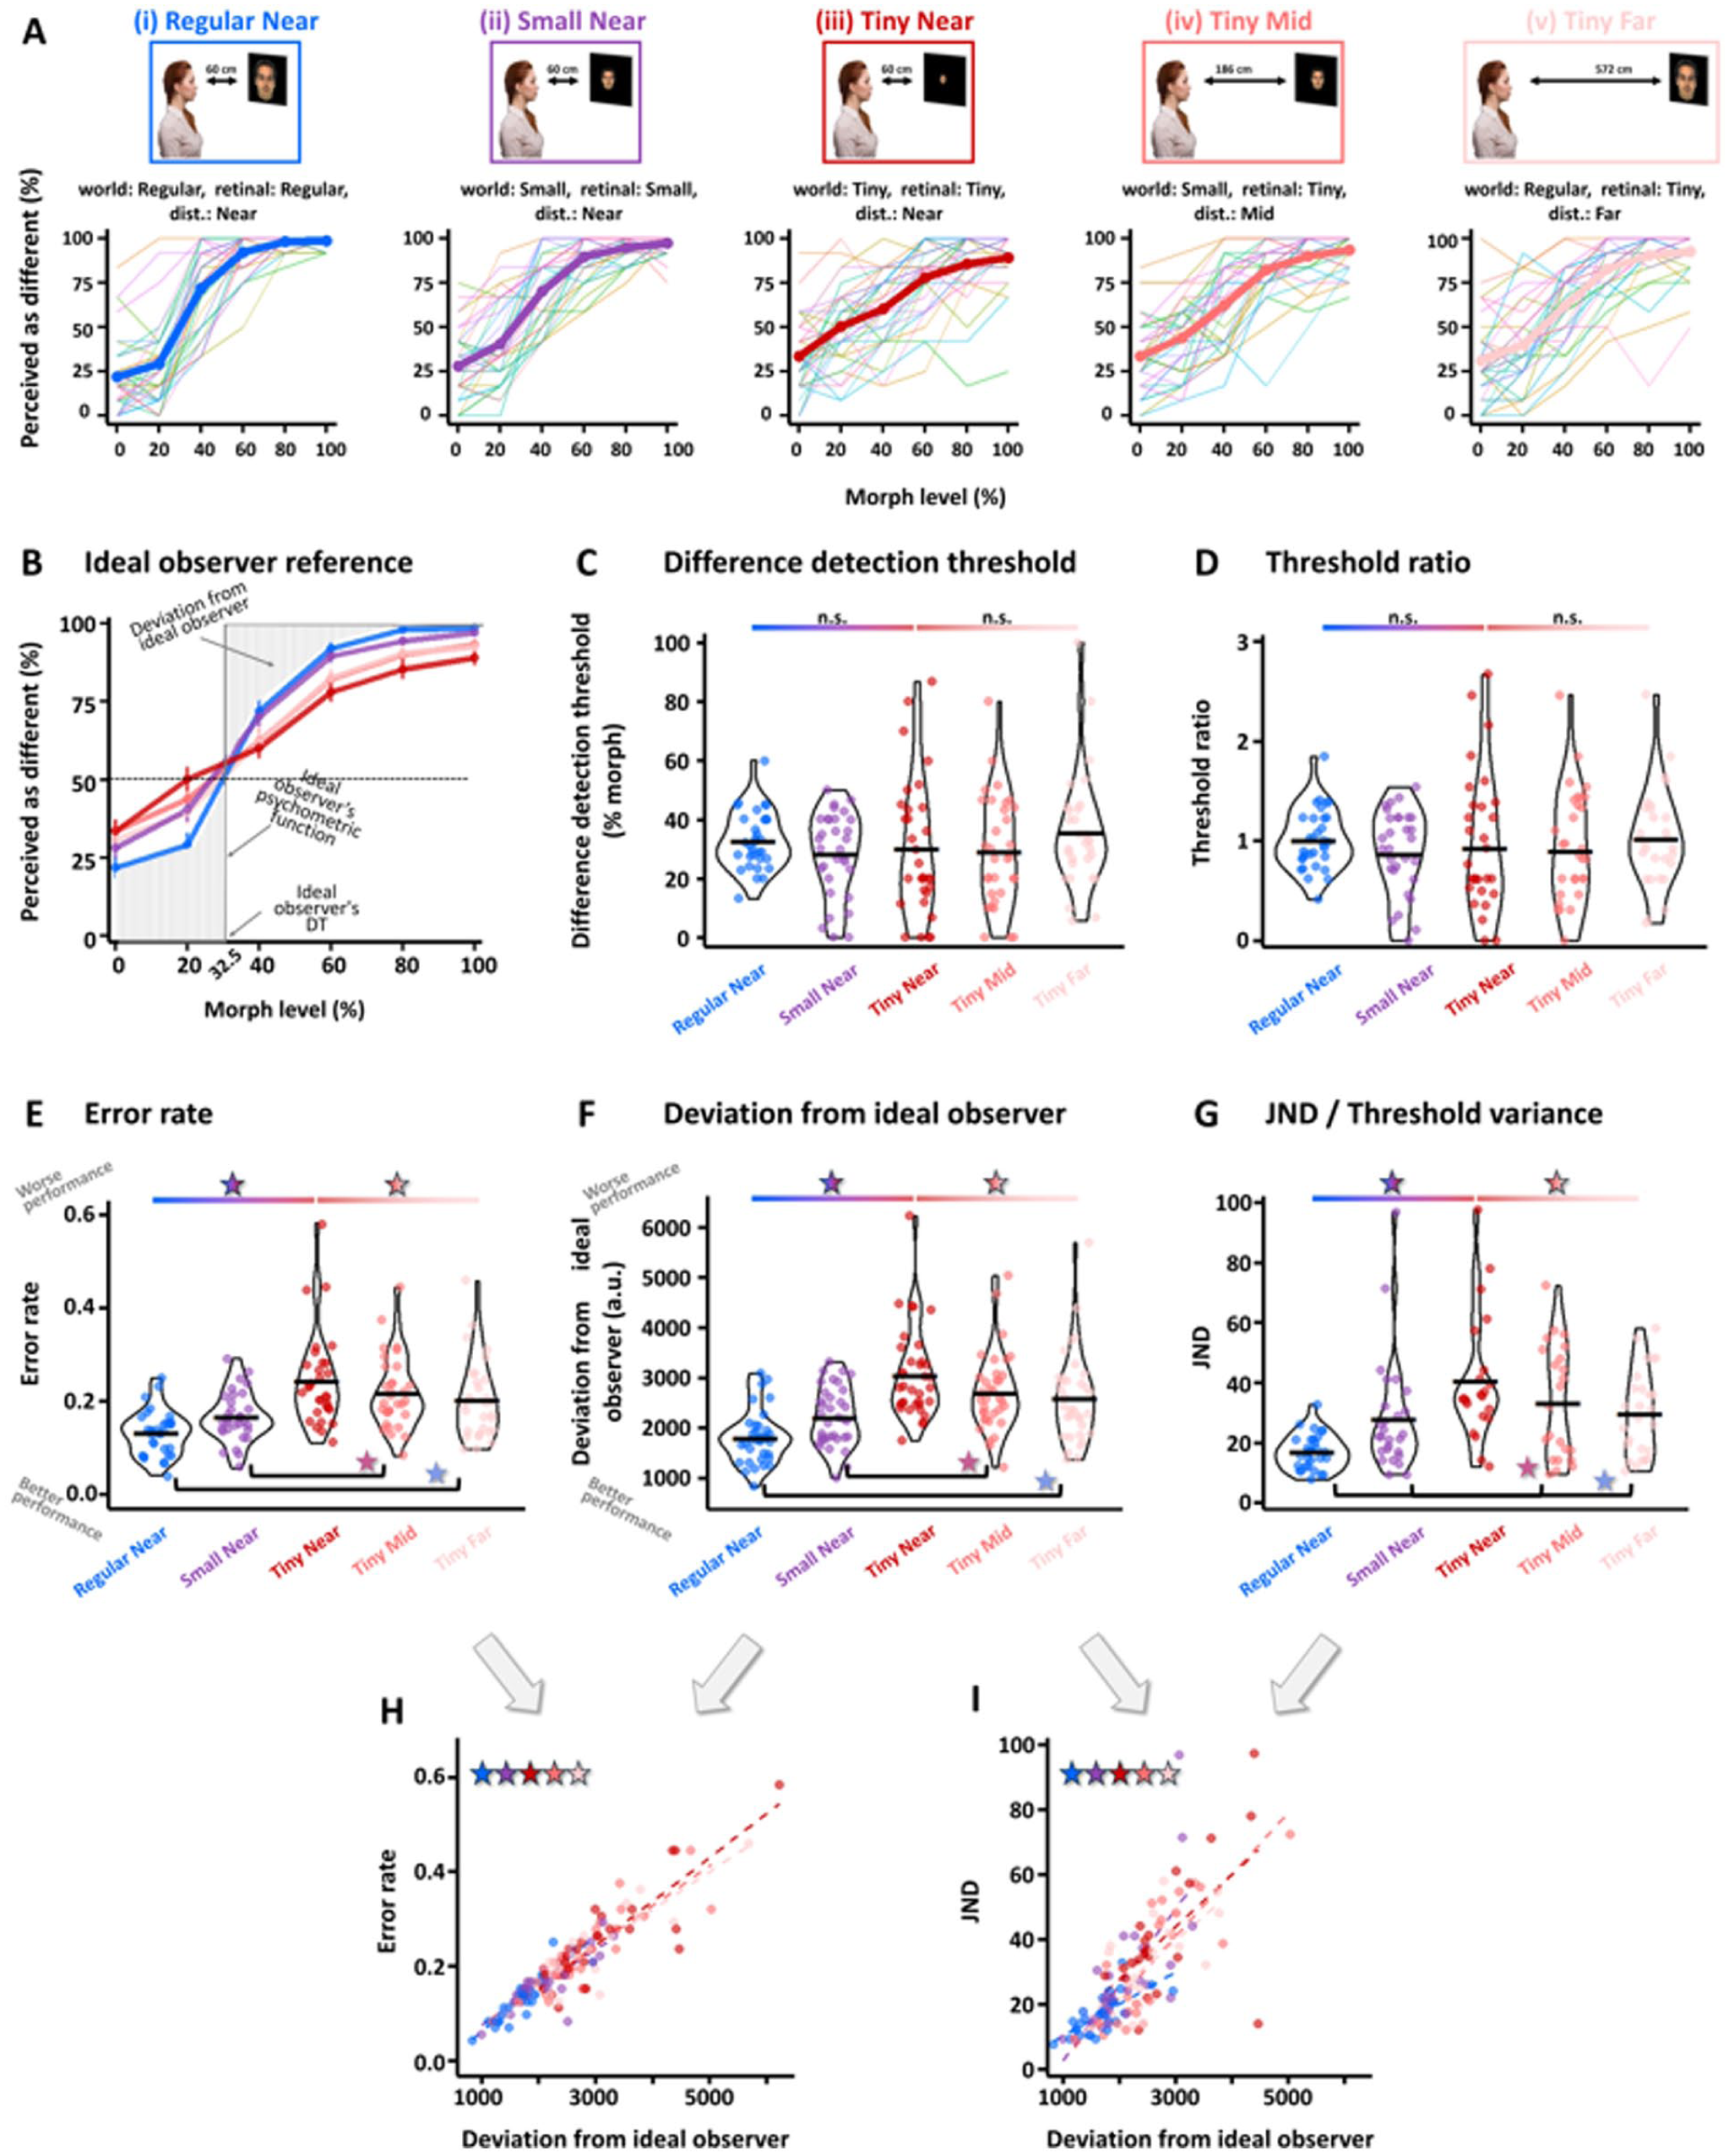
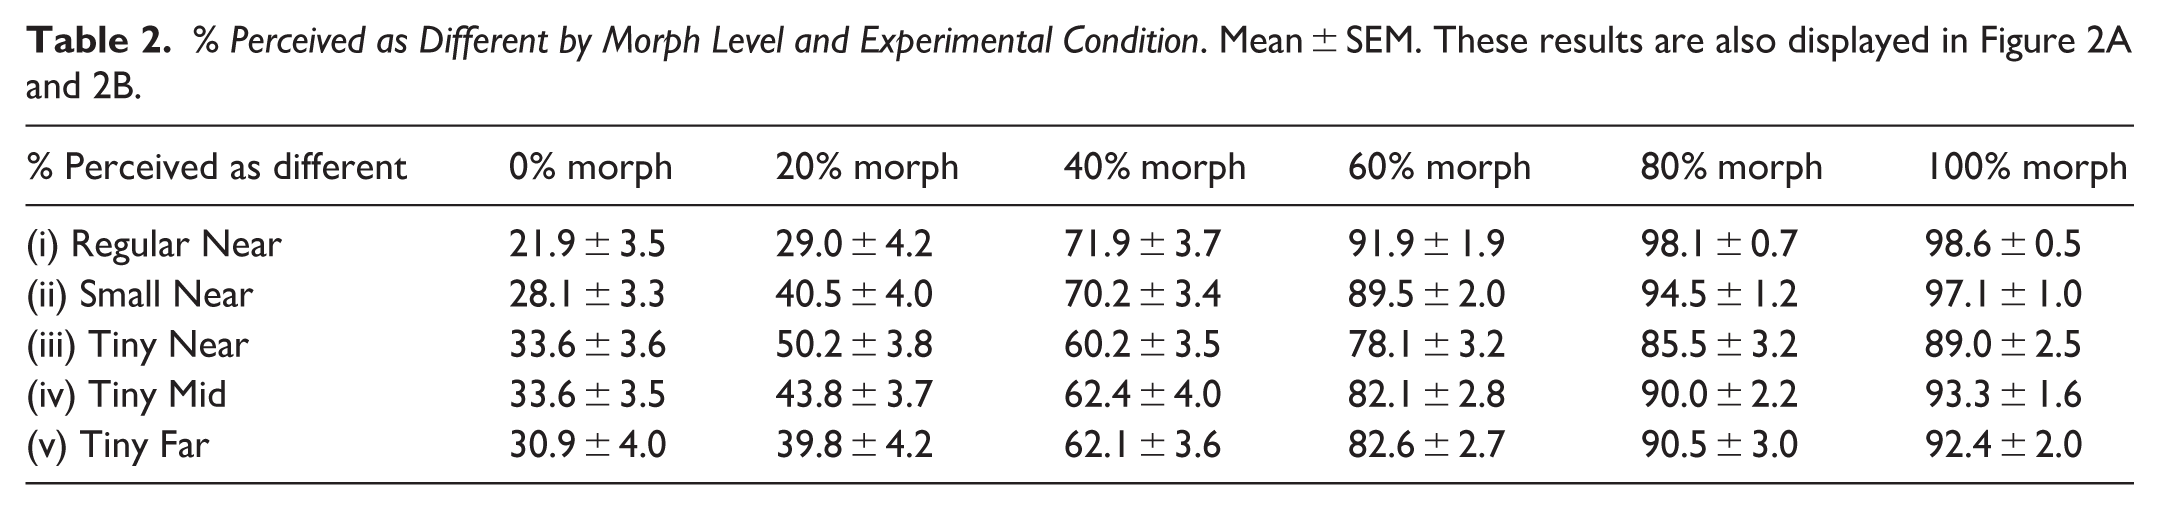
Face discrimination performance results: (A) Perception of face differences (n = 35) as a function of morph level for each of the experimental conditions described in Figure 1. The y-axis represents the percentage of responses where participants reported they perceived a difference. In each panel, the average across participants is indicated by a thick line and individual data in thin lines. As can be seen, the psychometric functions on the right seem flatter than those of the Regular Near condition (on the left), which has the biggest world and retinal size information. (B) Average performance from panels in (A) superimposed on each other and on an ideal observer psychometric function (in gray, see “Methods”). Individual difference discrimination threshold (DT) is estimated as the morph level that would lead to 50% perceived difference (see dashed line at 50%). The ideal observer’s DT was taken as 32.5% morph (see “Methods”). The deviation of the Regular Near function from that of the ideal observer is illustrated as a patterned striped area. (C) Individual DTs for each experimental condition, where the y-axis represents the morph levels. No significant effect of experimental manipulation on DT was found (see “Results”) and similar results were obtained for threshold ratio (D), see “Methods” and “Results”. (E, F, G) Error rate (E), Deviation from ideal observer (F) and JND (G) were significantly affected by experimental manipulations (by retinal size, by world size, and by viewing distance [see “Results”]) and were significantly predictive of each other (H, I). Importantly, increased world size and retinal size improved performance as evidenced by smaller deviations from the ideal observer, lower error rates, and smaller JNDs, while increased viewing distance led to worse performance by increasing deviation from the ideal observer, error rates, and JNDs (see “Results” for more details).
DT Calculation
From the psychometric curve of each experimental condition of each participant, we estimated the difference detection threshold (DT) that estimated the morph level at which the participant perceived 50% of the morphed faces as different and 50% of the morphed faces as the same (i.e., threshold; additional analysis involving DT levels based on 30%, 40%, 75%, and 85% thresholds can be found in https://osf.io/cax52/). Individual condition-specific DT was calculated according to the following equation:
DT = xbelowThresh + (50 − ybelowThresh) × (xaboveThresh − xbelowThresh)/(yaboveThresh − ybelowThresh) where xaboveThresh is the first morph level (from 0, 20, 40, 60, 80, 100) where the % perceived as different (yaboveThresh) is above 50%, and xbelowThresh is one morph level below xaboveThresh, and ybelowThresh is its corresponding % perceived as different performance (and is clearly at or below 50% perceived as different). Note that DT was undefined for participants whose performance did not cross the 50% perceived as different for all morph levels (i.e., either perceived faces as different >50% of the time for all morph levels or <50% of the time for all morph levels). Due to undefined DT several participants were excluded from the DT analysis (three participants from [i], four participants from [ii], four participants from [iii], three participants from [iv], and five participants from [v]).
Error Rate Calculation
This measurement was calculated for each participant for each condition relative to their condition-specific DT that served as a reference for the morph level at which they are expected to switch from not-perceiving face differences (below it) to perceiving face differences (above it). Errors were taken as responses that did not follow this pattern (i.e., responses reporting perceived difference below their DT or responses reporting no difference perceived above their DT). Error rate depicts the average error rate for all morph levels in that condition and was calculated as the sum of errors in all morph levels of a condition divided by the number of all trials.
Deviation From Ideal Observer Calculation
The ideal observer (see gray line in Figure 2B) was defined as a hypothetical human whose performance for discriminating faces follows a step-function at a certain morph level (i.e., is able to perfectly discriminate faces [100% perceived as different] for morph levels above that certain morph level but below that morph level does not perceive any face differences [0% perceived as different]) corresponding to the ideal observer framework (Geisler, 1989). Theoretically, an ideal observer may “perceive” any between-image physical difference (e.g., even those present at 1% morph), but previous studies indicate that humans perceive between-face differences at 30% to 40% morph levels. As in this study, we were not interested in examining how far human performance deviates from that of an ideal observer per se, but rather how this deviation is sensitive to our experimental manipulations, we took the average DT of our cohort for the easiest condition as the “ideal observer baseline” to which we compared each experimental condition’s performance. To that end, we determined the ideal observer detection threshold (DT, where the step function of the ideal observer takes place) to be the average DT across the group in the Regular Near experiment, assuming that in this “easiest condition” it will also be found to be between 30% and 40% morph. Then, in each experiment for each participant, we estimated the deviation of their psychometric function from that of the ideal observer as the area between the two curves (see this deviation in the illustration in Figure 2B, indicated by the patterned striped area).
Threshold Ratio Calculation
This ideal observer-related measurement (for similar analyses see Braje et al., 1995; Burgess et al., 1981; Murray et al., 2005) estimated for each participant and each condition the ratio between their individual DT of that condition and the ideal observer DT. This measurement reflects the ratio between the morph level needed for humans to reach threshold performance relative to the morph level the ideal observer requires to reach the same threshold performance. Since we defined the ideal observer threshold to be that of the mean group for the easiest condition, we expected that for that condition, this measurement would be around 1.
JND Calculation
This ideal observer related measurement (for similar analyses see Geisler, 1989, 2003), which we also term here threshold variance, estimated for each participant and each condition the difference between the individual DT for 75% perceived difference threshold and individual DT for 40% perceived difference threshold. This measurement reflects the morph (or DT) range between different performance levels (here 40% to 75% perceived difference). Since this is meaningless for the ideal observer (whose performance changes from 0 to 1 in a step-function wise matter), this measure reflects human “internal noise” relative to the ideal observer's “ideal” performance. The larger the JND, the further performance is from the ideal observer (i.e., more internal noise).
Another ideal observer-related measurement (i.e., efficiency) can be found at https://osf.io/cax52/.
All the analyses and statistics were run in R (Rstudio 2021.9.0.351 [RStudio Team, 2020]).
Results
For each participant, we plotted their perceived face differences as a function of morph levels for each experimental condition, and these individual psychometric functions can be seen in Figure 2A. The average psychometric functions per condition are plotted in each panel (Figure 2A) and are overlaid on each other in Figure 2B (see also Table 2). We carried out two sets of analyses that allowed us to evaluate whether face discrimination is sensitive to retinal size and/or viewing distance. These included examinations of the threshold at which a difference is perceived (DT, threshold ratio, see Figure 2C–D and Tables 3 and 4) and examining the discrimination precision taking into account performance for both morph levels below and above one’s discrimination threshold (error rate, deviation from ideal observer and JND, see Figure 2E–I and Tables 3 and 4).
Performance Sensitivity to Experimental Manipulations. Each row describes a different performance measure (see “Methods” for more details), and each column describes a different experimental condition (see Table 1 for further information). Results in mean ± SEM. For each measure and each experimental condition the number of participants of that estimate appears below it [note that since DT could not be estimated for participants whose performance was consistently (for all morph levels) above or below the 50% threshold, the N for DT and its dependent measures (Threshold ratio and Error rate) is sometimes below 35; JND calculation was based on DT for 40% and 75% thresholds and therefore its N was also influenced by this same factor]. These results are also displayed in Figure 2C and 2G.
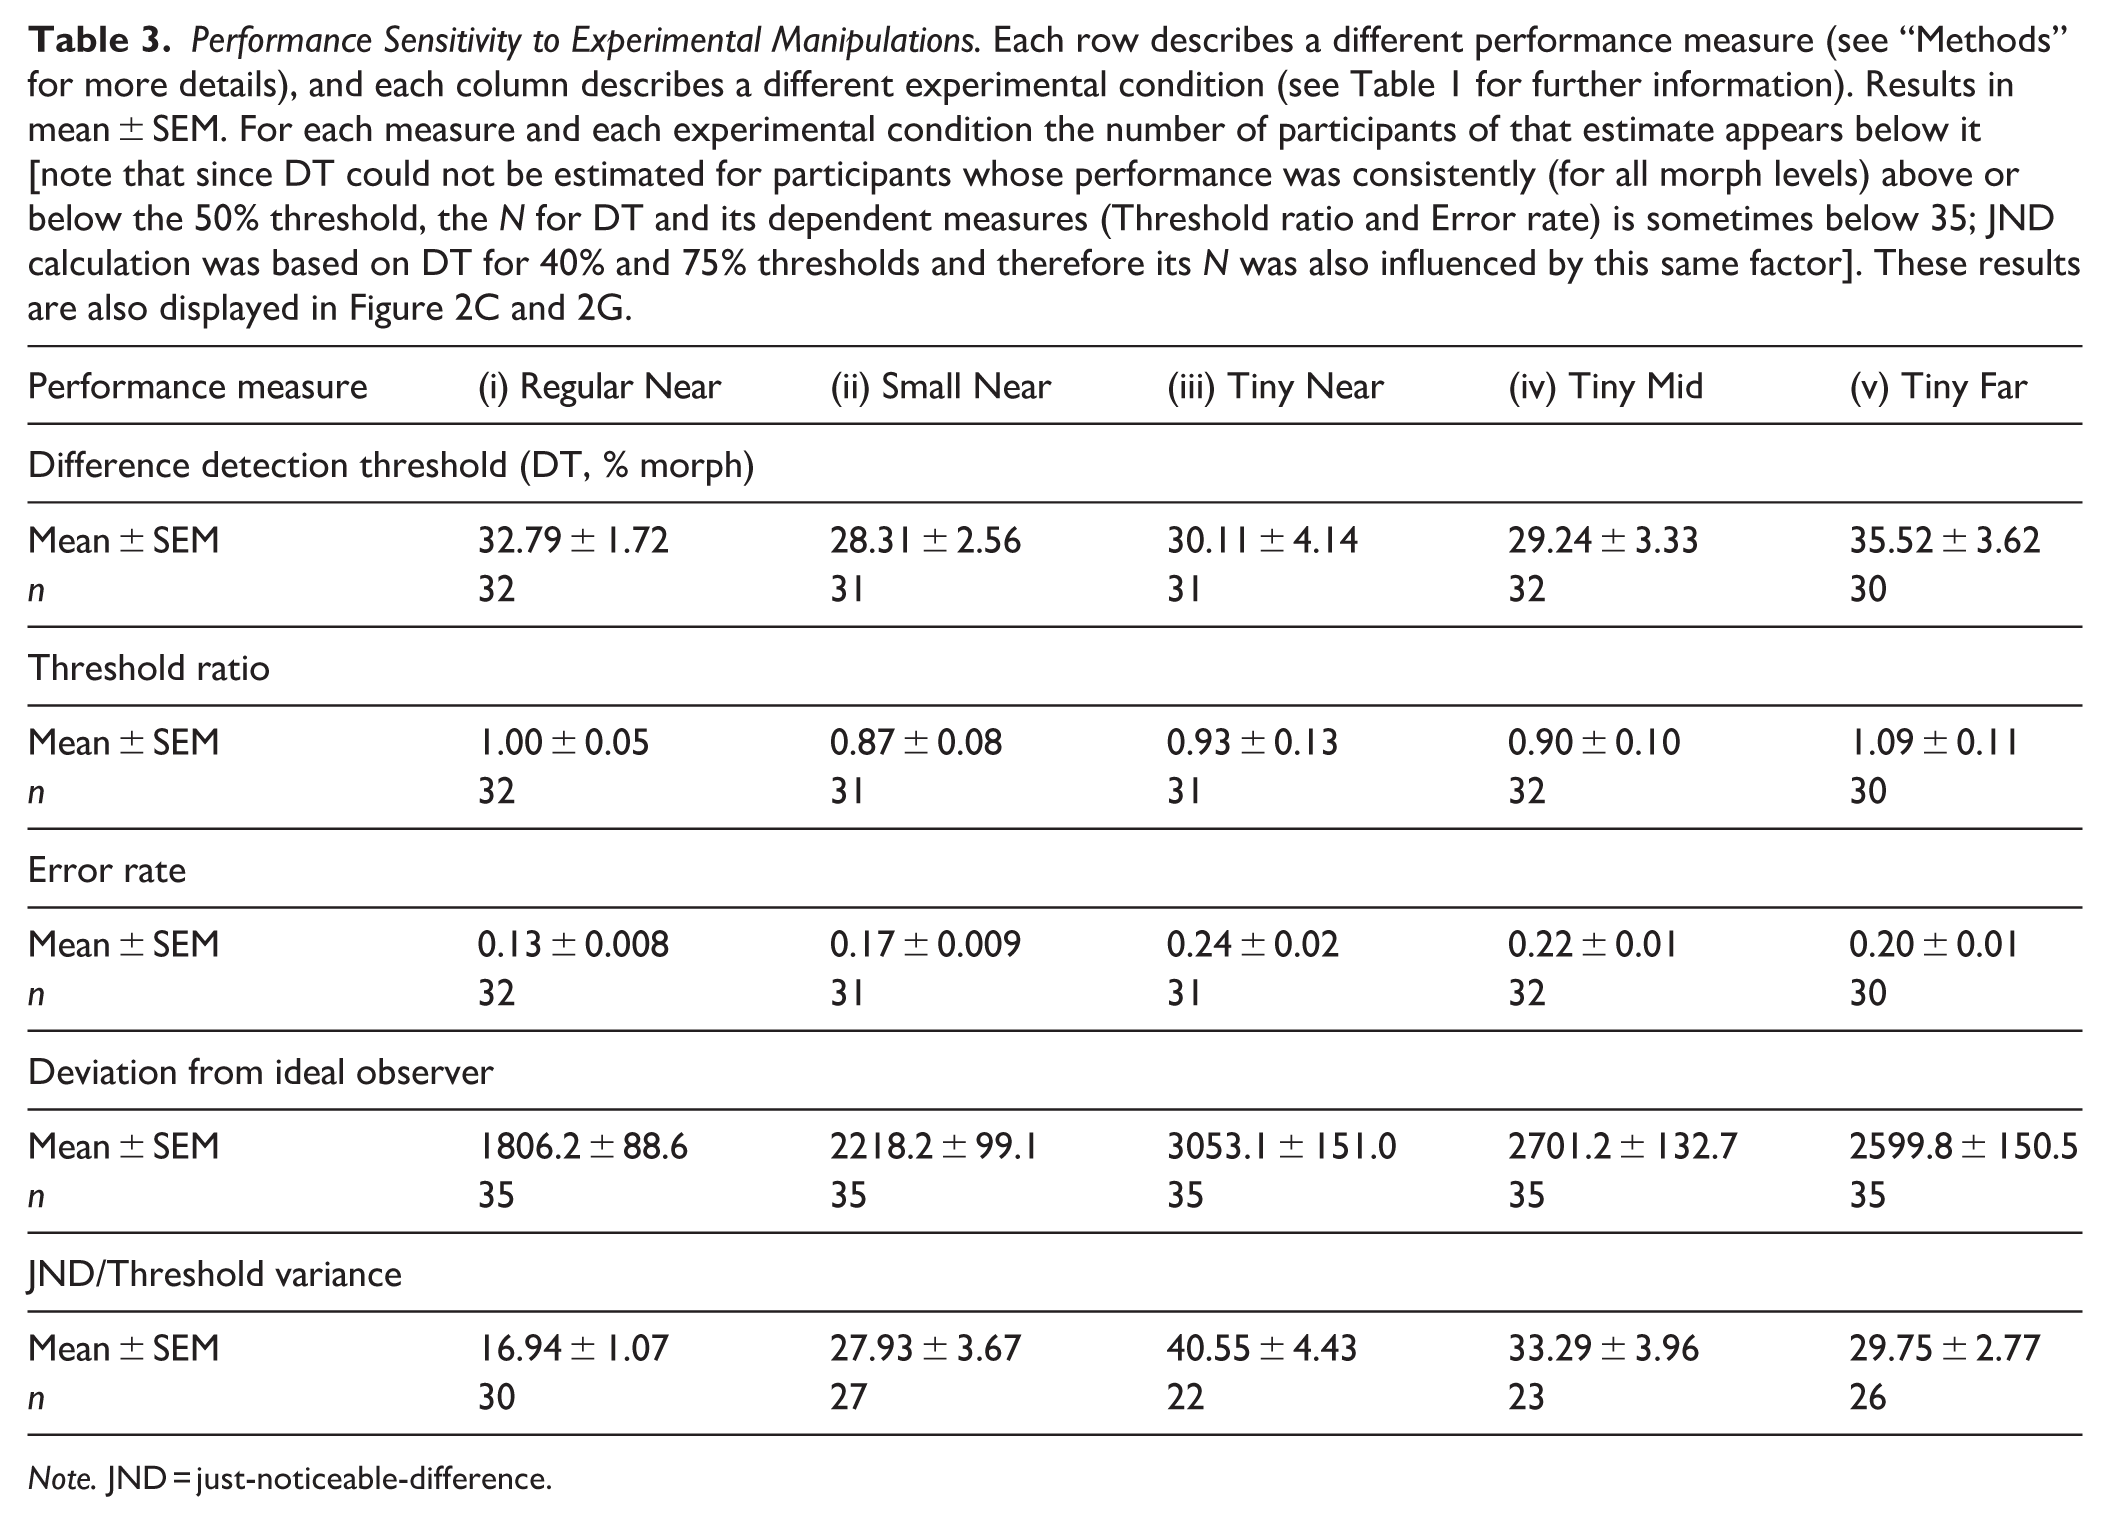
Note. JND = just-noticeable-difference.
Statistical Results (Repeated 1-Way ANOVAs). For each sensitivity performance measure, the accompanying 1-way repeated measures ANOVA to examine the effects of retinal size and viewing distance/world size on it (more details for each test in the leftmost column, factor examined in the 2nd left column, results in the 2nd rightmost column, post hoc results in rightmost column when a main effect was found). Significant results in bold.
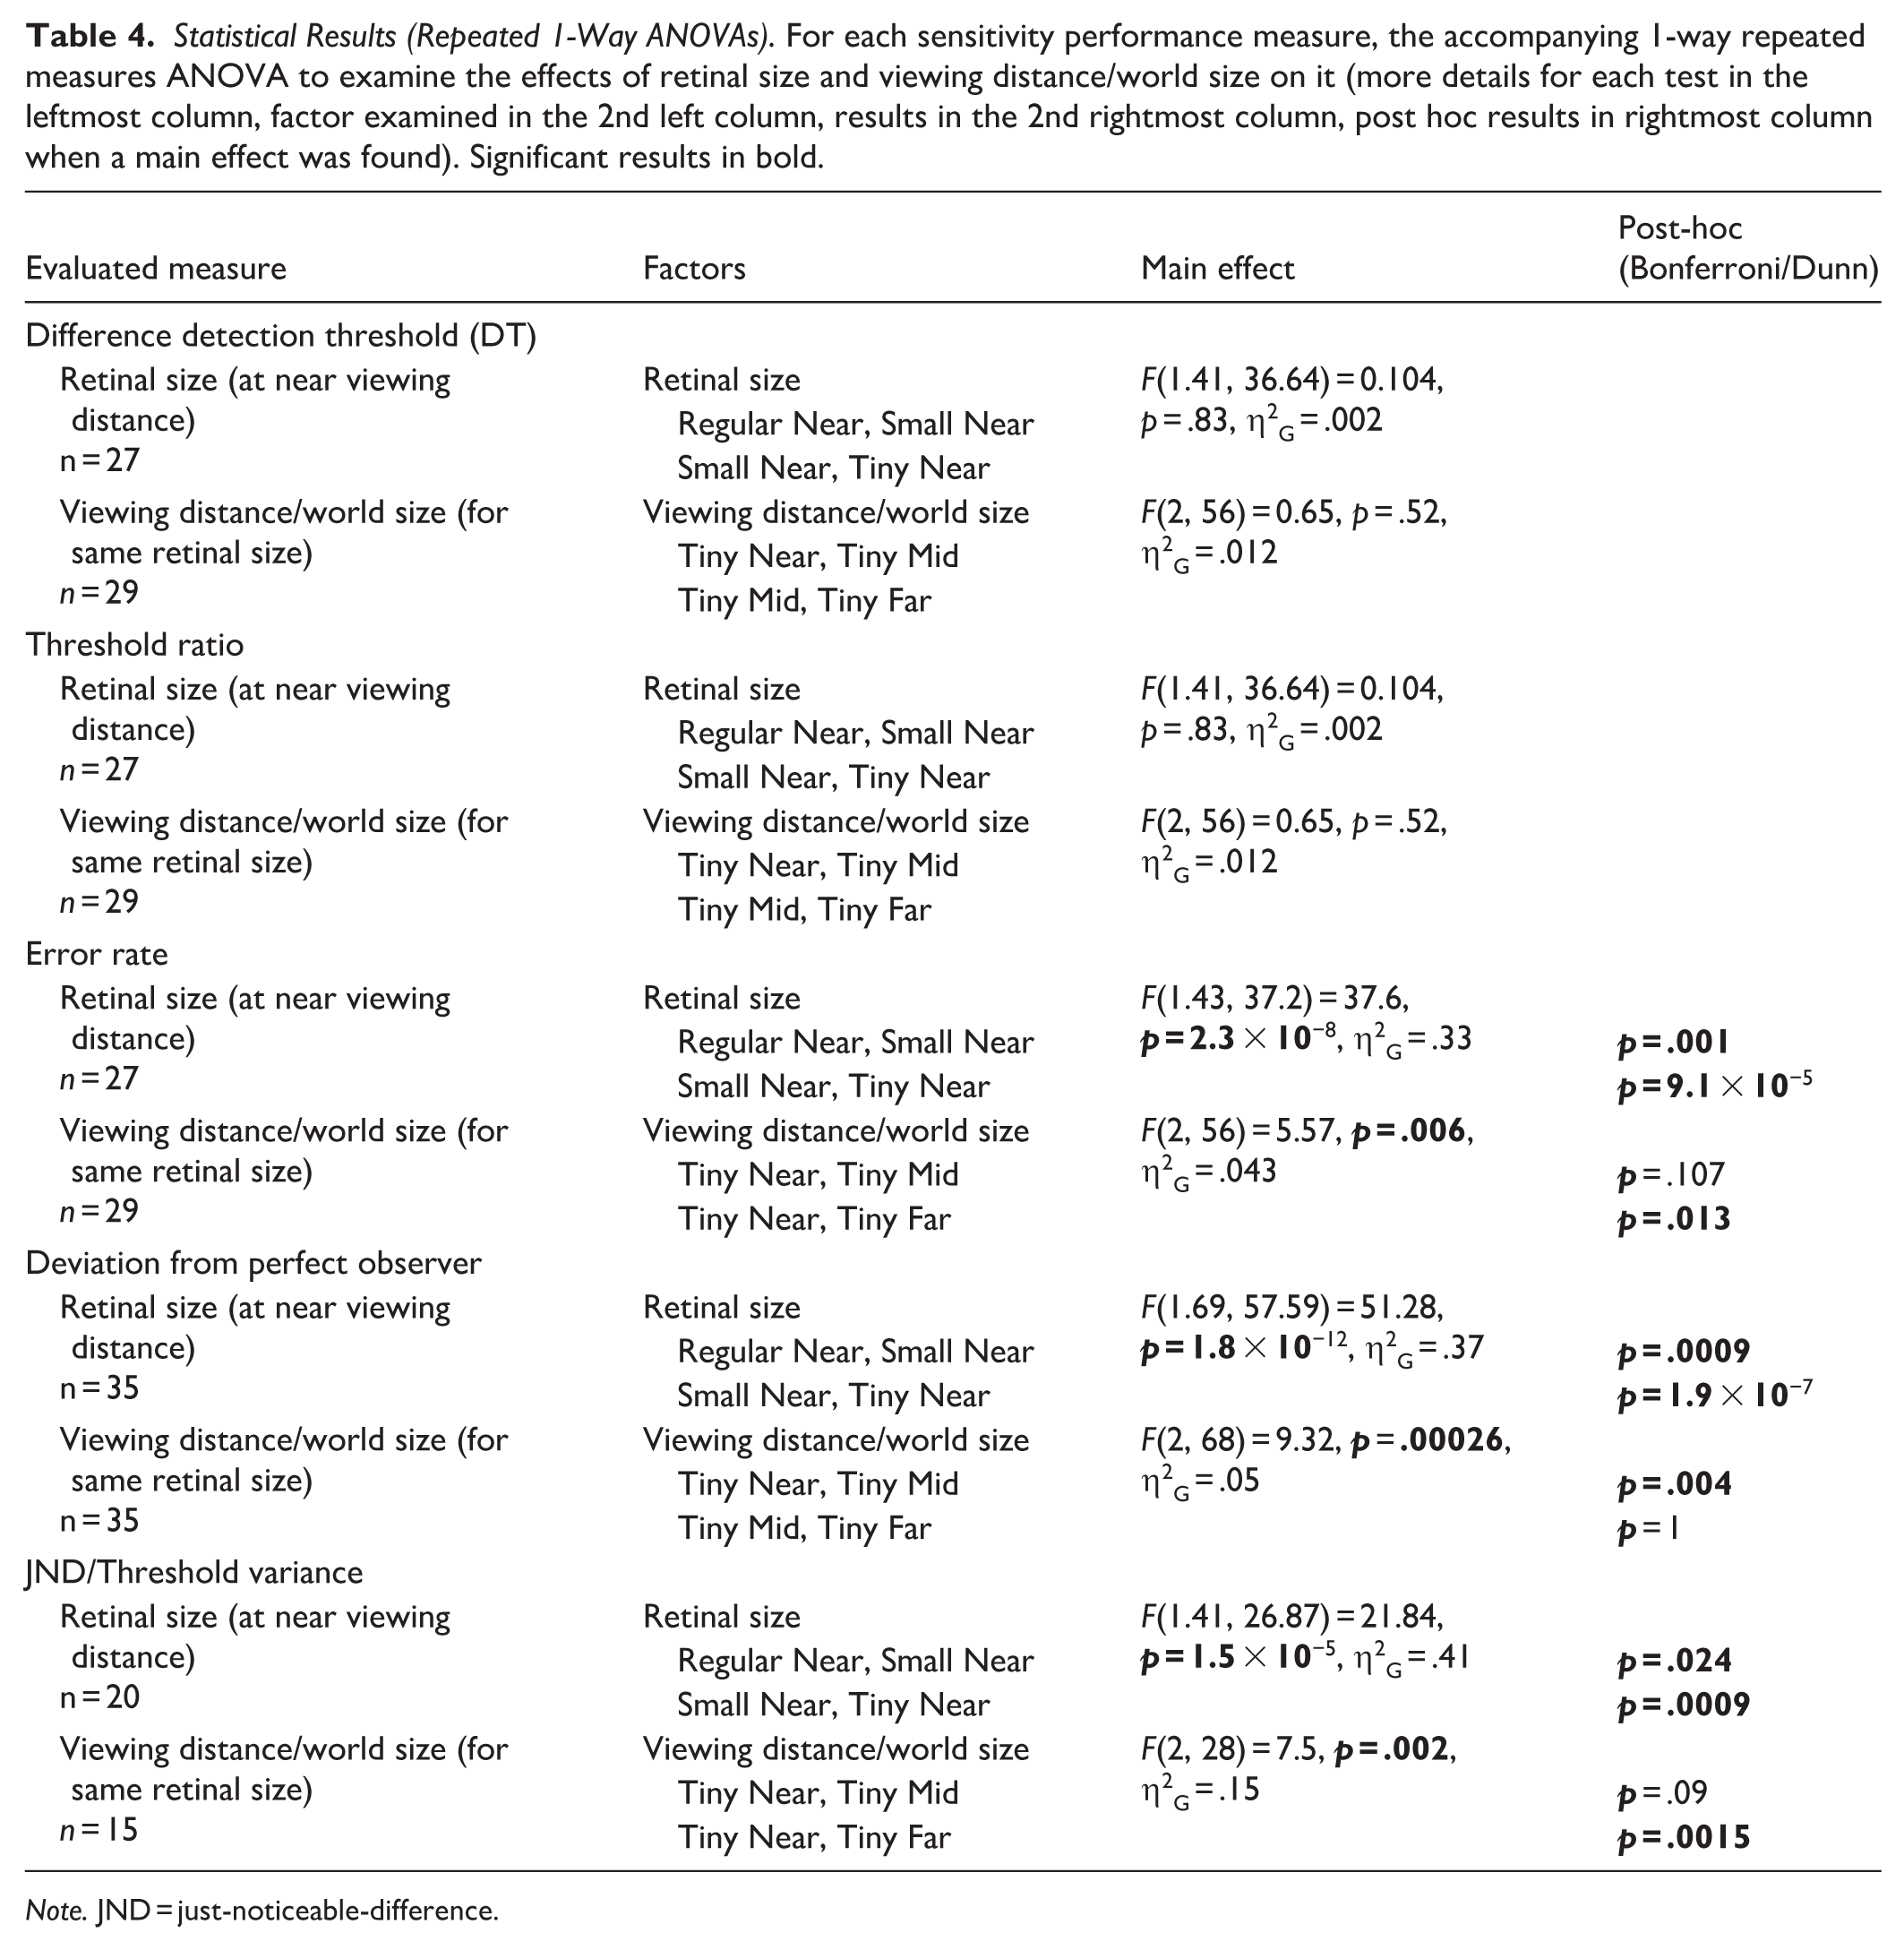
Note. JND = just-noticeable-difference.
DT (see illustration in Figure 2B) was not influenced by our experimental manipulations (retinal size effect F[1.41, 36.64] = 0.104, p = .83, η2G = .002; viewing distance effect F[2, 56] = 0.65, p = .52, η2G = .012; see Figure 2C). Additional calculations of DT for various threshold levels (and not only for 50% threshold, but also for 30%, 40%, 75%, and 85% perceived as different) were conducted and yielded similar results (see https://osf.io/cax52/). DT for the easiest condition (near [60 cm] regular condition [i]) was 32.79% ± 1.72% morph [SE] and therefore 32.5% morph was defined as the baseline DT of the ideal observer to serve as a reference for all conditions (see “Methods” for more details). In a similar manner, the threshold ratio, which has been used in the ideal observer framework to assess human performance relative to that of the ideal observer, was also estimated (see Figure 2D). As can be seen, threshold ratio was not influenced by our experimental conditions (retinal size effect F[1.41, 36.64] = 0.104, p = .83, η2G = .002; viewing distance effect F[2, 56] = 0.65, p = .52, η2G = .012) and this is in line with the DTs not being influenced as well by our experimental conditions.
To estimate discrimination precision, we performed several analyses. First, we examined the average discrimination error rate and as can be seen (see Figure 2E) this measure was significantly affected by our experimental manipulations (conditions [i]–[iii], 1-way repeated measures ANOVA: main effect of retinal size: F[1.43, 37.2] = 37.6, p = 2.3 × 10⁻⁸, η2G = .33; Bonferroni/Dunn post hoc: Regular vs. Small: p = .001, Small vs. Tiny: p = 9.1 × 10⁻⁵) and also for when retinal size was kept constant (at tiny) but varying viewing distance/world size changed, error rate was significantly affected (conditions [iii]–[v], 1-way repeated measures ANOVA effect of viewing distance/world size: F[2, 56] = 5.57, p = .006, η2G = .043; Bonferroni/Dunn post hoc: Near vs. Mid: p = .107, Near vs. Far: p = .013). Additional direct comparisons examining error rate when world size was constant but viewing distance and retinal size changed showed these factors significantly affected error rate (condition [ii] vs. [iv]: t[28] = −3.49, p = .0016; condition [i] vs. [v]: t[28] = 4.52, p = .0001, see Table 5). Second, we examined the deviation of each psychometric function from that of the ideal observer. To that end, we calculated the area between each psychometric function and that of the ideal observer (see illustration in Figure 2B where the psychometric function’s deviation from that of an “ideal observer” [performance switches from 0 to 1 in a step-function manner exactly at the DT, indicated by a gray line] is emphasized by striped, gray background). The results of this analysis by condition are presented in Figure 2F. As can be seen, there was a significant effect of retinal size on the deviation from the ideal observer (conditions [i]–[iii], 1-way repeated measures ANOVA: main effect of retinal size: F[1.69, 57.59] = 51.28, p = 1.8 × 10⁻¹², η2G = .37; Bonferroni/Dunn post hoc: Regular vs. Small: p = .0009, Small vs. Tiny: p = 1.9 × 10⁻⁷) and also for when retinal size was kept constant (at tiny) but varying viewing distance/world size changed, deviation from the ideal observer was significantly affected (conditions [iii]–[v], 1-way repeated measures ANOVA effect of viewing distance/world size: F[2, 68] = 9.32, p = .0002, η2G = .05; Bonferroni/Dunn post hoc: Near vs. Mid: p = .004, Mid vs. Far: p = 1). Additional direct comparisons examining the deviation from the ideal observer when world size was constant but viewing distance and retinal size changed showed these factors significantly affected the deviation (condition [ii] vs. [iv]: t[34] = −3.85, p = .0005; condition [i] vs. [v]: t[34] = 5.06, p = 1.4 × 10⁻⁵). These results were further replicated even when relying on DTs defined at 30%, 40%, 75%, and 85% perceived difference threshold (see https://osf.io/cax52/). Third, we also relied on the JND measure that has been used in ideal observer-related studies and examines more generally the shape of the psychometric function (vs. DT that is based on a single point on the psychometric function). JND reflects the steepness of the participant’s psychometric slope relative to that of an ideal observer (i.e., “ideal slope” of the step function), with smaller JNDs indicating steeper slopes, which are closer to ideal observer performance. Here we found, in line with the deviation from the ideal observer and error rate results, that JND was sensitive to our experimental manipulations (see Figure 2G; main effect of retinal size: conditions [i]–[iii], 1-way repeated measures ANOVA: F[1.41, 26.87] = 21.84, p = 1.5 × 10⁻⁵, η2G = .41, Bonferroni/Dunn post hoc: Regular vs. Small: p = .024, Small vs Tiny: p = .0009; main effect of viewing distance/world size: conditions [iii]–[v], 1-way repeated measures ANOVA: F[2, 28] = 7.5, p = .002, η2G = .15; Bonferroni/Dunn post hoc: Near vs. Mid: p = .09, Near vs. Far: p = .00015). Furthermore, when we directly compared whether JNDs were different when viewing distance and retinal size changed (but world size remained constant) we found a significant difference with much larger JNDs for larger viewing distances (condition [ii] vs. [iv]: t[20] = −2.78, p = .011; condition [i] vs. [v]: t[22] = 4.04, p = .0005). Interestingly, these measures (deviation from the ideal observer and JND [Figure 2H] or error rate [Figure 2I]) were significantly correlated for each experimental condition (all r’s ⩾ .60, all p’s ⩽ .0033; see Figure 2H–I). Additional ideal observer-related efficiency analyses can be found in https://osf.io/cax52/.
Statistical Results (t-Tests and Pearson’s Correlations). Additional statistical analyses. Paired two-tailed t-tests correspond to analyses presented in Figure 2E–G. Paired one-tailed t-tests correspond to Figure 3A and 3C, Pearson’s correlations correspond to analyses presented in Figure 2H and 2I, and one sample two-tailed t-test examine whether the perceived difference at 40% morph is significantly above chance for each of the experimental conditions. Significant results in bold.
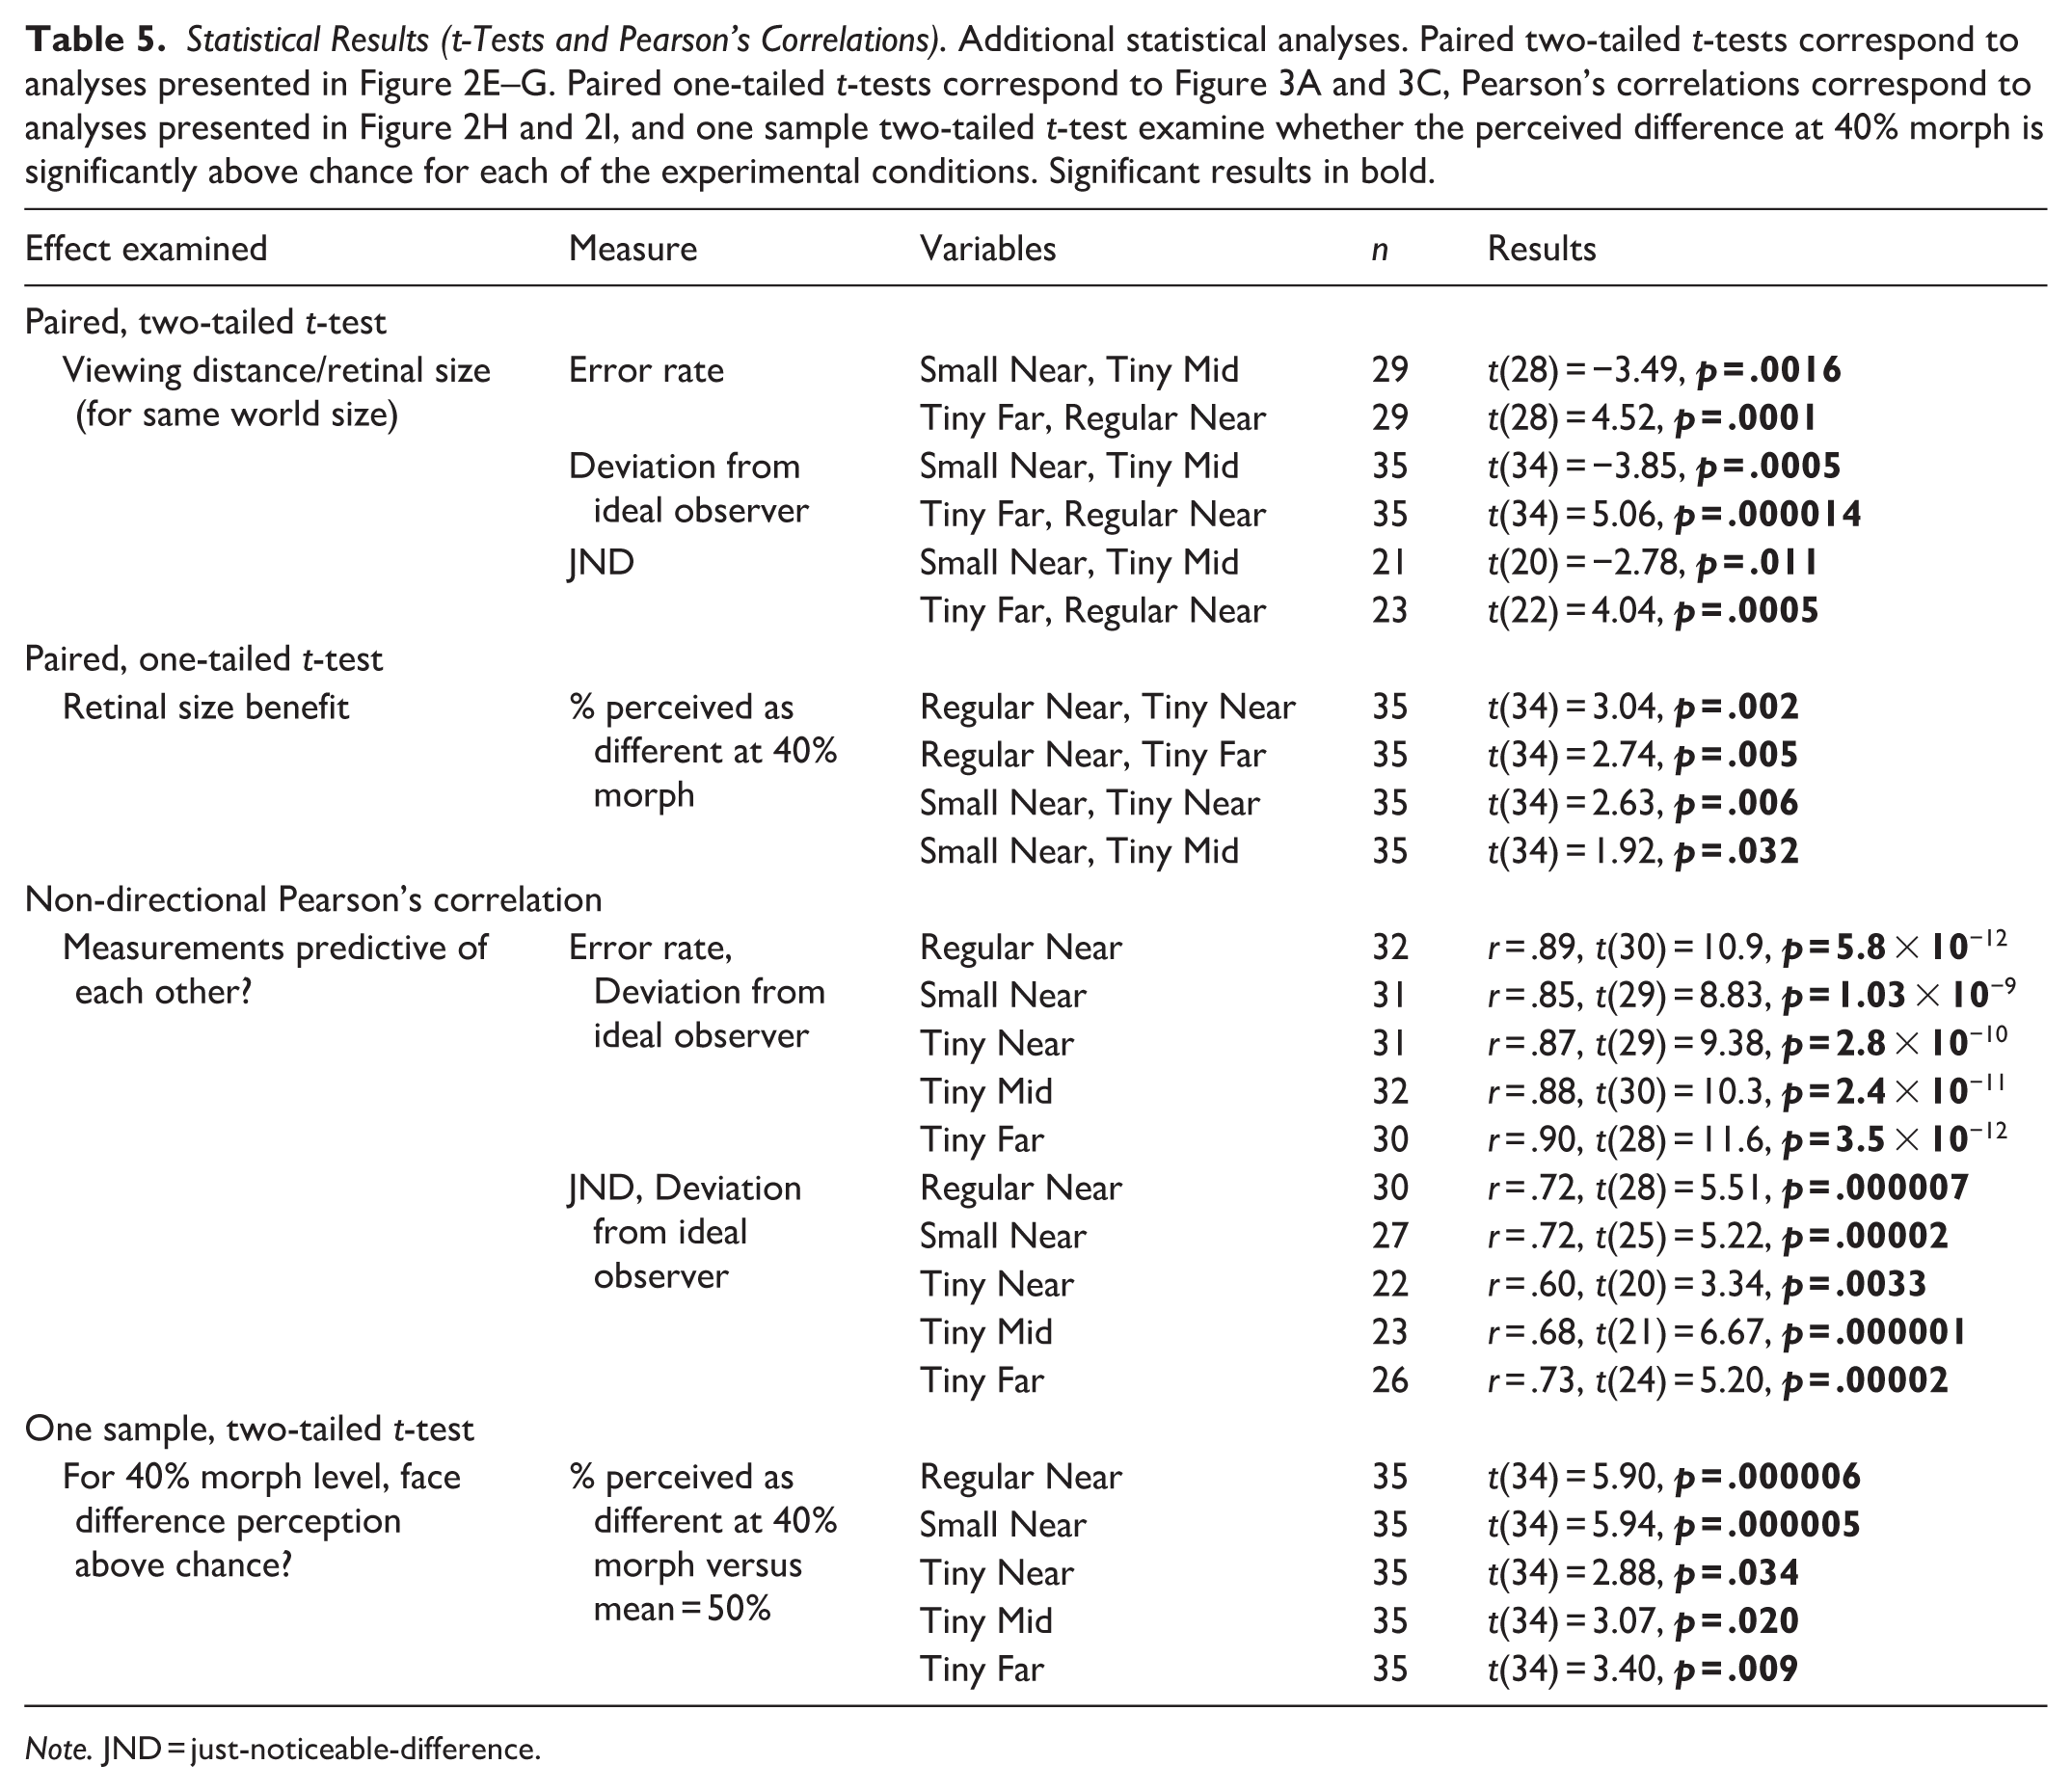
Note. JND = just-noticeable-difference.
These results indicate that while the threshold at which a difference is perceived (DT, threshold ratio) was not affected by the experimental conditions, discrimination precision (error rate, deviation from ideal observer and JND) decreased as the amount of information available to the retina was reduced.
Investigating Retinal Size-Related Discrimination Benefit at 40% Morph
While the previous analyses examined performance across the spectrum of the different morph levels, here we specifically focused on 40% morph level. It has been shown that at 40% morph people are already able to observe facial differences significantly above chance (Gilaie-Dotan, Gelbard-Sagiv, & Malach, 2010; Gilaie-Dotan & Malach, 2007). At the same time, since 40% morph is the first condition above the DT and differences amongst faces are still minor, it is likely to be the most difficult condition. Here we first replicated these findings where at 40% morph, face difference perception was significantly above chance in all five experimental viewing conditions (all t[34]’s > 2.88, all p[corrected]’s < .01; 1-sample t-tests for perceived difference at 40% morph conditions vs. 50% perceived difference). We also examined whether under these challenging conditions (40% morph) increased retinal size would improve face discrimination performance. Figure 3A shows that individual improvement in performance in the 40% morph for the biggest retinal size (Regular Near [i]) relative to performance for the smallest retinal size (Tiny Near [iii] on left, and Tiny Far [v] on right) was significant ([i] relative to [iii]: 11.66% ± 3.83% [SE] perceived difference benefit, t[34] = 3.03, p = .002, paired one-tailed t-test; [i] relative to [v]: 9.762% ± 3.558% [SE] perceived difference benefit, t[34] = 2.743, p = .004, paired one-tailed t-test). Figure 3B shows that these individual performance benefits were predictive of each other (r = .53, t[33] = 3.61, p = .0009). Figure 3C and 3D show the same type of analysis but for improvements in performance for the medium retinal sized conditions in our paradigm (Small Near [ii]) relative to performance for the smallest retinal size (as in Figure 3A and 3B). As can be seen, these retinal size benefits are also significant ([ii] relative to [iii]: 10% ± 3.8% [SE] perceived difference benefit, t[34] = 2.63, p = .006, paired one-tailed t-test; [ii] relative to [iv]: 7.85% ± 4.09% [SE] perceived difference benefit, t[34] = 1.91, p = .03, paired one-tailed t-test) and also predictive of each other (r = .57, t[33] = 3.99, p = .0003). These results suggest that regardless of world size or viewing distance changes, enhanced retinal size contributes to face discrimination at challenging conditions.
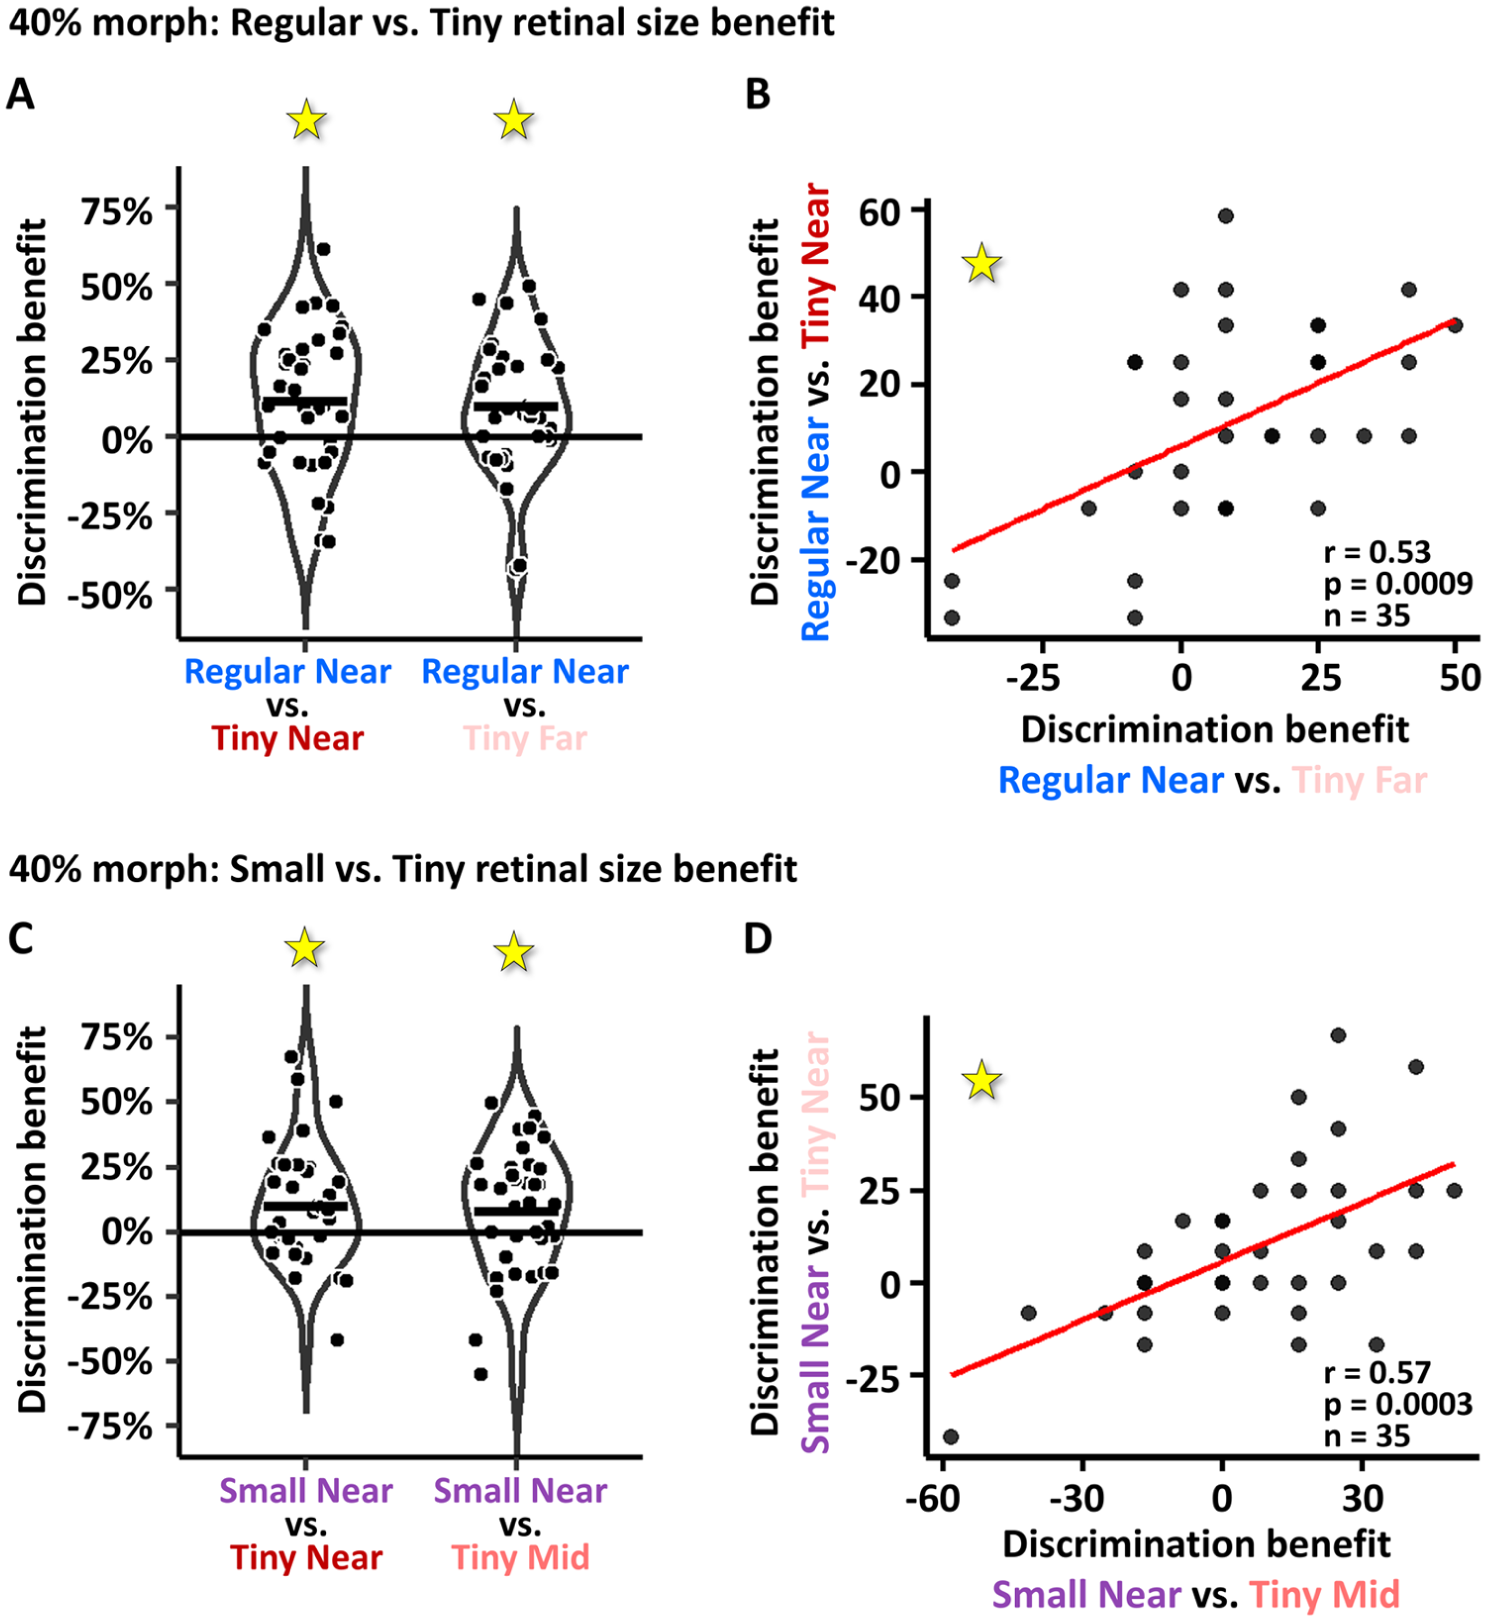
Increased retinal size discrimination benefit at 40% morph: (A) Improved face discrimination performance for largest retinal size (Regular Near) relative to the smallest retinal size conditions (Tiny Near [on left] and Tiny Far [on right]) for the 40% morph condition were significant (see “Results”) and were also significantly predictive of each other (see [B]). In each plot each dot represents data of one participant. (C, D) As in (A, B), improved face discrimination performance for the small versus the tiny retinal size conditions (Small Near on left and Tiny Mid on right) were found, and these were significantly predictive of each other. These results suggest that enhanced retinal size contributes to face discrimination at challenging conditions.
Individual Consistency Across Experimental Manipulations
To examine whether individual performance is consistent across conditions, we examined whether individuals show consistent change in performance relative to baseline across different conditions. First, we found that within the near viewing conditions (i, ii, and iii) the performance changes from the Regular Near (baseline) condition were correlated such that performance differences in the Small Near condition significantly predicted performance differences in the Tiny Near condition (r = .58, t[33] = 4.13, p = .0002; see Figure 4A). For the tiny retinal sized faces (iii, iv, and v), however, change in performance between far and near viewing conditions (iii vs. v) did not significantly predict change in performance between mid and near viewing conditions (iii vs. iv, r = .31, t[33] = 1.87, p = .07; see Figure 4B). We also directly compared performance for same world sizes conditions (i vs. v, and ii vs. iv) and found that the small world size conditions were predictive of each other (Small Near [ii] and Tiny Mid [iv]: r = .44, t[33] = 2.83, p = .008, Figure 4C) but this was not the case for the regular world size conditions (Regular Near [i] and Tiny Far [v]: r = .22, t[33] = 1.30, p = .20; Figure 4D).
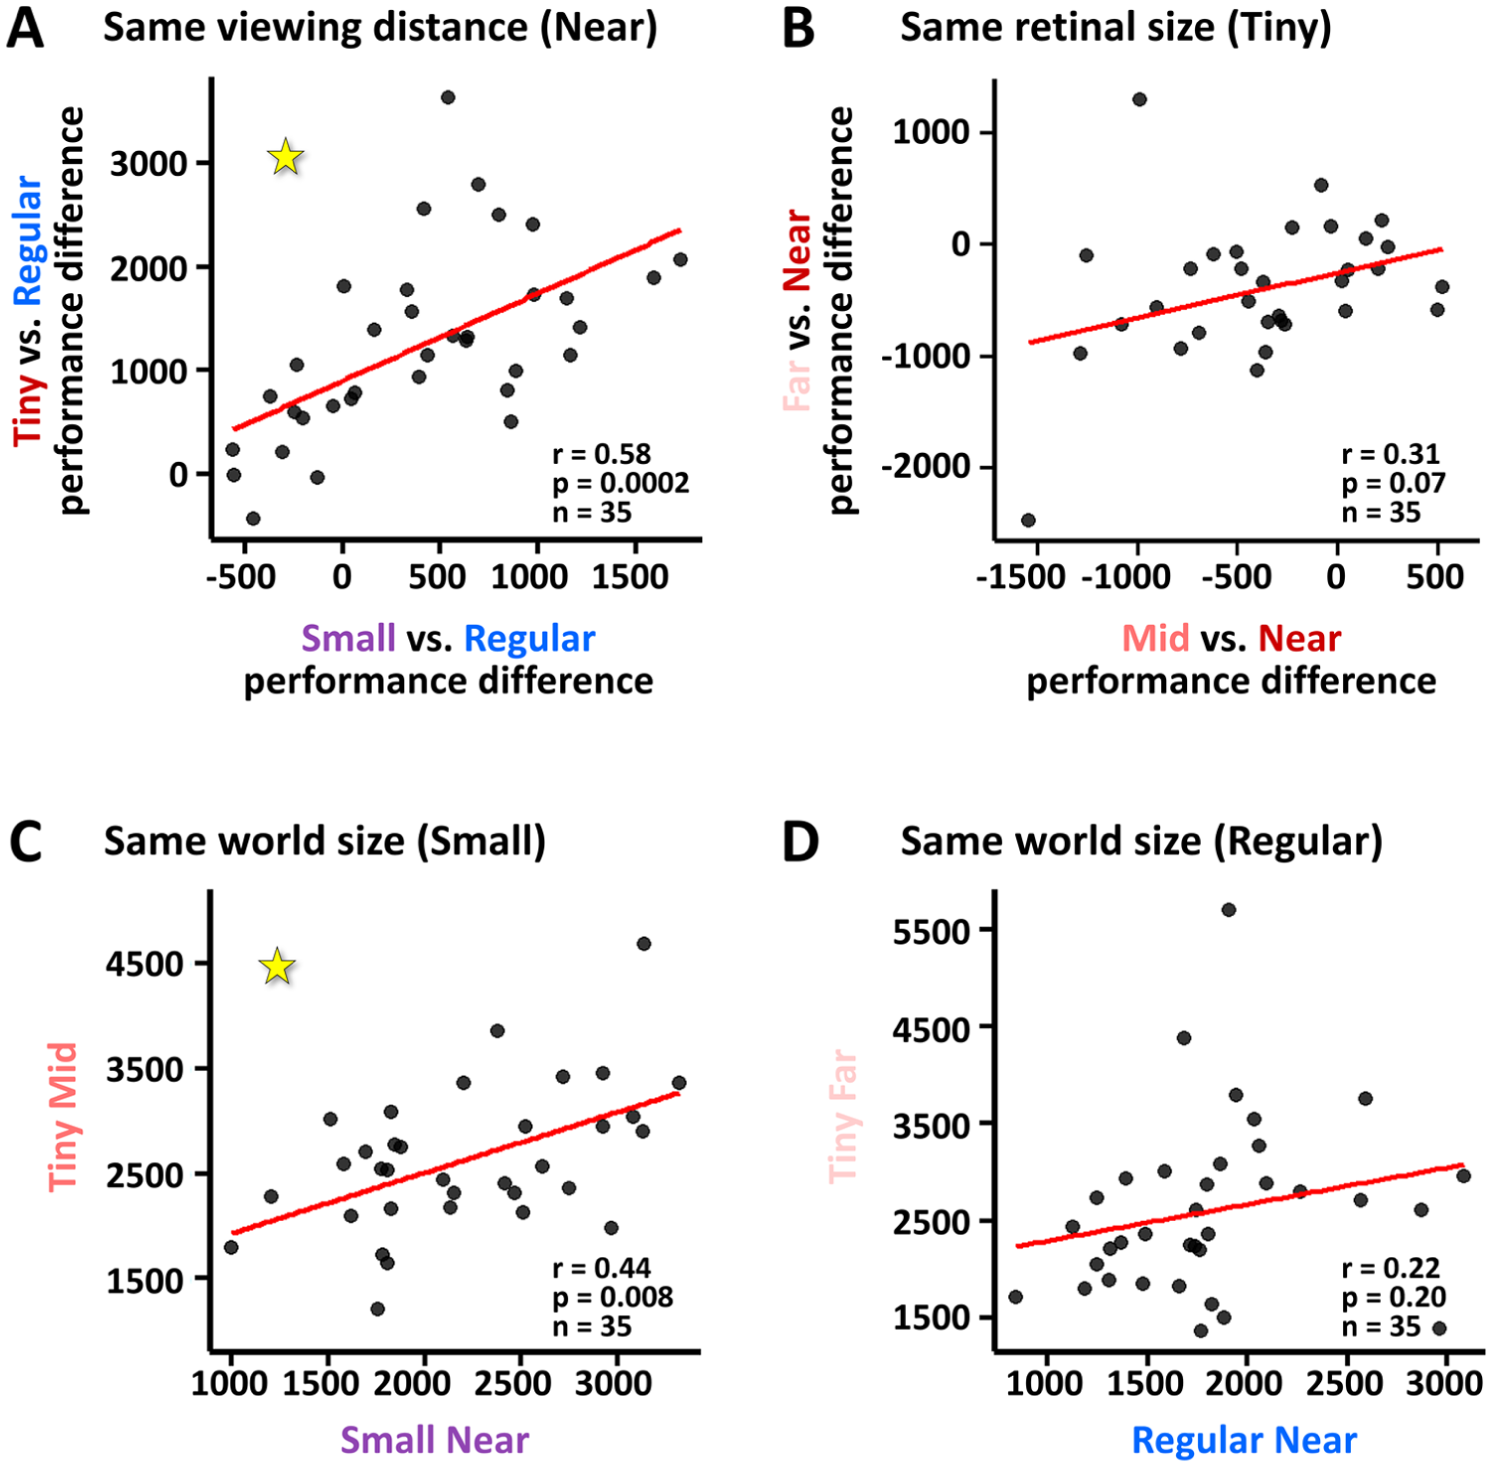
Individual consistency across experimental manipulations: (A) Individual performance modulation when changing image sizes at near vision from larger to smaller images is predictive of performance modulation when image size changes from larger to tiny images. At 60 cm viewing distance, the performance difference between Regular Near (baseline) and small conditions (x axis) was correlated with performance difference between Regular Near and the tiny condition (y axis). Performance was measured by the distance from the ideal observer. Each dot represents one participant. (B) Same analysis as in (A) but for same retinal size (tiny) revealed that the changes in the deviations from the ideal observer from Tiny Near were not significantly correlated for Tiny Mid (x axis) and Tiny Far (y axis) conditions. (C, D) For the same world size (small in C, regular in D), deviation from ideal observer for Tiny Mid (y axis in C) predicted that of Small Near (x axis in C) but not for regular world size (D).
Discussion
In this study we investigated whether face discrimination is sensitive to retinal size change while modulating retinal size, viewing distances and world size. We manipulated retinal size at the same viewing distance (similar to typical lab-based examinations) or by keeping world size constant and changing the viewing distances (in a more naturalistic approach) and we also manipulated viewing distance while keeping retinal image size constant (a lab-controlled non-naturalistic manipulation). Our findings show that these experimental modulations did not shift the sensitivity point of noticing facial differences (DT). However, smaller retinal image size (or less information provided to the retina) were associated with worse discrimination performance (estimated by the deviation from an ideal observer, error rate and JND). In addition, our results show that when world size stays constant and viewing distance grows (thus, retinal image is reduced, as in real life situations) face discrimination performance is adversely affected.
While DT was not sensitive to the manipulations we applied, discrimination sensitivity was. When we defined an ideal observer as a hypothetical person who successfully discriminates subtle face changes all the time at morph levels above her/his DT, it was clear that most people do not show perfect discrimination performance and therefore we estimated each participant’s deviation from that ideal observer for each of the experimental conditions. While we assume that different people may show different performance deviations from that of the ideal observer, our main research question was whether our experimental manipulations would modulate individual’s performance deviation from that of the ideal observer. We assumed that the bigger faces at near viewing condition we employed (“Regular Near”) which was the biggest retinal size condition and was at closest viewing distance would show highest performance if performance was not fully size-invariant. Indeed, we found that performance was not fully size-invariant and that at the near viewing distance performance significantly decreased with reduced retinal size. To examine whether this was a result of the limitations of screen resolution (as the tiny images do not convey the same amount of information per visual angle as the bigger images do (Masarwa et al., 2022), we compared the tiny retinal image size conditions at different viewing distances (near, mid and far) where growing viewing distance was associated with increased spatial resolution (more information per visual angle). Indeed, we found that when spatial resolution increased (more pixels per viewing angle), performance improved. Thus, these results indicate that retinal image size and more generally retinal information is a critical factor contributing to the ability to successfully discriminate faces and this may be regardless of viewing distance (pending that the retinal information retains its information and quality).
There are a few possible explanations for the imperfect size invariance for face discrimination we found. One possibility is that face size invariance may be reliant on specific spatial frequencies and this is in line with several studies investigating whether face perception processes are more sensitive to specific spatial frequencies (de Heering et al., 2007; Goffaux & Rossion, 2006; Keil et al., 2008; Laprévote et al., 2010; McKone, 2009; Mondloch et al., 2007; Oruc & Barton, 2010; Polat & Sagi, 1994; Schyns & Oliva, 1999; Vogelsang et al., 2018). Since retinal size changes (regardless of viewing distance) induce changes in spatial frequency content (both in real life and in the lab), they are also likely to affect spatial-frequency dependent size-invariance mechanisms. Furthermore, different spatial frequency contents may also lead participants to adopt different fixation-, focusing-, or behavioral-related strategies while performing different experimental conditions and this may have also influenced the results. Since we did not investigate and did not measure the effect of spatial frequencies on face discrimination, we cannot assess the contribution of spatial frequencies to performance. Another possibility may suggest that size invariance to faces may be part of a more comprehensive mechanism supporting person perception invariance which also takes into account additional dynamic (e.g., body motion, facial expressions) and non-facial (e.g., form related) cues (Aviezer et al., 2012; Gilaie-Dotan et al., 2019; Lecker et al., 2017; L. Martinez et al., 2016; Yovel & O’Toole, 2016). These additional cues that were not examined here may eventually lead to size invariant person perception. There is also a possibility that face perception becomes more size invariant with growing familiarity to faces (i.e., that the face representation is much more broadly tuned to facial changes for familiar faces relative to unfamiliar faces) including overcoming spatial frequency changes associated with retinal size changes. Our study cannot provide support for these potential explanations, and it is still an open question whether the results reported here about face discrimination generalize to additional face-related perceptual tasks (e.g., face recognition) or to non-face visual categories.
The difference detection threshold (DT) we found was not affected by the manipulations we applied across the five experimental conditions. Importantly, the mean DTs were all in the range reported in earlier studies using similar face morph-based paradigm that finds that people are able to detect differences already at 30% or 33% face morph (Gilaie-Dotan, Gelbard-Sagiv, & Malach, 2010; Gilaie-Dotan & Malach, 2007). These earlier findings were in line with activity in face-sensitive areas (Gilaie-Dotan et al., 2008; Grill-Spector et al., 2017; Kreichman & Gilaie-Dotan, 2024) and showed that the release from fMRI-adaptation was associated with the perceptual sensitivity to face differences. These paradigms used unfamiliar faces (A. Martinez & Benavente, 1998; Peer, 1999) and their results may not generalize to familiar faces. For example, if activity in face-related regions is indicative of DT, an earlier study using face morph on familiar faces (Rotshtein et al., 2005) found that these same face-sensitive areas were much less sensitive to physical facial changes when they were “within an identity” (i.e., less than 50% morph) and their sensitivity was only evident across identities (at more than 50% morph levels). Thus, this earlier study may suggest that for familiar faces, DT may be closer to 50% morph rather than in the range of 30% to 35% morph for unfamiliar faces, implicating that there may be higher invariance to familiar faces.
There is a long-standing discussion in the literature as to whether face perception is supported by dedicated face-specific mechanisms or not (Farah et al., 1998; Grill-Spector et al., 2017; Haxby et al., 2001; Parvizi et al., 2012). While the jury is still out, there are several factors that suggest that properties related to face processing may not automatically generalize to other visual categories. Brain areas sensitive to faces show central vision bias while many other visual categories are processed in peripheral-biased regions (Hasson et al., 2003; Kreichman & Gilaie-Dotan, 2024; Levy et al., 2001). Faces also rely on high-resolution spatial vision, have unique facial kinematics, and have special social relevance. In addition, neurophysiological studies show that face perceptual abilities may be dissociated from other perceptual abilities suggesting that other visual categories may be supported by other mechanisms (Gilaie-Dotan, 2016; Gilaie-Dotan & Doron, 2017; Gilaie-Dotan et al., 2015; Moscovitch et al., 1997). Together, these suggest that without direct future studies it may be difficult to predict if the imperfect size invariance in face discrimination we found here will or will not generalize to other categories.
There are several limitations we should acknowledge. First, our study’s viewing distance conditions did not perfectly mimic reality. In real life we need to recognize people from distances that can reach tens or even hundreds of meters, while in our study we only examined face perception up to 6 meters. Furthermore, in real life, faces at the viewing distances we tested occupy bigger retinal areas than the face stimuli used in our experiment. Nevertheless, despite the limited viewing range in our study and the non-typical face size per viewing distance, we found that face discrimination was not perfectly size invariant, indicating that in real life there may even be lesser invariance. Second, participants may have adopted different viewing and/or performance strategies for the different experimental conditions which may have confounded the results. Third, the variability across our facial discrimination stimuli did not encompass the variability found across everyday faces that people come across (different genders, ages, ethnicity etc.). Specifically, as detailed above, the different facial stimuli in our study originated from 48 different young men with neutral expressions. Despite the large number of different identities and stimuli used in our study (see “Methods”), since some stimuli and/or identities were repeated within and across experimental conditions and versions (see above), some learning may have taken place. Fourth, our participants came from similar backgrounds with similar educational, geographical, cultural and economic status and their age range was from 20 to 45 years. Fifth, both participants and stimuli were mainly of Caucasian origin, and therefore, our results may not generalize to situations corresponding to the other race effect (Sangrigoli et al., 2005; Tanaka et al., 2004). Importantly, since we only studied face stimuli in our study, further research is required to examine how these results generalize to other object- or form- related visual categories.
Our investigation into size invariance in human face discrimination emphasizes that retinal information (evident via retinal size and also retinal information resolution) is critical for determining the sensitivity to facial changes: the bigger or the higher resolution the image, the better performance will be. While face perception is known to rely on foveal (central vision) high resolution processes, this is not necessarily the case for other visual categories. For example, place perception is associated with peripheral vision and lower resolution processes, and object perception is associated with mid-eccentricity related processes. Therefore, it is unclear if theretinal resolution demands found here to affect face discrimination also apply to other visual categories. It is therefore necessary to examine these in future research bearing in mind each category’s unique processing demands.
Footnotes
Acknowledgements
We thank Yoram Bonneh and Uri Polat for suggestions. This research was supported by Israel Science Foundation grants 1485/18 and 1462/23 to SGD.
Ethical Considerations
This study received ethical approval from the Bar-Ilan University Interdisciplinary Research Unit Ethics Committee on 17 April 2016.
Consent to Participate
All participants provided written informed consent prior to participating.
Author Contributions
Olga Kreichman: Writing – original draft, Writing – review & editing, Visualization, Investigation, Validation, Formal analysis, Data curation, Conceptualization. Shlomit Zorani: Writing – original draft, Methodology, Investigation, Formal analysis, Data curation, Conceptualization. Sharon Gilaie-Dotan: Writing – review & editing, Writing – original draft, Supervision, Resources, Project administration, Methodology, Investigation, Validation, Funding acquisition, Data curation, Conceptualization.
Funding
The authors disclosed receipt of the following financial support for the research, authorship, and/or publication of this article: This research was supported by Israel Science Foundation grants 1485/18 and 1462/23 to SGD.
Declaration of Conflicting Interests
The authors declared no potential conflicts of interest with respect to the research, authorship, and/or publication of this article.