
Abstract
Holding people accountable has been heralded as a valuable measure for debiasing judgments and decisions. Vieider reported that holding people accountable for their decisions reduces loss aversion, the irrational tendency to overemphasize losses relative to gains. The present research initially aimed to clarify whether the reduced loss aversion under accountability reported by Vieider is driven by either process or outcome accountability. However, as we did not find any effects of either process or outcome accountability on loss aversion in two experiments, our focus shifted toward a direct replication attempt. Our third experiment used materials, procedures, and manipulations that closely matched those of the original study, and almost doubled its sample size. Despite these efforts, we still did not replicate Vieider’s findings, with a Bayesian test providing substantial evidence in favor of the null hypothesis of no difference between experimental conditions. We discuss two potential reasons for this replication failure, namely the possible unsuitability of the loss aversion measure in the original study and our replication experiments, and the possibility of a missing link between accountability and loss aversion.
Accountability has been defined as the pressure or expectation to justify one’s decisions to an authority, with consequences attached to that evaluation (Lerner & Tetlock, 1999; Simonson & Nye, 1992). Decision-makers are often held accountable for their choices, as accountability is essential to social and organizational relationships. Without accountability, bad decisions would have little or no consequences. Thus, accountability is a structural feature of organizations and societies, intended to make judgments and decisions more thorough and to reduce cognitive biases. One of the biases that can be reduced by accountability is loss aversion (Vieider, 2009).
Loss aversion describes the tendency of people to weigh losses more heavily than gains of the same magnitude (Tversky & Kahnemann, 1991) and is considered to be an example of an even more general cognitive bias pervading the human condition, referred to as the negativity bias (Baumeister et al., 2001; Rozin & Royzman, 2001). Often, loss aversion is assumed to be a fundamental part of human nature rooted in our evolutionary origins, as studies have shown loss aversion in different cultures (Maddux et al.,2010), in children (Harbaugh et al.,2001), and even in nonhuman primates (Brosnan et al., 2007; Kanngiesser et al., 2011; Lakshminaryanan et al., 2008). At the same time, other authors have debated the generalizability of these findings and, to some extent, even the existence of a general tendency of loss aversion in humans (e.g., Bleichrodt & L’Hardion, 2023; Ert & Erev, 2013; Gal & Rucker, 2018; Gächter et al., 2022; Mrkva et al., 2020; Yechiam, 2019; Yechiam & Hochman, 2013; Zeif & Yechiam, 2022). While this is an important debate, few, if any, scholars would disagree with the assumption that there are circumstances in which people irrationally overvalue losses relative to gains and, consequently, make suboptimal decisions. As a result, it seems fruitful to investigate possible moderators of the phenomenon termed loss aversion, 1 in order to find ways to improve decision-making under circumstances where this bias occurs.
In line with the idea that accountability can debias judgment and decision-making, Vieider (2009) reported evidence that accountability reduces loss aversion. In a laboratory experiment, he manipulated the perceived accountability by informing half of the participants that they would later be interviewed about their choices by an experimenter. The announcement of such interviews is the most common method for experimentally manipulating accountability in lab experiments (e.g., de Langhe et al., 2011; Girandola & Gauthier, 2001; Simonson & Staw, 1992). The other half of the participants received no such announcement. In contrast, they were informed that their choices could not be traced back to them and would be kept confidential. The decision task that Vieider’s subjects worked on was adapted from stimuli developed by Tversky and Kahnemann (1992). In this task, participants had to fill in a value into a two-outcome prospect (simple prospect) in such a way that they would be indifferent between the prospect and the status quo. The status quo represented a monetary outcome of 0, while the prospect made the participant lose a set amount of money with a probability of .5 or win the amount of money the participant had entered with a probability of .5. Higher proposed gains (to reach a point of indifference) reflect stronger loss aversion. In his experiment, Vieider found that accountable participants showed significantly less loss aversion than nonaccountable participants.
To the best of our knowledge, no replications of this effect have been published so far. There is one study by Pahlke et al. (2012) where somewhat similar results have been reported, but with some important caveats. In this study, participants had to choose 40 times between a certain monetary outcome and a binary prospect, that is, a gamble with two outcomes, both of which occur with a 50% chance. Pahlke and colleagues constructed these binary prospects as either gain (always having a positive expected value), loss (always having a negative expected value), or mixed (always having an expected value of 0) prospects. The amount of loss aversion was then measured by calculating the relative frequency of safe choices made for the mixed prospects. Pahlke et al. randomly assigned participants to either a responsibility condition or an accountability condition, and to the role of decision-maker or recipient. The decision-makers made 40 choices between a sure amount of money and the binary prospects for both themselves and the recipient, while the recipient only saw the choices the decision-maker made and indicated whether they were satisfied with them. In the responsibility condition, there was no direct interaction between the decision-maker and the recipient, as the identity of the decision-maker was not disclosed to the recipient. In contrast, in the accountability condition, decision-makers were informed that, after the experimental session, one of them would be randomly determined and interrogated by the recipient about the reasons behind their choices. Pahlke et al. (2012) found a significant interaction between accountability and mixed prospects, indicating that participants in the accountability condition choose the safe outcome for the mixed prospects less often than participants in the responsibility condition. However, they did not find any significant interactions between accountability and gain or loss prospects, even though one would expect significant loss aversion (which should be reduced by being held accountable), at least for loss prospects. These findings, therefore, only partially corroborate the results of Vieider’s (2009) original study. Accordingly, only the original study by Vieider (2009) provides clear evidence of an effect of accountability on loss aversion, which is why we will predominantly focus on it in our own experiments.
Despite all their other similarities and differences, one important caveat common to both these studies (Pahlke et al., 2012; Vieider, 2009) is that they neglect a crucial and common differentiation in accountability research. Specifically, they omit the distinction between process accountability and outcome accountability, which are two different types of accountability assumed to exert very different effects on judgments and decisions.
Process versus outcome accountability
Differentiating accountability into process and outcome accountability has been an influential step in accountability research (for an overview, see Patil et al., 2014). Outcome accountability is marked by a focus exclusively on the outcomes that decision-makers produce. In other words, when they are evaluated, they have to justify what outcomes they achieved, not how they achieved them. This type of accountability is usually found in economic organizations; for example, the CEO of a company is held accountable for corporate profits.
In contrast, process accountability is a form of accountability in which what matters is the kind of process a decision-maker used to reach a judgment or decision, not the outcome of that judgment or decision. This kind of accountability is often found in public offices and the healthcare sector, for example, the attending physician of a severely ill patient might be held accountable if they administer an unproven treatment even when the health outcome is positive, but not if they administer a proven treatment even when the health outcome is adverse. The main idea behind holding people process-accountable is that outcomes cannot always be guaranteed, even if the most efficient strategy was used and, thus decision-makers should only be held accountable for things what they can control.
The differentiation of these two types of accountability is important because, so far, most empirical (experimental) research on process versus outcome accountability indicates that they exert very different effects on judgments and decisions: according to the literature, process accountability tends to increase the quality of judgments and decisions, whereas outcome accountability often has been reported to have detrimental effects. For example, Brtek and Motowidlo (2002) found that process-accountable participants made more valid predictions regarding the future job performance of managers (based on simulated job interviews) than nonaccountable participants. In contrast, outcome-accountable participants’ judgments were even less valid with regard to job performance than those of non-accountable participants. Several studies have demonstrated similar differential effects of process and outcome accountability, such as differences in judgment quality (Siegel-Jacobs & Yates, 1996) and in the revision of the fixed-pie bias in negotiations (L. J. Chang et al., 2013).
The main mechanism that has been proposed for these different effects on judgment and decision quality is that process accountability increases epistemic motivation (De Dreu et al., 2000, 2006), which leads to a more thorough evaluation of the available information (Brtek & Motowidlo, 2002; Ford & Weldon, 1981), whereas outcome accountability does not bring about similar changes in epistemic motivation (or might even detract from finding the best possible solution). Increased epistemic motivation, in turn, leads to a reduction in decision-making biases and an increase in decision quality, as long as “the normatively correct response can be identified by [. . .] more thorough and complex information processing” (Simonson & Nye, 1992, p. 416).
Taking these findings into account, the differentiation between process and outcome accountability should also have implications for the effect of accountability on loss aversion. Specifically, we would expect that holding people process-accountable would lead to a more thorough evaluation of the decision-making task, enabling them to recognize that loss aversion is an irrational bias in their decision-making, and ultimately reduce it. For outcome accountability, on the other hand, we would not expect that it will lead to a reduction in loss aversion. If anything, the literature so far suggests that outcome accountability might even somewhat facilitate loss aversion, because decision-makers under outcome accountability have been found to do “more of the same thing,” that is, to follow their dominant strategies, which might also mean that common biases are exaggerated (e.g., Brtek & Motowidlo, 2002; Siegel-Jacobs & Yates, 1996).
Although there is no reference to outcome versus process accountability in the study by Vieider (2009) or Pahlke et al. (2012), we are of the opinion that both studies predominantly manipulated process accountability. Vieider (2009) states that, for the manipulation of accountability, participants were told that they would be interviewed by an experimenter “about their choices” (Vieider, 2009, p. 98) after they completed the experimental task. While this wording leaves it somewhat open to interpretation whether it is intended to induce process or outcome accountability, it, in our view, more closely resembles a typical process accountability manipulation than a typical outcome accountability manipulation. To provide a comparison: In their replication of the seminal study by Simonson and Staw (1992) about effects of process and outcome accountability on escalating commitment, Schulz-Hardt et al.’s (2021) told participants in the process accountability condition that, after completing the experimental task, a researcher would conduct an interview with them that “will refer exclusively to [their] working process” (Schulz-Hardt et al., 2021) and in which the “interviewer will only be interested in how [they] proceeded with [their] predictions and decisions, but will not care about the accuracy and the results” (Schulz-Hardt et al., 2021). In contrast, participants in the outcome accountability condition were told that in the interview they would be evaluated “with regard to the accuracy of [their] predictions, and the result of [their] investment decisions” (Schulz-Hardt et al., 2021) and that “how [they] proceeded with [their] predictions and decisions will not be subject of the interview” (Schulz-Hardt et al., 2021).
Furthermore, there are three additional reasons why we believe that Vieider’s manipulation predominantly induces process accountability. First, Vieider’s straight matching task does not lend itself very well to questions regarding the quality of the choices, as the task is phrased in terms of personal preferences, which cannot be easily assessed as right or wrong. Second, because of the “unnaturalness” of the assessment of the quality of choices, we believe that if the manipulation were meant to induce outcome accountability, it should have been worded differently, namely, by explicitly telling participants that, in the interview, they would be asked about and required to justify the quality of their choices. Third, given that the existing literature on accountability has predominantly shown that only process accountability is effective in debiasing decisions, the fact that Vieider (2009) shows such a debiasing effect could be taken as another indication that his manipulation, for the most part, induced process accountability.
In a similar vein, even though it is never explicitly stated, it seems fairly obvious that Pahlke et al. (2012) manipulated process accountability in their experiment, as the decision-makers in the accountability condition were told that they would be interrogated by the recipient about the reasons behind their choices and, thus, would have to explain their decision-making process to the recipient.
Then again, regardless of whether Vieider (2009) and Pahlke et al. (2012) predominantly induced process accountability, outcome accountability, or a mix of the two, the manipulations they employed, did not explicitly differentiate between these two forms of accountability. Given the fact that the broader literature on the effects of accountability on judgments and decision-making has shown differential effects of process and outcome accountability, it seems imperative to follow up on the ambiguous accountability manipulations Vieider (2009) and Pahlke et al. (2012) used in their studies by clarifying the effects of the two types of accountability on loss aversion.
The present research
The initial aim of the present research was to extend Vieider’s (2009) findings by testing for differential effects of process and outcome accountability on loss aversion, expecting debiasing effects for process accountability only. However, since we were unable to replicate Vieider’s original finding in two experiments, that is, we did not find any effects of either form of accountability on loss aversion (all details about these two experiments are described below), the present study’s focus shifted toward a full-fledged replication attempt. To this extent, we conducted a third experiment that focused solely on the original study’s experimental conditions, employed the original materials and procedures as precisely as possible, and significantly increased the sample size compared to the original study. In the following, we report the results of our three experiments.
Transparency and openness
We report how we determined our sample size, all data exclusions (if any), all manipulations, and all measures in the study. All data and research materials are available at our OSF repository (https://osf.io/9psrx/). The designs and analysis plans for the three experiments reported here were not preregistered.
Experiments 1a and 1b
Our first two experiments aimed to differentiate between the effects of process and outcome accountability on loss aversion. We used experimental materials and procedures that closely resembled those of Vieider’s (2009) original study. At the same time, we revised the manipulation of accountability by adjusting the wording so that it clearly targeted process accountability. Furthermore, we added a second accountability condition, namely a typical manipulation of outcome accountability, in order to test for differential effects of these two forms. Experiments 1a and 1b were highly similar with data collection conducted independently in two different labs and in close temporal proximity.
Method Experiment 1a
Participants and design
The sample of Experiment 1a was comprised of 102 participants (84 women, 18 men) of whom 98% were undergraduate or graduate students from the University of Hildesheim. The rationale for this sample size was to obtain a sample roughly similar in size to that of the original study by Vieider (2009). Participants studied a diverse set of subjects, with the most prominent groups being psychology students (34%) and students enrolled in teacher training (14%). The age of the participants ranged from 19 to 24 years (M = 21.80, SD = 2.51). Participants were randomly assigned to one of three experimental conditions in a one-factorial between-subject design (no accountability vs. process accountability vs. outcome accountability).
Experimental task
Participants were presented with a German translation of the straight matching task employed by Vieider (2009), which was an adaptation of stimuli developed by Tversky and Kahnemann (1992). In this task, participants received pairs of options consisting of a sure amount of 0€ (the status quo, neither winning nor losing any money) versus a gamble with a 50% chance of losing a certain amount and a 50% chance of winning a certain amount. While the amount one could lose in a specific gamble was specified in the materials, participants had to fill in the potential gain (the amount one could win) such that they felt indifferent between playing the gamble and maintaining the status quo. Figure 1 depicts an exemplary trial of this straight matching task. This task allows us to approximate a loss aversion index λ by simply dividing the potential winnings participants entered for a specific gamble by the corresponding losses—identical to what was done in the original study by Vieider (2009). Thus, λ gives us the ratio of how big a gain has to be in order to be perceived as having equal value as a certain loss. Accordingly, if losses and gains are weighted equally, that is, there is no loss aversion, λ takes on a value of 1. Whenever gains and losses are not weighted equally, λ differs from 1, with values bigger than 1 indicating loss aversion, and values smaller than 1 indicating gain seeking. 2 In total, the task consisted of eight outcome pairs, the first four consisted of the simple prospects described above, which were used to measure the loss attitude of our participants, and the second set of four prospects were included to check for consistency in the answers of participants, in this, we again, exactly follow the procedure of Vieider’s (2009) original study.
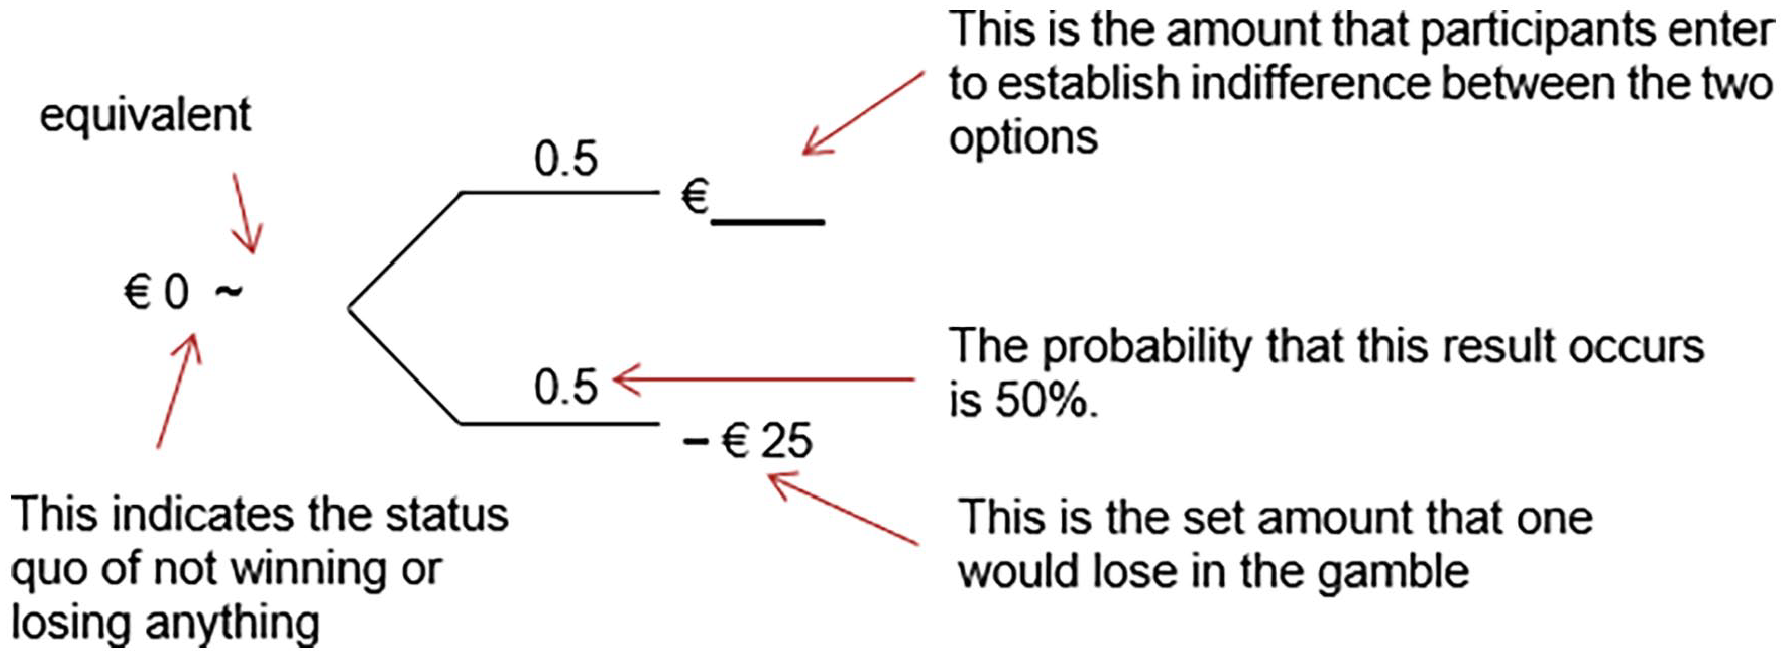
Exemplary trial of the straight matching task with additional explanations.
Manipulation of accountability
In the accountability conditions, participants were informed that they would have an interview with a researcher involved in the current experiment’s research project. The interview would take place right after they had completed the experimental task. This manipulation is similar to the one employed by Vieider (2009) and, in general, constitutes a typical experimental manipulation of accountability (e.g., de Langhe et al., 2011; Girandola & Gauthier, 2001; Simonson & Staw, 1992). The main difference compared to Vieider’s original study is that we explicitly specified the focus of the interview. In the outcome accountability condition, participants were told that: “After this task, we want to conduct an
Instruction and manipulation checks
We asked participants several questions to ensure that they understood the instructions and that the manipulation of the two different forms of accountability was successful. First, participants answered a single-choice item asking what they felt accountable for while working on the task (process, outcome, or neither). Then, if they belonged to one of the two accountability conditions, participants answered a single-choice item by indicating whether the interview would be about either the process they used to complete the task or the outcome they achieved. 3
Procedure
Participants received the first part of the experimental materials, in which they learned that, for the experimental task, they would be presented with pairs of gambles, and that they should imagine that for each pair of gambles, one gamble would be chosen for them at random and that they would have to play it afterward. They then learned that the gambles were not yet complete. Instead, in each pair, one value was missing from one of the gambles (this was always the “gain value” for the gamble on the right-hand side), and their task would be to fill in the missing value in such a way that they would feel indifferent between the two gambles. Participants in the two accountability conditions were then informed that they would be interviewed after completing the task, and this interview would either exclusively be about the procedure they used to make their choices (process accountability) or the specific choices they made (outcome accountability). 4
All participants gave their informed consent and were handed the remainder of the experimental materials. Participants completed an initial questionnaire which included the instructions, manipulation checks, and some exploratory measures, and then began the straight matching task which consisted of eight prospects in total. The experiment concluded with a final questionnaire that included a suspicion check and some demographic questions. After completing this final questionnaire, participants were informed that there would be no interview, and that the experiment was actually over at this point. They were then fully debriefed and received 5€ for their participation.
Results Experiment 1a
All three of our experiments were initially planned with classic frequentist hypothesis testing in mind. However, after refocusing our studies in the direction of a replication attempt, we decided to run Bayesian analyses of our data to qualify not only the evidence for our alternative hypothesis, but also for the null hypothesis. While we will also report the results of the frequentist analyses, our conclusions will be based on our Bayesian tests. We are aware that mixing two different statistical approaches is generally discouraged; however, we felt it was essential in this case to also report the frequentist results, allowing readers to directly compare our findings with those of the original study.
All analyses were conducted with JASP (JASP Team, 2022), while data processing was performed with R (R Core Team, 2022) and the package dplyr (Wickham et al., 2022). For our Bayesian analyses, we used the standard priors implemented by JASP (e.g., Cauchy priors with r-scale = 0.707 for Bayesian t-tests). Throughout our analyses, we report BF10 values. The BF10 values quantify the extent to which the data show evidence for the alternative hypothesis over the null hypothesis, with BF10 values larger than 1 indicating that data favor the alternative hypothesis, and BF10 values smaller than 1 indicating that the data favor the null hypothesis. For the interpretation of the Bayes factors, we followed Jeffreys’ (1961) recommendations: BF10 values over 3 (under 0.33) indicate substantial evidence for the alternative hypothesis (null hypothesis), BF10 values over 10 (under 0.1) indicate strong evidence, BF10 values over 30 (under 0.033) indicate very strong evidence and BF10 values over 100 (under 0.01) are interpreted as decisive evidence. In a slight departure from Jeffrey’s original recommendation, we decided to modify his wording and consider BF10 values between 3 and 1/3 inconclusive.
Instruction and manipulation checks
Concerning the question of what participants felt accountable for while working on the experimental task, a Bayesian contingency table test remained inconclusive, slightly favoring the alternative hypothesis that there is a difference between experimental conditions, BF10 = 1.96 (χ2(4) = 9.74, p = .045, for the frequentist chi-square test). Further testing via Bayesian multinomial tests in the individual experimental conditions showed decisive evidence that the distribution was not random for the process accountability condition, BF10 = 119.69, χ2(2) = 15.27, p < .001, as well as substantial evidence that the distribution was not random in the outcome accountability condition, BF10 = 6.60, χ2(2) = 8.71, p = .013. In contrast, evidence in the control condition was substantially in favor of the null hypothesis, BF10 = 0.33, χ2(2) = 3.46, p = .178. A closer look at the nonrandom distributions in the two accountability conditions showed that the majority of the participants in the process accountability condition correctly answered that they felt accountable for the process while working on their task (21 of 34 = 62%), while 9 (26%) answered that they felt accountable for the outcome, and 3 (9%) answered that they felt accountable for neither the process or the outcome. In the outcome accountability condition, a slight majority of the participants (18 of 34 = 53%) also answered that they felt accountable for the process while working on the task, whereas only 12 out of 34 (35%) answered that they felt accountable for the outcome of their decisions, and 4 (12%) answered that they had not felt accountable for either. In other words, we were able to establish process accountability, but we somewhat failed to do so for outcome accountability.
For the additional instruction check (“What will the interview following the completion of the experiment be about?”), we conducted a Bayesian contingency table test comparing the two accountability conditions and found strong evidence for a difference between these two conditions, BF10 = 17.65, χ2(1) = 8.01, p = .005. Once again, we used Bayesian multinomial tests for the distribution in the individual conditions. For the process accountability condition, we found decisive evidence for differences from a random distribution, BF10 = 10,584.21, χ2(1) = 19.88, p < .001, whereas for the outcome accountability condition we found substantial evidence that the answers of the participants were randomly distributed, BF10 = 0.31, χ2(1) = 0.76, p = .384. Similar to our first instruction check, process-accountable participants were mostly able to correctly answer this question (30 of 34 = 88%), whereas only 14 out of 34 participants (41%) in the outcome accountability condition answered correctly.
These results indicate that our manipulation of accountability has been only partially successful. While we find rather convincing evidence that our manipulation of process accountability was working as intended, the same cannot be said for our manipulation of outcome accountability. The majority of participants in the outcome accountability condition indicated that they felt accountable for the decision-making process. Additionally, outcome-accountable participants, when being asked what the interview with the researcher would be about, chose decision process and decision outcomes about equally often.
As a consequence, this experimental manipulation does not allow us to test for differential effects of process versus outcome accountability. However, as we were able to establish the intended difference between process accountability and the control condition, it does allow us to investigate the effects of process accountability on loss aversion and, thereby, test whether Vieider’s (2009) findings can be replicated (as we consider his manipulation to be a manipulation of process accountability). Vieider himself did not report any manipulation or instruction checks; thus, it is unclear which psychological effects his manipulation of accountability actually had (or whether it was successful at all). Also, this makes a direct comparison of the psychological effects of our manipulation with Vieider’s study impossible. Nevertheless, we have recalculated the analysis for the primary dependent variable (loss aversion) with only those participants who answered the instruction check correctly, and we found that this makes no difference to our findings. This additional analysis can be found in Supplemental Material A (https://osf.io/afgdq).
Loss aversion
Following Vieider (2009), we excluded 12 of the 102 participants from our analyses of loss aversion, as their answers violated stochastic dominance, meaning that the gain values that they entered into the simple prospects did not monotonically increase with the size of the losses (e.g., they entered a lower gain value for the prospect with the 100€ loss than for the prospect with the 50€ loss). Such a violation of stochastic dominance indicates that the participant probably did not fully understand the task and, thus, might have been unable to provide usable answers to the prospects. 5 Afterward, just like Vieider (2009) did in his original study, we calculated the average loss aversion of our participants by averaging the approximated loss aversion indices λ for each participant over the first four prospects. We then conducted Shapiro–Wilks test to check for the normality of our data. This test rejected the assumption of normality, W = 0.15, p < .001; hence, similar to Vieider (2009) in his original study, we will use nonparametric tests throughout. Table 1 shows the median values of the loss aversion for each of the four prospects analyzed, as well as the median values of the average loss aversion over all four prospects in the three experimental conditions.
Median values of the loss aversion index λ for the four simple prospects and their average in the three experimental conditions of Experiment 1a (Median absolute deviation in parentheses).

Note. Higher values of λ indicate stronger loss aversion. The value reported as average λ is the median value of the average of the four individual lambda values per participant.
First, we checked for evidence of loss aversion in our participants. For this, we looked at the average λ-values of the remaining 90 participants. Of these 90 participants, 79 showed at least some degree of loss aversion (λ > 1), 9 indicated loss neutrality (λ = 1), and 2 showed reverse loss aversion (λ < 1). A Bayesian binomial test strongly supported the conclusion that this distribution was different from an equal distribution of loss aversion and loss neutrality, BF10 = 3.27 × 10¹¹. Additionally, we calculated a Bayesian Wilcoxon signed-rank test against the λ-value indicating loss neutrality (1). This test also strongly favored the conclusion that average λ-values were larger than 1, BF10 = 439,635.64, W = 3,295, p < .001, r = .98.
After establishing that, on average, our participants exhibited loss aversion, we tested the effects of process and outcome accountability on this bias. Since there is, as of now, no comprehensive way to determine a Bayes Factor for a Kruskal–Wallis test (at least we do not know about such a possibility), we only report the pairwise comparisons of our three experimental conditions using Bayesian Mann–Whitney U tests. For the comparison of the no accountability condition with the process accountability condition (the one that most closely resembles the comparison from the original Vieider study), we found substantial evidence supporting the null hypothesis, BF10 = 0.270, W = 473, p = .927, r = −.015. The result for the comparison of nonaccountable with outcome-accountable participants, on the other hand, was inconclusive, BF10 = 0.502, W = 352.5, p = .159, r = −.21. The final comparison of process-accountable participants with outcome-accountable participants was also inconclusive, BF10 = 0.421, W = 496, p = .240, r = .18. 6
In addition, we decided to run an analysis combining the two accountability conditions. We did so for two reasons. One, as mentioned earlier, Vieider’s (2009) manipulation of accountability is somewhat ambiguous, making it unclear whether process accountability, outcome accountability, or a mix of both is expected to have the strongest impact on loss aversion. Therefore, one could argue that combining the two conditions is the more appropriate test of the robustness of Vieider’s (2009) findings. Two, as is obvious from the manipulation checks reported above, many participants in the outcome accountability felt more accountable for their decision-making process than for their decision outcomes. Thus, one might argue that both manipulations ultimately induced some sort of process accountability and, thus, should be combined. This final comparison provided substantial evidence for the null hypothesis of there being no difference in loss aversion between the no accountability condition and the combination of the two accountability conditions, BF10 = 0.266, W = 825, p = .389, r = −.11
Discussion Experiment 1a
Contrary to our initial expectations, we did not find any effects of accountability (neither process nor outcome) on loss aversion. In the pairwise comparison of process accountability with no accountability, which we believe is the most appropriate test for comparing our results with those of Vieider (2009), we even found substantial evidence in favor of the null hypothesis or, in other words, evidence against an effect of process accountability. Our results, thus, contradict the findings previously reported by Vieider (2009).
However, this finding should be interpreted with caution for two main reasons. First, we deviated from Vieider’s procedure in, at least, two important aspects, and second, our sample size and consequently our test power might have been too small to reliably detect an effect of (process) accountability on loss aversion.
The most obvious difference between our study and the one conducted by Vieider (2009) is the change in the manipulation of accountability. Instead of using only a very general (and, thus, somewhat vague and unspecified) accountability manipulation, we explicitly differentiated between process and outcome accountability, as it is now almost a standard in accountability research (see Lerner & Tetlock, 1999 for a discussion and Sharon et al., 2022 for a meta-analysis). Thus, our goal was to distinguish the effects of process and outcome accountability on loss aversion. This goal was only partially achieved, as only our manipulation of process accountability has been successful, whereas we failed to induce outcome accountability. However, this problem with the outcome accountability manipulation cannot explain the complete absence of any effects of accountability on loss aversion because, with regard to this loss aversion, even the comparison between process accountability and the control condition without accountability (where the manipulation checks were successful) found no evidence for a difference between the conditions.
Another meaningful difference between our experiment and Vieider’s is that we decided to collect a heterogeneous student sample at the University of Hildesheim, which consisted of students from many different backgrounds. In contrast, the sample Vieider collected in 2009 consisted mainly (94%) of students of either economics or business. Arguably, students with an interest and training in economics and business might be more familiar with the phenomenon of loss aversion, as, in general, they attend some courses in mathematics and statistics. It is conceivable that this is a prerequisite for the reduction of loss aversion through accountability, as, in general, accountability is assumed to reduce biases only when decision-makers can arrive at the correct decision by exerting higher cognitive effort (Simonson & Nye, 1992). Therefore, while students with a background in business or economics probably should be able to identify loss aversion as a bias when they think about it more closely, students without such a background might have a harder time when they try to do so, as they probably are not familiar with the concept of loss aversion. It should be noted, however, that Vieider (2009) himself stated that the prospects used in his experiment were so simple that a more general subject pool should also be able to notice that loss aversion is irrational.
A second reason for being cautious in interpreting our results, as mentioned above, is the possibility that our experiment had insufficient test power to provide a definitive answer to our research questions. Given that we assumed to treat the manipulation in the study by Vieider (2009) as a manipulation of process accountability, the sample size for the comparison of no accountability and process accountability in our first experiment was smaller than the one in the original study (62 participants for the pairwise comparison of the process with no accountability condition vs. 102 participants in Vieider’s, 2009 study). This means that Experiment 1a may simply have lacked sufficient test power to find the effect.
While Experiment 1b was in many ways very similar to Experiment 1a, it also addresses some of the concerns with Experiment 1a, as in Experiment 1b we collected a larger sample that also more closely resembles the composition of Vieider’s (2009) sample.
Method Experiment 1b
Participants and design
In total, 153 undergraduate and graduate students from the University of Göttingen participated in Experiment 1b. The rationale for the sample size of this study was that we aimed at collecting a sample in which the two conditions of primary interest (no accountability and process accountability) combined were of a similar size as Vieider’s (2009) original sample. Overall, the characteristics of our sample were very similar to those in the original Vieider (2009) study: The average age of the participants was 23.3 years (SD = 4.08), and 47% were male. Additionally, the sample mainly consisted of business and economics students (92%), as was the case in the original study. Participants were randomly assigned to one of three experimental conditions in a one factorial between-subject design (no accountability vs. process accountability vs. outcome accountability).
Experimental task
We used the same German translation of the straight matching task (adopted from Vieider, 2009) as in Experiment 1a.
Manipulation of accountability
The manipulation of accountability in Experiment 1b was identical to the manipulation in Experiment 1a. Participants in the two accountability conditions were informed that, after completing the experimental task, they would participate in an interview with a researcher. Again, participants anticipated that their interviews would be videotaped and that some of these videos would be used for teaching and research purposes (i.e., they would be shown in seminars or at scientific congresses). The wording of the process accountability versus outcome accountability manipulation was also similar to Experiment 1a.
Instruction and manipulation checks
We asked participants several questions to check whether they understood the instructions. In the two accountability conditions, participants answered a single-choice question about the content of the interview, indicating whether the interview would focus on their process during the task, their results, or both equally. Additionally, all participants were asked to indicate on an 11-point Likert scale whether, during their performance of the task, they would focus more on the outcome of their choices or on the procedure for making their choices (0 = procedure; 5 = both; 10 = outcome). Moreover, participants also had to indicate on an 11-point Likert scale (0 = not at all; 10 = very) how likely they thought it would be that they had to justify their decisions after completing the task.
Procedure
The procedure of Experiment 1b was similar to that of Experiment 1a. The only differences were that Experiment 1b included some additional manipulation checks and some additional exploratory measures before and after the experimental task compared with Experiment 1a. 7
Results Experiment 1b
Instruction and manipulation checks
Regarding the question of what aspect of their decision-making the interview would be focused on, a Bayesian contingency table test revealed substantial evidence for differences between the two accountability conditions, BF10 = 5.40, χ2(2) = 9.32, p = .009, and in both conditions the observed frequencies definitively differed from a random distribution, outcome accountability: BF10 = 1,173.47, χ2(2) = 21.96, p < .001, process accountability: BF10 = 131,070.11, χ2(1) = 25.00, p < .001. Most participants in the process accountability condition classified themselves correctly (42 of 49 = 86%). In contrast, the majority of participants in the outcome accountability condition misclassified themselves by answering that the interview would be about their decision-making process (33 of 52 = 63%), while only 7 out of 52 answered correctly that the interview would focus on their results (13%).
With regard to the question of how likely participants felt it would be that they would have to justify themselves after the experiment, a (Bayesian) one-way ANOVA found decisive evidence for differences between the three experimental conditions, BF10 = 1,696.92, F(2, 147) = 12.35, p < .001,
For the question regarding what participants would focus on during the task, a Bayesian analysis of variance showed substantial evidence that the different experimental conditions had no impact on the participants’ answers, BF10 = 0.27, F(2, 147) = 1.64, p = .197,
These results indicate that, similar to Experiment 1a, our manipulation of accountability has been only partially successful. While both participants in the process and outcome accountability condition believed it was more likely than participants in the no accountability condition that they would have to justify themselves after the experiment, only in the process accountability condition did the majority correctly identify the focus of the interview. Hence, our manipulation of process accountability worked as intended, whereas our manipulation of outcome accountability again did not have the intended effect. Thus, as in Experiment 1a, we cannot reliably test for differential effects of process and outcome accountability on loss aversion. However, as in Experiment 1a, this still allows us to test the effect reported by Vieider (2009), since his manipulation of accountability mostly resembles process accountability (which we successfully induced here). Notwithstanding this, we recalculated the analysis for the primary dependent variable (loss aversion) including only participants who answered the instruction check correctly, and found that this did not substantially alter our results. This additional analysis can be found in Supplemental Material A (https://osf.io/afgdq).
Loss aversion
We followed Vieider’s (2009) analytical approach closely. Of the 153 participants, 16 were excluded from our analyses of loss aversion, because their answers violated stochastic dominance. 8 We then calculated the average loss aversion per participant and conducted a Shapiro–Wilks test to check for the normality of this variable; this test rejected the assumption of normality, W = 0.07, p < .001. Hence, we will again (and similar to the original study) use nonparametric tests. The median values of loss aversion for each of the four simple prospects, as well as for the average loss aversion over all four prospects in the three experimental conditions of Experiment 1b are provided in Table 2.
Median values of the loss aversion index λ for the four simple prospects and their average in the three experimental conditions of Experiment 1b (median absolute deviation in parentheses).
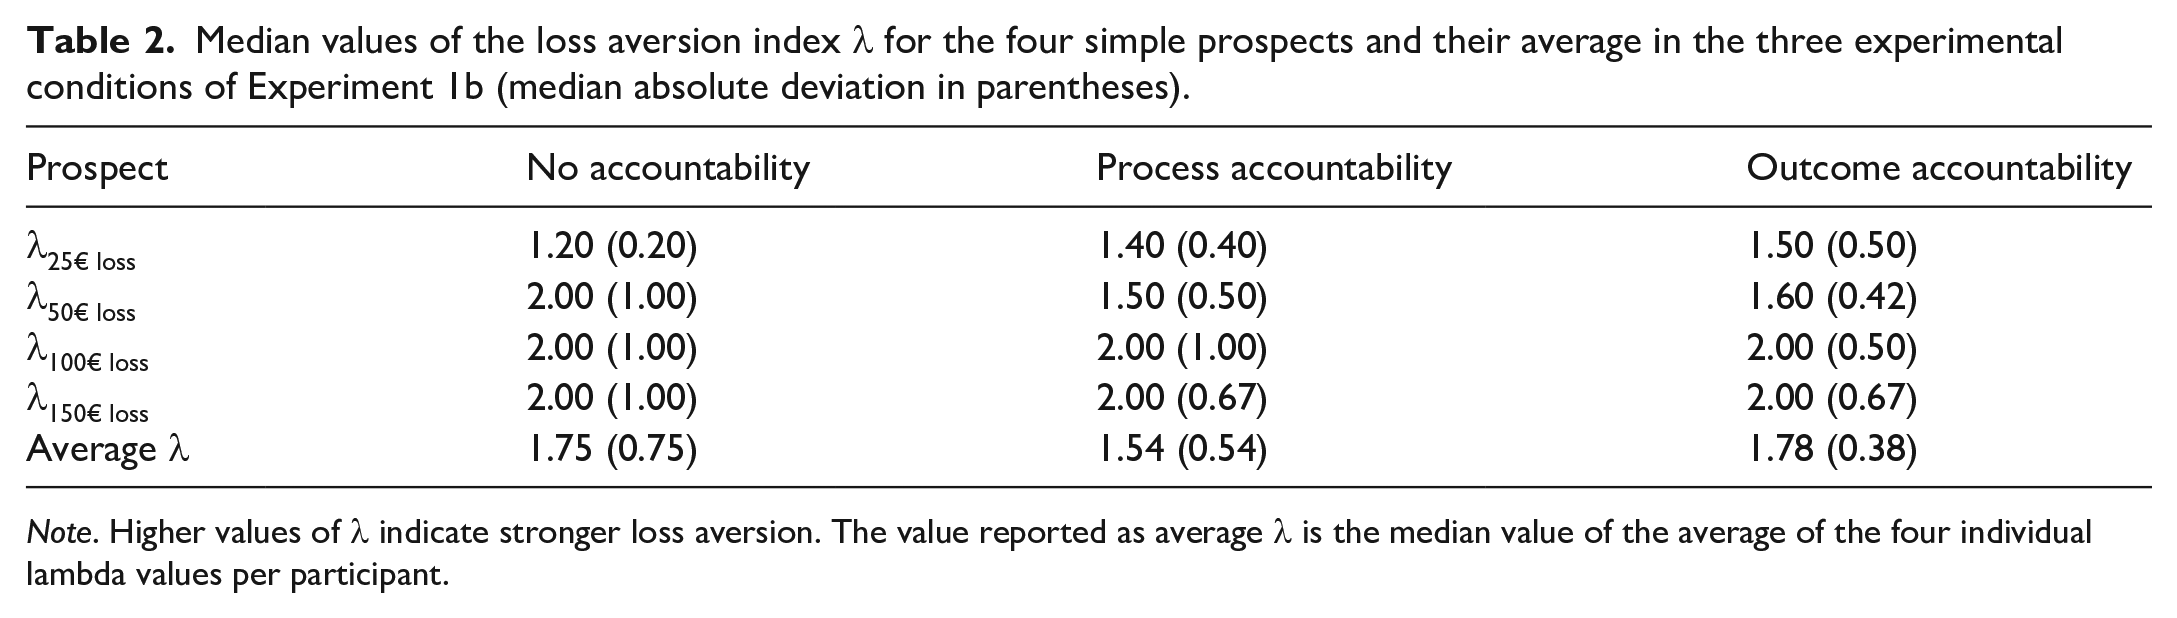
Note. Higher values of λ indicate stronger loss aversion. The value reported as average λ is the median value of the average of the four individual lambda values per participant.
As in Experiment 1a, we first checked whether our participants showed evidence of loss aversion. For this, we examined the average λ-values of the remaining 137 participants: Of these participants, 101 showed at least some degree of loss aversion (λ > 1), 33 indicated loss neutrality (λ = 1), and 3 showed reverse loss aversion (λ < 1). A Bayesian binomial test provided strong evidence for the conclusion that this distribution was different from an equal distribution of loss aversion and loss neutrality, BF10 = 883,084.84. In addition, we calculated a Bayesian Wilcoxon signed-rank test against the λ-value indicating loss neutrality (1). The outcome of this test also strongly favored the conclusion that average λ-values were larger than 1, BF10 = 1.38 × 10⁹, W = 5,410.5, p < .001, r = .98.
Next, we ran a series of three Bayesian Mann–Whitney U tests, one for each pairwise comparison between the experimental conditions. For the comparison of the no accountability condition with the process accountability condition, we found substantial evidence supporting the null hypothesis that there is no difference between the two conditions, BF10 = 0.229, W = 1,031.5, p = .868, r = .021. The same was true for the comparisons of nonaccountable with outcome-accountable participants, BF10 = 0.230, W = 1,052.5, p = .735, r = .042, and also for the comparison of process-accountable participants with outcome-accountable participants, BF10 = 0.227, W = 1,056.5, p = .717, r = −.043. Based on the fact that Vieider (2009) did not differentiate or specify which form of accountability was supposed to affect loss aversion, and that a substantial part of participants in the outcome accountability condition indicated that they believed they would be interviewed about their decision-making process rather than their decision outcomes, we again decided to run an analysis combining the two accountability conditions. The corresponding Bayesian Mann–Whitney U test for differences between the no accountability condition and the combination of the two accountability conditions provided substantial evidence in favor of the null hypothesis of no difference between the conditions, BF10 = 0.192, W = 2,084, p = .770, r = .03. Hence, we found no evidence that any form of accountability affects loss aversion. 9
Discussion Experiment 1b
Similar to Experiment 1a, the aim of Experiment 1b was to test for differential effects of process and outcome accountability on loss aversion. This time, we did so with a sample that resembled Vieider’s (2009) sample with regard to the academic background of the participants, in order to maximize the comparability with the original study. Furthermore, we increased our sample size to enhance test power. However, we still did not replicate the effect of accountability on loss aversion originally reported by Vieider (2009). Comparing process accountability with the nonaccountability condition—which is the comparison that, in our opinion, most closely resembles Vieider’s manipulation of accountability—we found substantial support for the null hypothesis, that is, for the absence of effects of process accountability on loss aversion.
Although we have considerably increased our sample size compared to Experiment 1a, we still cannot exclude the possibility that, with an even larger sample, we might have found the effect of accountability on loss aversion. However, it has to be emphasized that there was not even a small trend in the predicted direction, and the same was also true for Experiment 1a. Hence, even though a type-II-error is still a possibility that we have to consider, this would, nevertheless, impose severe limitations on Vieider’s earlier findings, as the effect then would have to be much weaker than previously thought. 10 Furthermore, in both experiments, the Bayesian tests for the particular comparison that most closely resembles the effect from the original Vieider (2009) study, namely the comparison of the process accountability condition with the no accountability condition, provided substantial evidence for the null hypothesis, lending credibility to the interpretation that there is, indeed, no such effect. Hence, not only did we not replicate the original effect—we even found evidence demonstrating the absence of such an effect.
As in Experiment 1a, only the manipulation of process accountability was successful: participants believed that they would have to justify themselves after completing the experimental task and were, for the most part, able to correctly answer that the interview would be about the procedures they used to make their choices. On the other hand, outcome-accountable participants once again predominantly failed to identify the focus of their interview, with the majority stating it would concern their decision-making process. From this, we have to conclude that we were again not able to reliably induce outcome accountability in our participants. Although we can only speculate about the reasons, we think the most plausible explanation is that the straight matching task that we adopted from Vieider is not particularly suitable to induce outcome accountability. As discussed earlier, the task does not really lend itself to questions regarding right or wrong answers or, in general, to questions regarding the quality of choices, because it is framed more in the realms of personal preferences, and the participants do not experience actual outcomes. Accordingly, it might seem much more plausible to the participants that they would be interviewed about the reasons behind their choices, even if the interview is announced to be only about the quality of their choices.
Despite these limitations regarding the outcome accountability manipulation, we believe these experiments provide sufficient evidence to raise serious questions about the robustness of the original findings by Vieider (2009), as both Experiment 1a and Experiment 1b showed clear evidence against any effects of (process) accountability on loss aversion. At this point, we decided to step back and properly clarify the robustness of the original effect of accountability on loss aversion rather than continuing to pursue our initial goal of differentiating the effects of process versus outcome accountability on loss aversion. Thus, for our third experiment, we conducted a full replication of the original Vieider (2009) study.
Experiment 2
Experiment 2 was conducted to test the robustness of the effect of accountability on loss aversion, in other words, whether or not the effect reported by Vieider (2009) can be found in a direct replication. Therefore, compared with Experiments 1a and 1b, we removed the outcome accountability condition, and we changed the wording of the process accountability manipulation back so that it matched the original wording reported by Vieider (2009) as closely as possible. Apart from this, Experiment 2 largely mirrored Experiments 1a and 1b, as these, for the most part, already closely followed the procedure Vieider (2009) employed.
Method Experiment 2
Participants and design
Two hundred undergraduate and graduate students from the University of Göttingen participated in Experiment 2, 93 of whom identified as female and 107 who identified as male. Our participants in this experiment ranged in age from 18 to 40 years (M = 23.2, SD = 3.28), and the vast majority of them majored in a business or economics-related field (195 of 200 = 98%). All participants were randomly assigned to one of two conditions in a one factorial between-subject design (no accountability vs. explicit accountability). The sample size was determined by an a priori power analysis using G*Power (Faul et al., 2007), indicating that a sample of 180 participants would be sufficient to achieve 90% test power for a medium effect size of d = 0.50 (assuming α = .05). We slightly exceeded this sample size in order to make sure that we achieve the aforementioned test power even in case that some datasets might turn out to be incomplete.
Experimental task
We again used the same German translation of the straight matching task as in Experiments 1a and 1b, which we adopted from the study by Vieider (2009).
Manipulation of accountability
We manipulated the presence versus the absence of accountability by informing participants in the accountability condition that, after they completed the experimental task, they would be asked to take their questionnaire to another room where they would be interviewed by an experimenter and that, during this interview, they would have to explain the reasons behind their decisions. In contrast, participants in the no accountability condition were instructed to put their questionnaire in a cardboard box once they completed it. Furthermore, they were told that the data created by their answers would be treated as confidential, and that they would remain anonymous. This manipulation is identical to the manipulation that Vieider used in his 2009 study.
Instruction and manipulation checks
To check if our manipulation of accountability was successful, that is, whether participants had understood and were aware of the instructions, we asked all participants after they completed the task to rate on an 11-point Likert scale how likely they considered it that they would have to justify their decisions (0 = not at all; 10 = very much).
We also included some of the manipulation checks from Experiments 1a and 1b to test whether participants in the explicit accountability condition felt more accountable for the process (as we would expect) or the outcome. Specifically, we asked participants after they had completed the experimental task, whether the following interview would focus on their procedure during the task or the outcome of the task, and what they had felt accountable for while working on the experimental task (the procedure, the outcome, both, neither). Additionally, we asked participants on an 11-point Likert scale on which aspect of the task they had predominantly focused on (0 = the procedure; 5 = both; 10 = the outcome). 11
Procedure
The experimental procedure was very similar to the procedure used in Experiments 1a and 1b. After arriving at the lab, participants were welcomed and seated; then, they were handed the task description and an informed consent form, which also included the experimental manipulation. When participants had signed the informed consent, they received the task materials and a questionnaire, including the manipulation checks and some demographic questions. After completing the task and filling in the questionnaire, participants were informed that no interview would take place, and they were fully debriefed. They then signed a nondisclosure agreement and were paid 5€ for their participation.
Results Experiment 2
Instruction and manipulation check
To check whether the manipulation of accountability was successful, we asked participants how likely they felt it would be that they had to justify themselves after completing the experimental task. Participants in the explicit accountability condition believed it to be much more likely that they would have to justify themselves than participants in the no accountability condition (M = 6.76, SD = 2.62 vs. M = 3.69, SD = 2.66), with a Bayesian t-test showing decisive evidence for a difference between the two conditions, BF10 = 2.51 × 10¹¹, t(198) = 8.25, p < .001, d = 1.17. This indicates that participants understood the experimental manipulation and were aware of it.
Loss aversion
Following Vieider’s (2009) procedure, and similar to Experiments 1a and 1b, we excluded participants whose answers violated stochastic dominance from our analysis. This time, we had to exclude 17 of the 200 total participants (9%), which is roughly similar to Vieider’s (2009) original study, as Vieider excluded 7 of his 109 participants (6%). 12 We then calculated the average loss aversion for the remaining participants and conducted a Shapiro–Wilks test for normality on the average loss aversion. Like in the first two experiments, this test indicated that the assumption of normality was violated for our data (W = 0.30, p < .001), Hence, similar to our first two experiments and Vieider’s (2009) original study, we will use nonparametric tests. 13 Median and mean values of loss aversion for each of the four simple prospects and the average loss aversion in the two experimental conditions are provided in Table 3.
Median values of the loss aversion index λ for the four simple prospects and their average in the three experimental conditions of Experiment 3 (median absolute deviation in parentheses).
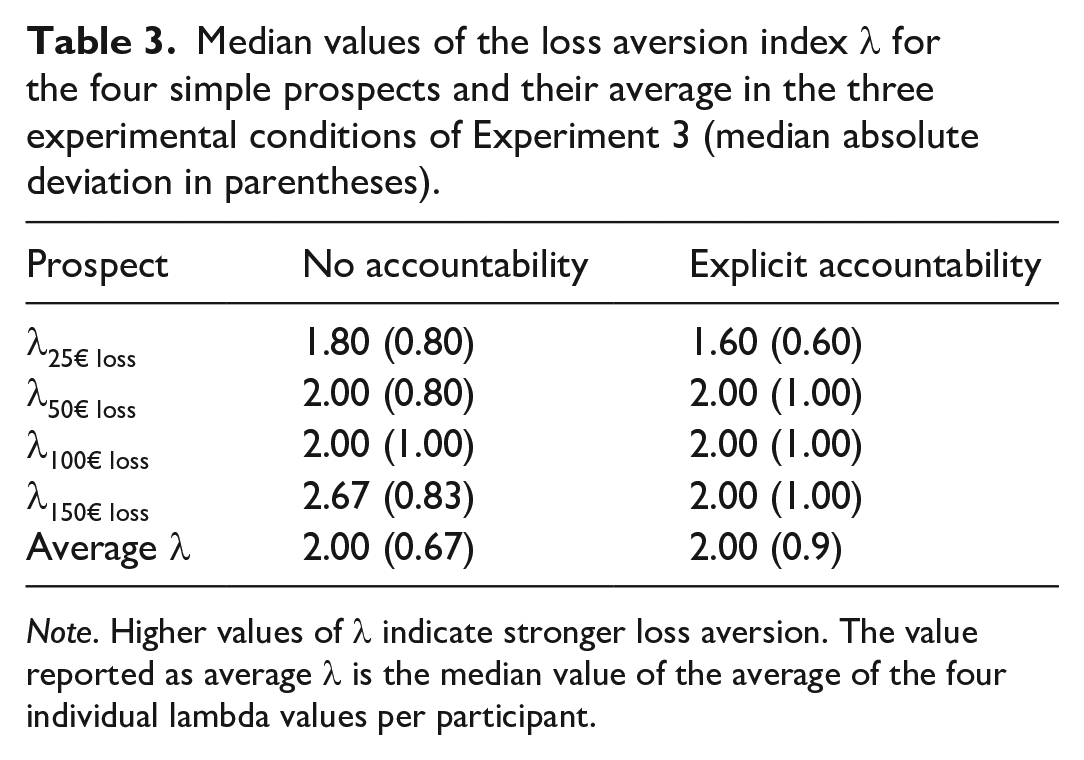
Note. Higher values of λ indicate stronger loss aversion. The value reported as average λ is the median value of the average of the four individual lambda values per participant.
We then checked whether there was any evidence of loss aversion in our participants. For this, we examined the average λ-values of the remaining 183 participants. Of these participants, 149 showed at least some degree of loss aversion (λ > 1), 30 indicated loss neutrality (λ = 1), and 4 showed reverse loss aversion (λ < 1). A Bayesian binomial test provided strong evidence in favor of the conclusion that this distribution was different from an equal distribution of loss aversion and loss neutrality, BF10 = 6.19 × 10¹⁵. Additionally, we calculated a Bayesian Wilcoxon signed-rank test against the λ-value indicating loss neutrality (1). The results of this test also strongly favored the conclusion that average λ-values were larger than 1, BF10 = 2.53 × 10¹¹, W = 11,707.5, p < .001, r = .99.
After establishing that participants in Experiment 2 also experienced loss aversion, we tested for the effects of accountability on loss aversion. To this end, we once more calculated a Bayesian Mann–Whitney U test and found substantial evidence for the absence of any difference between the two experimental conditions, BF10 = 0.220, W = 4,514, p = .316, r = .086.
Exploratory analyses
To explore what form of accountability Vieider’s (2009) manipulation actually induced, we included some exploratory manipulation checks to test what participants expected the announced interview would be about, and what they retrospectively had felt accountable for.
Regarding the question what participants in the explicit accountability condition expected the interview to be about, we conducted a Bayesian multinomial test which provided decisive evidence for differences from a random distribution, BF10 = 5.94 × 10¹⁶, χ2(2) = 79.30, p < .001. Most participants in the explicit accountability condition expected the interview to be about their decision-making procedure during the experimental task (75 of 105 = 71%), which is in line with our assumption that Vieider’s (2009) original manipulation predominantly induces process accountability.
Furthermore, we also asked participants what, in retrospect, they had actually felt accountable for while working on the task. A Bayesian contingency table test provided very strong evidence for the H0 of no differences in the distribution of answers in the two experimental conditions, BF10 = 0.061, χ2(3) = 2.91, p = .405. In both conditions, a (relative) majority of our participants answered that they felt accountable for the outcome (48 of 105 = 46%, in the explicit accountability condition, and 54 of 95 = 57%, in the no accountability condition), while only a minority reported that they felt accountable for the process (28 of 105 = 27%, in the explicit accountability condition, and 19 of 95 = 20%, in the no accountability condition) or for neither the outcome nor the process (17 of 105 = 16%, in the explicit accountability condition, and 11 of 95 = 12%, in the no accountability condition).
Finally, participants answered a question about what they focused on during the task. Descriptively, nonaccountable participants said they had focused slightly more on the outcome than accountable participants (M = 6.26, SD = 2.22 vs. M = 5.73, SD = 2.21); however, a Bayesian t-test turned out to be inconclusive, BF10 = 0.59, t(197) = 1.69, p = .092, d = 0.24.
In conclusion, we found clear evidence that participants in Experiment 2 expected to be interviewed about their decision-making process. This indicates that the accountability manipulation employed by Vieider (2009) does, indeed, represent a manipulation of process accountability. However, we found no evidence that this manipulation actually affected what the participants felt accountable for while working on the experimental task—at least not in retrospect.
Discussion Experiment 2
We designed Experiment 2 with the objective of testing the robustness and replicability of the previously reported effect of accountability on loss aversion (Vieider, 2009). To this end, we conducted a direct replication of the original study, using the original task, the original accountability manipulation, and a sample that very closely resembles the original sample, except for the fact that our sample was much larger. However, just as in our experiments 1a and 1b, we did not detect any effect of accountability on the amount of loss aversion that the participants showed. Instead, our Bayesian analysis of the data indicated that the evidence was substantially in favor of the null hypothesis, that is, it supported the interpretation that accountability does not affect loss aversion. All in all, this third experiment confirmed the results of our first two experiments, with an increased sample size and an accountability manipulation that closely resembled the original manipulation by Vieider (2009). Taking into account this close resemblance to the original study, the larger sample size, and the results of our first two experiments, this very much questions the robustness of the original finding.
Meta-analysis
In order to integrate the findings of our three experiments, we decided to run a meta-analysis of the effect of accountability (accountability vs. no accountability) on loss aversion for our three experiments (for Experiments 1a and 1b, we only included the comparison of the process accountability and the no accountability condition since, as already stated, Vieider’s manipulation resembles process accountability more than it resembles outcome accountability). Subsequently, we reran the meta-analysis, this time including the effect Vieider found in his original 2009 study. 14
Since the effect sizes for both Vieider’s (2009) study and our experiments are given in the form of rank-biserial correlational coefficients, we first had to apply Fisher’s z-transformation to the reported effect sizes in order to run our meta-analyses. After we transformed the correlation coefficients to Fisher z-scores and calculated the corresponding standard errors, we ran two random-effects Bayesian meta-analyses with JASP (JASP Team, 2022), employing a Cauchy prior of r = .707, one including only our three experiments, and one which included Vieider’s (2009) study in addition to our experiments. In a final step, we then transformed the meta-analytical effect sizes back to correlation coefficients for ease of interpretation.
Integrating the findings from our three experiments reported above, the meta-analytically estimated effect size was very small (µ = .04), and the data provided substantial evidence for the null hypothesis, BF10 = 0.11. Additionally, this meta-analysis provided substantial evidence against any between-study heterogeneity regarding the effect sizes, BF10 = 0.32.
When we included the original study’s effect in our meta-analysis, the estimated effect size remained rather small, µ = .08 (see Figure 2), and the evidence still offered substantial support for the null hypothesis, BF10 = 0.16. Testing again for any effect size heterogeneity between studies, we once more found that evidence substantially favored the null hypotheses of no heterogeneity, BF10 = 0.29, Q(3) = 2.086, p = .555, i2 = 0.00.
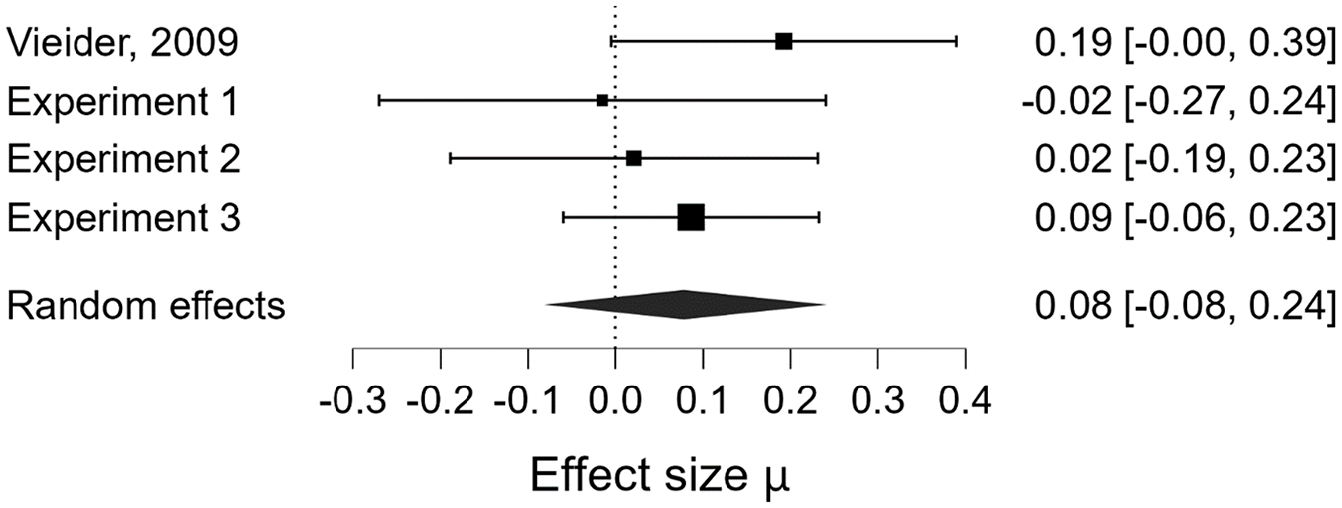
Forrest plot of the Fisher z-transformed effects observed in Vieider’s (2009) and our experiments.
Taken together, these two meta-analyses further substantiate our findings that the effect of accountability on loss aversion reported by Vieider (2009) is not as robust as previously thought, and that it might even be a type-I-error. Integrating the results of our three studies for the comparison of (process) accountability versus no accountability resulted in a very small average effect size, as well as in a Bayes Factor which lent substantial support to the null hypothesis. If we take into account that the combined sample size in our three studies, even if we only consider the process accountability and the no accountability conditions in Experiments 1a and 1b, was more than three times larger than Vieider’s sample in 2009 (335 vs. 102 participants) and constitutes almost 2/3 of all the available data on the effect of (process) accountability on loss aversion (All studies: N = 533; our experiments N = 335; Vieider, 2009 + Pahlke et al., 2012: N = 198), we find it fair to assume that our current findings are a more reliable estimate of the true effect than those previously reported. In addition, even if we included Vieider’s original study’s effect in our meta-analysis, it still provided substantial support for the null hypothesis of no effect of accountability on loss aversion. All things considered, we feel confident concluding that the effect of accountability, if it exists at all, is (at the very least) not very robust, and that we currently do not understand the exact conditions under which it might occur.
Exploratory analyses of loss aversion
As mentioned earlier, recent years have seen a controversial debate regarding the context specificity of loss aversion and regarding operationalization and measurement (Bleichrodt & l’Haridon, 2023; Gal & Rucker, 2018; Gächter et al., 2022; Mrkva et al. 2020; Rakow et al., 2020; Yechiam, 2019; Yechiam & Hochman, 2013; Zeif & Yechiam, 2022). While not our prime focus in this paper, we realized that it would be important to pay closer attention to possible conclusions our experiments could provide regarding questions concerning loss aversion. In addition to that, checking whether our participants show evidence of phenomena previously described in the loss aversion literature allows us to identify possible peculiarities associated with our samples and our measures that might limit the interpretability of our main findings.
A number of researchers have claimed that loss aversion is not a general phenomenon, but rather context and measure specific (Gal & Rucker, 2018; Rakow et al., 2020; Yechiam, 2019; Yechiam & Hochman, 2013). In line with this idea, several studies have shown that the loss aversion is sensitive to the framing of the task (Harinck et al. 2012) and to the stack size used in the gambles used to measure it (Bleichrodt & l’Haridon, 2023; Ert & Erev, 2013; Zeif & Yechiam, 2022). Ert and Erev (2013) as well as Zeif and Yechiam (2022) found that for small stakes loss aversion is reduced or does not emerge at all. One interesting issue that has been discussed in this context is the fact that most research on loss aversion either falls in the low stakes categories (up to max. 100$) or in the high stakes category (over 500$), and that loss aversion is mostly found in the high stakes category while it is mostly absent in the low stakes category. Now, interestingly enough, the task we and Vieider (2009) used falls somewhat in between those two categories, while also providing variation in the size of the stakes. This coincidence allows us to test the assumption that increasing stakes does increase loss aversion. To this end, we reanalyzed our data using Bayesian mixed ANOVAs, with stakes as a within-subjects factor and accountability as a between-subjects factor. Because ANOVAs are vulnerable to non-normal and skewed data, we ran these analyses with a dataset in which outliers were removed. Specifically, we excluded all lambda values that were more than 3 median absolute deviations away from the median of all prospects with the corresponding stake size. In Experiment 1a, this led to an exclusion of 65 out of 360 lambda values. A total of 21 participants (23% of the sample) had at least one of their lambda values excluded, and 10 participants (11% of the sample) had all of their lambda values excluded. All values were removed from the right side of the distribution. Of the remaining 295 lambda values, 227 indicated at least some degree of loss aversion (λ > 1), 60 indicated loss neutrality (λ = 1), and 8 indicated reverse loss aversion (λ < 1). A Bayesian mixed ANOVA indicates that the best model with a BF10 = 1.25 × 10¹¹ is the model only including the main effect of the within factor “stakes size.” Post hoc tests show that there is substantial evidence that the lambda values for the 50€ (BF10 = 10,028.83), 100€ (BF10 = 55,255.90), and 150€ (BF10 = 131,911.95) prospects were higher than for the 25€ prospect. In addition, there was substantial evidence in favor of the conclusion that lambda values for the 100€ (BF10 = 75.64) and the 150€ (BF10 = 63.20) prospects were higher than for the 50€ prospect. Finally, there was substantial evidence favoring the conclusion that there were no differences between the 100€ and the 150€ prospect, BF10 = 0.162. 15
We find a similar pattern of results when analyzing Experiment 1b. In Experiment 1b, a total of 40 out of 548 lambda values were excluded as outliers. Eighteen participants (13% of the sample) had at least one of their lambda values excluded, and three participants (2% of the sample) had all of their lambda values excluded; all values were removed from the right side of the distribution. Of the remaining 508 lambda values, 341 indicated at least some degree of loss aversion (λ > 1), 156 indicated loss neutrality (λ = 1), and 11 indicated reverse loss aversion (λ < 1). The model best describing the data is again the model that only includes the within-subjects factor stake size, BF10 = 2.99 × 10⁶. Post hoc tests showed substantial evidence that the lambda values for the 50€ (BF10 = 13.13), 100€ (BF10 = 847.17) and 150€ (BF10 = 14,286.53) prospects were higher than for the 25€ prospect. There was also again substantial evidence in favor of the conclusion that lambda values for the 100€ (BF10 = 10.69) and the 150€ (BF10 = 40.38) prospects were higher than for the 50€ prospect. Finally, there was substantial evidence favoring the conclusion that there were no differences between the 100€ and the 150€ prospect, BF10 = 0.188. 16
Finally, our analysis of Experiment 2 further supported the results described above. This time, we excluded a total of 57 out of 732 lambda values. Twenty-one participants (11% of the sample) had at least one of their lambda values excluded, and four participants (2% of the sample) had all of their lambda values excluded. All values were removed from the right side of the distribution. Of the remaining 675 lambda values, 504 indicated at least some degree of loss aversion (λ > 1), 155 indicated loss neutrality (λ = 1), and 16 indicated reverse loss aversion (λ < 1). The Bayesian mixed ANOVA once more indicated that the model best describing the data was the model only including the within-subjects factor “stake size” with a BF10 = 4.51 × 10¹⁸. Post hoc tests, again, showed that there was substantial evidence in favor of the conclusion that all but the 100€ and 150€ prospects differed from one another (all BF10 > 8,071.48), while for the two prospects with the highest stakes the evidence was substantially in favor of the conclusion that there was no difference in lambda values between the two, BF10 = 0.13. 17 These results are in line with the general conclusions drawn by Ert and Erev (2013) as well as others that loss aversion is indeed context-dependent and specifically sensitive to the size of the potential losses, as we also find comparatively lower loss aversion at lower stake sizes.
However, loss aversion did not disappear at low stakes in our experiments. Even for the prospect with the lowest stakes (a loss of 25€), using Bayesian one-sample t-tests, we find substantial evidence favoring the conclusion that the lambda values are higher than 1 (which would indicate loss neutrality). The mean and median lambda values for the gamble with a potential loss of 25€ as well as the corresponding Bayes factors for the Bayesian one-sample t-tests against one were as follows; Experiment 1a: M = 1.89, Med = 1.60, BF10 = 730,491.34; Experiment 1b: M = 1.62, Med = 1.20, BF10 = 929,451.00; Experiment 2: M = 1.81, Med = 1.60, BF10 = 2.51 × 10¹⁷. Even though loss aversion did not disappear in our experiments, these results are still at odds with classic notions of loss aversion, as they contradict assumptions of diminishing sensitivity to losses. Typically, one would expect loss aversion to be robust to stake size or even decrease as stakes get higher. In contrast to this prediction, we find clear evidence that loss aversion increases with stake size (for a similar effect of stake size on loss aversion also see Thalur, 2024). It thus seems plausible that, if the stake sizes in our study would have been further decreased, loss aversion might have disappeared completely, similarly to what has been shown by Zeif and Yechiam (2022) who found that loss aversion did not materialize for small loss amounts.
General discussion
The original aim of the present study was to extend the earlier findings of Vieider (2009) that holding people accountable reduces their loss aversion. Specifically, we wanted to test whether there was any difference in the effect depending on whether people were held accountable for their decision-making process or the outcome of their decisions, as it is generally accepted that these two forms of accountability have differential effects (cf. Lerner & Tetlock, 1999).
After running two experiments comparing process- and outcome-accountable participants with nonaccountable ones, in which we did not find any effects of either form of accountability on loss aversion, we shifted our focus toward the question of whether the basic finding was robust enough to be replicated at all.
Experiments 1a and 1b already provided a solid base for this replication focus, as they followed the procedure of Vieider (2009) very closely and used the same task as the original study. The design of the study, however, was slightly altered by adding a second accountability condition (outcome accountability) to allow testing for differences in the effects of different forms of accountability on loss aversion. Further, we also refined the wording of the process accountability manipulation Vieider used, to make sure that it addresses the process (instead of the outcome) more clearly and unequivocally. Because of these deviations from the original design, Experiments 1a and 1b are conceptual rather than direct replications of Vieider (2009). Therefore, we added a direct replication attempt in our third experiment, where we tried to recreate Vieider’s experiment as closely as possible, while simultaneously also increasing the sample size.
All three of our experiments did not replicate the reduction of loss aversion in participants that were held (process-) accountable, with Bayes factors consistently providing substantial support for the null hypotheses. This pattern of results was further substantiated when we meta-analytically combined our findings, and this outcome did not change even when we included the original effect in our meta-analysis. In conclusion, the process accountability manipulation that we employed in our experiments—and that we carried over from Vieider (2009), who, in turn, followed standard procedures used in experimental accountability research—does not seem to affect loss aversion measured through the straight matching task, as employed by Vieider (2009) and us, in any meaningful way.
Alternative explanations
Of course, failed replication attempts always raise the question of whether this failure is, indeed, due to an insufficient robustness of the effect, or whether there are alternative explanations for the null finding. With regard to this, there are some potential alternative explanations for our findings that have to be discussed here.
The first major alternative explanation is that our experimental manipulations might not have been successful or, at least, too weak. If our manipulations did not induce (process) accountability to the same extent as the original study, it would not be surprising at all that we were unable to find the same effects as the original study. However, at least three arguments speak against this interpretation: First, our experimental manipulation of process and outcome accountability in Experiments 1a and 1b closely followed the standard procedure that has been established in this research tradition (cf. Lerner & Tetlock, 1999; Patil et al., 2014), and our manipulation of accountability in Experiment 2 followed Vieider’s (2009) procedure very closely. Hence, we replicated the original study in a way that should make it unlikely for the manipulation of accountability to be significantly weaker than in the original study. Second, it should be noted that Vieider did not report any manipulation checks in his 2009 paper, thereby making it impossible to verify how successful his manipulation was, and whether it was any more successful than ours. Third, although not all of our manipulation checks were successful, it should be noted that those which were relevant with regard to replicating Vieider (2009), namely those asking for participants’ expectation of having to justify themselves after they completed the experimental task, and whether process-accountable participants actually expected to be interviewed about their decision-making process, were successful: Participants in the accountability conditions of all three of our experiments felt that it would be more likely that they would have to justify themselves than participants in the no accountability condition. Additionally, the majority of participants in the process accountability condition in both Experiment 1a and Experiment 1b correctly identified what the interview following the experimental task would be about.
Another important candidate for an alternative explanation is that the measure of loss aversion used by us and Vieider (2009) might be too unreliable and, thus, the results obtained using it might be uninformative. There has been a recent debate in the literature on loss aversion regarding its existence, robustness, and context sensitivity (Bleichrodt & L’Haridon, 2023; Ert & Erev, 2013; Gal & Rucker, 2018; Mrkva et al., 2020; Zeif & Yechiam, 2022). One criticism that has been brought about as a potential confounding factor for loss aversion is that researchers often use fairly homogenous samples, most of the time college students, which are faced with monetary values that are relatively large for them, thus inducing rational risk aversion instead of irrational loss aversion (Brookshire & Coursey, 1987; Coursey et al., 1987; Ert & Erev, 2013; Gal & Rucker, 2018). While it may be the case that tasks using high monetary amounts in combination with student samples could confound risk aversion and loss aversion, we would argue that, based on the literature, we did not use particularly high monetary amounts in our task. Instead, we would argue that even for college students our gambles consisted of moderate stakes, as the loss values used ranged from 25€ to 150€ (cf. Gal & Rucker, 2018).
Of course, it is possible that risk aversion played a role in the size of the loss aversion we find within our experiments. One possible clue to the existence of such a confounding of risk aversion with loss aversion could be found in our exploratory analysis of our loss aversion measure, as we found that loss aversion for all three of our experiments increased with the stake size of the gambles. This is in line with a number of recent studies which demonstrated that loss aversion can indeed be influenced by stake size (Yechiam & Hochman, 2013; Zeif & Yechiam, 2022). However, loss aversion is never eliminated completely in any of our experiments, and the increase in loss aversion from the smallest to the largest gamble is still smaller than the difference between loss neutrality and the loss aversion for our smallest gamble, which indicates to us that loss aversion is at least partially responsible for the overweighting of losses.
On another note, one might question the general robustness of the measure used by Vieider (2009) and, thus, by us. Given the fact that the measure consists of a rather small number of structured lotteries, it is conceivable that the measure simply is not sensitive enough to identify any changes in loss aversion. While our own exploratory analyses do question this alternative explanation, as they do replicate effects of reduced loss aversion for small stakes (Yechiam & Hochman, 2013; Zeif & Yechiam, 2022), they do not entirely rule it out. Especially in Experiment 1a, we find rather large variability in our loss aversion measure which might disguise effects of accountability on loss aversion.
In addition, our measure of loss aversion was not incentivized, a fact that has been criticized in the past as a suboptimal procedure when investigating loss aversion, as this supposedly can attenuate (Holt & Laury, 2002) or exaggerate loss aversion (Brookshire & Coursey, 1987; Ert & Erev, 2013). Thus, it might indeed be the case that we overestimated or underestimated the true amount of loss aversion in our participants. It should be noted, though, that other research has found that there is a strong correlation between loss aversion and risk taking both in incentivized and in non-incentivized tasks (e.g., Camerer, 1989; Etchart-Vincent & l’Haridon, 2011; Horowitz & McConnell, 2002; Kachelmeier & Shehata, 1992; Mrkva et al., 2020; Zeif & Yechiam, 2022). It has to be taken into consideration, though, that the studies that did not find strong effects of incentivization did not use the same paradigm that we used to measure loss aversion.
That said, one important point regarding the robustness of our loss aversion measure and its missing incentivization is that these problems do not affect our central conclusion that Vieider’s (2009) results do not replicate. Vieider (2009) used the same, unincentivized measure as we did. Hence, any shortcomings of this measure of loss aversion extend to his study as well. Since Vieider claims that this measure does show loss aversion, and that the introduction of accountability can reduce the “loss aversion” found using this measure, it was absolutely mandatory that we use the same measure if we want to be faithful in our attempts to replicate these findings. Any change to this measure would be grounds to question our results based on using different methods to study the effects of accountability on loss aversion and therefore would no constituted a direct replication of Vieider (2009).
Further alternative explanations for the absence of any accountability effects on loss aversion could lie in possible differences between the setting and procedures of our experiments, on the one hand, and the setting and procedures of the original study, on the other hand. It is inevitable that some slight differences between an original study and a replication study exist. For once, our studies were all conducted at German universities rather than at the Erasmus University Rotterdam in the Netherlands. Correspondingly, our experimental materials were in German rather than in English or Dutch.
Furthermore, our participants exclusively worked on the experimental task that Vieider (2009) used to measure loss aversion. In contrast to this, in Vieider’s (2009) original study this straight matching task was part of a series of multiple experimental tasks that belonged to different experiments. While we have no specific hypotheses about how this might have affected the results, we cannot exclude the possibility that this procedural difference worked in favor of the effect that Vieider (2009) reported.
Of course, it is impossible for us to exclude any of these alternative explanations with certainty, since we did not test for them and, in some cases, do not even know whether the antecedent conditions for these explanations were present or not. However, even if one or all of these alternative explanations would have caused our replication attempts to fail, one would have to conclude that the accountability effect on loss aversion either has not been properly shown at all at this point, or that it is far more context-dependent and volatile than previously thought. Because either the measure Vieider (2009) and we used is simply not suitable to measure loss aversion and thus finding any differential effects of accountability would be not interpretable, or the effect would depend on minuscule situational differences such as the language of the material, whether the experiment is conducted at a German or a Dutch university, or within a series of experiments rather than as a standalone experiment which the original publication did never mentioned or implied as important. Also, if it should indeed be the case that the effect is dependent on such fine-grained context variations, one would have to conclude that the effect is of very limited theoretical and practical relevance.
Implications
Despite the limitations and alternative explanations discussed above it is clear that, regardless of whether one accepts Vieider’s (2009) measure of loss aversion or not, his findings do not replicate. Therefore, the central implication of our research is that, as of now, one should not assume that accountability does affect loss aversion. It is, of course, perfectly possible that a future study, with the use of an entirely different measure, will show that such an effect does, indeed, exist. We cannot (and do not want to) exclude this possibility. But, for the time being, we should no longer rely on Vieider’s (2009) finding as evidence of such an effect.
In addition to our findings regarding the effects of accountability on loss aversion and the replicability of Vieider’s (2009) study specifically, these results—when relating them to the larger literature on attempts to replicate accountability effects (see below)—also call into question the superiority of process accountability over no accountability that has been claimed as a general effect in different domains in the literature on accountability. The results of our current study fall in line with several other studies that were recently published, and that also could not find the often-claimed positive effects of process accountability on judgment and decision quality (e.g., W. Chang et al., 2017; Häusser et al., 2017; Hoffmann et al., 2017). Furthermore, our current results also mirror those of some other recent replication attempts (Schulz-Hardt et al., 2021; Sluga, 2021), which were unable to replicate earlier findings by Simonson and Staw (1992) and Siegel-Jacobs and Yates (1996), respectively, meaning that the beneficial effects of process accountability reported in the original studies could not be found. Taking into account these other findings, it seems safe to say that the claim of a general beneficial effect of process accountability on judgment and decision quality is an overstatement—at least at the moment. Rather, currently it seems to be more appropriate to assume that any beneficial effects of process accountability, if they exist at all, are largely context-specific, dependent on multiple situational factors, and are likely to be very small and, therefore, of very limited practical relevance (if any). This assertation is also corroborated by a new meta-analysis by Sharon et al. (2022), in which the authors integrated over several studies comparing process with outcome accountability. Overall, the authors found no significant difference in performance between the two forms of accountability. What they did find, however, was that outcome accountability was associated with better performance in complex tasks, and process accountability was associated with better performance in simple tasks. Moreover, even after controlling for task complexity, the heterogeneity in the subgroups remained high. These findings confirm, at least for the comparison of process and outcome accountability, how context-specific accountability effects are, given that they exist at all. Accordingly, we believe it would be important to identify further situational and contextual variables that influence the effects of (process) accountability on the quality of judgments and decisions. Besides this, however, we also think that it is important to conduct more large-scale attempts to replicate the effects of accountability on judgments and decision-making in order to clarify further which of the effects found in the existing literature are robust and which of these effects might be more context-dependent, or even nonexistent.
On a different note, our results also have some implications for the current debate regarding the existence or lack thereof of loss aversion as a robust psychological phenomenon. Like several other recent studies, we found evidence that loss aversion does not seem to be robust across different stake sizes. Instead, we find evidence that loss aversion reduces as loss values decrease, and it appears plausible that, if loss amounts were even smaller than what we used for our gambles, loss aversion might entirely disappear in our task. This would be similar to what Zeif and Yechiam (2022) found for their lotteries using small stakes. Given that we used a student sample, it is not too surprising that loss aversion did not disappear in our study, as even our smallest gambles (25€) is a potentially non-negligible amount of money for a lot of students to lose.
Some thoughts on the manipulation of process accountability
In addition to the implications for the replicability of the effect in the study by Vieider (2009), or effects of process accountability in general, our study also raises some doubts about the way in which researchers typically manipulate (process) accountability. Most experimental research on accountability uses more or less the same standard manipulations in order to induce (process) accountability. Namely, it does so by announcing an interview to the participants in which they will be asked to justify their decision-making process. While rather straightforward, this manipulation is not necessarily very strong or realistic. In a real-world context, when people are held accountable, there usually are much higher stakes than performing good or bad in a simple, experimental judgment or decision-making task. Being held accountable for the investment of millions of dollars or the treatment plan of a cancer patient is very different from being held accountable for a decision on how hypothetical lotteries have to be structured in order to be attractive to the decision-maker. And more importantly, in a real-world context, there are usually consequences that one has to fear if the person, the board, or whoever one is accountable to concludes that one’s decision processes or decision outcomes were not up to par—consequences such as fines or the termination of the employment contract. In contrast to this, with the typical accountability manipulation used in experimental research, the worst consequence participants would have to fear would be the unpleasant feelings one might experience when having to justify a bad decision to an expert, and this expert might then raise their eyebrow or make a critical statement. Such differences raise the question of whether the typical experimental manipulation is strong enough to show reliable effects of process accountability, or if it can even induce (process) accountability properly at all. On the basis of our current findings, we have doubts about whether this manipulation is sufficiently strong: Although, according to our results, it worked in terms of making the participants aware of the interview and its content, and by making them believe that they would have to justify their decision process, it seemed to do little more than just that, as it seemed to have no impact on what participants intended to focus on during the task, or what participants subsequently reported about their focus when performing the task.
This problem is further amplified by the fact that many studies on (process) accountability do not employ any manipulation checks at all (e.g., Hoffmann et al., 2017; Kim & Trotman, 2015; Lefebvre & Vieider, 2013; Vieider, 2009), or limit the manipulation checks to simple instruction checks, like asking participants whether or not they will be interviewed after completing the task they are working on (e.g., Brtek & Motowidlo, 2002; L. J. Chang et al., 2013; Siegel-Jacobs & Yates, 1996). Thus, in these studies, we cannot find whether participants actually experienced process accountability in a psychologically meaningful way.
Another issue with the research on process accountability is that there have been only very few studies that try to clarify the actual psychological mechanisms and underlying psychological effects it has on decision-makers. The main mechanism, and one of the only ones that have been proposed at all, is assumed to be that process accountability should increase epistemic motivation and lead to more rational thinking (Brtek and Motowidlo, 2002; De Dreu et al., 2000). While it has been shown in a handful of studies that process accountability can increase epistemic motivation (de Langhe et al., 2011; Scholten et al., 2007; Ten Velden et al., 2010), none of these studies have properly established epistemic motivation as the mediator of the effects process accountability has on judgment and decision quality. In addition, epistemic motivation also never really gained traction in the broader accountability literature as a manipulation check for process accountability, as only a very limited number of studies ever directly measured the epistemic motivation of participants. As a result of this limited research on the psychological mechanisms behind the effects of process accountability, we think it would be a fruitful avenue for future research to further investigate the direct psychological effects and mechanisms of (process) accountability, and to identify and develop stronger manipulations of (process) accountability with higher ecological validity.
Conclusion
Our original goal with the research we presented here was to extend and clarify the effect of (process) accountability on loss aversion reported by Vieider (2009). However, these initial plans were derailed by the results of our first two experiments. Therefore, our aim shifted toward investigating the robustness of the accountability effect Vieider (2009) had reported, thereby turning our research into a replication project. Since our three experiments and our meta-analyses found no evidence for the effect of (process) accountability on loss aversion and provided substantial evidence for the corresponding null hypothesis, we feel justified in concluding that currently there is no reason to assume that an effect of (process) accountability on loss aversion exists. While we cannot definitively conclude that there is no effect of accountability on loss aversion at all, as it is possible that another series of experiments that uses a different (and perhaps more accurate) measure of loss aversion could find an effect of accountability on loss aversion, there currently is no evidence in favor of such an effect. In this, these results do corroborate other recent failed replication attempts that, in sum, question the general validity of the claim that process accountability can be used as an effective and reliable tool to reduce biases in judgments and decision-making.
Supplemental Material
sj-docx-1-qjp-10.1177_17470218251369493 – Supplemental material for Does holding decision-makers accountable make them less loss averse? A three-study replication attempt
Supplemental material, sj-docx-1-qjp-10.1177_17470218251369493 for Does holding decision-makers accountable make them less loss averse? A three-study replication attempt by Johannes Rollwage, Jan Alexander Häusser and Stefan Schulz-Hardt in Quarterly Journal of Experimental Psychology
Supplemental Material
sj-docx-2-qjp-10.1177_17470218251369493 – Supplemental material for Does holding decision-makers accountable make them less loss averse? A three-study replication attempt
Supplemental material, sj-docx-2-qjp-10.1177_17470218251369493 for Does holding decision-makers accountable make them less loss averse? A three-study replication attempt by Johannes Rollwage, Jan Alexander Häusser and Stefan Schulz-Hardt in Quarterly Journal of Experimental Psychology
Supplemental Material
sj-docx-3-qjp-10.1177_17470218251369493 – Supplemental material for Does holding decision-makers accountable make them less loss averse? A three-study replication attempt
Supplemental material, sj-docx-3-qjp-10.1177_17470218251369493 for Does holding decision-makers accountable make them less loss averse? A three-study replication attempt by Johannes Rollwage, Jan Alexander Häusser and Stefan Schulz-Hardt in Quarterly Journal of Experimental Psychology
Supplemental Material
sj-docx-4-qjp-10.1177_17470218251369493 – Supplemental material for Does holding decision-makers accountable make them less loss averse? A three-study replication attempt
Supplemental material, sj-docx-4-qjp-10.1177_17470218251369493 for Does holding decision-makers accountable make them less loss averse? A three-study replication attempt by Johannes Rollwage, Jan Alexander Häusser and Stefan Schulz-Hardt in Quarterly Journal of Experimental Psychology
Supplemental Material
sj-docx-5-qjp-10.1177_17470218251369493 – Supplemental material for Does holding decision-makers accountable make them less loss averse? A three-study replication attempt
Supplemental material, sj-docx-5-qjp-10.1177_17470218251369493 for Does holding decision-makers accountable make them less loss averse? A three-study replication attempt by Johannes Rollwage, Jan Alexander Häusser and Stefan Schulz-Hardt in Quarterly Journal of Experimental Psychology
Footnotes
Acknowledgements
The authors would like to thank Maximilian Blomberg, Arzu Çetin, Carlotta Dove, Moritz Ernst, Johanna Frisch, Maren Michaelis, Sonja Pilz, Tjark Rode, Jana Schildknecht, Hanna Scholz, Stella Wanzel, and Anja Wegner for their assistance in collecting the data of the three experiments reported here.
Data accessibility statement
Declaration of conflicting interests
The authors declared no potential conflicts of interest with respect to the research, authorship, and/or publication of this article.
Funding
The authors disclosed receipt of the following financial support for the research, authorship, and/or publication of this article: The research reported in this manuscript was funded by research grants from the German Science Foundation (Deutsche Forschungsgemeinschaft, DFG) to the second and the third authors, project nos. HA 6455/1-1 and SCHU 1279/14-1.
Ethical approval
Have complied with APA ethical standards in human subjects research.
Notes
References
Supplementary Material
Please find the following supplemental material available below.
For Open Access articles published under a Creative Commons License, all supplemental material carries the same license as the article it is associated with.
For non-Open Access articles published, all supplemental material carries a non-exclusive license, and permission requests for re-use of supplemental material or any part of supplemental material shall be sent directly to the copyright owner as specified in the copyright notice associated with the article.