
Abstract
Visuospatial illusions may be a by-product of learned regularities in the environment or they may reflect the recruitment of sensory mechanisms that, in some contexts, provide an erroneous spatial estimate. Young children experience visual illusions, and blind adults are susceptible using touch alone, suggesting that the perceptual inferences influencing illusions are amodal and rapidly acquired. However, other evidence, such as visual illusions in the newly sighted, points to the involvement of innate mechanisms. To help tease apart cognitive from sensory influences, we investigated susceptibility to the Ebbinghaus, Müller-Lyer and Vertical–Horizontal illusions in children aged 6–14 years following visual-only, haptic-only and bimodal exploration. Consistent with previous findings, children of all ages were susceptible to all three visual illusions. In addition, illusions of extent but not of size were experienced using haptics alone. We then tested 17 congenitally blind children to investigate whether illusions were mediated by vision. Similar to their sighted counterparts, blind children were also susceptible to illusions following haptic exploration suggesting that early visual experience is not necessary for spatial illusions to be perceived. Reduced susceptibility in older children to some illusions further implies that explicit or formal knowledge of spatial relations is unlikely to mediate these experiences. Instead, the results are consistent with previous evidence for cross-modal interactions in ‘visual’ brain regions and point to the possibility that illusions may be driven by innate developmental processes that are not entirely dependent on, although are refined by, visual experience.
Introduction
An illusion, typically defined as a mismatch between the phenomenological percept and the physical characteristics of a stimulus, can demonstrate how human perception works by elucidating the perceptual inferences that act on the encoded sensory information. So-called optical, geometric or visuospatial illusions involving judgements of size, extent or orientation have been the source of fascination from antiquity (Ptolemy c. 100–170 CE), through to the philosophers of the 17th and 18th centuries (e.g. Molyneux [1656–1698] and Berkeley [1685–1753] were particularly fascinated by the moon illusion) and recent empirical investigations have helped reveal the perceptual and neural bases of such illusory experiences (see e.g. Shapiro & Todorovic, 2017). Accordingly, illusions tend to be explained either on the basis of a bias in the perception of the encoded information (as experienced in ambiguous figures), errors in the sensory estimate (e.g. Coren & Girgus, 2020; Wade, 1982; 2017) or the product of learned associations (Gregory, 1963; von Helmholtz, 1867) directly acquired from the statistical or probabilistic properties of the world (Simoncelli & Olshausen, 2001).
The emergence of illusory experiences during development provides some insights into their origin. As a child develops, they acquire information that helps the brain build models of the world from sensory estimates. If illusions are a by-product of this learning, then we might expect illusions to appear late in development or to increase with age. The results of previous investigations, however, suggest that visuospatial illusions such as the Müller-Lyer and Vertical–Horizontal illusions are experienced by very young children (Binet, 1895; Pollack & Zetland, 1965; Piaget et al. 1954; Winch 1907; see Wincza et al., 2024 for a review). Moreover, the strength of children’s illusory experiences is often at least equal to, if not greater, than adults’ (Brosvic et al., 1993, 2002; Coren & Porac, 1978; Hanisch et al., 2001; Pollack, 1970; although see Doherty et al., 2010). These findings suggest that visual learning may shape the experience but does not fully account for their origin. Alternatively, evidence for the universality of illusions across cultures (e.g. Bremner et al., 2016; Dawson et al., 1973; de Fockert et al., 2007) as well as susceptibility in many animal species, including non-human primates and birds (Feng et al., 2017), suggests a role for more innate influences.
Indeed, susceptibility to spatial illusions in touch (see e.g. Lederman & Jones, 2011 for a review) raises the question of whether visual experience per se mediates these illusions. On the one hand, illusions have been explained by appealing to modality-specific mechanisms such as inappropriate constancy scaling (e.g. size constancy in vision, Gregory, 1963; Over, 1967) or selective filtering of visual features such as orientation or spatial frequency (Carrasco et al., 1986; Ginsburg, 1984). Since related spatial dimensions (size or linear extent) can be directly perceived using touch, then sensory errors due to size constancy should not apply. Surprisingly, not only are illusions experienced using touch alone, but the strength of the illusions can be similar across modalities (Suzuki & Arashida, 1992). However, cross-modal equivalence of illusory experiences appears to be limited to illusions based on spatial extent and not those based on spatial area or shape: illusions such as Ponzo (Casla et al., 1999), Delboeuf (Gentaz & Hatwell, 2004; Hatwell, 1960) and Poggendorf (Wenderoth & Alais, 1990) fail to transfer to the haptic domain in a manner predicted by the illusory experience through vision. These findings argue against the idea that haptic inputs are directly recoded into vision, which would predict either widespread susceptibility to all spatial illusions or weakened effects in haptics due to transfer errors (Rudel & Teuber, 1963; Newell, 2010). Moreover, illusion specificity suggests that only certain sensory estimates of spatial inputs, such as low-level analyses of extent, may depend on mechanisms that are common to vision and touch (Millar & Al-Attar, 2002; Tabrik et al., 2021; Wallraven et al., 2014; Yau et al., 2009). As information is further processed, such as for shape or size perception, it is not inconceivable that more modality-specific mechanisms are involved (see e.g. Lee Masson et al., 2016; Miller & Sheinberg, 2022; Wu et al., 2023) which, in turn, may preserve illusions in one modality but not the other.
The finding that spatial illusions can arise in the haptic domain in sighted adults does not, however, entirely rule out the possibility that they are mediated by visual learning (e.g. Frisby & Davies, 1971) or long-term visual knowledge (Hardstone et al., 2021). If visual experience is necessary for illusions through touch then we would expect that early blind individuals would not be susceptible. In contrast, there is ample evidence that blind adults experience spatial illusions through touch (e.g. Bean, 1938; Hatwell, 1960; Patterson & Deffenbacher, 1972; Tsai, 1967). In one of the first such studies, Révész (1934) tested both (blindfolded) sighted and blind adults on a large number of spatial illusions, such as the Müller-Lyer, Vertical–Horizontal and Ponzo illusions, and found evidence for illusion susceptibility in both groups (see also, Casla et al., 1999; Gentaz & Hatwell, 1998; Heller & Joyner, 1993; Heller et al., 2002). Indeed, some reports suggest that haptic illusions, such as the Müller-Lyer, are even greater in blind adults than (blindfolded) sighted participants (Patterson & Deffenbacher, 1972; although see Bean, 1938 for the opposite result).
Blind adults may acquire spatial knowledge through explicit training routines such as Braille reading, tactile maps or graph reading (typically taught in mainstream education, Park and Hong, 2023), specific skills training including drawing (see e.g. Kennedy & Juricevic, 2006; Likova & Cacciamani, 2018), through the use of sensory substitution devices for spatial navigation (see e.g. Chebat et al., 2020 for a review) or through everyday tactile interactions with 3D objects. This tactile spatial knowledge may lead to predictions or biases that drive illusory experiences in a manner that is similar to visuospatial knowledge. An alternative proposal is that haptic spatial processes may be scaffolded by the development of early ‘visual’ mechanisms, even in blind individuals, and it is these visual mechanisms that drive the illusory percepts in other modalities. Evidence that newly sighted children are immediately susceptible to visual presentations of the Müller-Lyer and Ponzo illusions support this proposal (Gandhi et al., 2015). In addition, the recruitment of early visual regions in the brain, including primary visual cortex, has been widely reported in blind adults performing spatial tasks using touch (Burton, 2003; Röder et al., 1997; Sadato et al., 1996; Zangaladze et al. 1999;) with stronger functional and structural connections between primary somatosensory and visual cortices in the blind possibly mediating these interactions (Ptito et al. 2008; Wittenberg et al., 2004).
Developmental effects may help reveal the mechanisms underpinning susceptibility to spatial illusions. For example, if amodal, top-down knowledge alone influences spatial illusions then we might expect an increase in susceptibility in older than younger children as their knowledge of the world increases, statistical regularities across modalities are acquired (Conway & Christiansen, 2005; Saffran & Kirkham, 2018) and supporting cognitive systems improve (Gathercole et al., 2004). This may be particularly the case for visual over haptic illusions since visual experience is more extensive. In contrast, if illusions are driven by common sensory mechanisms for spatial processing, then children will be susceptible at all ages and the illusory experience is likely to be similar across modalities. Recent evidence that visual and haptic perceptual abilities are related, at least for object perception, support this view (Chow et al., 2022, 2024). Indeed, it has already been reported that sighted children are susceptible to some classic spatial illusions using touch alone, such as the oblique effect (Gentaz & Hatwell, 1995) and the Vertical–Horizontal illusion (Ballesteros et al., 2012). Moreover, haptic illusions can be demonstrated even in infants (Gentaz & Streri, 2004). However, sighted children, even infants, may have acquired sufficient visuospatial experience early in development to drive these illusions in touch. Critically, therefore, evidence for haptic spatial illusions in children with a lack of visual experience is needed to support the proposal of a common spatial mechanism.
The main aim of the present study was to investigate whether sighted and blind children experience spatial illusions through touch. Furthermore, we were interested in whether the strength of the illusions was similar across vision and touch for sighted children, and if age affected susceptibility across these modalities. Based on the classification of illusions proposed by Coren et al. (1976), and evidence for distinct neural coding (Wu et al., 2023) we tested two spatial illusions of extent, namely, the Müller-Lyer and Vertical–Horizontal, and one spatial illusion of size, namely the Ebbinghaus illusion, to investigate whether these experiences were distinct across modalities. If (sighted) children are susceptible to illusions in both vision and touch, we were also curious to see whether combined bimodal presentation would affect the strength of the illusion in any age group. At least three different outcomes can be predicted from a bimodal presentation of illusory stimuli. On the one hand, if both senses were relying on the same domain-general or modality-specific mechanisms for spatial perception (e.g. Chow et al., 2024; Dümmler et al., 2008), then no difference in illusion strength relative to a unimodal presentation would be expected. Alternatively, the bimodal condition may increase illusions through a summation of the probability of the occurrence of an illusion across modalities. Finally, illusions may be reduced either by combining spatial cues across modalities (thus leading to a more precise spatial estimate in a process known as multisensory cue combination, e.g. Ernst, 2006) or through cross-modal interference (Hanisch et al., 2001; Mancini et al., 2010).
Experiment 1
There were two main aims of the following experiment. First, we wished to determine whether susceptibility to spatial illusions changes with age during childhood. Previous studies suggest that visual susceptibility to some spatial illusions can either increase (such as the Ebbinghaus illusion, see Coren & Porac, 1978; Doherty et al., 2010) or decrease (as with the Müller-Lyer, see Piaget, 1969; Pintner & Anderson, or Vertical–Horizontal, Winch, 1907) with age. Both findings suggest that susceptibility is influenced by experience with the visual world, either due to improved sensory estimates with sensorimotor refinement, an increase in spatial knowledge or both. Second, we investigated whether spatial information is similarly perceived across vision and touch during development: if so, then we would expect the strength of the illusion to be similar across modalities at each developmental stage.
Using a within-subjects design, we examined perceptual susceptibility in three illusions, the Müller-Lyer, Vertical–Horizontal and Ebbinghaus across the sensory modalities of vision, and haptics as well as a bimodal condition. Control trials were included as a baseline measure of spatial discrimination (length or size) in vision and touch to assess the role of development on spatial accuracy. We used the same ternary, forced-choice matching task across all trials (illusory and control, in each modality). Specifically, the children were required to explore pairs of stimuli and judge whether the stimuli were the same or different and, if different, to indicate which was the larger or longer of the two (depending on the test illusion).
Method
Participants
To gauge optimal sample size per age group, an a priori power analysis was conducted using PANGEA (Westfall, 2015). This analysis indicated that n = 25 per age group would provide 93% power to detect a medium effect size (d = 0.5) for the Age Group by Modality interaction term in a mixed analysis of variance (ANOVA) design. A total of 90 children participated in this study (Mage = 9.19 years, SD = 1.87 years, age range: 6–12 years) and were recruited from local primary (i.e. elementary) schools and summer camps within the city centre of Dublin. Data from one participant were removed as the child declared a prior explicit knowledge of the ‘rule’ in all three illusions, yielding a final sample size of 89 children. Children were split into three groups based on their age during testing. The youngest group included 31 children with an age range of 6–8 years (19 males, 12 females, Mage = 7.13 years, SD = 0.88 years); the mid-age group included 32 children with an age range of 9 to 10 years (11 males, 21 females, Mage = 9.38 years, SD = 0.71 years); and the oldest group included 26 children with an age range of 11–12 years (20 males, 6 females, Mage = 11.42 years, SD = 0.50 years).
The experiment was approved by the School of Psychology Research Ethics Committee at Trinity College Dublin. The data acquisition and processing complied with the EU General Data Protection Regulation (GDPR). Prior to the experiment, the parents or guardians of all the children provided written informed consent and all children assented to take part. Each child received a small toy for their participation.
Materials
All stimuli were composed of acrylic material which was 70 mm thick and laser cut into the respective shapes and dimensions for each illusion (see below). For testing purposes, the stimuli were presented on a plywood platform (74 cm × 46 cm), which was positioned on a table in front of the participant. The platform contained slots for positioning each stimulus in place to prevent any movement of the stimuli. In turn, each stimulus included holders placed on the back which fitted into the slots on the platform. The stimuli were positioned on the platform at a comfortable, reachable distance from the participant. This apparatus was placed behind a small curtain. The curtain frame was composed of PVC pipe (height 70 cm; width 75 cm) and white opaque fabric served as the curtain. The curtain was used for testing in the haptic condition and was also drawn between all other trials to prevent viewing of the stimuli when the experimenter was switching the stimuli between trials. The entire apparatus was mobile to allow children to be tested either onsite in their respective schools or at the university.
Testing of the Müller-Lyer or Ebbinghaus illusion conditions, as well as all control conditions, consisted of the presentation of a pair of stimuli, one presented to the left and the other to the right of the participant’s body midline, on the stimulus platform. There was a distance of approximately 100 mm between the centre of each of the two stimuli. The Horizontal–Vertical illusion condition necessitated a different arrangement of two stimuli which were positioned perpendicular to each other at the body midline. Figure 1 shows an example of images of the stimuli used in each illusion.
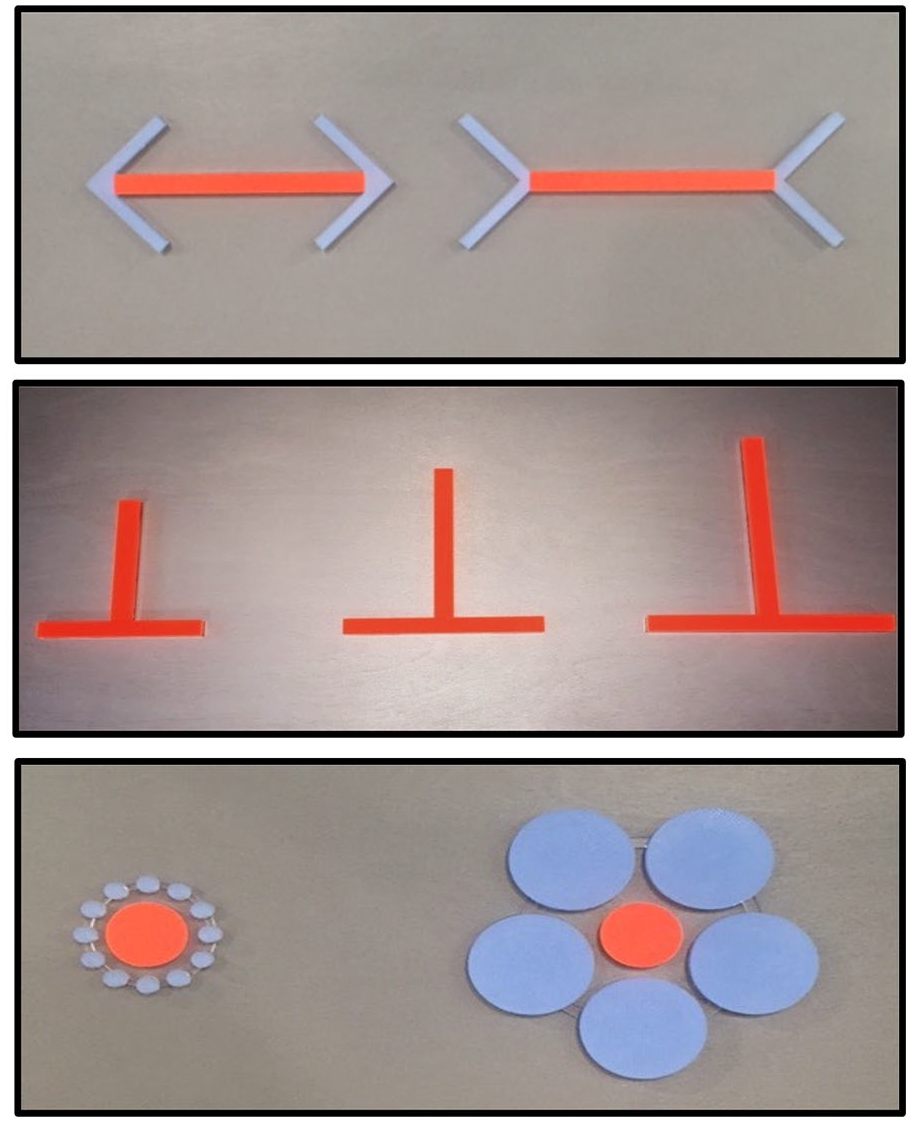
Photographic images of the real stimuli used for the Müller-Lyer (top of figure), Vertical–Horizontal (middle) and Ebbinghaus (bottom) illusion trials. Note that, because these are photographic images of real stimuli, the spatial dimensions may appear slightly distorted; refer to the text for details of the stimulus dimensions. Where relevant, the main target area is identified by a unique colour (orange) and texture (smooth) relative to the other features (blue, rough) present in the stimulus.
For the Müller-Lyer illusion, each stimulus was comprised of a line with arrowhead shapes at each end. There were three different lengths of lines used; 80, 100 or 120 mm and all were of the same width (10 mm). The arrowheads were composed of two lines which were all 40 mm in length. Acrylic material of different textures and colours was used to facilitate discrimination between the lines and arrowheads in each modality, that is, the lines were smooth and orange in colour whereas the arrowheads were roughly textured and blue in colour. During the task, the ‘illusion’ trials consisted of two lines presented with arrowheads at the endpoints such that one line was paired with inward-facing arrowheads and the other with outward-facing arrowheads. The length of the lines between the arrowheads was always identical.
The line stimuli presented in the Vertical–Horizontal illusion trials were either 80, 100 or 120 mm in length and all lines were of the same width (10 mm). Line stimuli for the illusory trials were arranged perpendicular to each other, such that one line was vertically aligned (i.e. away from the body) and bisected the other line which was horizontally aligned (i.e. from left to right across the body; see Figure 1). The same smooth textured, orange-coloured material was used for both lines. The length of the vertical and horizontal lines was always the same in each trial of the ‘illusion’ condition.
In the Ebbinghaus illusion, each stimulus pattern consisted of a central disc surrounded by a number of other discs arranged in a circular or annulus array. The central and surrounding discs differed in both colour and texture, with the central disc smooth in texture and orange in colour, whereas the surrounding discs were rough in texture and coloured blue (see Figure 1). The central discs had a diameter of either 310, 340 or 370 mm. Each central disc was surrounded by either a large annulus of five discs, with each disc measuring 580 mm in diameter, or by a small annulus of 12 discs, each measuring 10 mm in diameter. The relative size of the central disc and the surrounding discs in the annuli were equivalent to those used by Franz et al. (2003): these relative sizes control for the distance between centre of the target circle to the near edge of any circle in the small or large annuli (see also Hanisch et al., 2001).
The test also included control trials for each of these illusions. For each control trial of the Müller-Lyer illusion, we presented two line stimuli only (i.e.without arrowheads), side-by-side, and both were horizontally aligned (these control trials were also relevant for the Horizontal–Vertical illusion). For the Horizontal–Vertical illusion, we added control trials in which we presented two line stimuli side by side, with both arranged in a vertical position only. Trials in these control conditions included pairs of lines of either the same or different lengths (see above for specific dimensions). The control trials for the Ebbinghaus illusion were based on the same central discs used in the illusory conditions but did not contain surrounding annuli. The task for all the control trials was the same ternary, forced-choice task as for the illusory trials.
Design
The experiment was based on a two-way, within subject’s design, with age group (6–8 years; 9–10 years and 11–12 years) and testing modality (vision, haptics and bimodal) as factors. The number of (spatial discrimination) response errors was the main dependent variable. Perceptual susceptibility was specifically demonstrated by the relative number of errors made to the illusory trials (see section ‘Data analysis’ for details). Performance was tested in each of the three spatial illusions, the Müller-Lyer, Vertical–Horizontal and Ebbinghaus, along with their respective control conditions, in separate blocks. Thus, considering the different test modalities, the design yielded 3 experimental blocks per illusion (i.e. 9 in total), with each block comprising 15 trials (from the same modality). Within each block, the first six trials were always the ‘illusion’ trials, and the following nine trials were the control trials. The experimental blocks were administered over separate sessions (with one illusion presented per session across all three modalities) over 3 consecutive days. The order of the ‘illusion’ sessions and the modalities tested within each session were counterbalanced across participants.
Of the nine control trials in the Müller-Lyer experimental blocks, the same length lines were presented in three trials (i.e. both lines were either 80, 100 or 120 mm in length) and different length lines were presented across six trials: in two trials the lines differed by 40 mm (80 mm vs. 120 mm) and in four trials the lines differed by 20 mm (80 mm vs. 100 mm and 100 mm vs. 120 mm). Similarly, the nine control trials for the Vertical–Horizontal control trials involved stimuli which were aligned along the vertical axis and centred at the participant’s body midline. These stimuli were identical to those used in the control trials for the Müller-Lyer illusion with the exception of their orientation. For the control trials in the Ebbinghaus condition, three pairs of discs of the same size (three trials) and pairs of discs of different sizes (six trials) were used. Of these different trials, in two trials the diameter of the discs differed by 60 mm (310 mm vs. 370 mm) and in four trials the lines differed by 30 mm (310 mm vs. 340 mm and 340 mm vs. 370 mm).
For each trial type (illusion or control), position of the larger/longer stimulus on the apparatus was counterbalanced across modality and participants.
Procedure
Participants were seated at a desk on a chair aligned with the location of the stimulus board. Prior to testing, the experimenter explained the task to each child participant and instructed them before each block of trials that they would explore shapes using either their eyes, their hands, or both (according to experimental conditions). They were informed that the task involved matching pairs of lines or shapes in each session and all children were naïve to the possibility that illusory conditions would be tested. Participants were encouraged to explore the entire stimulus array in each trial but, when necessary, were directed to the specific shape that was relevant to the task. For example, for both the Müller-Lyer and Ebbinghaus illusions, the experimenter explained to the child that they should make their decision based on the orange stimuli or, for touch, on the smooth lines or discs only (see Figure 1).
For the haptic exploration of all stimulus types, participants were instructed to feel the entire stimulus by moving their hands over the array with their fingers extended and palms flat. This was demonstrated by the experimenter prior to testing and reinforced during training trials. For the Müller-Lyer illusion and control trials, participants moved their hands back and forth to explore the horizontally aligned stimuli. For the Vertical–Horizontal illusion trials, in which the stimuli were in proximity to each other, participants could not explore the horizontal and vertical lines simultaneously but instead moved their dominant hand up and down and left to right to explore the inverted T. For the vertically aligned control stimuli, participants moved both hands up and down simultaneously across the stimuli pair. Finally, for the Ebbinghaus illusion and control trials, haptic exploration was initiated from the centre of the stimuli and from there, children moved their hands using large circular motions with fingers extended and palms flat (see instructions described earlier). During haptic exploration in these illusions (whether unimodal or in the bimodal conditions) the experimenter monitored the hand movements and, when necessary, reminded the child on the appropriate exploratory procedure to use and discouraged other haptic strategies such as tracing with a single finger or making a pincer grip to estimate spatial extent which are known to affect haptic performance in adults (Heller et al., 2005).
Participants completed three experimental blocks per day, one per modality for each illusion. After exploring each stimulus set, participants made a verbal ternary-alternative forced-choice response (e.g. for the Müller-Lyer illusion: ‘this line (on the left) is longer’, ‘this line (right) is longer’ or ‘they are the same’) and responses were recorded by the experimenter. The 3-AFC task was the same for both the illusory and control trials. When the entire experiment was complete, the experimenter discussed the illusions with each child to assess their level of prior knowledge of any of the illusions.
Results
The total number of participants tested on each illusion is presented in Table 1. Although we used a within-subjects design across all three illusions, sample sizes varied across the three illusions, for two reasons. First, as is common for multi-session studies, some children could not complete all experimental sessions for a variety of reasons such as school absences, or scheduling conflicts, or they were already familiar with a specific illusion. Subsequent to testing, if the child declared previous knowledge of the ‘rule’ of the illusion then their data for that particular illusion was also excluded from analysis. Otherwise, all participants’ data for the completed blocks were included in the analyses. In total, data sets from six boys and four girls were incomplete, resulting in 6.7% of missing data across all participants.
Number of participants tested in each of the illusory conditions comprising blocks of illusory and control trials, organised by participant gender (boys and girls) and age.
The responses to the illusory trials were analysed separately from those to the control trials. For the illusory trials, we calculated each participant’s ‘susceptibility score’ as a percentage by dividing the number of trials on which they provided an error response that was consistent with the illusion by the total number of illusion trials in the block. We also captured each participant’s accurate responses to represent their ‘veridical’ perception, that is, when the child correctly responded that the stimuli were the same length or size in the ‘illusory’ trials. Again, this score was calculated as a percentage by dividing the number of accurate responses to illusory trials by the total number of illusion trials in the block. Finally, error responses that were not consistent with susceptibility to the illusion (e.g. if the child responded to that the ‘larger’ stimulus was smaller) were also recorded and similarly calculated.
Data were pre-processed using R (R Core Team, 2023) via RStudio (Version 2023.03.0+386), and all analyses were conducted in JASP (JASP Team, 2024). Greenhouse–Geisser corrections were used when Mauchly’s Test for Sphericity was significant and effect sizes were presented as general eta (Bakeman, 2005). Using Levene’s test we demonstrated that the assumption of homogeneity of variance was met for all data sets with one exception (the data to the visual condition of the ‘Horizontal’ control trials; see Table S5). Tests of normality were conducted using Shapiro-Wilk tests which suggested that normality was violated in several data sets (see Table S4): non-parametric tests of these data were therefore also conducted and these analyses yielded comparable results to those reported below (for further details see Table S6). Significance values are reported with Bonferroni correction in cases of multiple comparisons, post-hoc comparisons. Outliers were defined as values that were above or below three times the interquartile range. The outlier detection protocol for the dependent variable, illusory susceptibility, identified a single extreme outlier in the Ebbinghaus Haptic block. The analysis was run with and without the outlier removed: inclusion of the outlier did not change the results, therefore the analyses reported are with the outlier included. All moderate (1.5 times the interquartile range) outliers (n = 8) were for the haptic conditions.
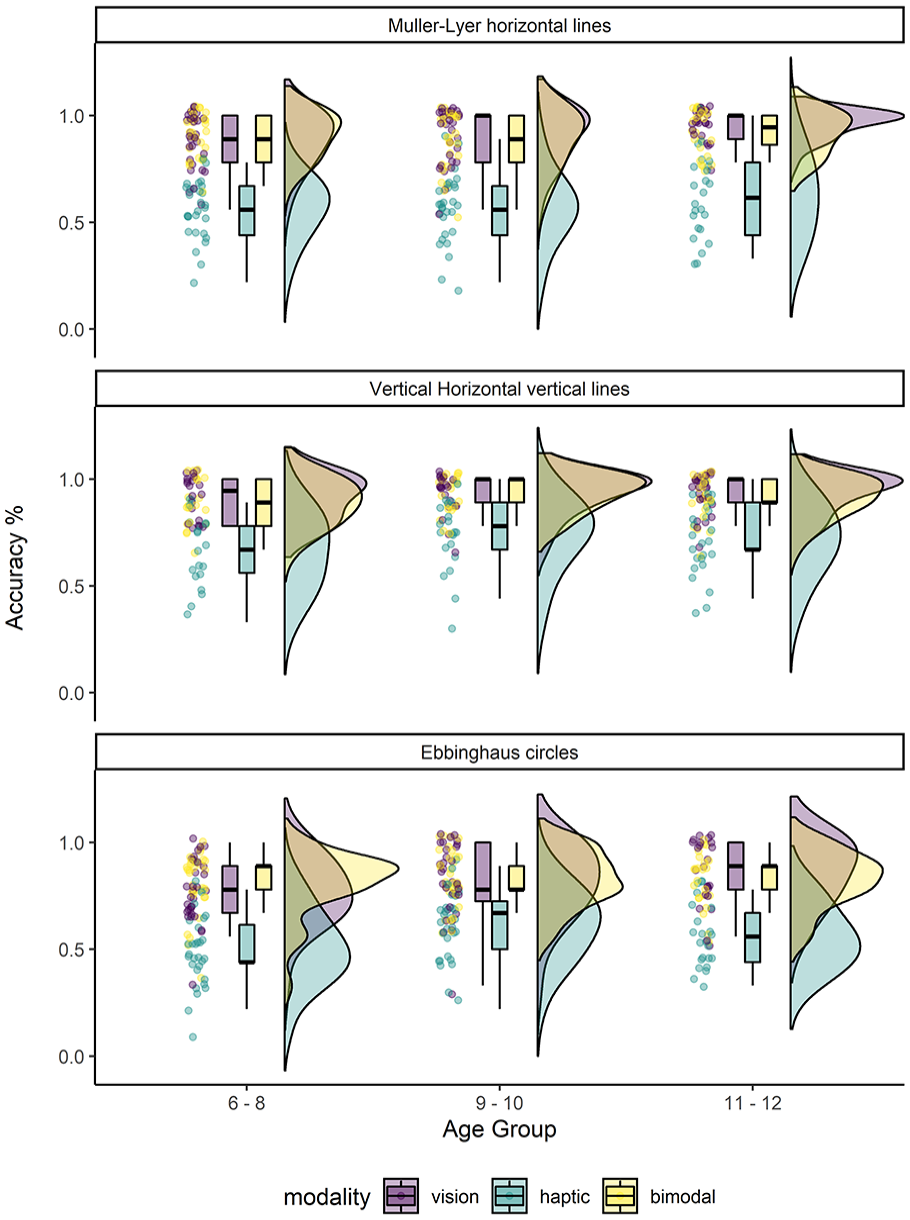
We examined the performance of the illusion trials first, using a 3 (Modality, Within) × 3 (Age Group, Between) mixed-model ANOVA for each illusion. Performance on the control trials that related to each illusion was subjected to the same 3 × 3 ANOVA to examine the effect of modality and/or age on spatial (length or size) discrimination. The overall susceptibility performance to the illusions by age group and modality are depicted in Figure 2 (for further details on descriptive statistics see Table S1). Overall (percentage) mean susceptibility to each of the illusions was as follows: Müller-Lyer (M = 64.3%, SD = 27.09), Vertical–Horizontal (M = 52.9%, SD = 25.20) and Ebbinghaus (M = 48.4%, SD = 32.97). See Table S2 for details on statistical comparisons between response rates consistent with the illusion compared to chance level (33.3%) for each modality and age group.
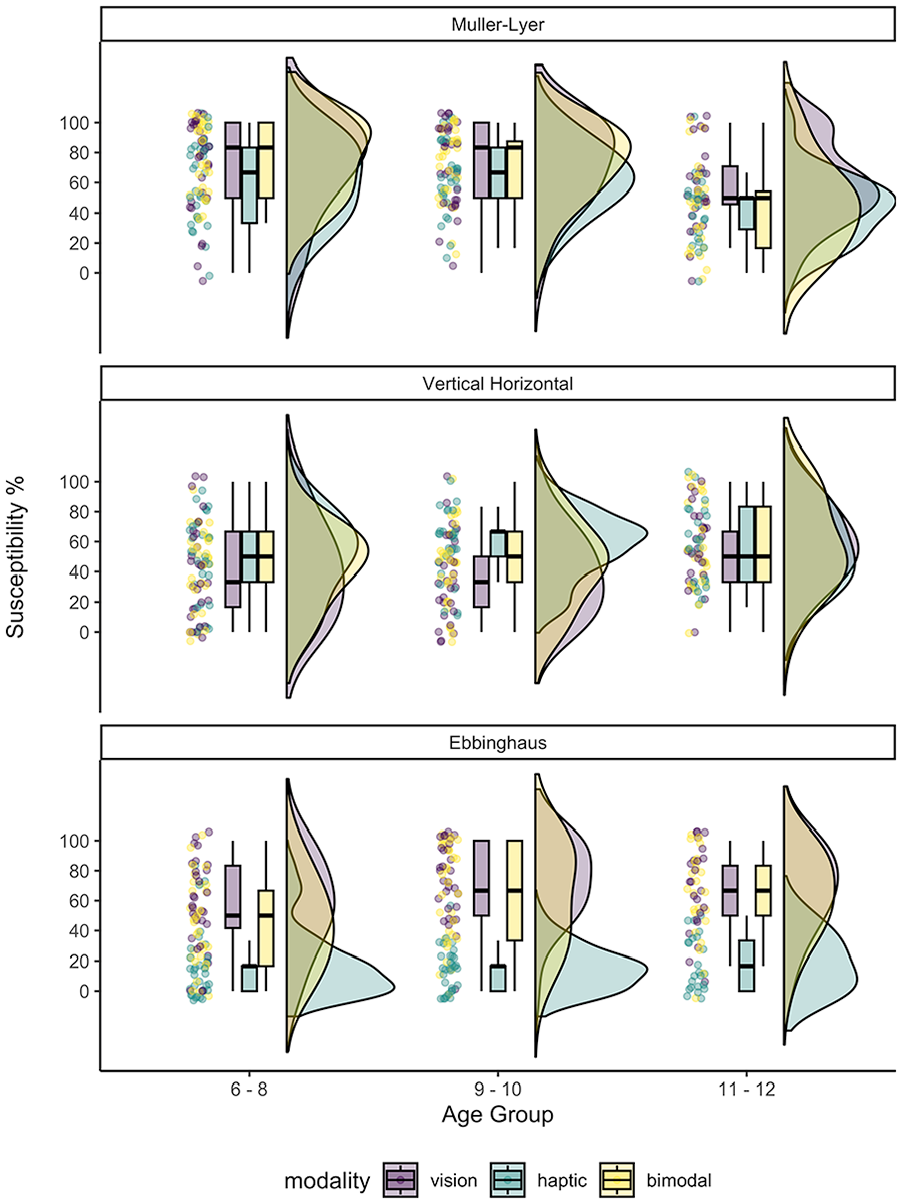
Modified raincloud plots (Allen et al., 2019) showing the percentage ‘susceptibility score’ (y-axis) to the three illusions for each age group (x-axis) and mode of exploration. Box and whiskers plots show susceptibility to each illusion (in panels) for each age group. Half-violin plots show the probability density of susceptibility for each modality. Individual participant points are also plotted.
Susceptibility to the Müller-Lyer illusion
For all age groups, the percentage susceptibility score to the illusion in the visual, haptic and bimodal conditions was above what would be expected by chance based on response choices (i.e. 33.3%, p < .05 for all ages; see Table S2). The ANOVA analysis yielded significant main effects of modality (F(2,156) = 8.037, p < .001, ηG2 = .040), and a main effect of age group (F(2,78) = 8.189, p < .001, ηG2 = .111). The modality by age group interaction (F(4,156) = 1.653, p = .174, ηG2 = .017) was not significant.
Compared to haptic perception (M = 55.89, SD = 25.44) paired t-tests showed that children were significantly more susceptible to the illusion in both the visual (M = 67.68, SD = 29.20) and bimodal conditions (M = 65.43, SD = 29.08): V > H, t(78) = 3.816, p = .0005, d = 0.468, 95% CI [0.16, 0.79]; VH > H, t(78) = 2.973, p = .010, d = 0.365, 95% CI [0.06, 0.67]; V = VH, t(78) = 0.842, p = 1.00, d = 0.103, 95% CI [0.19, 0.40]. The 6- to 8-year olds (M = 68.97, SD = 27.98) were more likely to experience the illusion than the oldest group, the 11- to 12-year olds (M = 48.61, SD = 27.37), t(78) = 3.612, p = .002, d = 0.77, 95% CI [0.23, 1.31] but were not more likely to experience the illusion more than the 9- to 10-year olds (M = 68.99, SD = 25.20), t(78) = 0.095, p = 1.00, d = .019, 95% CI [−0.48, 0.52]. In addition, the 9- to 10-year olds were more likely to experience the illusion than the 11 to 12-year olds, t(78) = 3.493, p = .002, d = 0.75, 95% CI [0.20, 1.30].
Susceptibility to the Vertical–Horizontal illusion
For all age groups, the percentage susceptibility score to the illusion across modalities was above chance (see Table S2). The ANOVA showed no significant main effect of age group, [F(2,80) = 2.442, p = .093, ηG2 = .025]. A significant main effect of modality [F(2,136) = 1.748, p = .006, ηG2 = .020] was found in which haptic exploration (M = 54.016, SD = 25.315) of the stimuli resulted in significantly greater susceptibility to the illusion compared to visual exploration (M = 44.177, SD = 29.613): t(82) = 3.229, p = .005, d = 0.343, 95% CI [0.07, 0.61]. There was no difference in susceptibility between vision and bimodal exploration (M = 49.197, SD = 27.901), t(82) = 1.68, p = .285, d = 0.179, 95% CI [0.08, 0.43], nor between haptic and bimodal exploration, t(82) = 1.55, p = .370, d = 0.165, 95% CI [0.09, 0.42].
The main effect of modality was qualified by a significant interaction between modality and age group, [F(4,160) = 2.650, p = .035, ηG2 = .020]. Post-hoc comparisons revealed significantly greater susceptibility to the haptic than visual illusion in the 9- to 10-year olds group only (see Figure 2 and Table S1). All other post-hoc comparisons in this interaction did not survive Bonferroni corrections.
Susceptibility to the Ebbinghaus illusion
For the Ebbinghaus illusion, all age groups were susceptible above chance level (see Table S2). The 3 (modality, within) × 3 (age group, between) mixed-model ANOVA yielded main effects of modality, [F(2,164) = 115.91, p < .0001, ηG2 = .406] and age group, [F(2, 82) = 3.34, p = .04, ηG2 = .040]. There was no evidence for a significant modality by age group interaction, [F(4,164) = 2.413, p = .051, ηG2 = .028].
Compared to haptic perception (M = 16.47, SD = 18.09), paired t-tests showed that children were significantly more susceptible to the illusion in the visual (M = 65.29, SD = 28.31) and bimodal modalities (M = 56.07, SD = 31.16); V > H, t(84) = 14.278, p < .0001, d = 1.88, 95% CI [1.41, 2.36]; B > H, t(84) = 11.719 p < .001, d = 1.55, 95% CI [1.11, 1.98]. There was no difference in susceptibility between the visual and bimodal conditions; V = VH, t(84) = 2.559, p = .006 (n.s. with Bonferroni correction), d = 0.34, 95% CI [0.01, 0.66]. Although susceptibility to this illusion appeared to increase with age, none of the pairwise post-hoc comparisons between age groups were significant.
Non-illusory responses to the illusory trials
Response errors that were not consistent with illusory responses occurred relatively rarely for most illusions and are reported under Table S3. For the illusory trials in which performance was accurate or veridical (i.e. no susceptibility to the illusion), no extreme outliers were detected. The percentage of accurate responses (i.e. veridical perception) made to the illusion trials by age group and modality are presented in Figure 3. The overall percentage of veridical perception to each illusion was: Müller-Lyer (M = 30.95, SD = 26.40), Vertical–Horizontal (M = 42.30, SD = 27.31), Ebbinghaus (M = 36.73, SD = 28.13).
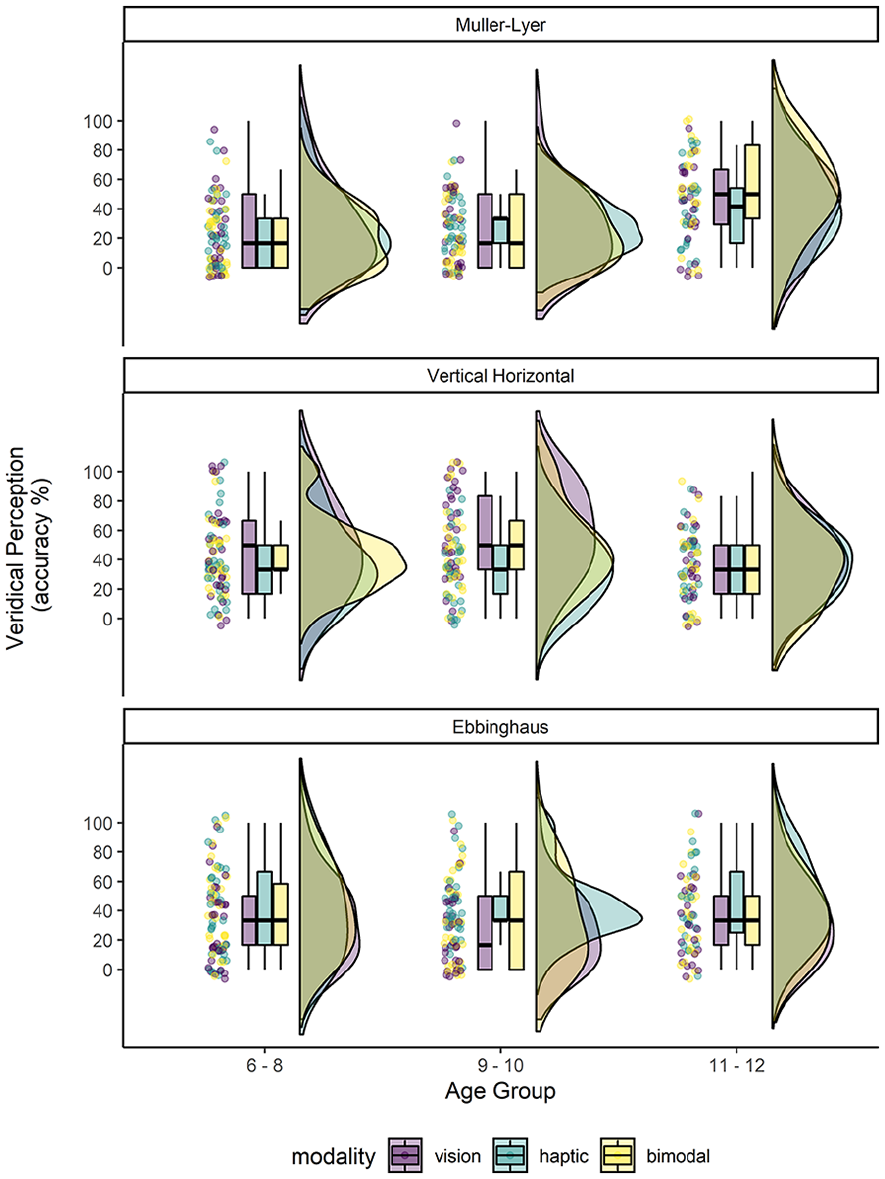
Raincloud plots showing the per cent accuracy performance (i.e. veridical perception) to the trials associated with each of the three illusions. Performance is shown for each of the three age groups.
For the Müller-Lyer illusion, only the accuracy performance of the older group was greater than expected by chance (33%) in all three modes of exploration. The 3 (Modality, Within) × 3 (Age Group, Between) mixed-model ANOVA yielded a main effect of age group only, F(2,78) = 11.05, p < .0001, ηG2 = .14. Compared to the youngest (M = 0.23, SD = 0.17) and mid-age children (M = 0.26, SD = 0.17), the oldest children (M = 0.46, SD = 0.22) were more accurate at perceiving linear equivalence in the illusory condition (11–12 years > 6–8 years, t(78) = 4.40, p < 0.001, d = 0.49, 95% CI [10.07, 35.31]; 11–12 > 9–10 years, t(78) = 3.78, p < .0001, d = 0.42, 95% CI [6.95, 32.40]). There was no difference in accuracy between the two younger groups, t(78) = 0.61, p = 1.000, d = 0.1, 95% CI [9.10, 15.13]. Neither the main effect of modality, F(2,78) = 0.14, p = .83, ηG2 = .0007, nor the modality by age group interaction, was significant, F(4,156) = 1.69, p = .16, ηG2 = .02.
Accurate performance on the Vertical–Horizontal illusion showed an interesting pattern. The 3 (Modality, Within) × 3 (Age Group, Between) mixed-model ANOVA yielded a main effect of modality, F(2,160) = 6.92, p = .001, ηG2 = .027: this main effect was qualified by a significant modality by age group interaction, F(4,160) = 2.47, p = .047, ηG2 = .02. The main effect of age group was not significant, F(2,80) = 1.13, p = .34, ηG2 = .02.
To investigate the interaction further, we examined the simple main effect of modality within age group. For the youngest and oldest children, paired t-tests (∝ = .016) showed no difference in accuracy by modality (ps ⩾ .19). The middle age children, however, were significantly more accurate at judging the vertical and horizontal lines as equivalent when using vision (M = 0.58, SD = 0.30) compared to haptics (M = 0.35, SD = 0.25), t(28) = 4.43, p = .0001, d = 0.82, although the advantage of vision over bimodal perception (M = 0.47, SD = 0.28) failed to survive post-hoc correction. It is important to note, however, that performance in both the visual and bimodal modalities significantly exceeded chance level (33%; ps ⩽ .016) although haptic performance was similar to chance. Finally, there was no difference in performance across the bimodal and haptic exploratory conditions, t(28) = 1.91, p = .067, d = 0.35 (see Figure 3).
For the Ebbinghaus illusion, the 3 (Modality, Within) × 3 (Age Group, Between) mixed-model ANOVA yielded a main effect of modality only, F(2,164) = 6.89, p = .001, ηG2 = .034. The main effect of age group, F(2,82) = 0.22, p = .802, ηG2 = .003, and the modality by age group interaction, F(4,164) = 0.65, p = .63, ηG2 = .007, failed to reach significance. Across all ages, children’s perception of the size of the central disc presented within the context of illusory trials (i.e. surrounded by annuli) was significantly more accurate using haptic exploration. Compared to vision alone (M = 0.30, SD = 0.26), children were more accurate using haptic (M = 0.43, SD = 0.28), t(84) = 3.36, p = .003, d = 0.37, 95% CI [3.49, 22.00], and bimodal perception (M = 0.37, SD = 0.29), t(84) = 2.53, p = .039, d = 0.28, [0.25, 13.48]. Furthermore, performance tended to be more accurate for haptic exploration alone than bimodal perception, although this trend did not reach statistical significance, t(84) = 1.64, p = .312, d = 0.18, 95% CI [2.86, 14.62]. Compared to vision and bimodal performance, only the accuracy performance to the haptic condition exceeded that expected by chance for the two older groups (ps ⩽ .014); for all other age groups performance was at, or significantly below, chance level (see Figure 3).
Performance to the control trials
The pattern of performance on all control trials 1 (same and different trials combined) was similar across age groups and stimulus type (i.e. horizontal lines, vertical lines and circles) as shown in Figure 4. At all ages, children’s ability to discriminate the stimuli was above chance level (33%). However, children were significantly more accurate using visual or bimodal perception than haptic exploration alone. The results from the 3 (Modality, Within) × 3 (Age Group, Between) mixed-model ANOVA and the repeated-measures follow-ups for each stimuli type by illusion are specified below.
Raincloud plots showing the per cent accuracy performance to the Horizontal (top), Vertical (middle) and Discs (bottom) control trials, shown for each age group and exploration modality.
Accuracy at discriminating linear extent for line stimuli presented along the horizontal axis differed by modality only, F(2,156) = 231.24, p = 2.188e-47, ηG2 = .60. Neither the main effect of age group, F(2,78) = 2.63, p = .079, ηG2 = .064 nor the modality by age group interaction was significant, F(4,156) = 0.61, p = .657, ηG2 = .008. Children were significantly more accurate at judging line length using visual (M = 0.91, SD = 0.13) or bimodal exploration (M = 0.90, SD = 0.11) compared to haptics alone (M = 0.58, SD = 0.16): V > H, t(81) = 17.16, p = 4.566e-28, d = 1.91, 95% CI [0.38, 0.29]; VH > H, t(81) = 16.69, p = 2.595e-27, d = 1.86, 95% CI [0.28, 0.37]). There was no difference in performance between visual and bimodal exploration, B = V t(81) = 0.95, p = 1.0, d = 0.10, 95% CI [0.04, 0.02].
Perceptual discrimination of linear extent for line stimuli positioned along the vertical (i.e. away from the body) axis also differed by modality only, F(2,126) = 78.99, p < .0001, ηG2 = .41. There was no effect of age group, F(2,63) = 2.11, p = .13, ηG2 = .029, nor an interaction between modality and age group, F(4,126) = 0.40, p = .748, ηG2 = .007. Similar to performance using horizontal lines, children were significantly more accurate at discriminating lines arranged vertically using visual (M = 0.93, SD = 0.10) or bimodal perception (M = 0.91, SD = 0.09) compared to haptics alone (M = 0.71, SD = 0.17): V > H, t(65) = 9.86, p < .0001, d = 1.22, 95% CI [0.16, 0.28]
Finally, accurate discrimination of the size of circular discs also differed by modality only, F(2,164) = 105.02, p < .0001, ηG2 = .399. Neither the main effect of age group, F(2,82) = 2.73, p = .071, ηG2 = .031 nor the modality by age group interaction was significant, F(4,164) = 1.56, p = .19, ηG2 = .019. Children were significantly more accurate at comparing the size of the discs using visual (M = 0.81, SD = 0.16) or bimodal exploration (M = 0.82, SD = 0.14) compared to haptics alone (M = 0.56, SD = 0.16; V > H, t(84) = 11.20, p = .001, d = 1.21, 95% CI [0.19, 0.30]; VH > H, t(84) = 14.01, p = .001, d = 1.51, 95% CI [0.22, 0.31]), and accuracy was equally high between visual and bimodal exploration, V = VH t(84) = 0.51, p = 1.00, d = 0.07, 95% CI [0.03, 0.06].
Discussion
The results of this experiment suggest that all children, irrespective of age, were susceptible to the Müller-Lyer, Vertical–Horizontal and Ebbinghaus spatial illusions following visual or bimodal exploration. Susceptibility to illusions in the visual domain in children is consistent with previous reports and here we extend this finding to the haptic domain: we found that all (sighted) children were susceptible to both the Müller-Lyer and Horizontal–Vertical illusions using touch only. Susceptibility following haptic exploration was lower than that for vision or bimodal exploration for the Müller-Lyer and Ebbinghaus illusions but greater than vision (but not bimodal) for the Vertical–Horizontal illusion. This result suggests some independence in spatial perception across the visual and haptic modalities. We tested this directly in the control trials, the results of which seem to partially bear this out: spatial discrimination performance was significantly more accurate for all age groups when the visual modality was involved than in the haptic-only condition across all ages. Thus, illusions which showed greater susceptibility to touch than vision may be caused by larger errors in the sensory estimate. This may be due to the inherent differences in stimulus encoding across vision (parallel) and touch (sequential). However, closer inspection of the modality effect on illusion susceptibility also revealed illusion-specific effects. For example, responses to the Ebbinghaus illusion trials suggested that children were not susceptible to this illusion (see e.g. Doherty et al., 2010). This was particularly so following haptic-only exploration in which children’s errors were inconsistent with an illusory response. Specifically, children were likely to respond that the central disc was ‘larger’ when surrounded by relatively larger than smaller discs (see Table S2). This may reflect either an erroneous semantic association (large with large) or an inability to parse the object features. We were careful to instruct the children to focus on the central stimulus during encoding, which was easily distinguishable in colour and texture, and all children were able to clearly explain the instructions of the task following the experiment. We therefore believe it unlikely that children made an error of association. Instead, as we discuss in more detail later, parsing out the central stimulus from the rest of the items in the array may have been difficult for children to achieve, possibly due to limitations in sensorimotor integration (Kalagher & Jones, 2011a; von Hofsten & Rösblad, 1988), local to global processing (Nayar et al. 2015) or other cognitive processes such as working memory (e.g. Gathercole et al., 2004) which change during development.
The result that children aged between 9 and 10 years old were more prone to the Vertical–Horizontal illusion following haptic than visual exploration was a curious finding, especially since other age groups showed no such distinction in their performance. Moreover, visual performance in both the vertical and horizontal control trials was better than haptic performance for all age groups, suggesting that neither cross-modal differences nor a developmental transition in the encoding of sensory information, explain this finding. It may be a cohort effect, such that practice with horizontal and vertical spatial dimensions (e.g. formal learning of geometry which is introduced around this age, see e.g. Gori et al., 2024) affects the strength of the visual illusion but preserves the illusion in haptics. Moreover, due to the rapid growth of the body, particularly hand size, with development (see Cowie et al., 2022) a benefit from the integration of spatial information across the senses may not yet be evident in this age group (Gori et al., 2008). The accuracy rates in the bimodal condition are consistent with the suggestion of visual dominance without interference from haptic exploration on performance. It is important to note, however, that this age-specific finding has not been previously reported in other studies of spatial perception in children, therefore we are cautious not to overstate any interpretation without replication or further evidence.
Taken together, the results of this experiment suggest that, at least for illusions of spatial extent if not in size, sighted children are susceptible to both visual and haptic versions. The difference in susceptibility across modalities to the Ebbinghaus illusion may be due to specific processing of object features presented in close spatial proximity or object size in haptics (see e.g. Gori, Giuliana, et al., 2012) which merits further investigation. However, spatial discrimination performance to non-illusory control conditions was less accurate following haptic exploration for both extent as well as size indicating modality differences in spatial estimation across all age groups.
It is important to note that haptic exploration differed across the illusory and control trials for the Vertical–Horizontal illusion in particular and this may have had some effect on the results. Specifically, we adapted a parallel exploration in the control task to be consistent with the other tasks as well as being easier for the children to perform, but such exploration was not compatible for the stimulus arrangement in the Vertical–Horizontal illusion which required sequential exploration. We did not formally assess the influence on performance across serial and parallel exploration of the control stimuli, therefore it remains possible that the mode of exploration plays a role (Heller et al., 1997). Despite this limitation, the children’s performance in the visual and tactile control tasks suggests that susceptibility to the Vertical–Horizontal illusion is not explained by spatial discrimination alone, in either modality.
Experiment 2
The results of Experiment 1 do not allow us to tease apart the role of vision on susceptibility in haptics. For example, it is possible that vision calibrates spatial precision in touch during development (e.g. Gori, Giuliana et al., 2012) and therefore haptic perception may stem from inferences arising from prior visual experience. On the other hand, even if sensory encoding using haptics is not affected by visual learning, it is possible that later perceptual decisions are biased by prior knowledge from the visual domain. In either case, we would expect that susceptibility in the visual domain would influence susceptibility to information perceived using active touch.
The following experiment was conducted to address the specific question of whether visuospatial experience during development biases the perception of spatial information using haptics alone. To that end, we tested susceptibility to illusions using touch in blind children. If visual experience with spatial information were necessary to experience spatial illusions in touch then we predicted that blind children would not be susceptible to these illusions.
We tested children’s performance to the Müller-Lyer and Horizontal–Vertical illusions only and made the decision not to include the Ebbinghaus illusion. This was partly due to practical reasons, in that the children’s availability was limited therefore we needed to restrict the duration of testing to one session only. However, the results from Experiment 1, in which children were unable to perceive the central disc using haptics, mainly informed this decision.
Methods
Participants
Seventeen congenitally blind children, clinically categorised as having severe visual impairments or low vision, participated in this experiment (Mage = 10.48 years, SD = 2.85 years, range: 6–14 years). The details of these impairments are provided in Table 2. All children were mainstream educated in local schools. Children were recruited from the Chiossone Institute in Genoa, Italy which provides specialist services and support to blind children. The experiment was approved by the School of Psychology Research Ethics Committee at Trinity College Dublin, and conformed with relevant data protection legislation within the EU (GDPR). All children’s parents or guardians provided written informed consent prior to the experiment.
Characteristics of the blind children recruited for Experiment 2 including their specific visual impairments. The table includes information on whether each child could perceive contours, had learned to read Braille, normally wore spectacles and their education level at school (according to the Italian education system).
Note. LP = light perception; HS = high school.
Untreated.
Apparatus, design and procedure
The same materials and apparatus described in Experiment 1 were again used here, and the same researcher was involved in testing to ensure that the protocols were consistent across experiments. We used a within-subjects design to examine susceptibility to Müller-Lyer, and Vertical–Horizontal illusions in the haptic modality only. The procedure for the experiment was the same as Experiment 1, including control trials (with the exception that performance on the Ebbinghaus illusion was not tested).
Results
As in Experiment 1, we calculated each participant’s percentage susceptibility score by dividing the number of error responses that were consistent with the illusion by the total number of illusory trials for each illusion. The results are presented in Figure 5. Extreme outliers were defined as values that were above or below three times the interquartile range. The outlier detection protocol for the dependent variable (illusion susceptibility score) identified no extreme outliers for either illusion. The percentage of accurate (or veridical) responses in which no illusion was experienced to the trials which tested the illusion was also calculated. Although two extreme outliers were identified for the accurate responses to the Vertical–Horizontal illusion condition, there was no difference in the results with and without the outliers therefore data analysis are reported with these outliers included. An analysis of the performance of the control trials was also conducted. Tests of normality (Shapiro-Wilk) suggested that the data on susceptibility to the illusions and accuracy in the control trials did not violate assumptions of normality (see Tables S4 and S7).
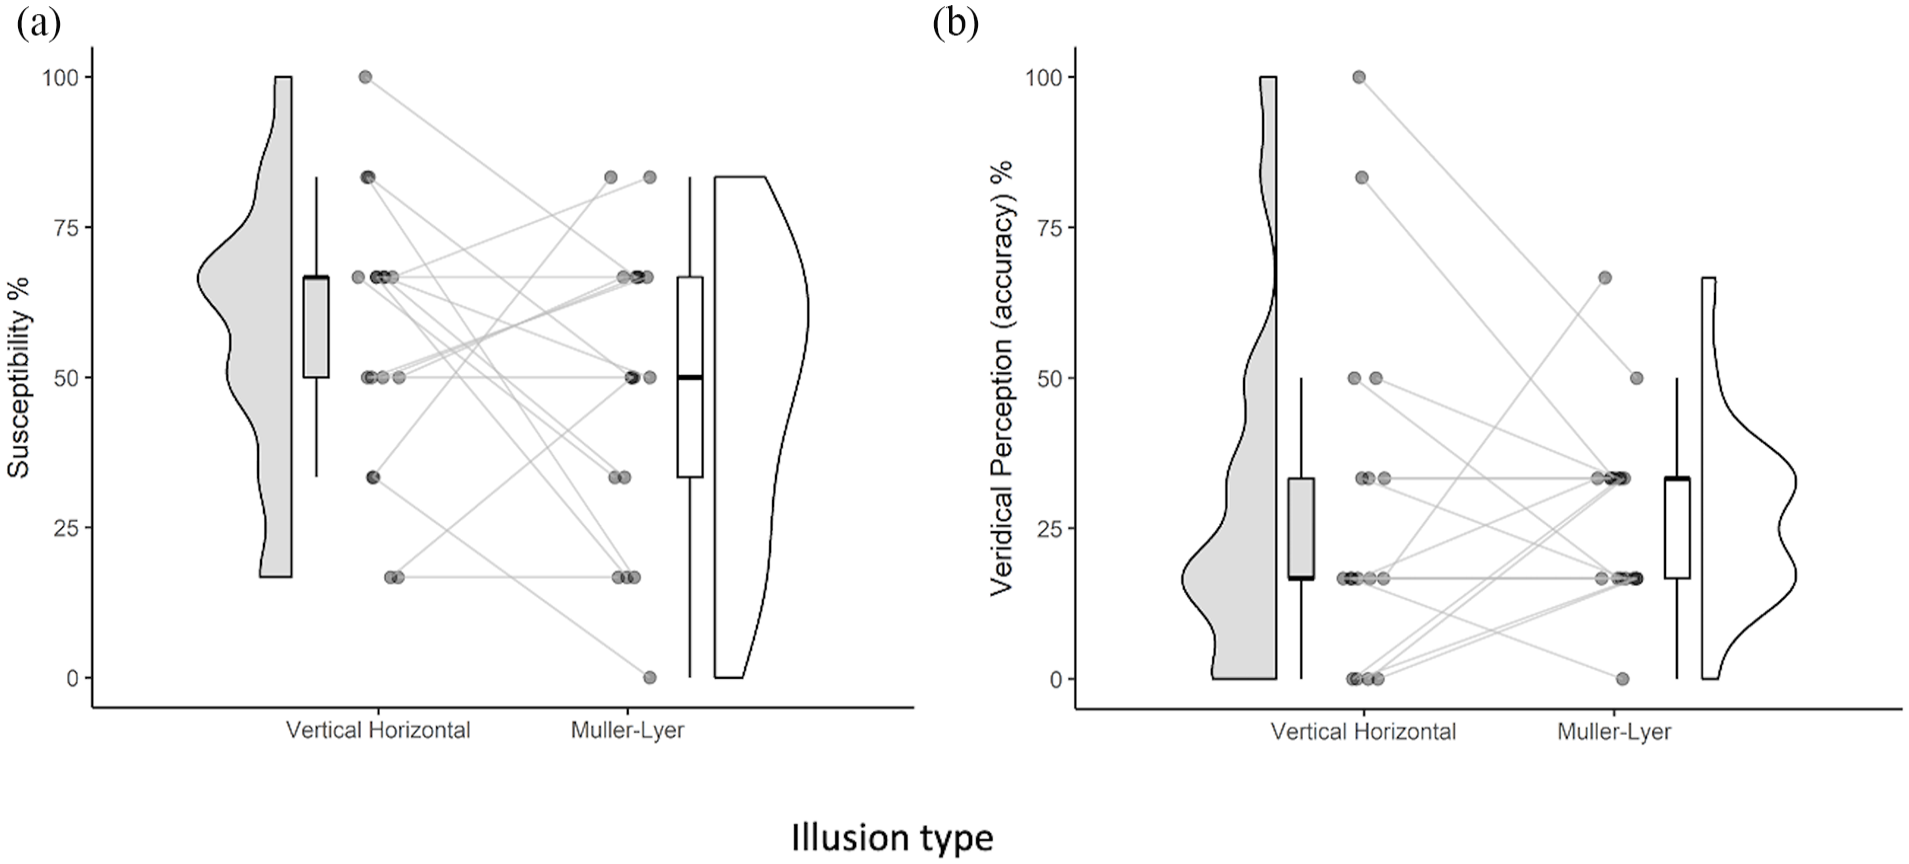
(a) Plot showing the percentage of illusion responses for the Vertical–Horizontal and Müller-Lyer illusions, respectively. Individual participant points are plotted with connecting lines to show their performance across illusions. (b) Percentage of trials to each illusion in which an accurate response was provided (indicating veridical perception).
Susceptibility to the Müller-Lyer and Vertical–Horizontal illusions
Our analyses suggested that blind children were susceptible to both illusions greater than predicted by chance (33.3%) as shown in Figure 5a and Table S2. For the Müller-Lyer illusion, the children’s responses to the illusory trials indicated more errors consistent with susceptibility occurred (M = 56.86, SD = 22.87) than accurate responses (M = 27.45, SD = 15.23) which, in turn, were not greater than expected by chance (see Figure 5b). The children also occasionally made incorrect, non-illusory responses to the illusory trials (M = 15.69, SD = 13.78) although this occurred at a rate below that expected by chance.
For the Vertical–Horizontal illusion, more error responses indicating susceptibility to the illusion occurred to illusory trials (M = 48.04, SD = 24.92), than accurate responses (M = 28.43, SD = 28.72) (see Figure 5b), or other error responses not consistent with the illusion (M = 23.53, SD = 24.34). Furthermore, neither the percentage of accurate responses, nor error responses inconsistent with the illusion, were greater than chance performance.
Susceptibility rates did not differ between the two illusions, F(1,16) = 1.309, p = .269, ηG2= .04 as shown in Figure 5a (see also Table S7). As already stated accurate responses (i.e. veridical perception) to the two illusions occurred infrequently with no difference across illusions F(1,16) = 0.021, p = .887, ηG2= .0005. The number of non-illusion type errors was also low and did not differ across illusions, F(1,16) = 1.154, p = .299, ηG2 = .04.
Performance to the control trials
Accurate responses made by the blind children to the control trials are shown in Figure 6. Haptic discrimination of spatial length for line stimuli aligned vertically across all (i.e. same and different) control trials was high (M = 0.71, SD = 0.20) and was significantly higher than their performance to the same task but with stimuli aligned horizontally (M = 0.58, SD = 0.18) (F(1,16) = 5.110, p = .038, ηG2 = .116). Overall accuracy to each of these stimulus alignments was greater than that expected by chance (33%).
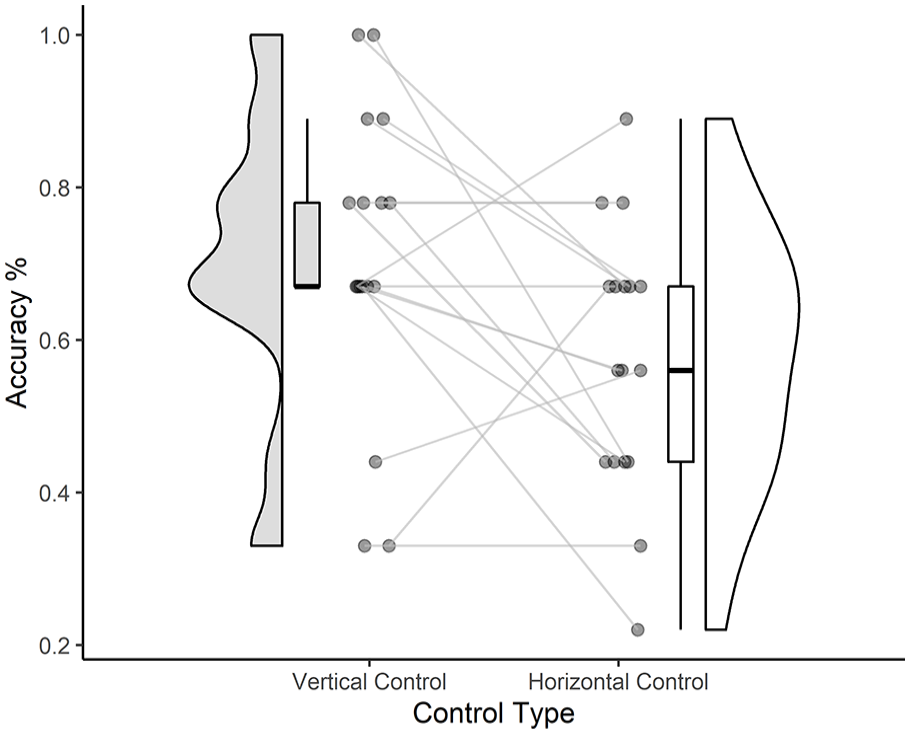
Raincloud plots show children’s accuracy performance in the Vertical (left) and Horizontal (right) control trials. Individual participant points are plotted with connecting lines to show their performance across illusions.
Discussion
The results of this experiment suggest that congenitally blind children, of different ages, are susceptible to spatial illusions of extent, namely the Müller-Lyer and Vertical–Horizontal illusions. These results align with the performance of sighted children in the haptic-only condition in the previous experiment. Furthermore, they are also consistent with previous reports of susceptibility to haptic illusions in blind adults (e.g. Bean, 1938; Casla, 1999; Gentaz & Hatwell, 1998; Heller & Joyner, 1993; Heller et al., 2002). The finding that blind children are susceptible to illusions through touch, offers strong support for causal mechanisms that arise early in development. Furthermore, the results suggest that these mechanisms may not depend on visual experience. Although most blind children who took part in our study had light perception and some ability to see contours (see Table 2), we also observed that children who were totally blind (i.e. without light perception or ability to see contours) were also susceptible to the illusions.
Interestingly, spatial discrimination appeared to be easier for stimuli that were aligned in the vertical position (i.e. away from the body) than in the horizontal position (across the body). Although we cannot formally compare performance differences to these conditions with the sighted children due to cohort differences beyond visual ability alone, the results shown in Figure 4 suggest a consistent benefit on performance in the vertical control condition across both sighted and blind children.
General discussion
We first investigated whether sighted children aged between 6 and 12 years are susceptible to spatial illusions when presented in either the visual or haptic modalities and, if so, whether susceptibility was influenced by age. We also investigated if illusion strength differed with bimodal exploration relative to either unimodal exploration in any age group. Finally, we tested whether congenitally blind children were also susceptible to illusions through touch.
Our results reveal two main findings. First, sighted children were susceptible to the Müller-Lyer, Vertical–Horizontal and Ebbinghaus visual illusions in a manner similar to that previously reported in adults. Furthermore, sighted children were also susceptible to spatial illusions using touch only. Indeed, the haptic and visual illusions were experienced even in the youngest children, a finding that is consistent with evidence for the early emergence of illusory experiences across modalities (see e.g. Gentaz & Streri, 2004). Bimodal presentation did not influence the rate of illusion susceptibility relative to vision in any age group. The second main and, to the best of our knowledge, novel finding is that congenitally blind children were also susceptible to haptic versions of the Müller-Lyer and Vertical–Horizontal illusions. Moreover, the prevalence of tactile illusory experiences in blind children was comparable to that of sighted children (see Table S2).
For sighted children, illusion strength was lower following haptic-only than visual-only exploration in the Müller-Lyer illusion, either similar or stronger (for one age group at least) in the Vertical–Horizontal illusion, and in a direction opposite to that expected in the Ebbinghaus illusion. Previous studies of illusions in adults reported similar levels of susceptibility across vision and touch (e.g. Révész, 1934 and von Békésy, 1967), particularly the Müller-Lyer and Horizontal–Vertical illusions (Fry 1975). Our results suggest that susceptibility to the Müller-Lyer decreases with age, consistent with previous reports (e.g. Binet, 1895; Pinter & Anderson, 1916; Wapner & Werner, 1957) whereas susceptibility to the Ebbinghaus illusion increased with age (Weintraub, 1979), although this effect was weak. In contrast, we found no evidence for an effect of age in the visual or haptic versions of the Hortizontal-Vertical illusions.
Our findings support a qualitative distinction in susceptibility to the Ebbinghaus illusion across modalities. The visual illusion was in the direction expected and increased in strength with age, possibly due to the emergence of higher-level perceptual abilities with development, such as contextual integration (Káldy & Kovács, 2003; Kerzerho et al., 2008; Kovács, 2000) or constancy scaling (Gregory, 1963). However, the opposite effect appeared to occur in haptics, with (sighted) children consistently choosing the ‘larger’ stimulus based on the overall tactile stimulus array (see Fry, 1975 for a similar finding). The specific way in which the children explored the Ebbinghaus stimuli using their hands may have had an influence on this outcome, although our use of distinct textures for the central and contextual discs should have helped distinguish the two. Children’s inability to perceive spatial features relative to non-spatial features using touch may explain this finding (see e.g. Overvliet et al., 2024). For example, young children are more likely to learn haptic object information in an analytic manner by focussing on one specific feature, such as overall size, and fail to perceive the more holistic pattern based on combinations of features such as size and texture (Schwarzer et al., 1999). Some influence of higher-level processing or task demands on this finding can also not be ruled out. For example, Zanuttini (1996) previously reported that the illusion is weakened in children by rendering the contextual discs semantically distinct from the target.
In addition to the illusions, we tested children’s ability to discriminate spatial information in vision (sighted children only) and touch (sighted and blind children). Haptic performance was good across all three age groups of sighted children as well as blind children, although sighted children’s ability to discriminate spatial information was more accurate in the visual-only and bimodal versions of the task than the haptic-only version. Furthermore, for both the sighted and blind children, we found a bias in their haptic performance with evidence for greater accuracy in discriminating line length when stimuli were presented in a vertical (away from the body) than horizontal (across the body) position. No such position bias was found in the visual or bimodal conditions to the same stimulus arrangements. Previous studies have suggested that perceptual bias in children’s spatial perception in touch may be due to developmental differences in proprioception or motor control (e.g. Bremner et al., 2013; King et al., 2010) or to young children’s inability to dissociate a body reference from hand position during haptic encoding (Cheng, 1968; Cuturi & Gori, 2019; Luyat et al., 2001; Millar & al Attar, 2002). Others have attributed this distinction to cognitive factors such as task set (Fraisse & Vautrey, 1956), or haptic memory capacity (Millar, 1974). We found no effect of age on this performance suggesting that improvement in cognitive or perceptual processes with development does not account for the bias. Instead, the manner in which the hand moves to estimate spatial information may affect performance. For example, radial or tangential exploration with the hand has been found to differentially affect perceived length in both non-illusory (Cheng, 1968) and illusory contexts (e.g. Day & Wong, 1971; Wong, 1977; Heller et al., 1997). Moreover, other types of tactile exploration, such as active and passive touch, can affect susceptibility to spatial illusions in the haptic domain (Fry, 1975) with active tactile exploration leading to similar levels of susceptibility to vision in the Müller-Lyer and Horizontal–Vertical illusions in blindfolded, sighted adults (von Békésy, 1967; Fry, 1975; Révész, 1934; Rudel & Teuber, 1963). Thus, it is possible that specific sensorimotor factors during haptic exploration has an influence on some spatial illusions.
The performance of congenitally blind children can help provide further insight into the role of visual experience on illusion susceptibility. First, evidence of blind children’s susceptibility to illusions explored through touch seems consistent with reports of immediate visual susceptibility to these same illusions following sight restoration (Gandhi et al., 2015). Our findings, along with those of Gandhi et al. (2015), therefore add further support for the proposal of innate mechanisms related to size constancy (Andres et al., 2017; Sperandio, 2021). Alternatively, it could be argued that any visual experience, including low levels of light perception due to cataracts, may be sufficient to influence illusions. For example, Lin et al. (2023), reported that children with congenital visual impairments (due to cataracts, corneal leukoplakia or amblyopia) experienced the Müller-Lyer illusion presented visually under conditions that allowed the children to view the stimuli. Moreover, the illusion appeared to be stronger in visually impaired children who did not depend on ‘low visual aids’ in their everyday interactions. Consistent with this finding, Andres et al. (2017) reported visual size constancy in newly sighted children (following cataract removal) and attributed their finding to the possibility that low levels of, albeit imprecise, visual experience prior to sight restoration may have been sufficient to stimulate and maintain the visual processes underpinning size constancy (e.g. as the authors point out, near objects will still appear larger even if blurred). Given these results, the finding that children with cataract reversals are susceptible to visuospatial illusions (e.g. Gandhi et al., 2015) may not be that surprising if residual visual experience during early development is sufficient to drive the illusory experience. Future work in which an assessment of susceptibility is conducted before, as well as after, sight restoration in cataract patients would help disambiguate the contribution of residual vision.
The congenitally blind children tested in our study experienced a wide range of severe visual impairments, with some capable of perceiving contours whereas others experienced neither light perception nor an ability to perceive contours. Indeed, four children in our study were characterised as totally blind (see Table 2). That these blind children experienced the Müller-Lyer and Horizontal illusions through touch without visual perception suggests a representation of spatial extent that may be primarily driven by innate mechanisms which are subsequently refined by visual experience. Several studies have provided evidence for the early emergence of spatial selectivity in visual cortex, even in utero (Arcaro & Livingston, 2017) suggesting that this organisation may provide a scaffold or ‘protomap’ for spatial coding in visual and even other cortical regions (e.g. Groen et al., 2022; Burton, 2003) including touch (Sadato et al., 1996; Zangaladze et al., 1999). Indeed, retinotopic organisation of the visual system may develop in the absence of visual experience (Bock et al., 2015; Striem-Amit et al. 2015; van den Hurk et al., 2017) although visual experience is required to refine this organisation (Heitmann et al., 2023). . The organisation of early visual processes may, in some contexts, also drive illusory experiences. For example, neurophysiological studies have revealed that the ‘oblique effect’ occurs due to both structural and functional processes including the relative under-representation of neurons tuned to oblique relative to horizontal (particularly) or vertical orientations and the overall sharper tuning of neurons to cardinal orientations (Li et al., 2003; Yacoub et al., 2008). Other recent evidence reported by Chen et al. (2022) also supports the idea that spatial illusions may be due to innate or ‘hard wired’ processes mediated by the visual system: they conducted a large-scale twin study in which susceptibility to the Ebbinghaus illusion was measured and found that genetics accounted for over 50% of the variance in the strength of the illusion. Interestingly they noted that illusion-driven activations in the primary visual cortex were more related to genetic factors than activations in later visual regions of the brain, such as the temporal cortex, which were related more to experience-dependent learning from the environment. Thus, these findings sugggest a common mechanism may support the origins of illusion susceptibility in both vision and touch.
Although the initial development of the visual system may be mainly genetically determined, early visual experience is necessary to refine the functionality of occipital regions of the brain (e.g. Jiang et al., 2009; Ptito et al., 2008). Thus, visual sensitivity may be poor (Held et al., 2011) and fail to fully recover following sight restoration (Hölig et al., 2023; Vogelsang et al., 2025; see also Mitchell & Maurer, 2022). Importantly, visual deprivation during the early stages of development has been shown to incur a long-term cost on precise spatial processing in other modalities (e.g. Bollini et al., 2023; Bruns et al. 2022; Gori et al., 2014; Pasqualotto et al., 2007; Senna et al., 2022; Vercillo et al., 2016). Structural and functional differences between blind and sighted either at the subcortical level (Bridge et al., 2009) or in occipital cortical regions (e.g. Hawellek et al., 2013) may mediate these long-term effects on spatial precision in vision (for a review see Fine & Park, 2018) and consequently beyond vision.
Although our findings argue for common, innate mechanisms underpinning some spatial illusions, we do not claim that this is the case for all illusory experiences involving vision and touch. For tasks in which spatial information is limited to one dimension (e.g. linear extent or rotation) then differences across modalities may be less evident (Klatzky et al., 1995) than when more complex spatial information is processed (Ernst et al., 2007; Tabrik et al. 2021). It is clear, for example, that susceptibility to some multisensory illusions seems to depend on visual experience. The size-weight illusion, for example, is not found in children blind from birth (tested haptically), or in children with cataract reversal within 6 months post-surgery (Piller et al., 2023) although, interestingly, by adulthood the strength of the illusion is similar across sighted individuals and cataract reversal patients (Pant et al., 2021). The relative developmental delay in the experience of the size–weight illusion, and others that depend on cross-modal interactions (e.g. Bouba-Kiki effect, Piller et al., 2023; rubber arm illusion, Cowie et al., 2013, 2016) may not be due solely to the acquisition of visual knowledge (i.e. memory), but instead may reflect the role of vision on either the refinement of haptic exploratory procedures with development (Cao et al. 2024; Gori, Squeri, et al., 2012; Kalagher & Jones, 2011b) or the emergence of optimal multisensory integration (Gori et al., 2008; Jovanovic & Drewing, 2014; Rohlf et al., 2020; Senna et al., 2021). For example, Fryer et al. (2014) reported greater susceptibility to the ‘Bouba-Kiki’ effect (presented haptically) in sighted than blind adults, and blind adults who had some residual vision also appeared to be susceptible in contrast to those without visual experience. Furthermore, other more cognitive factors such as attention and working memory may affect task acquisition in children including in the haptic domain (Millar, 1974). Disentangling these influences is challenging although doing so would reveal the crucial role sensory systems play in maintaining optimal brain function in early development and across the lifespan.
In summary, we report evidence that both sighted and congenitally blind children, from as young as 6 years of age, are susceptible to the Müller-Lyer and Vertical–Horizontal illusions encoded through touch. Sighted children are more susceptible to these illusions and the Ebbinghaus illusion based on sight alone than when felt, and susceptibility rates were not affected by bimodal exploration. Our findings are surprising, especially in the context of recent studies suggesting that visual-spatial illusions are found immediately following cataract reversal in children: our results suggest the possibility that susceptibility to spatial illusions is already present in the tactile modality prior to any intervention to restore sight. Our results also raise important questions around the nature of the innate mechanisms underpinning spatial perception across modalities and the distinct role of visual experience, even imprecise vision, on the phenomenological experience of the spatial world.
Supplemental Material
sj-pdf-1-qjp-10.1177_17470218251336082 – Supplemental material for Susceptibility to spatial illusions does not depend on visual experience: Evidence from sighted and blind children
Supplemental material, sj-pdf-1-qjp-10.1177_17470218251336082 for Susceptibility to spatial illusions does not depend on visual experience: Evidence from sighted and blind children by Sarah M Cooney, Corinne A Holmes, Giulia Cappagli, Elena Cocchi, Monica Gori and Fiona N Newell in Quarterly Journal of Experimental Psychology
Footnotes
Acknowledgements
Our special thanks go to the co-operation of the ‘Catholic University School’ and ‘Loretto College St Stephen’s Green’ schools in Dublin with participant recruitment. We also thank Paula Dempsey and Elio Gobbo Newell for their help with recruitment and data collection for Experiment 1, and to our colleagues in the ‘Istituto D. Chiossone’ for their help with data collection for Experiment 2.
Declaration of conflicting interests
The author(s) declared no potential conflicts of interest with respect to the research, authorship, and/or publication of this article.
Funding
The author(s) disclosed receipt of the following financial support for the research, authorship, and/or publication of this article: This project received funding from the European Union’s Horizon 2020 Research and Innovation program under Grant Agreement number 732391 and the Irish Research Council Advanced Laureate Award under grant number IRCLA/2023/1509 awarded to Fiona Newell.
Notes
References
Supplementary Material
Please find the following supplemental material available below.
For Open Access articles published under a Creative Commons License, all supplemental material carries the same license as the article it is associated with.
For non-Open Access articles published, all supplemental material carries a non-exclusive license, and permission requests for re-use of supplemental material or any part of supplemental material shall be sent directly to the copyright owner as specified in the copyright notice associated with the article.