
Abstract
Our cognitive processing is flexible and affected by global/local dominance in prior cognitive tasks. Similar to cognitive processing, perceptual processing, especially colour perception related to global/local processing, may be affected by prior global/local dominance; however, this possibility has not yet been assessed. Here, we examined whether prior tasks involving global/local processing influenced colour perception related to global/local processing. As colour perception is related to global/local processing, we focused on perceived colour transparency, in which a transparent layer is perceived in front of a background layer, even though these stimuli are physically in the same layer. When viewing the colour transparency stimulus, we expected that the perceived colour of a specific region, when focusing on only the local region, would differ from that when focusing on the whole image. In our study, the participants completed a global or local Navon task, followed by a colour-matching task that assessed how they saw colours using colour transparency stimuli. The degree of optical illusion (i.e., perceived colour transparency) after the global Navon task was greater than that after the local Navon task. Thus, prior global/local processing, a flexible mode of cognitive processing, influenced colour perception. This study provides new insight into perceptual flexibility, especially in colour perception.
Introduction
How do we perceive this complex world, which consists of multiple components? Numerous psychological studies have reported that two types of perceptual processing contribute to this perception: global and local processing (Kimchi, 1992). When primarily global processing is involved, we perceive objects with multiple components as wholes. When local processing is dominant, we mainly focus on one component object. In principle, we perceive objects using global processing, which is known as the global precedence effect (Bouvet et al., 2011; Navon, 1977, 1981), and we occasionally perceive objects using local processing. The same presented scene is perceived differently depending on which style of processing is dominant (Masuda & Nisbett, 2001). Therefore, to investigate how humans perceive the complex world, it is important to clarify the influence of global/local dominance on our perception. Notably, while global processing is the dominant style among people in general, local processing is dominant among people with autism spectrum disorder, which induces differences in the way people perceive the world (Frith & Happé, 1994; Happé & Frith, 2006). Accordingly, it is important to explore how global/local processing affects our perception to understand our various behaviours.
Previous studies reported that a prior task involving global or local processing affects the performance of the following task that relates to global/local processing despite the tasks being unrelated. In Macrae and Lewis’ study (Macrae & Lewis, 2002), the participants first watched a bank robbery video. Subsequently, they engaged in a global Navon, a local Navon, or a control task. In the Navon task, participants were asked to read the large letter or small letters in a Navon figure. A Navon figure contains a larger recognisable shape, such as a letter, made up of copies of a smaller, different shape, such as small letters (Figure 1). The large and small letters are incongruent. After the Navon task, the participants were shown faces, including the robbers, and then were asked to identify the robbers’ faces. The accuracy on the facial memory task after the global Navon task was greater than that after the local Navon task. Accurate face recognition demands global processing (Leder & Bruce, 2000). This result suggested that global Navon tasks enhance global processing; in their study, this enhancement carried over into the facial memory task, boosting performance. The effects of prior global/local processing on subsequent cognitive tasks have been reported in terms of several domains, such as facial memory performance (Hine & Itoh, 2014; Lewis et al., 2009), creative thinking (Friedman & Förster, 2005), and social behaviour (Mukherjee et al., 2018).
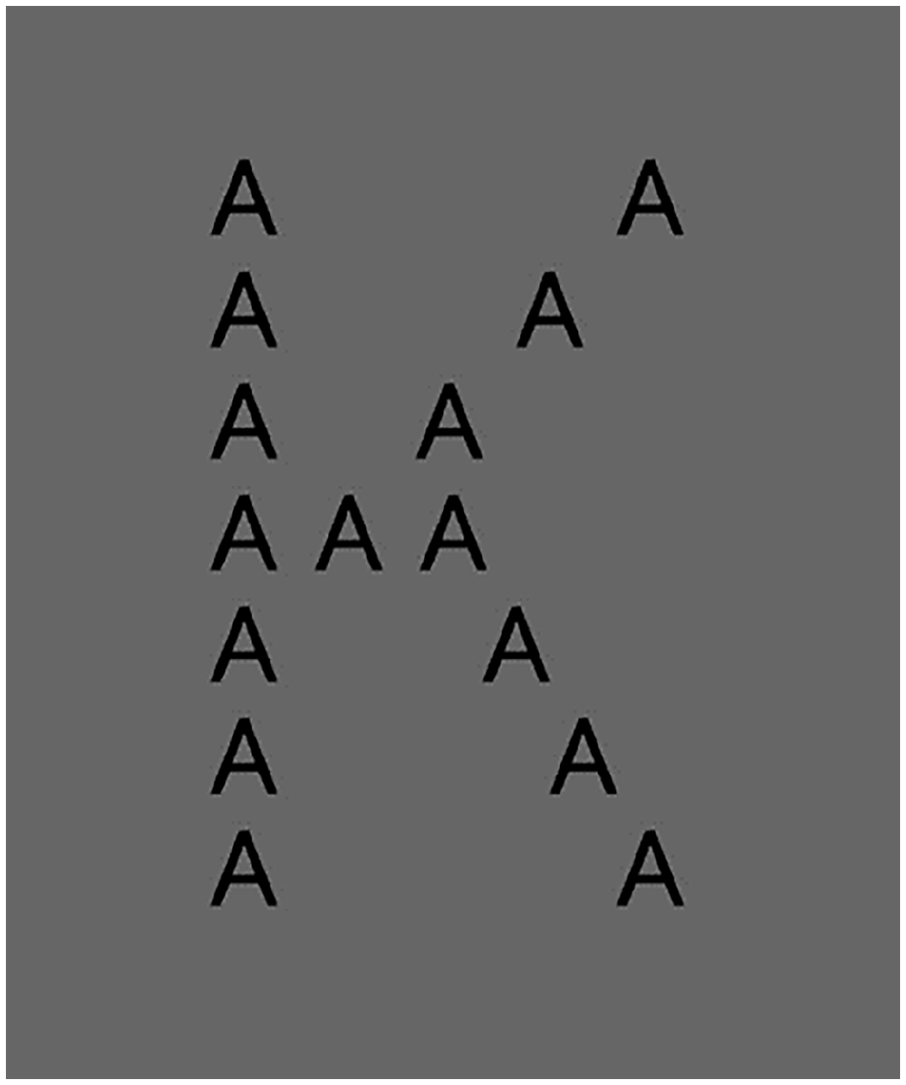
An example of a Navon figure. A “K” composed of smaller “As.” When seen globally, we read it as “K.” When seen locally, we read it as many “As..”
In addition to these cognitive tasks, visual perception, such as length perception, is reportedly affected by prior global/local processing. In Mundy’s (2014) study, the participants performed a global Navon, local Navon, or control task. After completing the Navon or control task, they performed a Müller–Lyer illusion task. In the Müller–Lyer illusion, the perceived distance between two points is elongated or contracted depending on the surrounding distractors. The effect of distractors on the Müller–Lyer illusion was greater after the global Navon task than after the local Navon task. A previous study reported that global processing bias is one of the causes of the Müller–Lyer illusion (Day, 1988). When people see one line, they focus on the line. This is local processing. When people see one line with surrounding distractors, they perceive one object, including distractors, and this interrupt focuses only on the line. This is global processing. Based on this theory, after the global Navon task, because of the carry-over effect from the Navon task, the participants found it difficult to ignore the surrounding distractors, and the distractors had a greater effect on the evaluation than after the local Navon task. This result suggested that visual perception involving involuntary processing, which does not demand complex cognitive processing, could be affected by prior global/local processing. In Munday’s study, the range of responses for the length of the Müller–Lyer figure was greater after large letters were read in the Navon figure (the range of adjustment error was approximately −15 to +14 pixels) than after small letters were read (the range of adjustment error was approximately −10 to +7 pixels). In other words, the candidates of their responses might be larger after reading large letters than after reading small letters. In such cases, response bias, rather than perception bias (facilitating the ignoring of distractors), may occur due to the prior Navon task. In his study, both the manipulated aspects of the Navon task (size) and the required responses (length) were related to the dimensions involving size relationship. To exclude the possibility of response bias, it was necessary to assess performance in a perceptual task that did not require a response related to dimensions involving size relationship.
Colour perception, which involves involuntary processing, may also be modulated by the surrounding colour in a way that is similar to the modulation of length perception. Perceived colour transparency is context-dependent colour perception, in which a transparent layer is perceived in front of a background layer, even though these stimuli are physically in the same layer (Metelli, 1985). For example, in Figure 2a, a transparent patch of green is perceived as overlapping red and blue patches. As a result, the colours in the overlapping regions are perceived as red or blue. One of the reasons for this phenomenon is that perceiving translucent green on top of two colour layers (red and blue) is simpler than perceiving five different colour regions in the same layer (e.g., Kanizsa, 1979). In contrast, in Figure 2b, the perceived transparency disappears when viewing an enlarged area of the region where the transparent patch of green is perceived as overlapping the red patch. In other words, the perceived colour differs with the surrounding colours during colour perception.
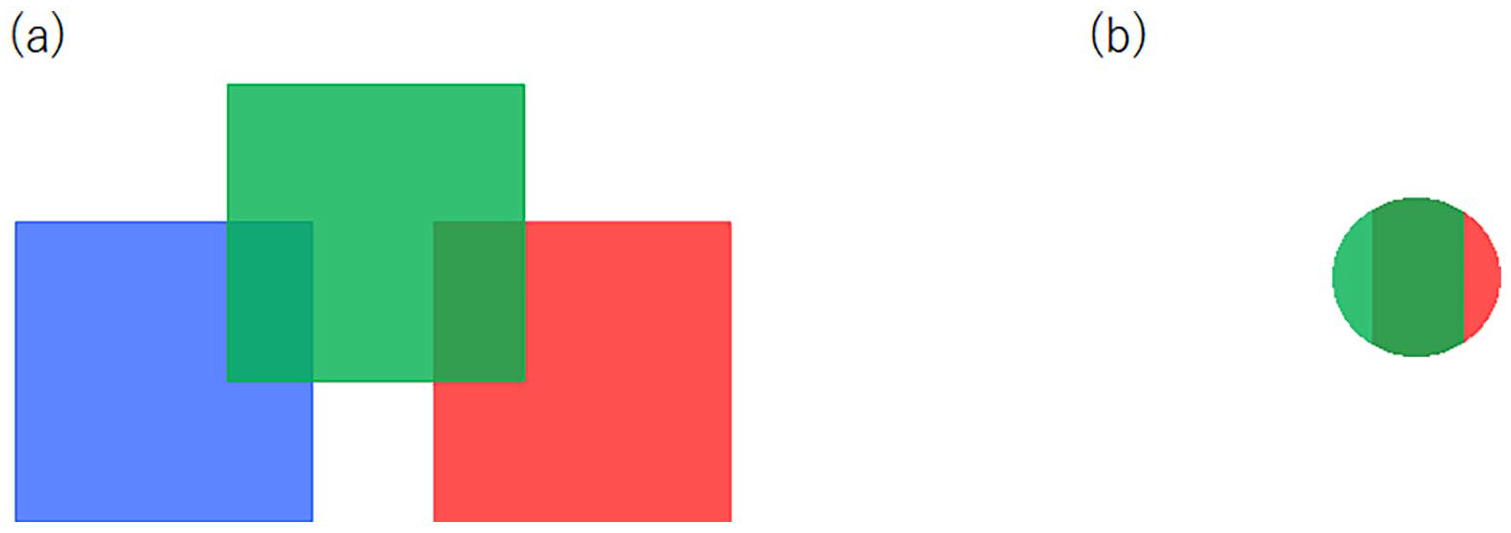
Example of colour transparency. (a) Example of a colour transparency stimulus. A transparent patch of green is perceived as overlapping red and blue patches. (b) Enlarged view of the region where the transparent patch of green is perceived as overlapping the red patch; with differing surroundings, transparency is not perceived.
If prior dominant (global or local) processing carries over into subsequent colour perception and dominant processing that are carried over affects the effect of the surrounding colour area on visual perception, the perceived colour of the transparent area should differ after global and local Navon tasks. However, this possibility has not yet been directly assessed. As mentioned before, a previous study insisted that the Navon task affected visual perception in a Müller–Lyer figure, while there is a possibility that the prior Navon task induced a response bias towards the same direction rather than facilitating ignoring distractors. Using colour transparency, which is influenced by the background colour and does not require a response related to dimensions involving size relationship, is helpful for excluding the possibility that the prior Navon task induces a response bias in visual perception. In addition, in most previous studies, optical illusions involving colour transparency have been explained in terms of material properties (e.g., Beck et al., 1984; Metelli, 1974) or visual experiences such as luminance (e.g., Gerbino, 1994; Gerbino et al., 1990; Kingdom, 2011). The engagement of flexible cognitive processing, including the effect of prior global/local processing on the optical illusion, has not been directly assessed, and it is not fully understood how flexible cognitive processing affects the optical illusion.
Here, we investigated whether prior global/local processing affects subsequent colour perception related to the surrounding colour area. In our experiment, the participants performed a global or local Navon task. Next, they were presented with a small square with a surrounding colour. Subsequently, a test patch was presented, and the participants were asked to adjust the colour of the test patch until they perceived it to be the same colour as the surrounding colour. If prior global processing enhances the effect of the surrounding colour, the difference in the adjusted colour and the physical colour should be greater after the global Navon task than after the local Navon task.
Materials and methods
Participants
We calculated the sample size with G*Power (Faul et al., 2007). A power analysis of the mean difference between two dependent means (matched pairs) with G*Power recommended the enrolment of 27 participants for an effect size of .25 (recommended value in Cohen [1988]), a power of .80 (recommended value in Cohen [1992]), and a p-value of .05. A total of 27 adults (three women and 24 men) aged 19 to 25 years (Mage = 22.9 years, SD = 1.4) participated in this study. All participants underwent the Ishihara test (a test for colour deficiency) and confirmed that they had normal or corrected-to-normal vision. Informed consent was obtained from all participants. The Committee for Human Research at the Toyohashi University of Technology approved the experimental procedures. All experiments were conducted in accordance with the Declaration of Helsinki.
Stimulus
In this study, six sets of colour patches were prepared (see Supplementary Material A). Each patch set consisted of two patches: a target patch and a test patch (Figure 3). Both patches contained a 14.25°×14.25° white background, (R, G, B) = (255, 255, 255); Y = 132.40 cd/m2, (x, y) = (.28, .29). The target patch (Figure 3, left) was composed of one large square (13.31°×13.31°) and three small squares (1.43°×1.43°) aligned horizontally on the large square. The colour of the large square was one of the surrounding colours, namely, cyan, (R, G, B) = (0, 255, 255); Y = 110.30 cd/m2, (x, y) = (.21, .29), red, (R, G, B) = (255, 0, 0); Y = 21.91 cd/m2, (x, y) = (.64, .34), pink, (R, G, B) = (255, 0, 255); Y = 36.75 cd/m2, (x, y) = (.26, .13), green, (R, G, B) = (0, 255, 0); Y = 92.84 cd/m2, (x, y) = (.30, .61), yellow, (R, G, B) = (255, 255, 0); Y = 119.00 cd/m2, (x, y) = (.41, .53), or blue, (R, G, B) = (0, 0, 255); Y = 13.74 cd/m2, (x, y) = (.15, .06). The colour of the centre square was grey, (R, G, B) = (128, 128, 128); Y = 128.00 cd/m2, (x, y) = (.31, .33).
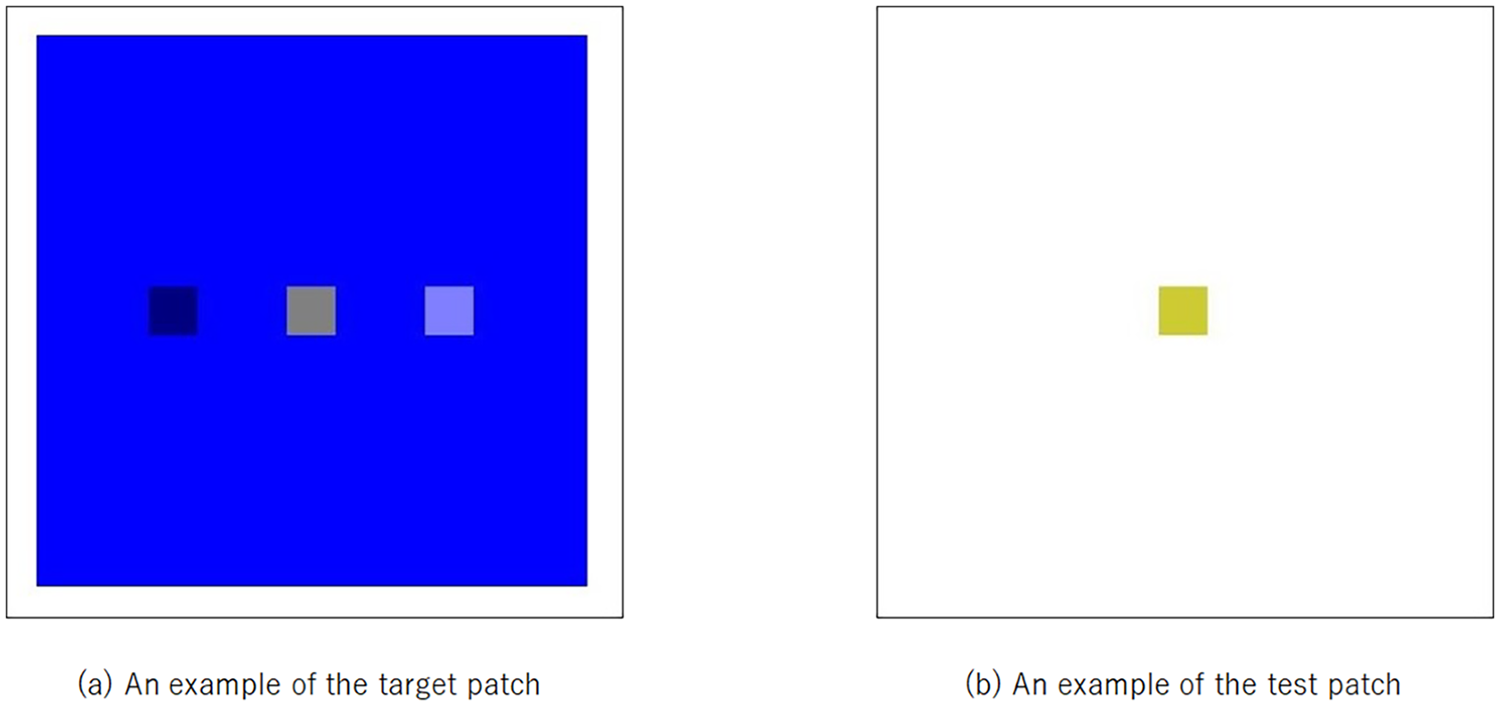
Examples of the target patch and test patch.
In this optical illusion of colour transparency, the perceived colour of the small square was represented in accordance with an additive colour mixture (Kitaoka, 2011). Therefore, the perceived colours of the small squares were determined based on the following formula using the colour of the large square and the colour of the small squares, which represents the additive colour mixture
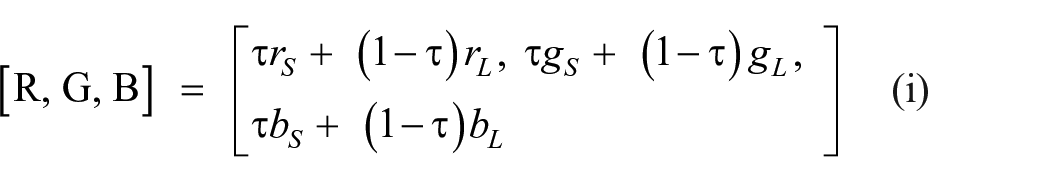
Here, [rL, gL, bL] is the RGB value of the colour for the large square, and [rS, gS, bS] is the value of the colour of the small squares. Regarding the centre squares, this value is the colour opposite to the surrounding colour across the grey on the chromaticity diagram defined as the target colour in this study. The target colours correspond to the surrounding colours, with red, cyan, green, pink, blue, and yellow (see Supplementary Material A). Regarding the left and right small squares, [rS, gS, bS] was white, (R, G, B) = (255, 255, 225); Y = 132.40 cd/m2, (x, y) = (.28, .29), or black, (R, G, B) = (0, 0, 0); Y = 20.03 cd/m2, (x, y) = (.25, .25). τ is the mixture ratio and can be between 0 and 1. The value of τ for the target patch is 0.5. When τ is 0.5, the physical colour of the centre square is grey, which is the middle colour between the surrounding and the target colours on the chromaticity diagram for all combinations used in this study. Figure 4 shows an example of the colour relationships of the large square (surrounding colour), the target colour of the centre square and the presented colour (grey) represented by the formula (i) chromaticity diagram. In this illusion, the perceived colour of the centre square is expected to shift towards the target colour (τ = 1) with the influence of the colour of the large square, even though the actual physical colour is grey (τ = 0.5) (Figure 5). Therefore, a larger τ value indicates a greater effect of the colour of the large square. The left and right small squares were included because colour transparency occurs under conditions of multiple colour areas (D’Zmura et al., 1997). The combinations of the left/right position and the white/black base colour were counterbalanced for all the participants. The test patch (Figure 4, right) consisted of a small square (1.43°×1.43°). The colour of the small square was the same as that of the centre square of the target patch, except that the value of τ could be changed.
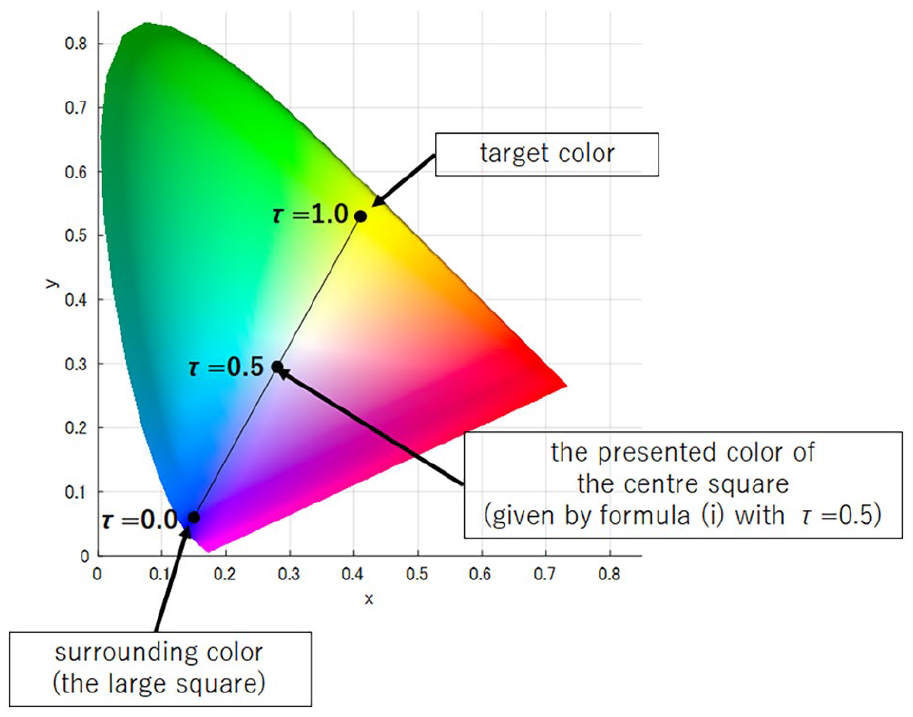
An example of the relationships among the colour of the large square, the target colour of the centre square and the presented colour represented by formula (i) on the chromaticity diagram.
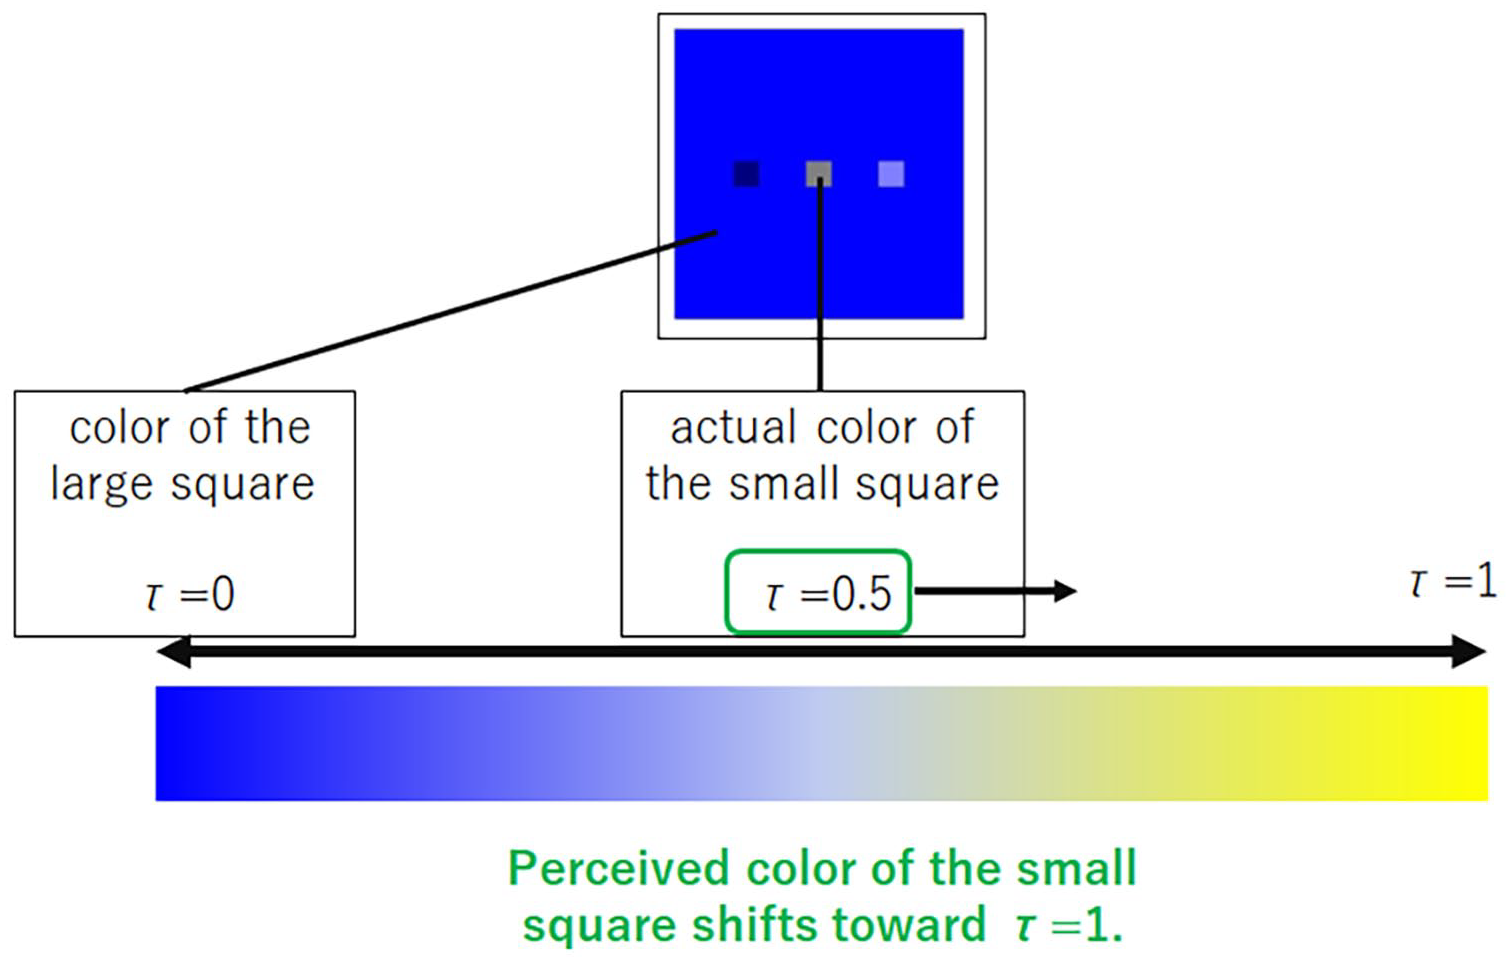
τ in formula (i) shifts towards τ = 1 with the larger effect of the colour of the large square.
In addition, Navon figures were prepared. The large letter (6.51° × 15.02°) in the Navon figure used in this study was always different from the small letter (1.43° × 1.75°). In addition, two types of test figures were prepared. The test figures for the Global Navon task contained three letters that were 6.51° × 10.41°, while the test figures for the Local Navon task contained three letters that were 1.43° × 2.15°.
Procedure
The participants completed this experiment individually. Each participant sat in front of a 1920 × 1080 resolution display in a dark room. An original programme using the MATLAB language was prepared for this experiment. The experiment consisted of three sessions: a colour-matching practice session, a Navon task practice session, and a colour-matching task session (Figure 6). First, all participants completed the colour-matching practice session. Subsequently, half of them completed the Navon practice task and colour-matching task sessions in the global condition, while the other half completed the task in the local condition. Following this, they completed the Navon practice task and colour-matching task sessions in the other condition. The order of the global/local conditions was counterbalanced between the participants.
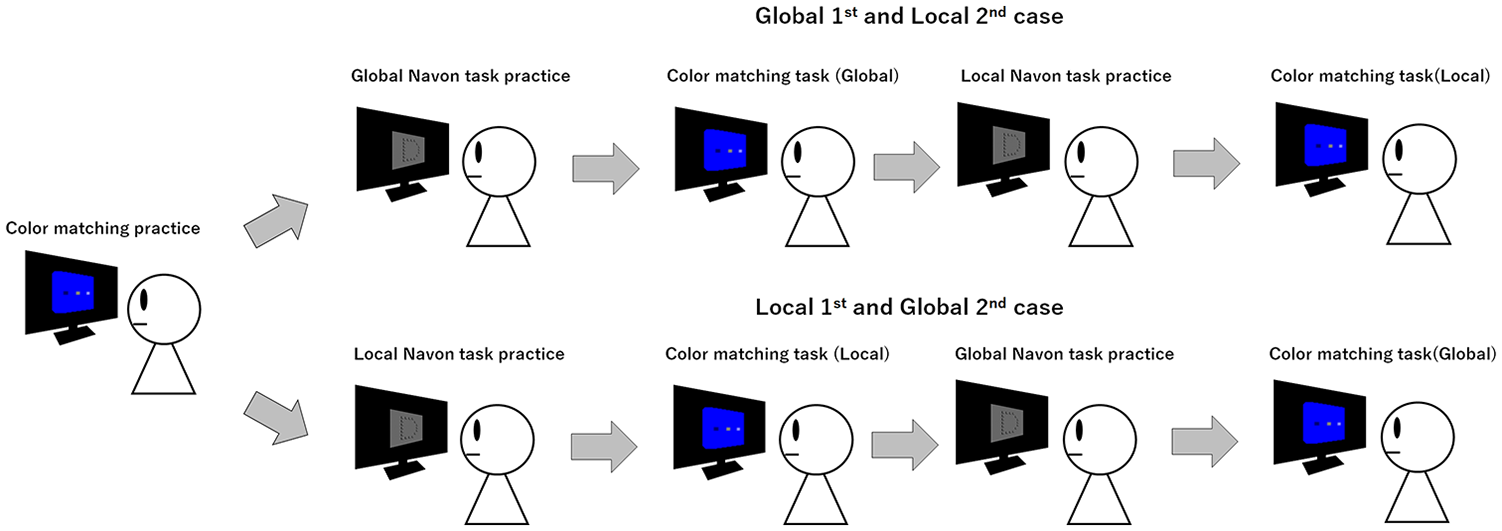
Experimental design. All participants completed the survey on global and local conditions. The order of the conditions was counterbalanced. In each condition, after performing the global or local Navon task, the participants completed the colour-matching task.
Colour matching practice session
First, the participants completed a colour-matching practice session. Figure 7 shows an example of one trial sequence on the colour-matching task in the practice session. At the beginning of a trial, a fixation cross was presented in the centre of the screen for 1 s. Then, following a blank screen for 1 s, one of the target patches was presented for 1 s. Afterwards, white noise was presented for 1.5 s. Subsequently, the test patch was presented. The participants were required to adjust the colour of the test patch to the colour of the centre small square in the target patch using a 10-key pad. The initial colour of the test patch was determined by formula (i), in which [rS, gS, bS] was the RGB value of the target colour, [rL, gL, bL] was the RGB value of the colour of the large square, and τ was 0.2, 0.5 or 0.8. When a participant pressed the “1” key, the presented colour changed to the colour determined by formula (i), with τ decreasing by 0.002. When a participant pressed “3,” the presented colour changed, with τ increasing by 0.002. The participants pushed the entry key when they finished the adjustment. If the adjustment took longer than 8 s, “Speed up” was flashed for 2 s. Again, white noise was presented for 1 s. Each pair of colour patches was presented 3 times; therefore, the total number of trials was 18. The initial colour of the test patch was determined by the formula in which τ was randomly assigned as 0.2, 0.5, or 0.8.
An example of one trial sequence in the colour-matching practice session.
Navon task practice session
Following the colour-matching practice session, the Navon task practice session was conducted. The procedure of the Navon task was designed based on a previous study that employed the global/local Navon task (Hine & Itoh, 2014). The fixation cross was presented for 1 s. Then, a Navon figure was presented for 0.15 s following a 1-s blank screen. Immediately, a test figure that contained three letters was presented. One of the three letters was the same as the large letter in the Navon figure, one of the other letters was the same as the small letters in the Navon figure, and the last letter was not the same as the large or small letters. In the global condition, the participants were asked to identify the large letter in the Navon figure from three letters presented in the test figure by pressing the 1, 2, or 3 keys on the 10-key pad (left, centre, and right, respectively). In the local condition, they were required to identify the small letter from three letters. The test figure was presented until the participants recorded their responses. When the participants gave a wrong answer or the response latency was over 0.5 s, “Wrong” or “Speed up” was flashed for a second. The intertrial interval (ITI) was 1 s. There were 36 randomised trials in each condition.
Colour matching task session
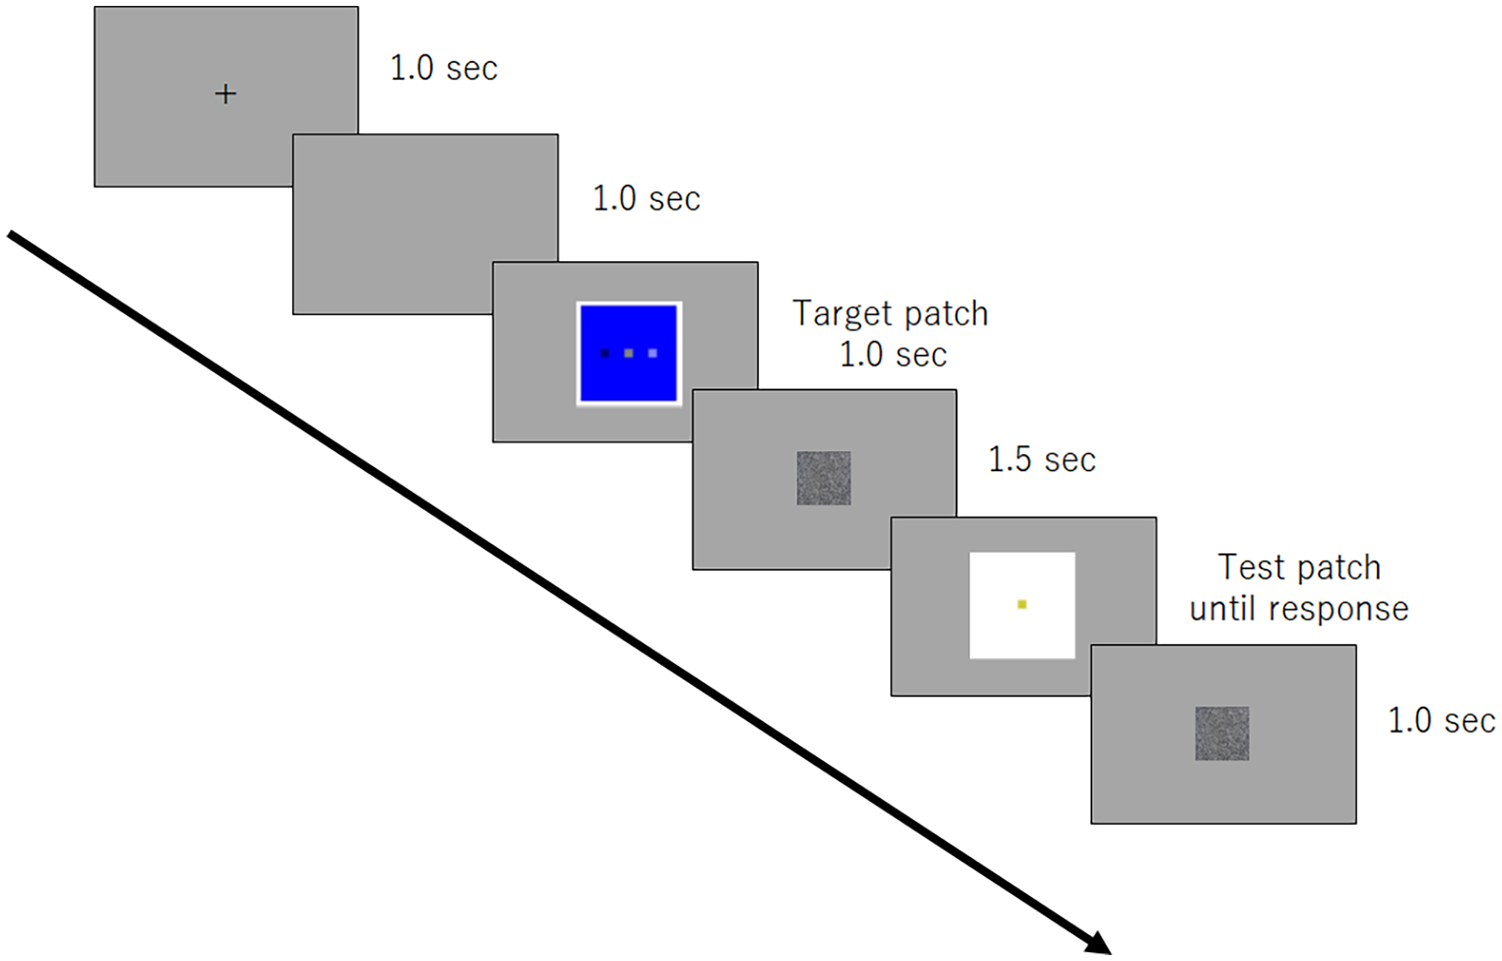
Figure 8 shows an example of one trial sequence on the colour-matching task. After the global or local Navon task practice session, a colour-matching task was conducted. The procedure of the colour-matching task was the same as that in the colour-matching practice session, except that two trials of the Navon task, which was the same as that in the immediately prior Navon task practice session, were inserted between the colour-matching trials. In addition, “Wrong” and “Speed up” feedback was not given to avoid nullifying the effect of the Navon task on the colour-matching trial by the long ITI (Weston & Perfect, 2005). For each participant and the colour patches set for the colour-matching practice session, the average τ for the regulated colours was calculated. The initial colour of the test patch in this colour-matching task was defined following formula (i), using a random value between ±0.3 of the average τ for each colour patch set to ensure that the initial colour does not act as a clue. For each colour patch set, five trials were conducted. Thus, there were 30 trials in random order. After the colour-matching task, the participants completed the Navon task and the colour-matching task in another global/local condition. After completion of the colour-matching task in both conditions, the participants were thanked and debriefed.
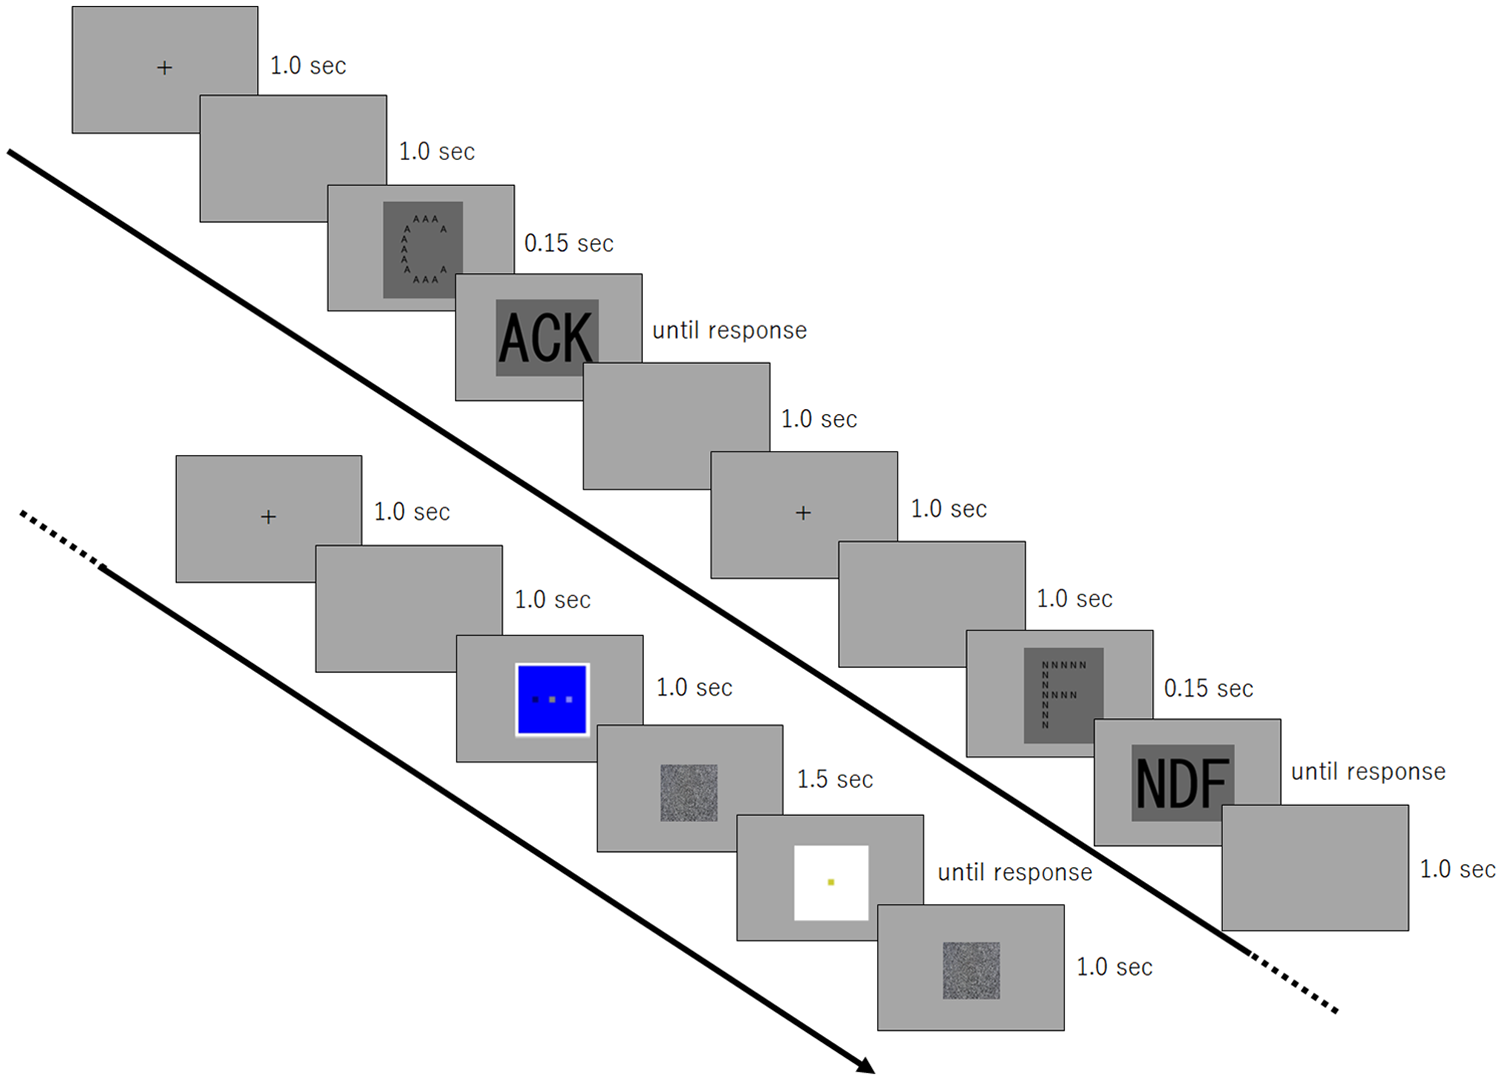
An example of one trial sequence on the colour-matching task.
Results
With respect to the Navon task in the colour-matching task, the average reaction time for the global condition, 0.47 (SD = 0.03) seconds, was significantly faster than the average reaction time for the local condition, that is, 0.51 (SD = 0.03) seconds, t(26) = 5.07, p < .001, r = .71. Regarding the proportion of correct answers, the average for the global condition (0.97, SD = 0.03) did not significantly differ from the average for the local condition (0.98, SD = 0.03), t(26) = 0.41, p = .34, r = .08. This study replicated the global precedence effect (Bouvet et al., 2011; Navon, 1977, 1981).
The average τ was calculated for each condition (Figure 9). The average τ in the global condition was 0.5163 (SD = 0.0163), while the average τ in the local condition was 0.5131 (SD = 0.0136). There was a significant difference between the global and local conditions, t(26) = 1.81, p = .04, r = .34. The optical illusion involving colour transparency in the global condition was greater than that in the local condition.
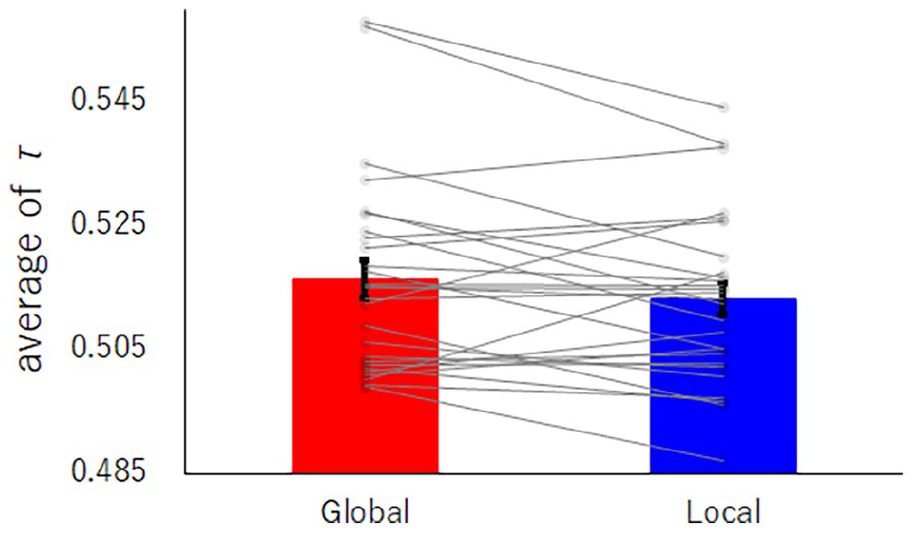
Average τ for the global and local conditions.
Discussion
This study aimed to assess whether prior global/local processing affected subsequent colour perception. The amount of optical illusion involving colour transparency, which is affected by the surrounding colour area, was greater after the global Navon task than after the local Navon task. Thus, this study clearly showed that prior global/local processing influenced subsequent colour perception.
One plausible explanation is that the attentional window was carried over from the prior Navon task to the following colour-matching task. An attentional window is the limited spatial range to which attention is allocated (Hernández et al., 2010; Theeuwes, 2004). The attentional window during a global Navon task should be larger than that during a local Navon task because the alphabet size that should be read in the global Navon task is larger than that in the local Navon task. It was also reported that the size of the attentional window is carried over from prior tasks that required global or local processing to subsequent ostensibly irrelevant tasks (Hine & Itoh, 2014; Weston & Perfect, 2005). In addition, the optical illusion involving colour transparency could be affected by the surrounding colour area; a larger surrounding area induces a larger illusion (Graham & Brown, 1965; Kirschmann, 1891). Based on these findings, the larger attentional window in the global Navon task might be carried over into the following colour-matching task. In the colour-matching task, the size of the attentional window after the global Navon task might be larger than that after the local Navon task, and the influence of the surrounding colour area might be different under global and local conditions. Thus, the optical illusion involving colour transparency in the global condition could be greater than that in the local condition. To assess the effect of the attentional window directly, the relationship between the size of the Navon figures and the colour patches should be investigated in future studies.
One might think that the processing mode in memory and not the attentional window was affected by the prior Navon task. It has been reported that which of the upper or lower components that construct the hierarchical structure is processed affects subsequent memory tasks (Kim et al., 1999). This suggests that the processing mode in which the upper (global) or lower (local) levels of the hierarchical structure were processed affected memory performance regardless of the size of the stimulus. The successive colour-matching task requires both perceptual and memory processes because the colours of target figures are memorised for a while (Allen et al., 2011). Regarding global/local processing and memory performance, Schooler and Engstler-Schooler (1990) reported that the performance of colour memory tasks using local processing was lower than that using global processing. It is known that colour memory requires nonverbal processing (Brown, 1966; Lucy & Shweder, 1979). In addition, many studies have indicated that global and local processing are related to nonverbal and verbal processing, respectively (Chin & Schooler, 2008; Wickham & Lander, 2008). Therefore, when local processing is induced, verbal processing could be dominant in the following task, and the colour memory task that requires nonverbal processing could be suppressed. Consequently, it is possible that global/local processing affects the accuracy of colour adjustment for the test patch to match the perceived colour rather than influencing the perception of the colour of the target patch. In further studies, it should be clarified which processing mode or attentional window affects visual perception.
The remaining question is whether the effect occurs immediately after the global or local Navon task or how long the effect lasts. In the current experiment, the global and local Navon tasks were conducted in a blocked design. In addition, performance in the Navon task was high, preventing a meaningful comparison of τ following correct and incorrect answers across the entire task. Consequently, we were unable to appropriately assess the extent of influence. Implementing a randomised design might be an effective way to address such questions. Nonetheless, this study suggested that optical illusions involving colour transparency can be affected by flexible cognitive processing at a certain moment. Most of the colour perception studies that have investigated colour transparency have focused on material properties (e.g., Beck et al., 1984; Metelli, 1974) or visual experiences such as luminance (e.g., Gerbino, 1990, 1994, Kingdom, 2011). In other words, previous studies have considered flexible cognitive processing less. In this study, even though the same person observed the same materials, the perceived colour changed with flexible cognitive processing, implying the dominance of global and local processing. This suggests that colour transparency could be regulated by pliable cognitive processing, which should lead to new insights into colour perception.
Supplemental Material
sj-docx-1-qjp-10.1177_17470218241266795 – Supplemental material for Influence of global/local processing on perceived colour transparency
Supplemental material, sj-docx-1-qjp-10.1177_17470218241266795 for Influence of global/local processing on perceived colour transparency by Kyoko Hine, Riku Saito and Shigeki Nakauchi in Quarterly Journal of Experimental Psychology
Footnotes
Author Contributions
K. H., R.S., and S.N. designed the study. K.H. and R.S. prepared the materials. R.S. collected and analysed the behavioural data. K.H. wrote the manuscript. All the authors discussed the results and commented on the manuscript.
Declaration of conflicting interests
The author(s) declared no potential conflicts of interest with respect to the research, authorship, and/or publication of this article.
Funding
The author(s) disclosed receipt of the following financial support for the research, authorship, and/or publication of this article: This research was supported by a Grant-in-Aid for Scientific Research from the Japan Society for the Promotion of Science (grant no. 22K12218), 2020 TUT President Funding (Young Researchers) from the Toyohashi University of Technology, and The Telecommunications Advancement Foundation.
Data availability
Research data are available from the corresponding author upon reasonable request.
Supplementary material
The Supplementary Material is available at: qjep.sagepub.com.
References
Supplementary Material
Please find the following supplemental material available below.
For Open Access articles published under a Creative Commons License, all supplemental material carries the same license as the article it is associated with.
For non-Open Access articles published, all supplemental material carries a non-exclusive license, and permission requests for re-use of supplemental material or any part of supplemental material shall be sent directly to the copyright owner as specified in the copyright notice associated with the article.