
Abstract
Trypophobia is the condition in which individuals report a range of negative emotions when viewing clusters of small holes. Since the phenomenon was first described in the peer-reviewed literature a decade ago, 49 papers have appeared together with hundreds of news articles. There has also been much discussion on various Internet forums, including medical and health-related websites. In the present article, we examine the degree to which the phenomenon is caused by a form of social learning, specifically, its ubiquitous social media presence. We also examined its prevalence among the broad population. In Experiment 1 (n = 2,558), we assessed whether younger people and females (i.e., greater social media users) are more sensitive to trypophobic stimuli, as predicted by the social media hypothesis. In Experiment 2 (n = 283), we examined whether sensitivity to trypophobic stimuli and rates of trypophobia is greater in people who are aware of the condition’s existence, as opposed to those who have never heard of the phenomenon. In line with the social media theory, results showed that younger people and females are indeed more susceptible to trypophobia. However, 24% of trypophobic individuals have never heard of the condition. Overall, these data suggest that both social learning and non-social learning contribute to trypophobia. We also find that the prevalence of trypophobia is approximately 10%.
Keywords
Introduction
In 2013, Cole and Wilkins described a phenomenon in which approximately 15% of the adult population experience a number of negative emotions when viewing clusters of small holes (Cole & Wilkins, 2013). “Trypophobia” can be induced by a large variety of stimuli and objects, including ones that are naturally occurring (e.g., honeycomb) or human-made (e.g., aerated chocolate), and symptoms are usually classified as skin-related, cognitive, and/or physiological (Le et al., 2015). For example, a feeling of nausea or “skin crawling” is often reported. Forty-nine peer-reviewed papers have now appeared, assessing issues such as what critical features induce the aversion (Sasaki et al., 2017), its physiological correlates (Pipitone et al., 2017), the extent to which images modulate eye movements (Shirai et al., 2019), and its relationship to other measures (e.g., empathy; Imaizumi et al., 2016). A trypophobia scale has also been developed (i.e., the Trypophobia Questionnaire, TQ; Le et al., 2015).
Trypophobia is often placed within the context of other conditions in which certain types of stimuli and geometric patterns can be uncomfortable to view (e.g., flickering lights; stripped patterns; Harding & Jeavons, 1994). The phenomenon can cause everyday problems for many people. For example, Robakis (2018) described an adult who was unable to drive because she found the light-emitting diode arrays in traffic lights particularly aversive. Martínez-Aguayo et al. (2018) also presented a case study of a young girl who experienced nausea, sweating, and choking when viewing hole clusters. In a survey of 195 individuals, Vlok-Barnard and Stein (2017) reported that 24% of respondents stated that their trypophobia induced mild anxiety. Another 30% reported moderate anxiety, 15% reported severe anxiety without panic attacks, and 16% reported severe anxiety with panic attacks. The authors also found that 15% of respondents scored at least 5 on the work or school subscale of the Sheehan Disability Scale (Sheehan, 2000). This score classifies a person as having “significant impairment” in the relevant activity. Furthermore, Vlok-Barnard and Stein found that 26% of respondents reported “a high level of psychological distress” and a further 25% reported “a very high level.” In summarising their findings, the authors stated that the trypophobia experienced in their sample was “chronic and persistent.” Moreover, trypophobia is defined as a Specific Phobia using all seven criteria outlined in the Diagnostic and Statistical Manual of Mental Disorders. For example, the aversion induced by the stimuli (e.g., the lotus seed pod) is “out of proportion to the actual danger posed” and always “immediate.” Furthermore, the stimuli are “actively avoided” and the condition is “typically lasting for 6 months or more.”
A central concern has been the attempt to identify its cause, with a number of explanations having been put forward. In their original article, Cole and Wilkins suggested that it may be due to an evolved sensitivity towards noxious/poisonous animals. This was based on results from a spectral analysis showing that trypophobic stimuli possess a characteristic shared with animals that display aposematic skin patterns (e.g., poison dart frog). This feature, not usually found in the natural environment, is high contrast at mid-range spatial frequencies. Kupfer and Le (2018) presented an alternative evolutionary account in which humans are said to have evolved sensitivity towards certain skin pathologies. These often manifest in terms of circular patterns reminiscent of trypophobia-inducing stimuli. This theory is supported by the finding that the trypophobic response is increased when the holes are digitally incorporated onto human skin (Pipitone et al., 2022). A third possibility is that trypophobic stimuli generate peaks of neural activation (Le et al., 2020). In this explanation, the phenomenon is best explained with reference to visual stress (Wilkins, 1995). Trypophobia may therefore be due to hyperexcitability of the cortex (Bargary et al., 2015).
One particularly interesting aspect of trypophobia research is that it has initiated hundreds of news articles in both the print and digital media (e.g., BBC, Washington Post, The Irish Times, Huffington Post), as well as much discussion on the Internet. Medical and health-oriented websites, particularly those concerned with mental health, have also discussed the phenomenon. This is possibly due to the popularity of skin trypophobia visual memes and also because the phenomenon is not uncommon. It is therefore possible that trypophobia has been driven by its ubiquitous online presence. Or, at the very least, “a fear made worse by the internet” (Oelze, 2018). While the majority of discussion has taken place subsequent to the appearance of the Cole and Wilkins (2013) paper, trypophobia already had an Internet presence before 2013. Indeed, it seems to have been given the trypophobia name 8 years previously (Aminuddin & Lotfi, 2016). Thus, the fact that trypophobia interest was substantially increased after 2013 does not negate the possibility that people had been exposed to it before.
The principal aim of the present paper was to examine whether one form of social learning (see McNally, 1987) can explain the prevalence of trypophobia. Classic social learning theory (e.g., Bandura, 1977; Burgess & Akers, 1966) states that the acquisition of knowledge and resultant behaviours occurs through observing and imitating others. Learning is thus considered a cognitive process that takes place in a social context. With the inception of the Internet, a number of authors began to examine how learning is influenced by exposure to the technology (e.g., See Chen & Xiao, 2022). Social media in particular is thought to play a critical role in shaping beliefs and decisions (e.g., Swigger, 2013; Tufekci & Wilson, 2012) with confirmation bias among users being of central interest for a number of years (e.g., Ling, 2020; Miller, 2016; Thornhill et al., 2019). The influence of social media on thought is also considered a central reason why advertisers have moved away from the more traditional places for promotion (e.g., television, newspapers) towards various social media platforms (Ali et al., 2020). It is therefore possible that the condition is primarily caused by its wide Internet presence.
In Experiment 1, we examined how trypophobia sensitivity is influenced by exposure to social media. Specifically, whether trypophobia is associated with age and sex. These factors are known to be strongly associated with social media use. In Experiment 2, we tested a further social learning explanation hypothesis. Specifically, that sensitivity to trypophobic stimuli and prevalence of the condition should be greater among people who have heard of the phenomenon compared with people who have not. Experiment 2 also tested the strictest prediction of the social learning hypothesis; that there should not exist trypophobic individuals who have never heard of the phenomenon.
A related aim of the present work was to provide the most comprehensive assessment of overall prevalence of trypophobia in the general population, or at least in the United Kingdom. The first attempt to determine prevalence was the paper of Cole and Wilkins (2013). The authors presented a single image of the lotus seed pod (often cited by trypophobic individuals as inducing the condition) and asked 286 people from various backgrounds and ages whether the image “is uncomfortable or even repulsive to look at.” Sixteen percent responded “yes,” thus providing an initial estimate of trypophobia. Le et al. (2015) subsequently developed a questionnaire that now enables prevalence to be better determined. Using emotional reactions and descriptions provided by sufferers (e.g., skin crawl), a factor analysis showed that these could be described with 17 statements. These then formed the basis of the TQ. In developing the questionnaire, Le et al. (2015) showed that the highest average sensitivity and specificity of the scale was obtained at scores above 31. A trypophobic person can therefore be defined as an individual who scores 32 or above on the TQ. The present Experiment 1 includes the largest sample to have completed the TQ (2,558 adults; see also Wong et al. (2023) for a recent large-scale study assessing prevalence; n = 2,065).
Experiment 1
It is well established that the use of social media is more prevalent among females compared with males. For example, in a sample of 573 American residents, Ferenczi et al. (2017) found that females tended to spend more time on Facebook compared with males. The abundance of data generated by marketing companies supports this. For example, in 2015, “Brandwatch” reported that a larger proportion of Facebook users were female. Exposure to social media and the Internet more broadly is also related to age (Thayer & Ray, 2006) and in a systematic way. As category of age increases (e.g., 26–35), Internet use decreases (Office for National Statistics, 2018). It follows therefore that a necessary condition of the social learning hypothesis is that sensitivity to trypophobic stimuli (i.e., degree of trypophobia in individuals), and absolute prevalence of trypophobia (i.e., trypophobic or non-trypophobic), should be greater in females compared with males. The hypothesis also predicts that sensitivity should decrease in the same systematic way as social media use decreases with age.
Experiment 1 employed the TQ to measure trypophobia sensitivity as a function of sex and age. Age was examined across six different categories, 18–24, 25–34, 35–44, 45–54, 55–64, and 65 or over.
Method
Participants
The initial motivation for undertaking the present experiment was to generate trypophobia normative data, rather than assessing the learning account per se. A large sample was therefore tested capturing a range of age, gender, education, UK region, and employment status (See Table 1). The only justification of this sample size was to generate representative data. A total of 4,593 individuals began the (online) study process. One hundred and fifty-seven did not consent and 111 consented but did not answer any further questions, while 1,764 were screened out based on our quotas, those participants were screened out before answering the TQ and received a smaller fee. This meant that a total of 2,561 people undertook the scale.
Sociodemographic characteristics of participants in Experiment 1.
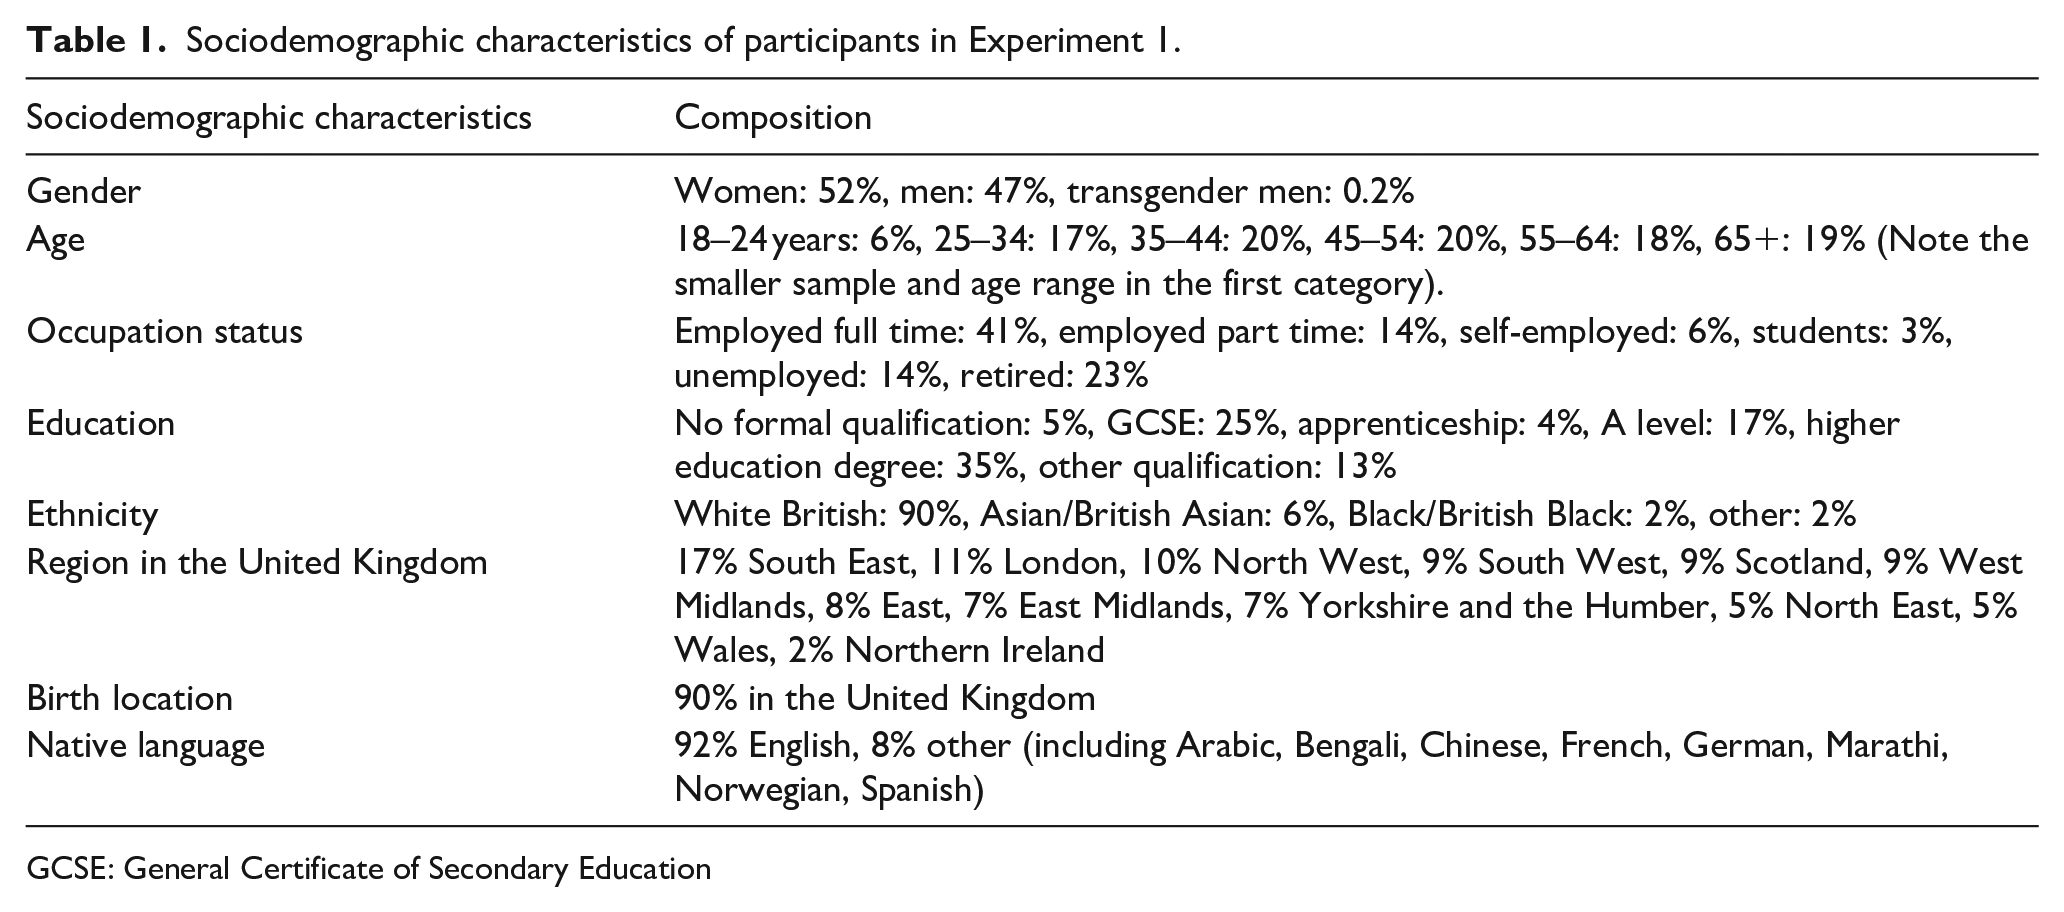
GCSE: General Certificate of Secondary Education
Materials and procedure
Participants were recruited via Bilendi. Ethical approval was received from the University of Essex Psychology Ethics Committee for both of the present experiments (Reference numbers GC1703 and ETH2021-0830). After providing consent, participants were asked nine general questions concerning occupation, education, parental education, ethnicity, nationality, handedness, first language, sex, and age. They were then presented with 2 lotus pod images and the 19 items of the TQ. This requires respondents to rate, on a scale of 1–5, the degree to which two lotus seed pods (commonly cited as inducing trypophobia) evoke a particular emotion: e.g., “Feel aversion, disgust or repulsion” and “Feel sick or nauseous.” A sum of participant responses is used to indicate the level of trypophobia of each person (ranging from 17 to 85). Two “foil” questions are also included in which participants are asked whether the images induce a positive feeling. Participants are omitted from analysis if they indicate that the trypophobic stimuli are both aversive and positive. As noted, sensitivity and specificity analyses undertaken by Le et al. (commonly used to assess the ability of a diagnostic test to identify those with or without a disease; Akobeng, 2007) showed that the TQs’ maximal sensitivity was for scores above 31. Participants then answered unrelated questions for a different study concerned with understanding of food labels and medical risk perception. We have reported how we determined our sample size, all data exclusions (if any), all manipulations, and all measures in the study. The raw data is available at https://osf.io/ykqaj/. The work was undertaken during 2016–2017 and was not pre-registered.
Results and discussion
Overall trypophobia prevalence
Three participants were omitted because they generated both the maximum trypophobic score and the maximum score on the two foil questions. Of the 2,558 remaining participants, 247 scored above 31 on the TQ. The overall mean TQ score was 21.4 (SD = 9.8). As according to the criterion of Le et al. (2015), 9.7% of the population can therefore be considered to be trypophobic. Note that our 9.7% value is smaller than the recent Wong et al. (2023) estimate of 17.6%. Their study however employed participants aged 15–24 and, as the analysis below shows, instances of trypophobia decrease with age. Furthermore, many phobias are known to be less prevalent in younger people (Fredrikson et al., 1996).
Sex differences in trypophobia
Ten participants were not entered into this analysis because they did not indicate their sex. This meant that 1,206 males and 1,342 females comprised the total number of participants.
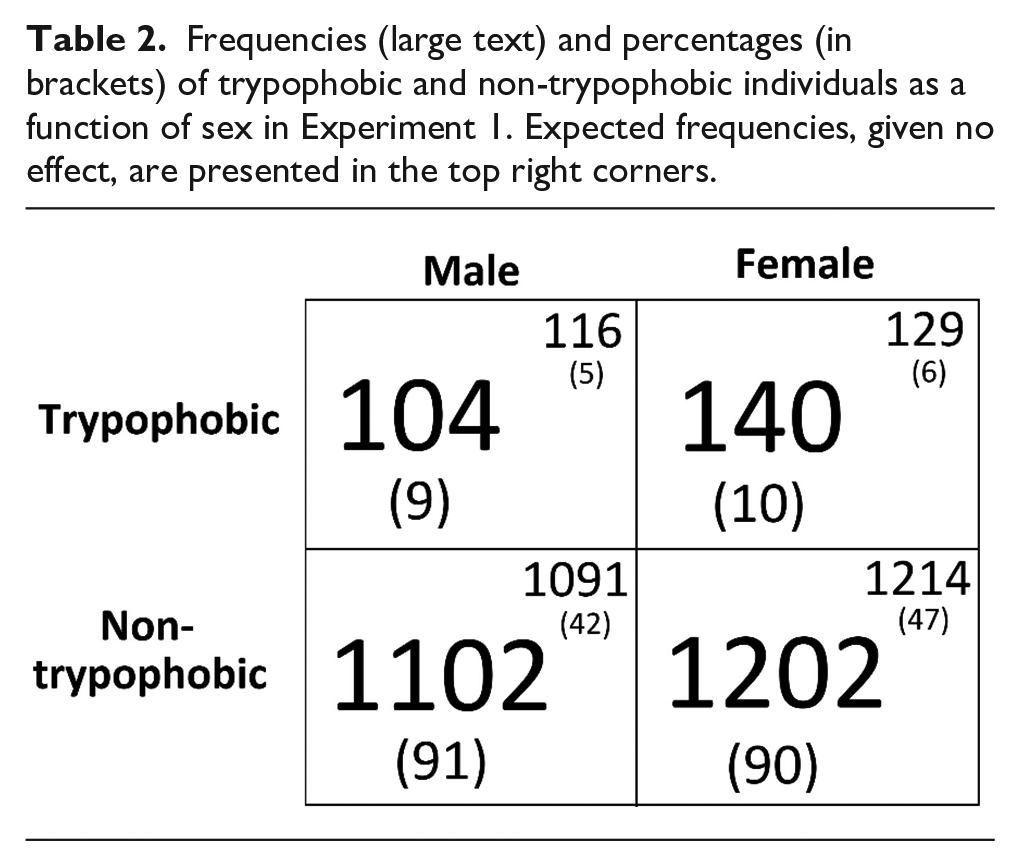
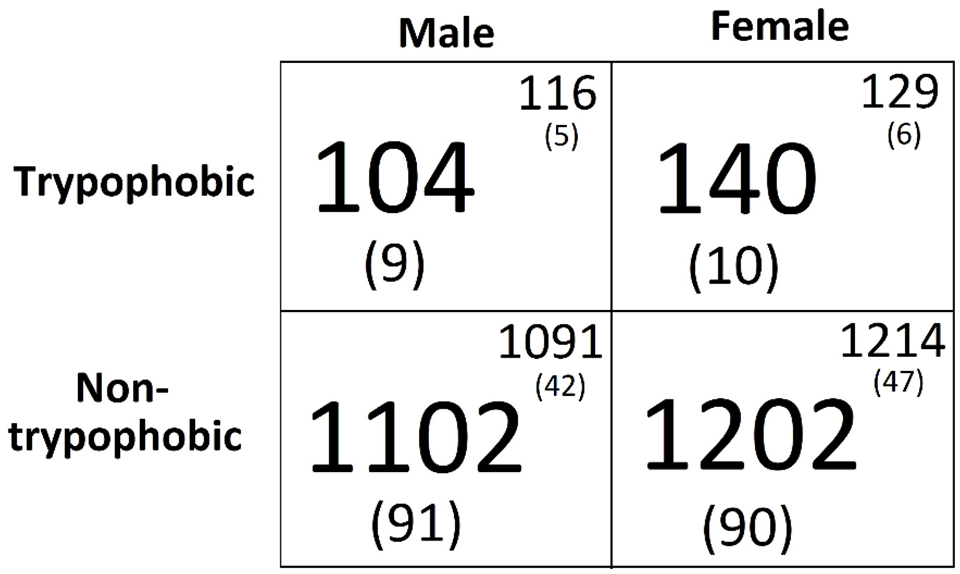
The mean TQ score for men was lower than for women (Mwomen = 21.0 SE = 0.28 vs Mmen = 21.8, SE = 0.27). These means were entered into an independent samples t test which showed this difference to be small but significant, t(2546) = 2.2, p = .031, d = .09. With respect to sex difference and trypophobia classification (see Table 2), there was a non-significant effect, χ2 (1, 2548) = 2.4, p = .12, r = .03.
Frequencies (large text) and percentages (in brackets) of trypophobic and non-trypophobic individuals as a function of sex in Experiment 1. Expected frequencies, given no effect, are presented in the top right corners.
Age differences in trypophobia
Nineteen participants did not indicate which age category they were in. This resulted in a total of 2,539 participants for the age analysis. One hundred and fifty-two were aged between 18 and 25, 425 between 25 and 34, 509 between 35 and 44, 512 between 45 and 54, 458 between 55 and 64, and 483 over 65. Mean TQ score for each category was as follows: 18–24 = 28.2 (SE = 1.2), 25–34 = 25.7 (SE = 0.67), 35–44 = 23.1 (SE = 0.5), 45–54 = 19.6 (SE = 0.3), 55–64 = 18.9, (SE = 0.29), and 65+ = 18.3 (SE = 0.16). A one-way ANOVA revealed that TQ was significantly different across age category, F(5, 2533) = 57.7, p < .0001. Further analysis showed that there was at least a small effect/difference (each t > 1.7; each d > .1; each p < .09) in TQ score between each adjacent age category. The overall age effect was also expressed in terms of a significant negative correlation between age category (rather than exact age) and TQ score, r = −.31, p < .001 (Figure 1).
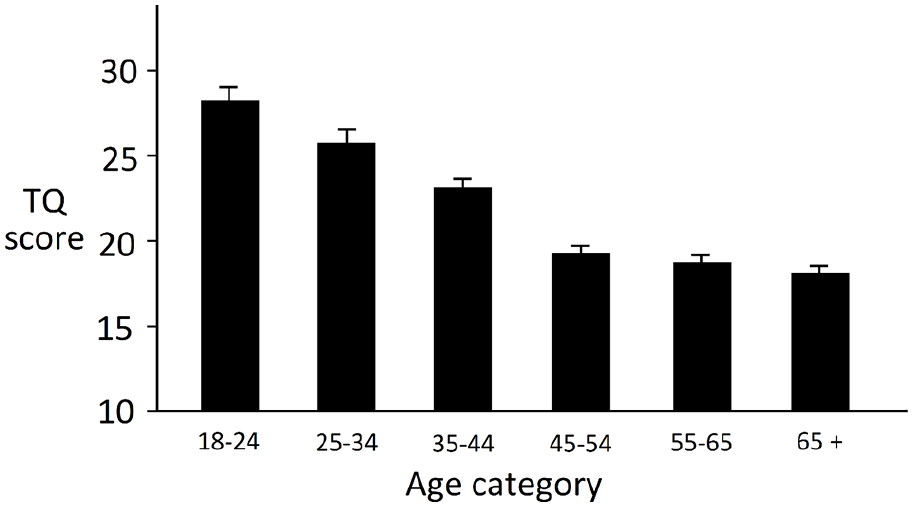
TQ score as a function of age in Experiment 1.
Overall, Experiment 1 has shown that although sensitivity to trypophobic stimuli (i.e., degree of aversion) is greater in females compared with males, trypophobia is not more prevalent in females. The data therefore provide partial support for the social learning hypothesis. The difference found in the two trypophobia measures (i.e., degree of trypophobia and trypophobic vs non-trypophobia) is likely to be due to the fact that indexing degrees of trypophobia will be a more sensitive measure. We have also found that trypophobia is associated with age in a systematic manner. As age increases, and therefore social media exposure decreases, trypophobia sensitivity reduces. Because females and younger people are known to use social media more, these results therefore support a necessary condition of the social learning explanation of trypophobia.
Experiment 2
Although the results from Experiment 1 support the social learning account, it is also known that many phobias (e.g., snakes, spiders, flying, darkness, closed spaces) are also more prevalent in females than males (e.g., Boyd et al., 1990; Fredrikson et al., 1996; George et al., 1986; Myers et al., 1984; Robins et al., 1984) and decrease with age (e.g., spider phobia, Fredrikson et al., 1996). The most direct assessment of the social learning account is to examine trypophobia in people who have never heard of the phenomenon compared with people who have. Three predictions can be made. The first, and most stringent, states that there should not exist a single person who has never heard of the phenomenon but still has trypophobia. A second states that the proportion of trypophobic individuals (as opposed to non-trypophobic) should be greater in a group of people who have heard of the phenomenon compared with the proportion in a group who have not. The third prediction is that sensitivity to trypophobic stimuli (i.e., TQ score) should be greater in a population who have heard of it compared with a population that is unfamiliar. To put this all another way, the social learning account states you are more likely to be trypophobic and more sensitive to the inducing stimuli if you have heard of the condition. In Experiment 2, participants completed the TQ along with a question asking whether they had ever heard of the phenomenon.
Method
Participants
There were 289 participants, all aged between 19 and 22. Participants were recruited via a University of Essex online participation recruitment portal. The sample size was based on the largest number that funds would allow.
Materials and procedure
Participants completed the TQ only. Immediately afterwards, they were presented with the following: This questionnaire was designed to assess how prevalent “Trypophobia” is in the general population. Trypophobia is a condition in which individuals feel uncomfortable or even repulsed when they see small holes clustered together. Have you ever heard of this condition? If so, can you remember where from?
Results and discussion
Six participants indicated that they had heard of trypophobia but could not remember where from. We therefore omitted these from further analysis. Table 3 shows the raw frequencies as a function of whether respondents had heard of trypophobia or not. With respect to the first prediction, 24% of trypophobic individuals have never heard of the condition. This therefore refutes what might be considered the strictest test of the theory.
Frequencies (large text) and percentages (in brackets) of trypophobic and non-trypophobic individuals as a function of their awareness of trypophobia. Expected frequencies, given no effect, are presented in the top right corners.
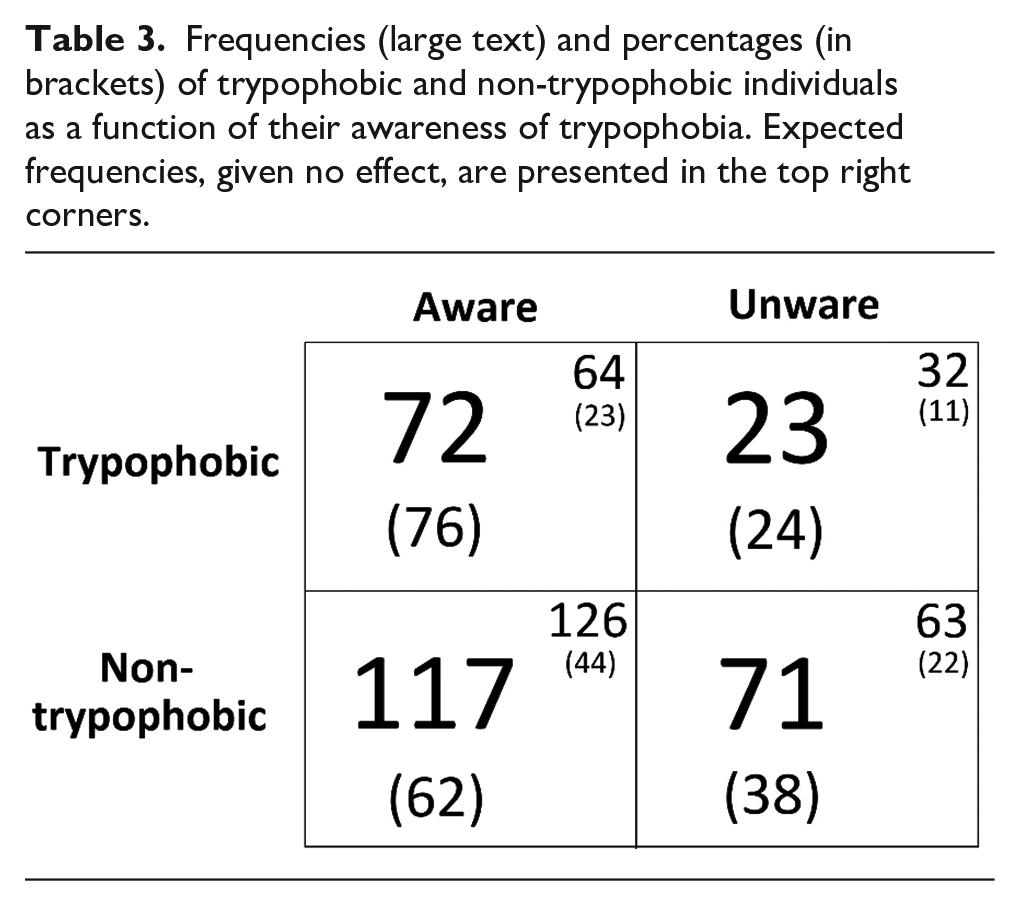
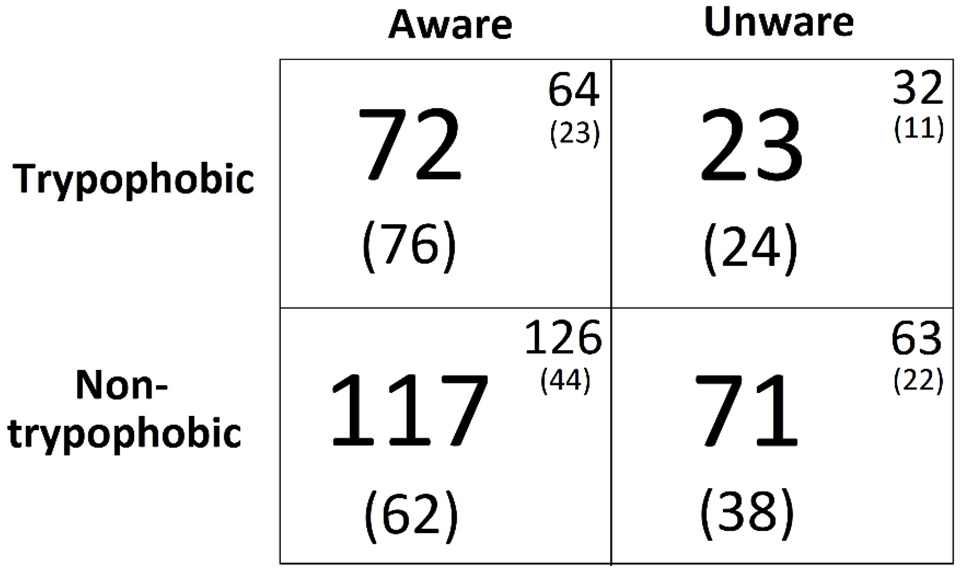
The second prediction was that the proportion of trypophobic individuals should be greater in people who are aware of the phenomenon compared with those who have never heard of it. A chi-square analysis using the raw frequencies found that the ratio of trypophobic individuals was indeed different according to awareness of the phenomenon, χ2 (1, 283) = 5.2, p = .02, r = .13. The third prediction was also supported; sensitivity to trypophobic stimuli (i.e., TQ score) was larger in people who have heard of the condition (N = 189; TQ = 30.6; SE = 1.0) relative to those who have not (N = 94; TQ = 25.1; SE = 1.1), t(281) = 3.3, p = .001, d = .4. Overall, these data provide support for the social learning account. However, trypophobia has also been shown to exist in people who have never heard of the phenomenon.
Recall that the present experiment also asked participants to state if they could remember where they had heard of the phenomenon (if they had). The 189 respondents tended to write three or four words such as “From a friend” or “An internet article.” We placed each statement into one of six categories and calculated percentage frequencies for each. These were 64%, Internet/Social Media (e.g., Facebook, Twitter, Instagram); 17%, friend; 9% school; 4% print media/book; 3% family member; and 3% American Horror Story. This last category refers to the popular US drama series in which one of the central characters has the condition. Interestingly, one statement by a present participant made direct reference to social learning: “I suffer from it. All because of my older sister.”
General discussion
In two experiments, the present work examined a social learning account of trypophobia. Specifically, the hypothesis that the phenomenon has been driven by its wide Internet presence, particularly social media, was examined. As younger people and females are known to use this form of media more frequently than older people and males, the learning account predicts that the phenomenon should be more prevalent in younger individuals and females. Females should also be more sensitive to trypophobic stimuli. Results from Experiment 1 revealed that although females are more sensitive to hole clusters (i.e., possess the aversion to a greater degree), they are not more likely to be classified as having trypophobia. In Experiment 2, we examined trypophobia as a function of whether individuals have heard of the phenomenon or not. We found that not only is trypophobia greater in people who have heard of the phenomenon, the probability of being trypophobic is greater in those people. Although the data from Experiment 2 alone support the social learning hypothesis, most significant is the fact that the results refute the strictest version of the account, i.e., the theory that trypophobia is solely due to its ubiquitous Internet presence. We found that approximately one quarter of all trypophobic individuals had never heard of the condition.
Overall, these results suggest that although trypophobia’s wide Internet presence may have contributed to the social learning aspect of the phenomenon; this cannot be the sole explanation. This conclusion concurs with the work of Can et al. (2017) who reported that trypophobic images caused an overall discomfort effect in 4-year-old children. Suzuki et al. (2023) also observed the same effect in 4- and 5-year olds. One can presume that such young children are not so exposed (if at all) to the Internet and social media in general.
The fact that trypophobia may be influenced by its large Internet presence does not diminish the aetiology of the condition. A contribution from social learning is very much in line with many other phobias, i.e., a condition passed on via social influence in which a person becomes exposed to society’s representation and view of certain objects (e.g., snakes) and/or becomes aware of the aversion experienced by a family member (see Hagman, 1932; Jones, 1924; McNally, 1987; Solyom et al., 1974). This we argue is the more likely explanation of trypophobia than the alternative learning account, i.e., classical conditioning. Although it is true that a negative event with an object or situation can induce phobia to any stimulus, one has to explain why so many people are averse to clusters of holes. It is unlikely that this could have occurred through conditioning. Furthermore, because trypophobic stimuli have a particular spectral characteristic, i.e., high contrast at mid-range spatial frequencies (Cole & Wilkins, 2013), the response induced is likely to be modulated by viewing distance, i.e., aversion to a stimulus viewed from, say, 3 m but not from 20 cm. Such an effect could not be easily explained through conditioning.
An alternative Internet-driven account of trypophobia is that a person who was not previously aware of the condition may notice they are sensitive to holes and then seek out information via the Internet. In this scenario, the link between trypophobia and the Internet is one in which the condition came first followed by awareness and knowledge. The Internet then confirms what a person previously suspected. We will note however that when asked where they had heard about the phenomenon, only one participant stated that they learned about trypophobia in this manner. The “pure” Internet explanation of the condition in contrast suggests that social media effectively induces trypophobia in people who would never have considered that clusters of holes can be aversive to view.
With respect to non-social learning components, this is of course less easy to identify. Recall from the present Introduction that Cole and Wilkins (2013) suggested the condition may be due to an evolved sensitivity towards noxious animals. The alternative evolutionary account (e.g., Kupfer & Le, 2018) suggests that humans have evolved sensitivity towards skin pathologies. Evidence for this comes from the observation that emotional responses to trypophobia are greater when the holes are digitally placed onto human skin (Pipitone et al., 2022).
In sum, trypophobia is a phenomenon associated with a range of emotional responses; responses that can be measured both psychologically and physiologically (e.g., increased electrodermal activity; Pipitone et al., 2017 increased blood flow; Le et al., 2020). We have found that although the phenomenon does have a social learning component, the “internet meme” theory cannot solely account for the condition.
Footnotes
Acknowledgements
We thank all the participants.
Author contributions
G.C. conceived of the study, analysed the data, and wrote the first draft. A.M. oversaw data collection and assisted with manuscript editing. M.J. assisted with data collection and manuscript editing.
Declaration of conflicting interests
The author(s) declared no potential conflicts of interest with respect to the research, authorship, and/or publication of this article.
Funding
The author(s) disclosed receipt of the following financial support for the research, authorship, and/or publication of this article: The University of Essex funded the work.