
Abstract
The hand laterality task (HLT) and the foot laterality task (FLT) are used to explore motor imagery, the ability to imagine an action without executing it. With our limbs, we interact with our body, with others, and with the environment. These contacts might cause negative feelings, such as disgust. Disgust is elicited by different drivers. For instance, body products and body envelope violations provoke disgust to avoid contaminations and to avoid damaging our bodies. However, not much is known about how disgust changes our motor imagery processes. In this study, we examined whether there is any difference in the ability to imagine hands and feet when these are emotionally charged with reminders of disgust. Thirty-six participants completed an online version of a classic (neutral) HLT and FLT and two emotionally charged (disgust) versions. Our findings show that when body parts are modified so that they elicit emotional processing, disgust is salient overall, rather than being salient specifically for actions. This is true for both our hands and our feet.
Introduction
With our limbs, we interact with our body, with others, and with the surrounding environment. These contacts might elicit negative feelings, such as disgust (Olatunji et al., 2009). Disgust protects us from potentially harming stimuli (e.g., contaminated food) (Olatunji et al., 2009). Several drivers elicit disgust (Olatunji et al., 2009). In one of the most known theoretical frameworks for this emotion, seven drivers of disgust have been identified: food, animals, body products (e.g., faeces), sex (e.g., inappropriate sex acts), body envelope violations (e.g., amputations), death, and hygiene (Olatunji et al., 2009). For all these drivers, the core concept is the proximity to the body, real or perceived. As such, disgust-charged stimuli might be processed differently if compared with non-disgust-charged stimuli when motor imagery is involved. Motor imagery tasks can be considered as a proxy of the mental representation of the body in action, and research already showed a link between body representation (Ehrsson, 2012) and disgust. For example, an indirect link is provided by the presence of shared brain regions between body representation (e.g., for motor imagery and body awareness) and disgust processing, such as the insula and cingulate cortices (Badoud & Tsakiris, 2017; Berlucchi & Aglioti, 2010; Friederich et al., 2010; Jabbi et al., 2008; Schulz, 2016). Differently, using the rubber hand illusion paradigm (Botvinick & Cohen, 1998), Jalal et al. (2015) observed that, after the embodiment of the rubber hand, participants were disgusted by a stimulus placed on the fake hand as if the disgusting stimulus was placed on their own hands. Overall, these findings suggest an effect of disgust on motor imagery. The resolution of motor imagery tasks is influenced by several factors, such as pain (e.g., Coslett et al., 2010), motor limitations (e.g., Fiori et al., 2013), or limb dominance (e.g., Curtze et al., 2010). However, to the best of our knowledge, no studies explored whether the emotion of disgust influences motor imagery. Theoretically, it is important to explore the link between emotions, such as disgust, and motor imagery as in the real world, we rarely “just” perform actions in a vacuum. As for many cognitive processes, we should think of them as working together to produce coherent behaviour. Motor imagery has been mainly studied in isolation from emotions, but the studies on pain, e.g., clearly tell us that to fully comprehend this process, we do need to take into account the factors that can influence it.
Motor imagery tasks based on the laterality judgement, left or right, of limbs presented in different orientations, are commonly used (e.g., Coslett et al., 2010; Ionta et al., 2007; Scarpina et al., 2019). Examples of such tasks are provided by the hand laterality task (HLT) (Parsons, 1987b) and the foot laterality task (FLT) (Curtze et al., 2010). These tasks are solved by using a more implicit motor strategy than other tasks, as imagining rotating the position of the real limb to match that of the visual stimuli occurs without awareness (Parsons, 1987a). Two indices can be computed. The stimulus orientation effect, an index indicative of visual imagery, is computed comparing stimuli presented with an angle of rotation of 0° and 180° (Brusa et al., 2021; Conson et al., 2010; Fiori et al., 2013, 2014; Parsons, 1994; Scarpina et al., 2019; Scarpina, Bastoni, et al., 2022; Scarpina, Paschino, et al., 2022). The biomechanical constraints effect is computed comparing stimuli presented in an awkward position (270° left hand/90° right hand) versus stimuli presented in a comfortable position (90° left hand/270° right hand), and it is considered an index of motor imagery (Brusa et al., 2021; Conson et al., 2010; Fiori et al., 2013, 2014; Scarpina et al., 2019; Scarpina, Bastoni, et al., 2022; Scarpina, Paschino, et al., 2022).
Our study aimed at exploring directly the differences in the ability to mentally rotate hands and feet when stimuli are emotionally charged. For this purpose, we administered the classic versions of the HLT (Fiori et al., 2013) and FLT (Curtze et al., 2010), and two emotionally charged versions. Among the seven disgust drivers, two were selected for this specific study: body products and body envelope violations, as they might be more plausible to imagine compared with other drivers and more salient in their relation to the mental representation of the body in action. For example, it is more plausible to imagine that without a finger, grasping a cup might feel different, whereas it is not so plausible, and hence not so realistic, to imagine your hand as a zombie hand or as a paw. Other drivers have been removed because we deemed them unsuitable for the task, such as the one related to inappropriate sexual acts. Overall, we selected those drivers who make more realistic and more plausible the experiment. Thus, in the emotionally charged versions of the laterality tasks, the limbs were partially covered in faeces (“body products” driver) or with the index finger/toe amputated (“body envelope violations” driver). Laterality tasks are generally administered in laboratory-based settings (e.g., Brusa et al., 2021; Habacha et al., 2014; Ionta & Blanke, 2009). The COVID-19 pandemic affected the possibility to run laboratory studies. Therefore, we adapted the HLT and the FLT for an online administration (e.g., Stone et al., 2019). Participants also completed two self-report questionnaires exploring, respectively, disgust sensitivity (Olatunji et al., 2007) and interoceptive body awareness (Mehling et al., 2018). Disgust sensitivity can be defined as a predisposition to experiencing disgust in response to different types of aversive stimuli (de Jong & Merckelbach, 1998). Interoceptive body awareness has a key role in the definition of the sense of belonging for our body parts (Badoud & Tsakiris, 2017). As the task is based on disgust and the imagination of limbs, we reasoned it is important to ensure that our participants do not have extreme sensitivity to disgust and an extreme interoception ability. This would not be representative of the population. The two self-report questionnaires have been then used to screen participants after data collection to ensure none of the participants had extreme scores.
At a preliminary level (laterality tasks—Analysis 1), we compared hands and feet in the non-emotionally charged versions of the tasks to expand previous findings (Fiorio et al., 2006; Ionta & Blanke, 2009; Ionta et al., 2007) but also to ensure any result on emotions is not due to basic differences between the mental representation of hands and feet in action (i.e., specific pattern of responses highlighting differences in the mental representation of hands and feet in action). We considered the role of limb dominance. We expected a stronger biomechanical constraints effect for hands compared with feet because of mechanical reasons (i.e., feet as more mechanically constrained) (Holowka & Lieberman, 2018; Pouydebat et al., 2008; Schieber & Santello, 2004). As for dominance, we hypothesised a better performance in dominant limbs (e.g., Curtze et al., 2010; Fiorio et al., 2006; Nico et al., 2004).
Core to our study (laterality tasks—Analyses 2 and 3), separately for hands and feet, we tested if any difference occurs between the normal version of the tasks and the emotionally charged versions, and explored the role of limb dominance. Comfortable positions are the ones in which the limb is closer to the body (across from the body’s midsagittal plane) (Parsons, 1987a, 1994), and contamination should be more salient (Olatunji et al., 2009). The presence of a disgusting stimulus on the limb should foster faster reaction times (RTs). Being the difference in recognising awkward and comfortable positions at the base of the biomechanical constraints effect index (Fiori et al., 2013), this should elicit a greater difference between awkward and comfortable position recognition. Therefore, we predicted stronger biomechanical constraint effects when disgust stimuli must be processed, providing evidence of the influence of disgust on motor imagery. Second, we explored whether the disgust drivers chosen by us differently influence the resolution of the HLT and FLT. Due to the lack of literature on the influence of disgust on motor imagery, we cannot make a prediction on this. However, hands and feet significantly differ from each other functionally and biologically (Gabbard, 2008; Luo et al., 2007; Penfield & Rasmussen, 1950); as such, it is worth exploring limb-specific differences. In terms of dominance, we expected a greater effect of disgust on the dominant limb (Curtze et al., 2010; Fiorio et al., 2006; Nico et al., 2004).
As well as considering the limbs separately, we explored if the two disgust drivers affect differently hands and feet (laterality tasks—Analysis 4).
Methods
The full methods (e.g., stimuli, the syntax used to deliver the experiment, the Excel sheets for data processing, and the raw and processed data) used in this study can be downloaded from the OSF page: https://osf.io/eqdng/.
Sample
Thirty-six healthy individuals (M age ± SD: 24.67 years ± 8.98 years; M education ± SD: 16.38 years ± 3.42 years; 29 females) completed the study on the PsyToolkit online platform (https://www.psytoolkit.org/) (Stoet, 2010, 2017). Participants were recruited through social media (Facebook, Twitter), word of mouth, and personal and professional contacts. To verify the eligibility of participants, we developed and used a series of questions to exclude those individuals who presented conditions that might influence the reliability of the data (Table 1).
Screening questions asked to participants.
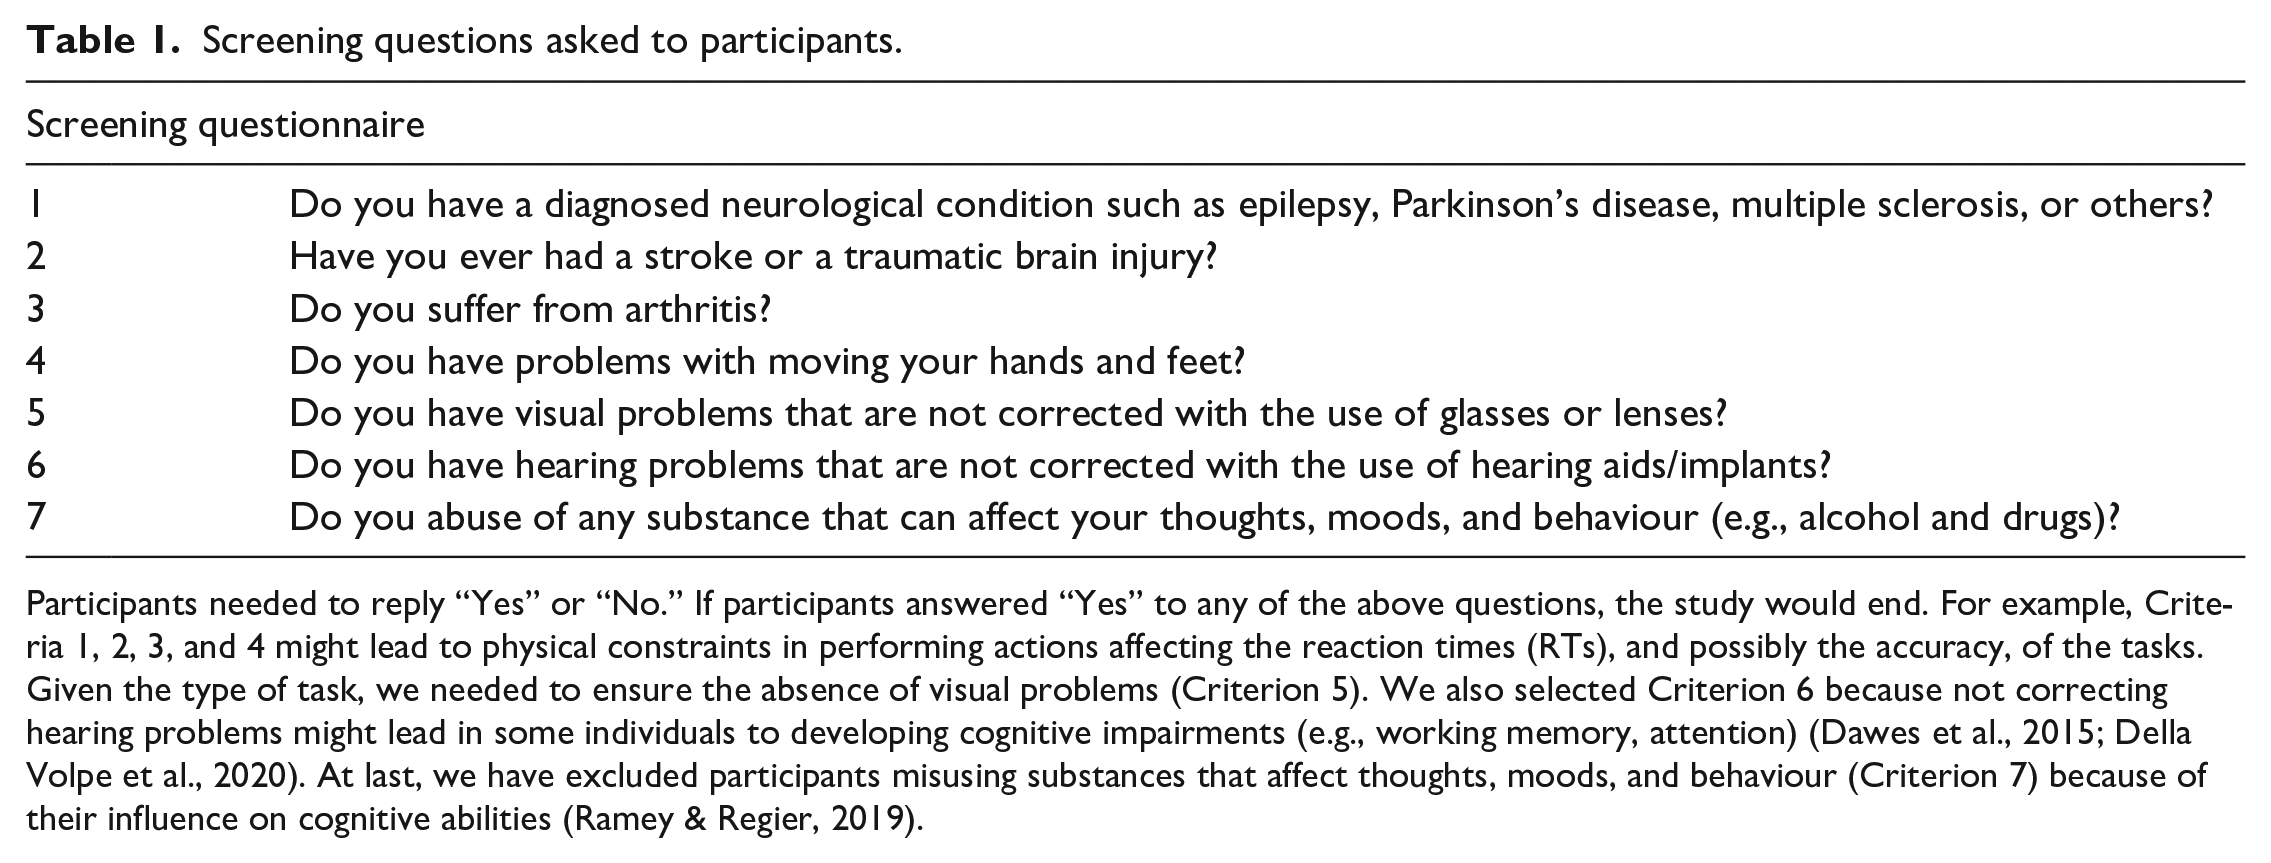
Participants needed to reply “Yes” or “No.” If participants answered “Yes” to any of the above questions, the study would end. For example, Criteria 1, 2, 3, and 4 might lead to physical constraints in performing actions affecting the reaction times (RTs), and possibly the accuracy, of the tasks. Given the type of task, we needed to ensure the absence of visual problems (Criterion 5). We also selected Criterion 6 because not correcting hearing problems might lead in some individuals to developing cognitive impairments (e.g., working memory, attention) (Dawes et al., 2015; Della Volpe et al., 2020). At last, we have excluded participants misusing substances that affect thoughts, moods, and behaviour (Criterion 7) because of their influence on cognitive abilities (Ramey & Regier, 2019).
As we did not have a reason to only include right-handed participants, and no previous hypothesis on a specific role of right- and left-handedness, we enrolled both right-handed and left-handed participants. Handedness and footedness were assessed using the questionnaire developed by Coren (1993). Data from the Coren (1993) questionnaire were used to define the factor Limb as dominant or not dominant in the analyses. Our sample was composed of three of left-handedness and 33 of right-handedness participants. Differently, 4 of the participants reported left-footedness, whereas 32 reported right-footedness. As mentioned in the “Introduction” section, to ensure that participants do not represent extremes of the population, we also asked them to compete the Disgust Scale-Revised (Olatunji et al., 2007), and a scale for interoceptive body awareness, the Multidimensional Assessment of Interoceptive Awareness-2 (Mehling et al., 2018). Both measures indicated our sample is within the normal range (i.e., scores within the 2 SDs for the Disgust Scale-Revised and scores within 1 SD for the Multidimensional Assessment of Interoceptive Awareness-2).
Written informed consent was obtained before participation. The study was designed according to the relevant subset of the ethical standards of the Declaration of Helsinki more related to psychological studies (e.g., this is not medical research, and due to the absence of medical supervision, Criterion 12 cannot be met) and received approval from the local ethical committee at Heriot-Watt University (approval number: 2020-0669-2680).
Instrument used
HLT (Fiori et al., 2013), FLT (Curtze et al., 2010), and emotionally charged versions were used.
Participants were asked to complete three different versions of the HLT and FLT: classic version, body product version, and body envelope violation version (Figure 1). In the two emotionally charged versions of the tasks, hands and feet were characterised by a disgusting feature, the presence of faeces (body products driver), or by the amputation of the index finger/toe (body envelope violations driver) (Olatunji et al., 2009).
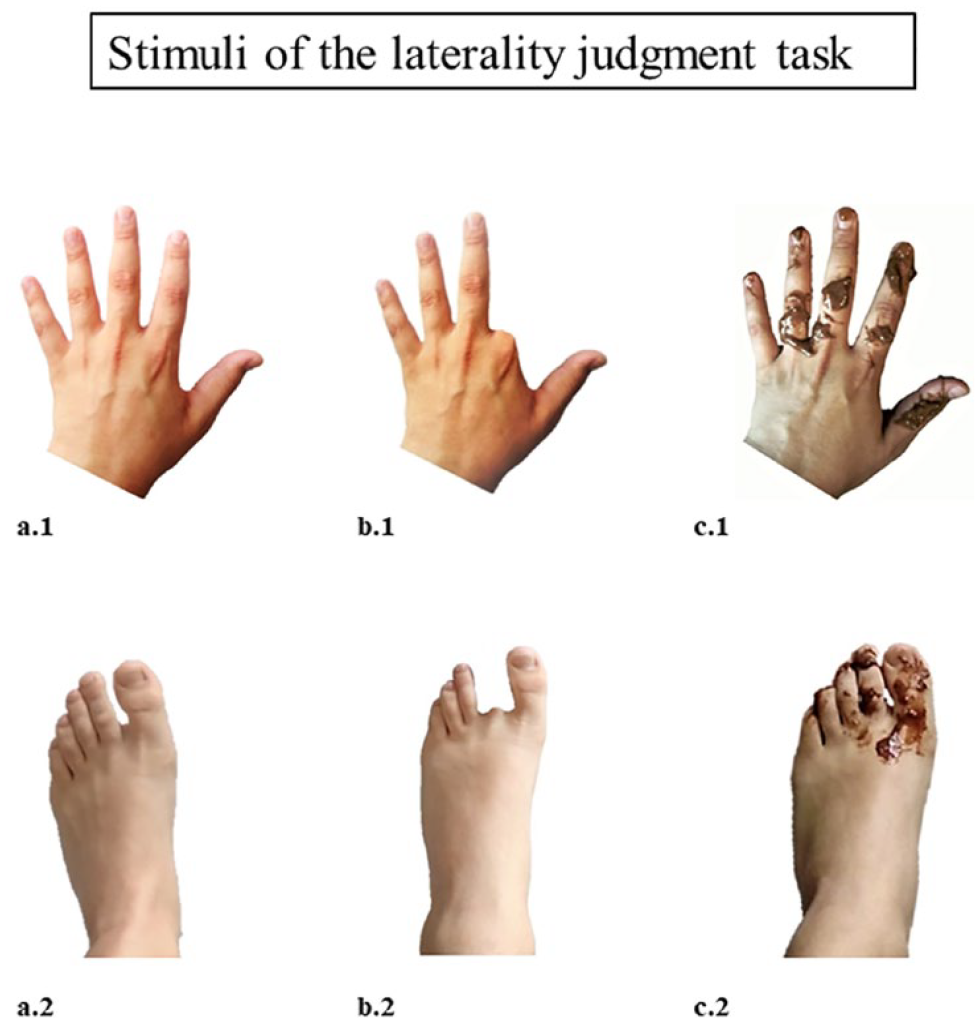
Example of the hand stimuli used in the classic HLT and its variants (a.1, b.1, c.1) and of the foot stimuli in the classic FLT and its variants (a.2, b.2, c.2). The limbs shown here are all left limbs in the back perspective, at 0° of the angles of rotation.
The task structure was the same independently from the presence of the disgusting features and was based on previous studies using the same task for hands (Brusa et al., 2021; Fiori et al., 2013, 2014; Scarpina et al., 2019). Right-back/palm and left-back/palm pictures of hands (HLT) and feet (FLT) were presented at a 0°, 90°, 180°, and 270° orientation, to be able to compute the stimulus orientation effect and the biomechanical constraints effect (Brusa et al., 2021; Conson et al., 2010; Fiori et al., 2013, 2014; Scarpina et al., 2019; Scarpina, Bastoni, et al., 2022; Scarpina, Paschino, et al., 2022). Eight pictures of the right limb and eight pictures of the left limb in back or palm perspective were used, leading to an overall of 16 pictures for hands and feet. We presented participants with 48 trials for Block 1 and 48 trials for Block 2: each stimulus was presented 6 times (3 times in the first block and 3 times in the second block) in a randomised order. Each of the two experimental blocks was preceded by a practice block (i.e., six stimuli were randomly selected from the full data set). To answer, participants used the “z” and “m” keys of the keyboard, with their left and right index fingers, respectively. The task asked participants to judge if the stimulus they were seeing was a right or left hand/foot, by pressing, as quickly and as accurately as possible, the “z” key to select left limb or the “m” key to select right limb, with a reversed order in the other block (i.e., the “z” key to select the right limb or the “m” key to select the left limb) to avoid learning effects, and ensure constant attention from the participant (Brusa et al., 2021; Scarpina et al., 2019; Scarpina, Bastoni, et al., 2022; Scarpina, Paschino, et al., 2022). Each trial was preceded by a fixation cross lasting between 1,000 and 1,500 ms. The target disappeared as soon as the participant pressed the answer key. As previously done, we left a window of 5,000 ms, after which the task automatically proceeded to the next trial if the participant did not answer any key (Curtze et al., 2010). For each trial, we recorded RTs in milliseconds (correct answers only) and the answers provided by the participants. Average RTs in milliseconds and average accuracy (the percentage of correct answers) were calculated for each combination of orientation and posture. However, to ensure that some sort of consistency was achieved, participants always started with the normal version of the HLT or the FLT. Block order was pseudo-randomised for the other tasks (emotionally charged) between participants to avoid learning effects and carryover effects.
Procedure
Figure 2 shows the flowchart of the experimental procedure. The study duration was expected to be up to 1.5 hr maximum. Participants were allowed six breaks (up to 10 min per break).
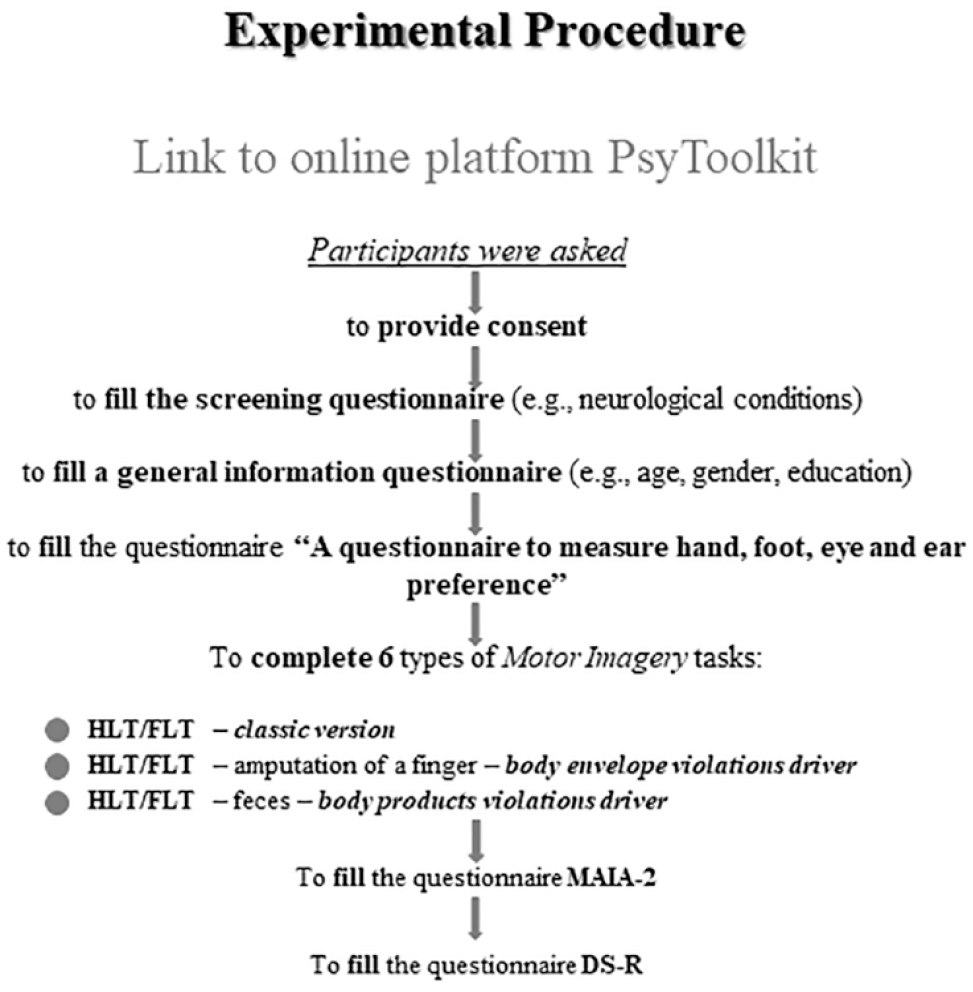
Flowchart of the experimental procedure.
Analysis pipeline
Power analysis
To compute the sample size necessary to observe the effect if present, a power analysis has been performed using G*Power 3.1 (Erdfelder et al., 2009; Faul et al., 2007). We carried out three different power analyses, related to our four main analyses. In each of the power analyses carried out, we considered a repeated-measures analysis of variance (RM ANOVA).
For Analysis 1, the factors were Limb (hand vs foot), Posture (comfortable vs awkward), and Dominance (dominant vs non-dominant). For Analyses 2 and 3, the factors were Disgust (normal vs body product vs body envelope violation), Posture (comfortable vs awkward), and Dominance (dominant vs non-dominant). While for Analysis 4, the factors were Limb (hand vs foot), Disgust (normal vs body product vs body envelope violation), and Posture (comfortable vs awkward), Dominance was not of interest for this analysis.
Previous studies using the same laterality tasks report an effect size (η2), derived from RM ANOVAs, ranging from .13 to .73 (Brusa et al., 2021; Scarpina et al., 2019). In this study, stimuli were modified for some tasks, the emotionally charged ones, and this modification does not guarantee a high effect size. Thus, we opted for an effect size meaningful but not extreme (.20). We selected an a priori power of 1 − β = .95, with an alpha error probability of α = .05, 1 group, and 8 measurements for Analysis 1, while 12 measurements for Analyses 2, 3, and 4.
The sample sizes resulted from the power analyses ranged between 28 (Analyses 2, 3, and 4) and 36 (Analysis 1). As such, we opted for an overall sample size of n = 36, providing a power of 95%.
Data analysis
Data can be downloaded from the OSF page: https://osf.io/eqdng/. Data were analysed with Statistical Package for Social Science (IBM® SPSS® Statistic, Version 26). The alpha level was set at p < .05 for all analyses. Where necessary, if the assumption of sphericity was violated at the Mauchly’s sphericity test, the Greenhouse–Geisser correction coefficient epsilon was used to correct the degrees of freedom.
For the RTs, trials in which participants gave the wrong response were discarded from the analyses. For the remaining trials, where participants gave the right answer, a cut-off of 2 SDs above and below the individual mean was used to remove outlier responses in other words anticipation and/or lack of attention, respectively (Ratcliff, 1993; Scarpina et al., 2019).
After removing RTs’ outliers, for accuracy at the HLT and FLT, classic versions, we used a threshold of 50% accuracy for the stimuli displayed at 0° (the easiest stimuli, on which one should not expect errors) to remove responses that could indicate random guessing (Brusa et al., 2021; Scarpina et al., 2019). The totality of the responses of the participants was suppressed in such a case. For the HLT, the average of all four stimuli at 0° was used. In the FLT, we used stimuli displayed at 0° in back view only as this is the most common view for feet. Four participants were discarded because did not survive the data processing. Therefore, new participants were recruited to replace these four through the recruitment to ensure the sample size of 36 was still met.
We did not process the HLT and FLT emotionally charged response the same way, as the modified stimuli might lead to different responses, and removing answers would bias the results. This is because accuracy is a different parameter from RTs, where it is easier to identify as lack of attention or distraction answers. In addition, errors have a different meaning.
Comparing non-emotional hands and feet—Analysis 1
After data pre-processing, RTs and average accuracy for each orientation (0°; 90°; 180°; 270°) and perspective (palm, back), for the left and right limbs separately, have been calculated. This first step has been carried out also for Analyses 2, 3, and 4.
To explore the effect of the stimulus orientation, we used a 2 by 2 by 2 RM ANOVA with Limb (hand vs foot) by Angle of rotation (0° vs 180°) by Dominance (dominant vs non-dominant) as within-subjects’ factors. The same analysis has been conducted for the biomechanical constraints effect, with the only difference being the factor Posture (comfortable vs awkward) replacing the factor Angle of rotation.
Hands pattern and feet pattern—Analyses 2 and 3
To explore the effect of the stimulus orientation, we used a 3 by 2 by 2 RM ANOVA with Disgust (normal vs body product vs body envelope violation) by Angle of rotation (0° vs 180°) by Dominance (dominant vs non-dominant) as within-subjects’ factors. To evaluate the biomechanical constraints effect, the factor Angle of rotation was replaced by the Posture (comfortable vs awkward).
Hands versus feet—Analysis 4
To explore the effect of the stimulus orientation, we used a 2 by 3 by 2 RM ANOVA with Limb (hand vs foot), Disgust (normal, body product vs body envelope violation), and Angle of rotation (0° vs 180°) as within-subjects’ factors. The same analysis has been applied to biomechanical constraints effect with Posture (comfortable vs awkward) replacing Angle of rotation.
Results
Comparing non-emotional hands and feet—Analysis 1
Due to the extensive literature on the normal version of the tasks, we describe the full results within the online Supplementary material 1, while focusing here on a summary of the most interesting aspect, which should be kept in mind also for the following results. In our online task, participants were more accurate (but not faster) when presented with hands compared with feet, for both the stimulus orientation effect and the biomechanical constraints effect.
Hands pattern—Analysis 2
Stimulus orientation effect
Table 2 summarises the results of this analysis. Our data show a stable stimulus orientation effect in both RTs and accuracy for hands. The interactions, observed in both RTs and accuracy between Disgust and Angle of rotation, go one step further and identify body products (faeces) as the specific driver which influences participant performance.
The table includes the results of the analysis.
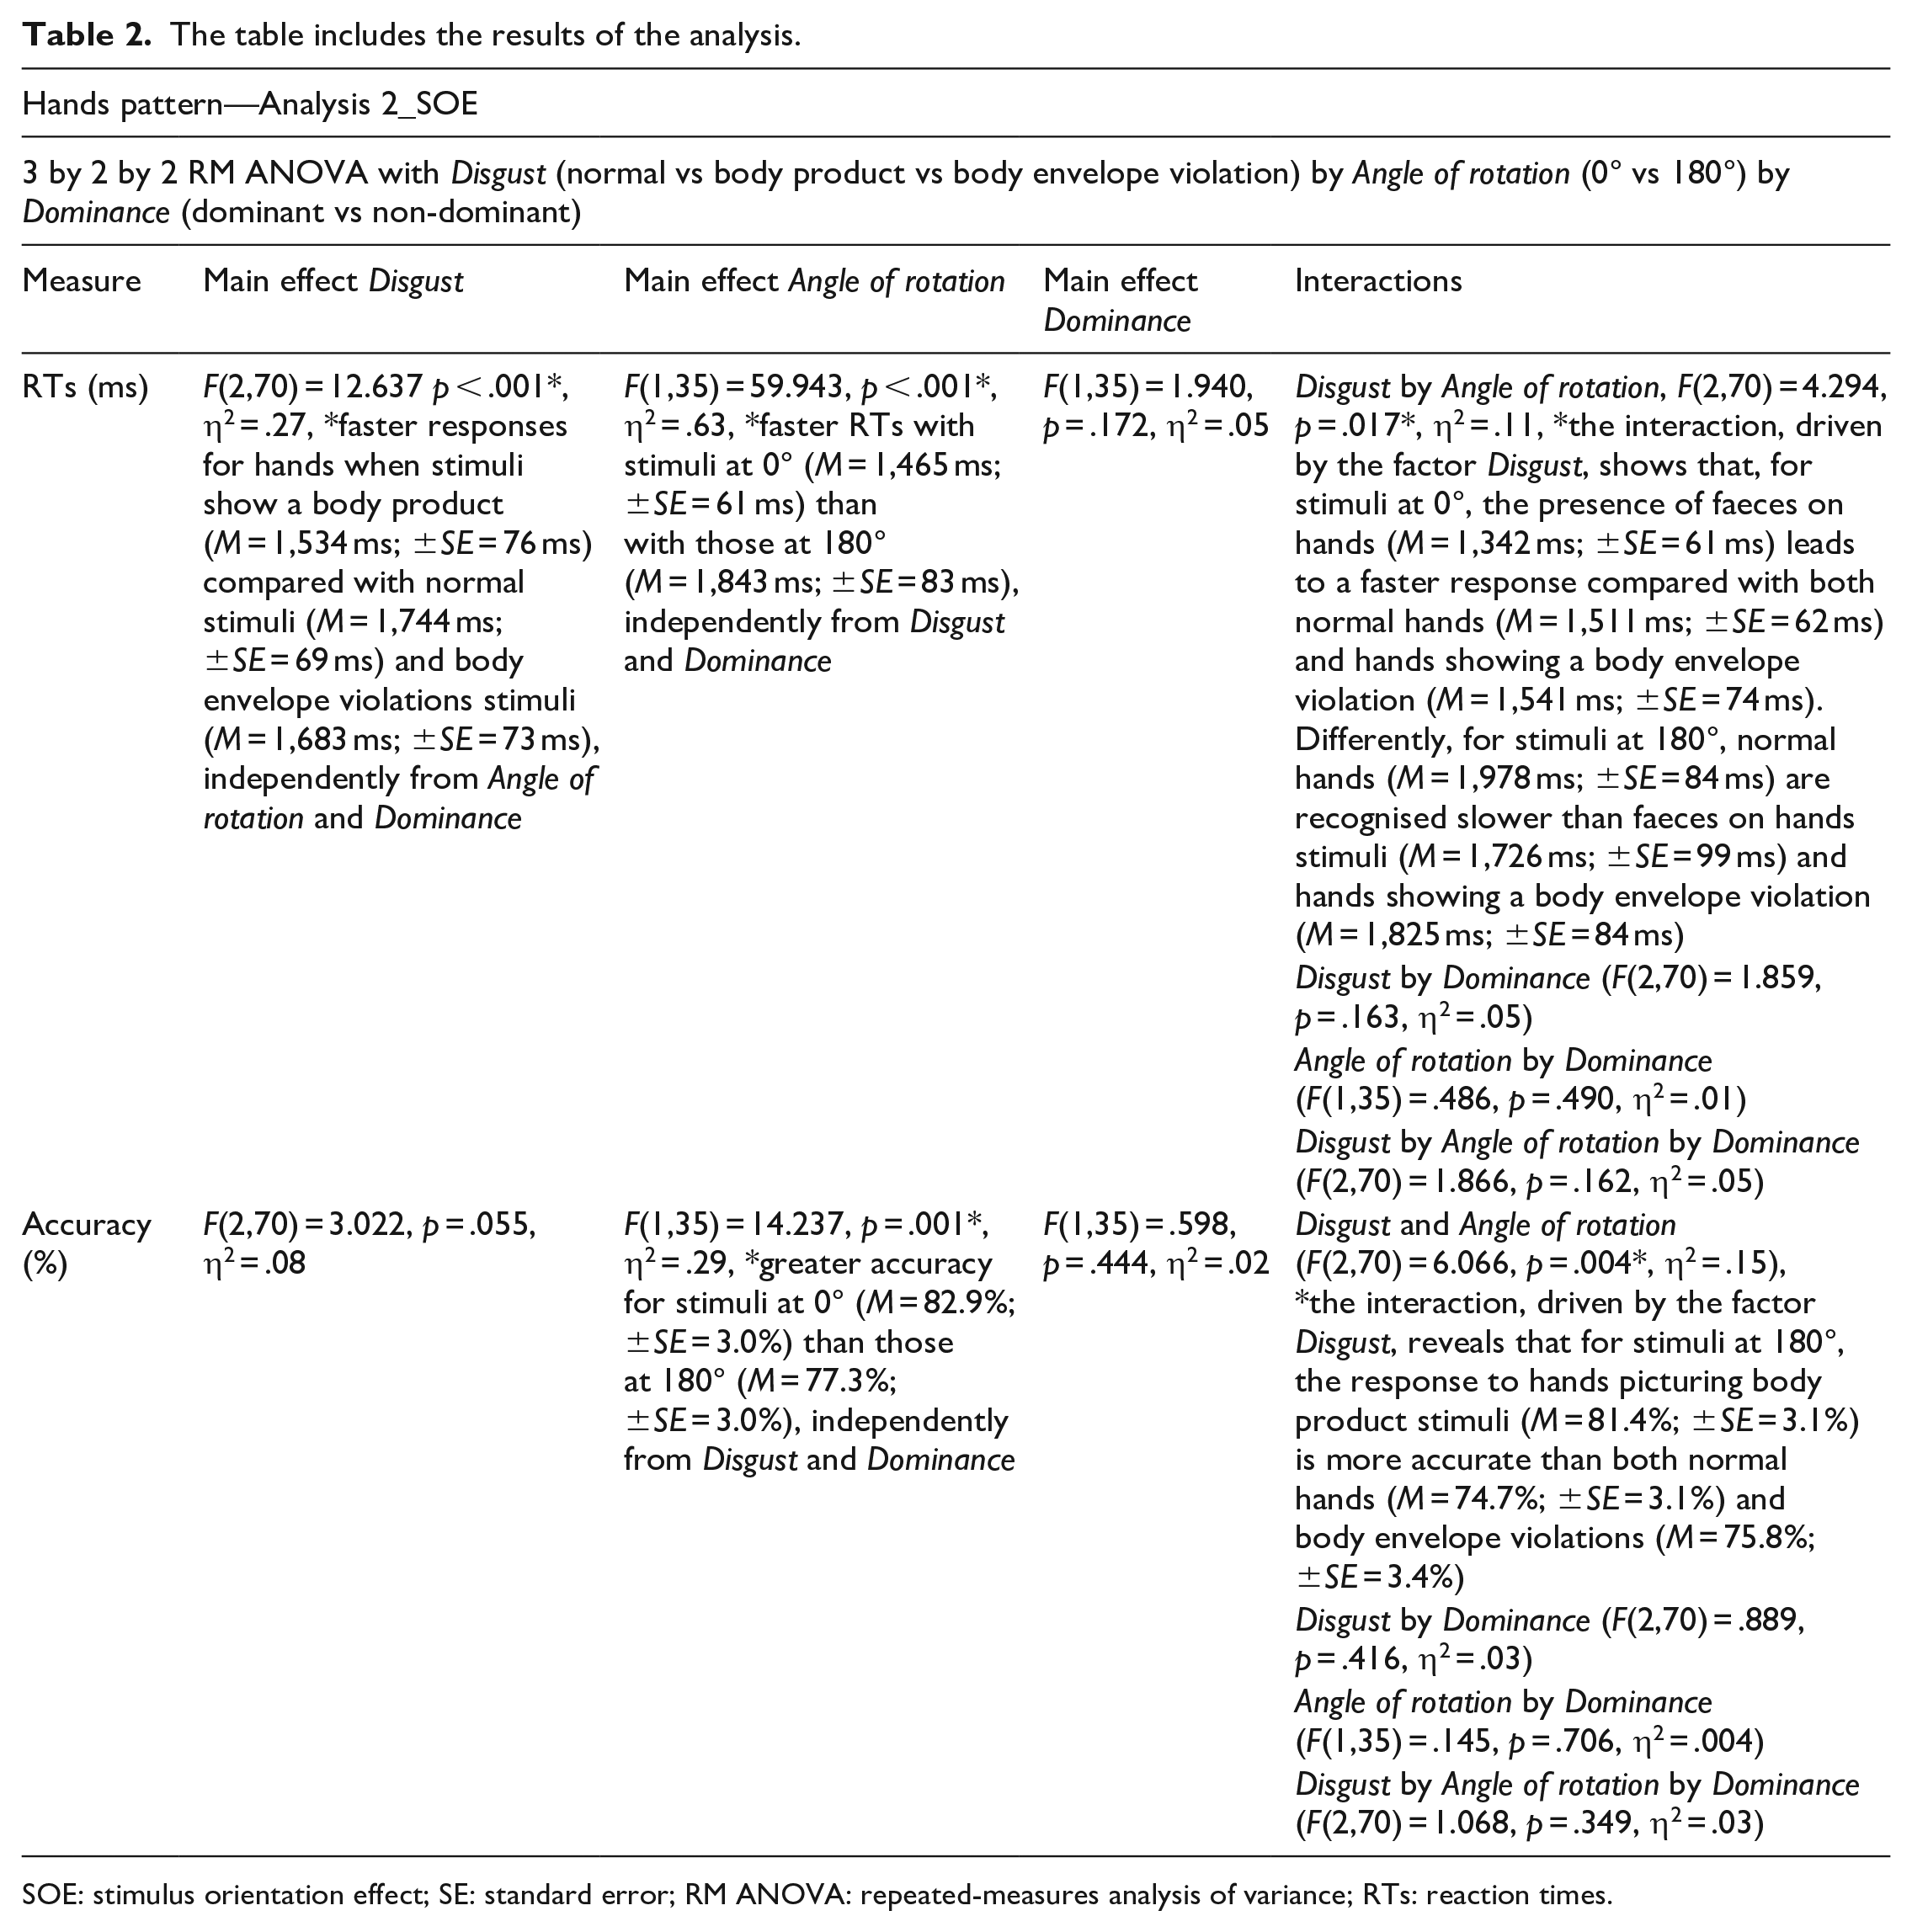
SOE: stimulus orientation effect; SE: standard error; RM ANOVA: repeated-measures analysis of variance; RTs: reaction times.
Biomechanical constraints effect
Results are summarised in Table 3 (Figure 3). We find a stable biomechanical constraints effect in both RTs and accuracy for hands. Among the disgust drivers we used in this experiment, body product only seems to affect motor imagery of participants.
The table includes the results of the analysis.
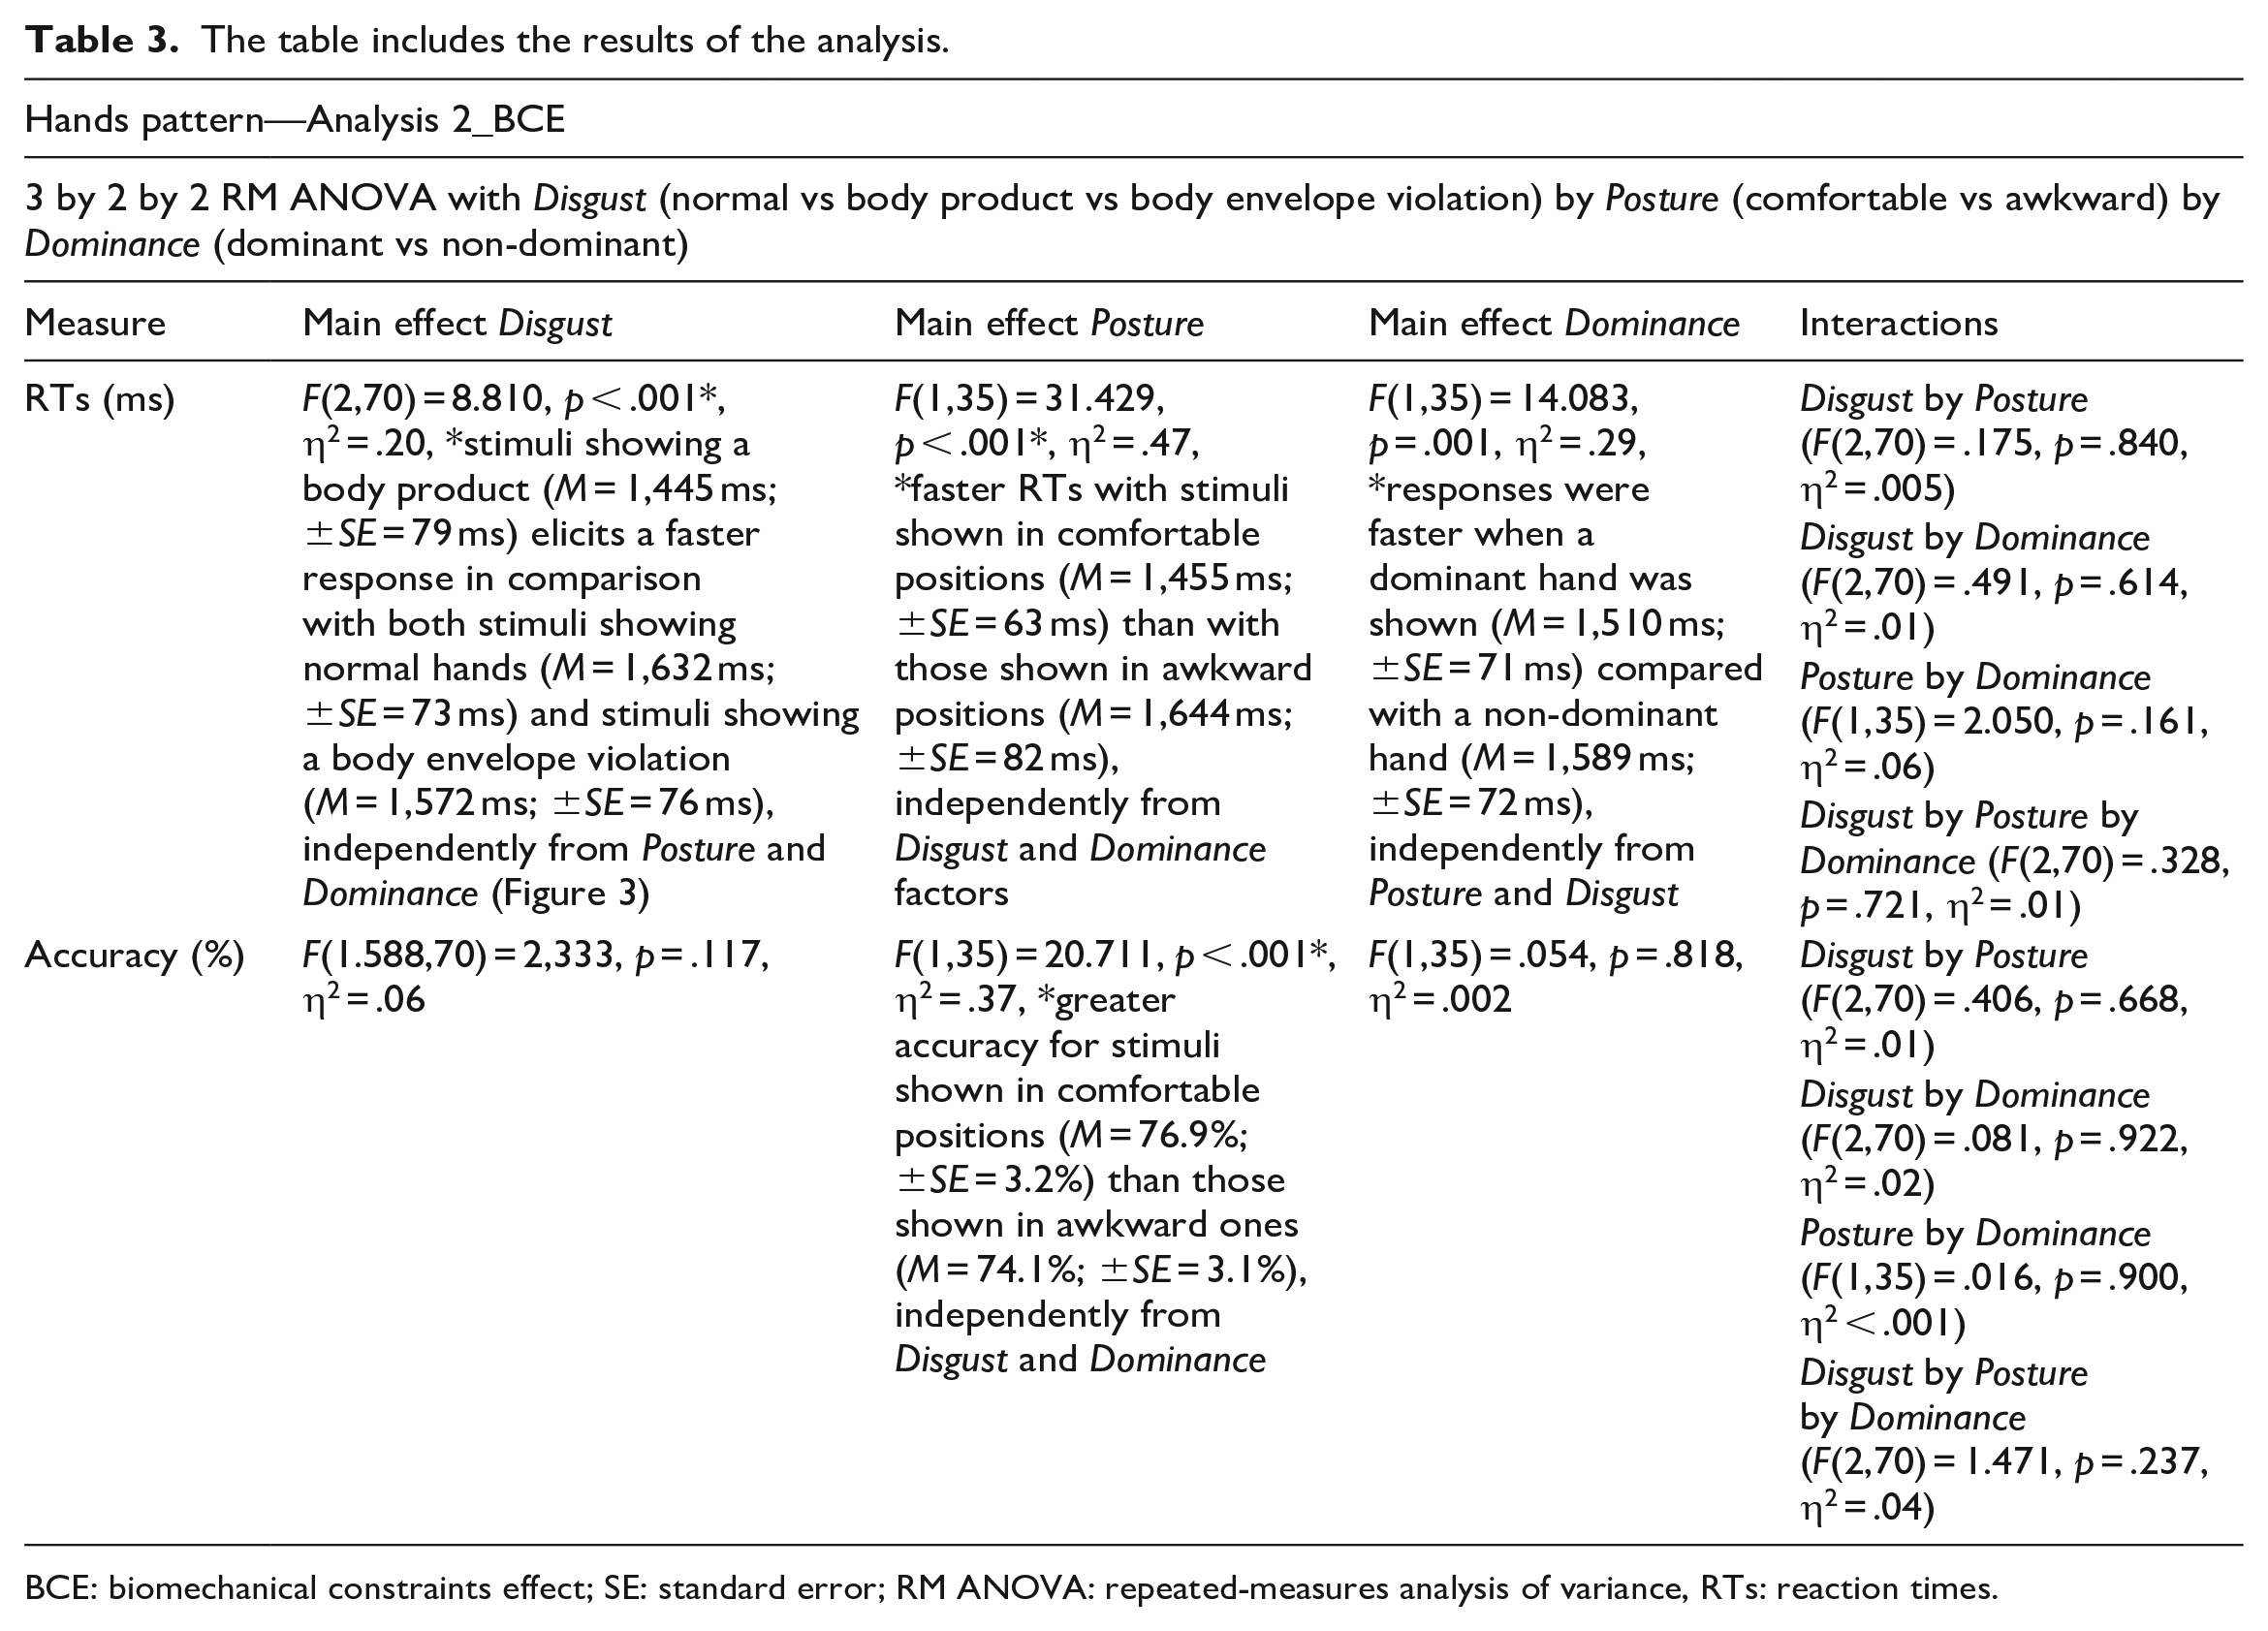
BCE: biomechanical constraints effect; SE: standard error; RM ANOVA: repeated-measures analysis of variance, RTs: reaction times.
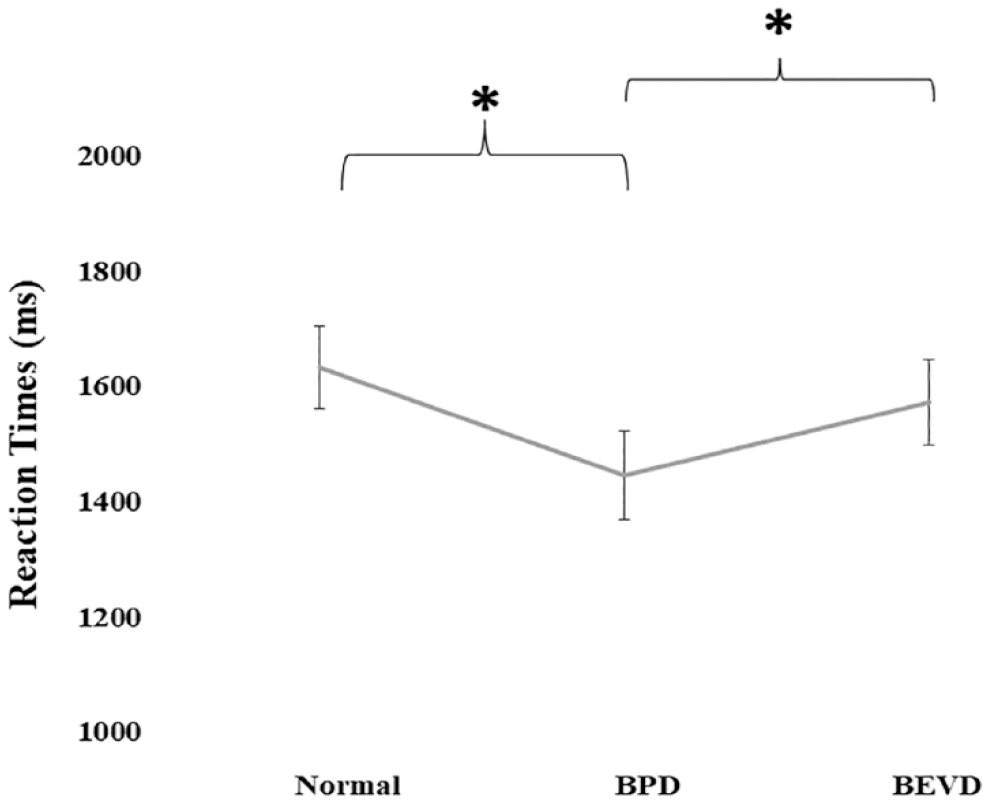
The graph shows the significant differences (lines and asterisks) observed within the factor Disgust. Responses were faster when hands were emotionally charged with faeces. Bars represent the standard error of the mean. The y-axis represents the RTs expressed in milliseconds. Normal = non-emotionally charged stimuli; BPD = body products driver; BEVD = body envelope violations driver; RTs: reaction times.
Feet pattern—Analysis 3
Stimulus orientation effect
Results are reported in Table 4. Our results indicate a stable stimulus orientation effect in both RTs and accuracy for feet. As for hands, body products drivers, in particular, influence the judgement of laterality in feet.
The table includes the results of the analysis.
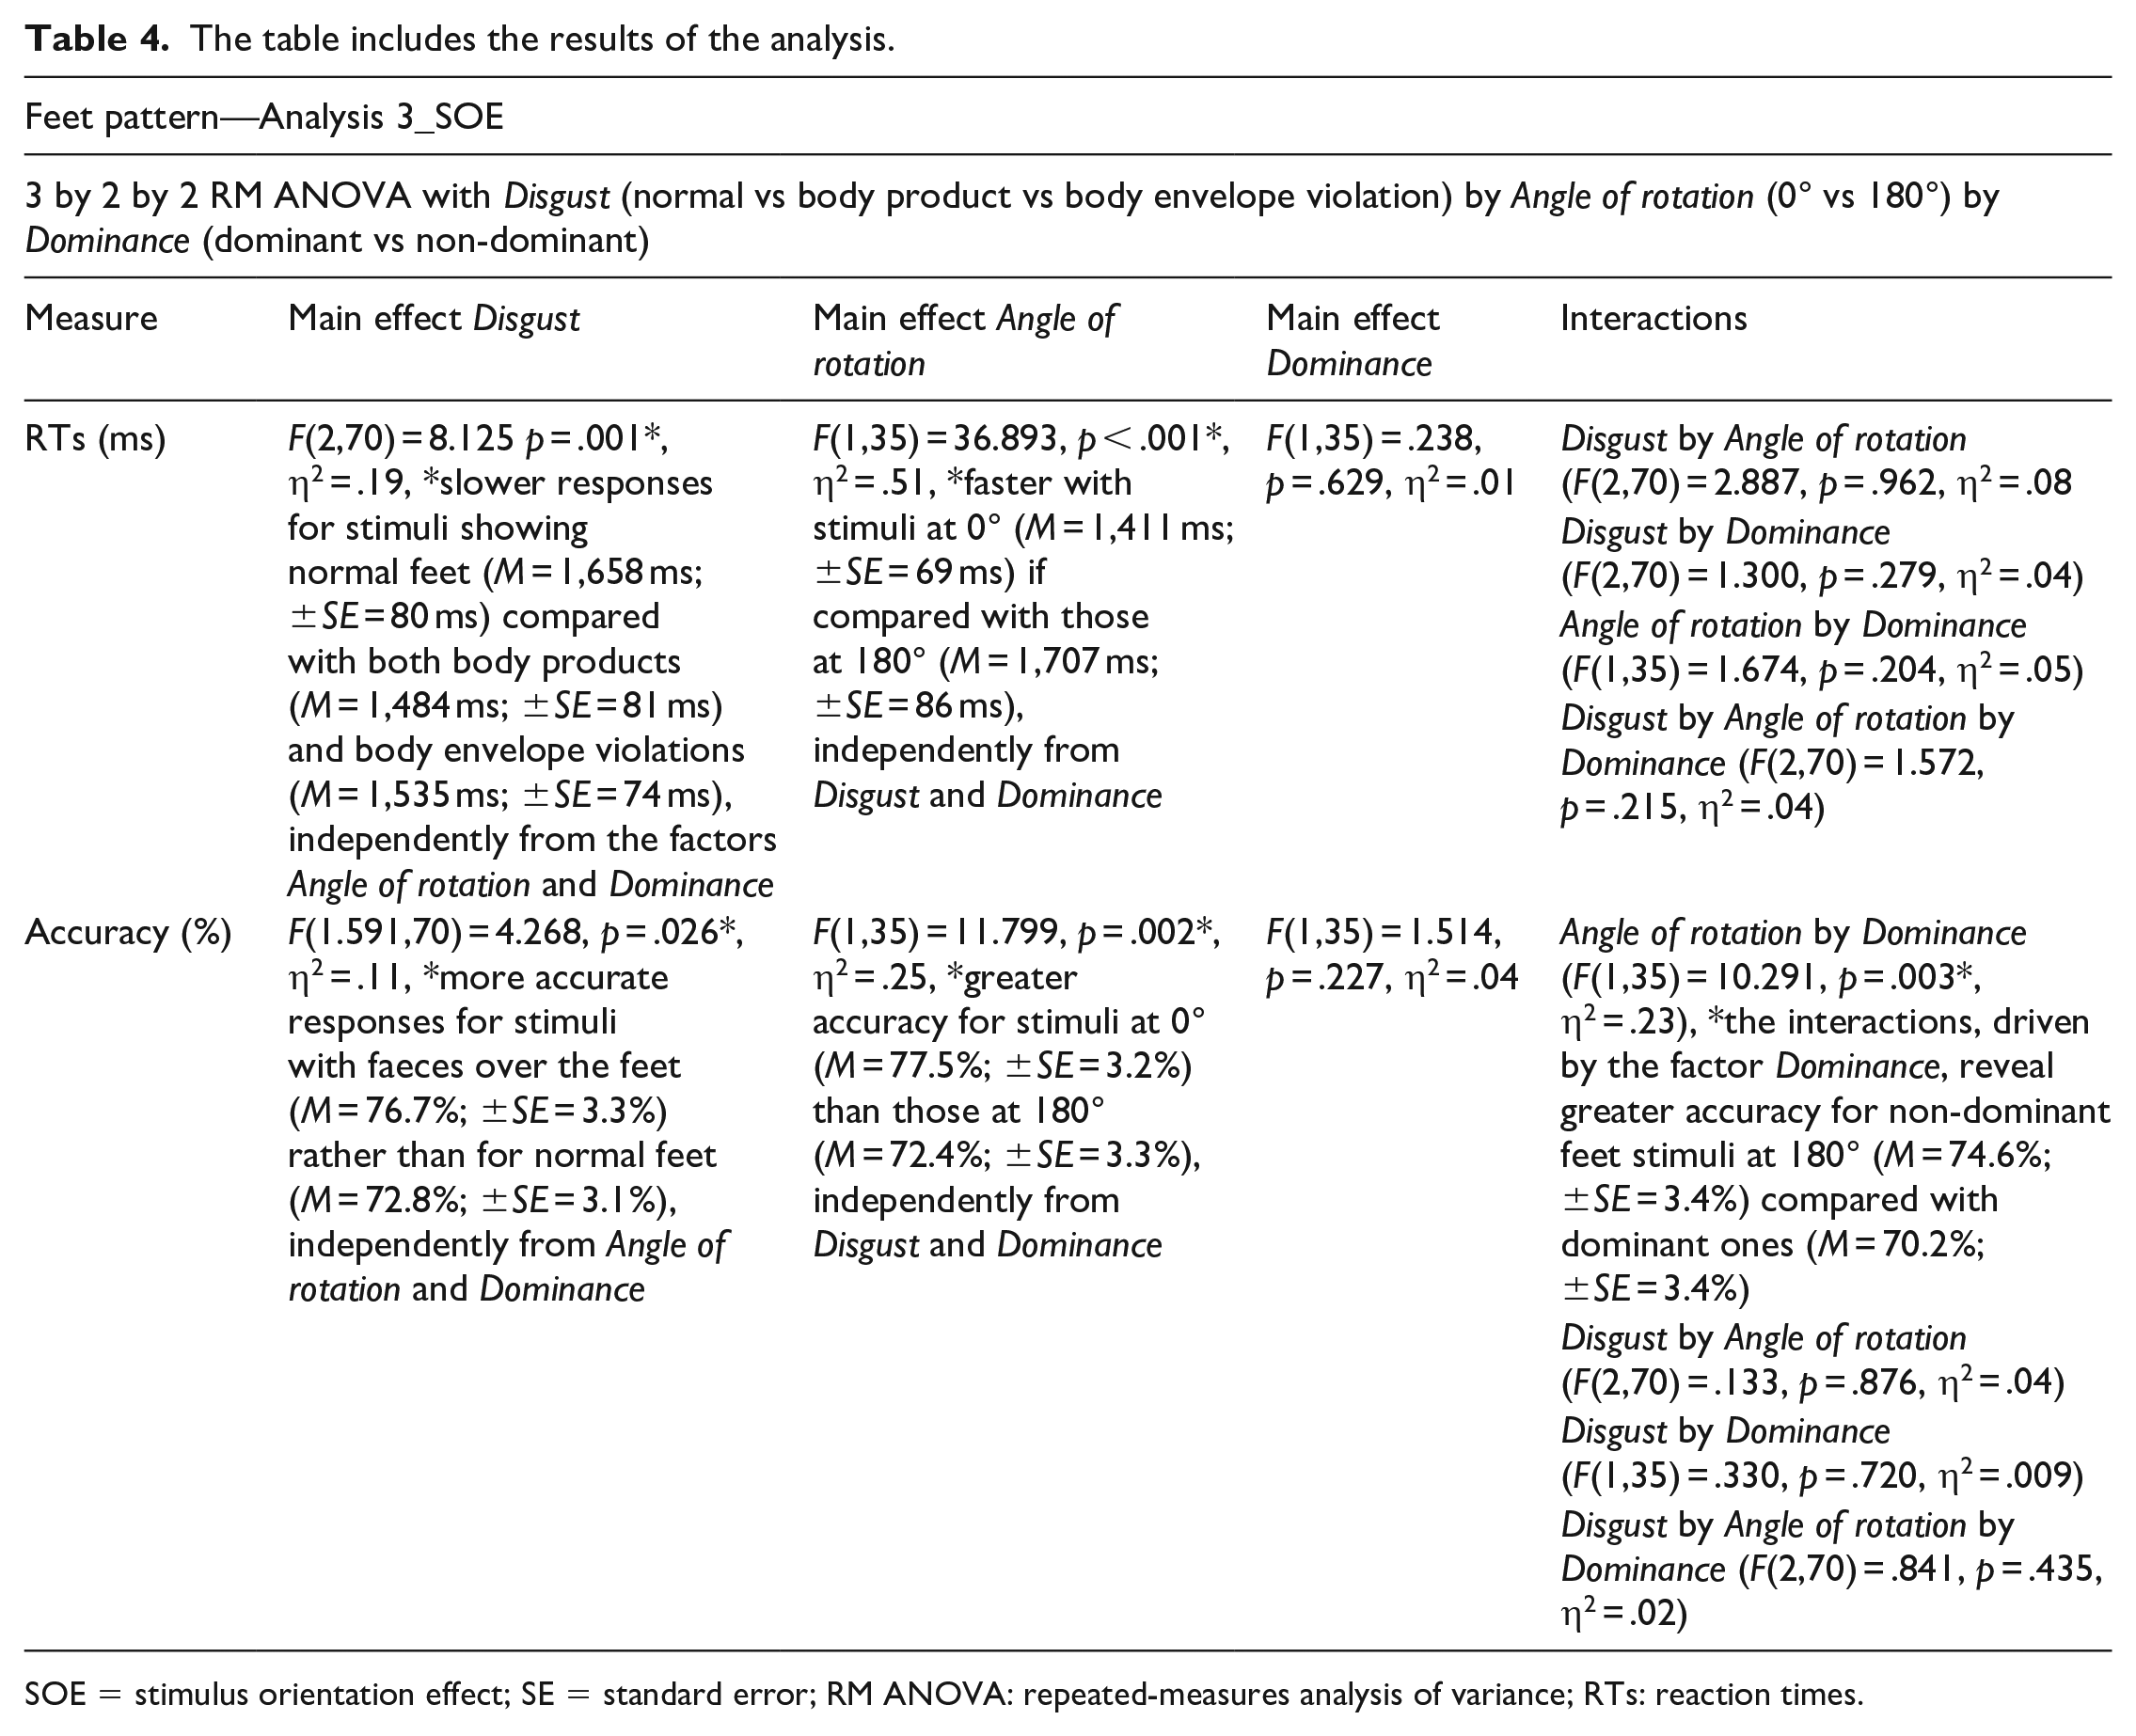
SOE = stimulus orientation effect; SE = standard error; RM ANOVA: repeated-measures analysis of variance; RTs: reaction times.
Biomechanical constraints effect
Results are reported in Table 5 (Figure 4). Differently from hands, in feet, we observed a biomechanical constraints effect in RTs only. This finding follows what is observed in the results of Analysis 1. Among the disgust drivers, similarly to what we observed for hands, the body products driver only seems to be able to influence the motor imagery skills of participants.
The table includes the results of the analysis.
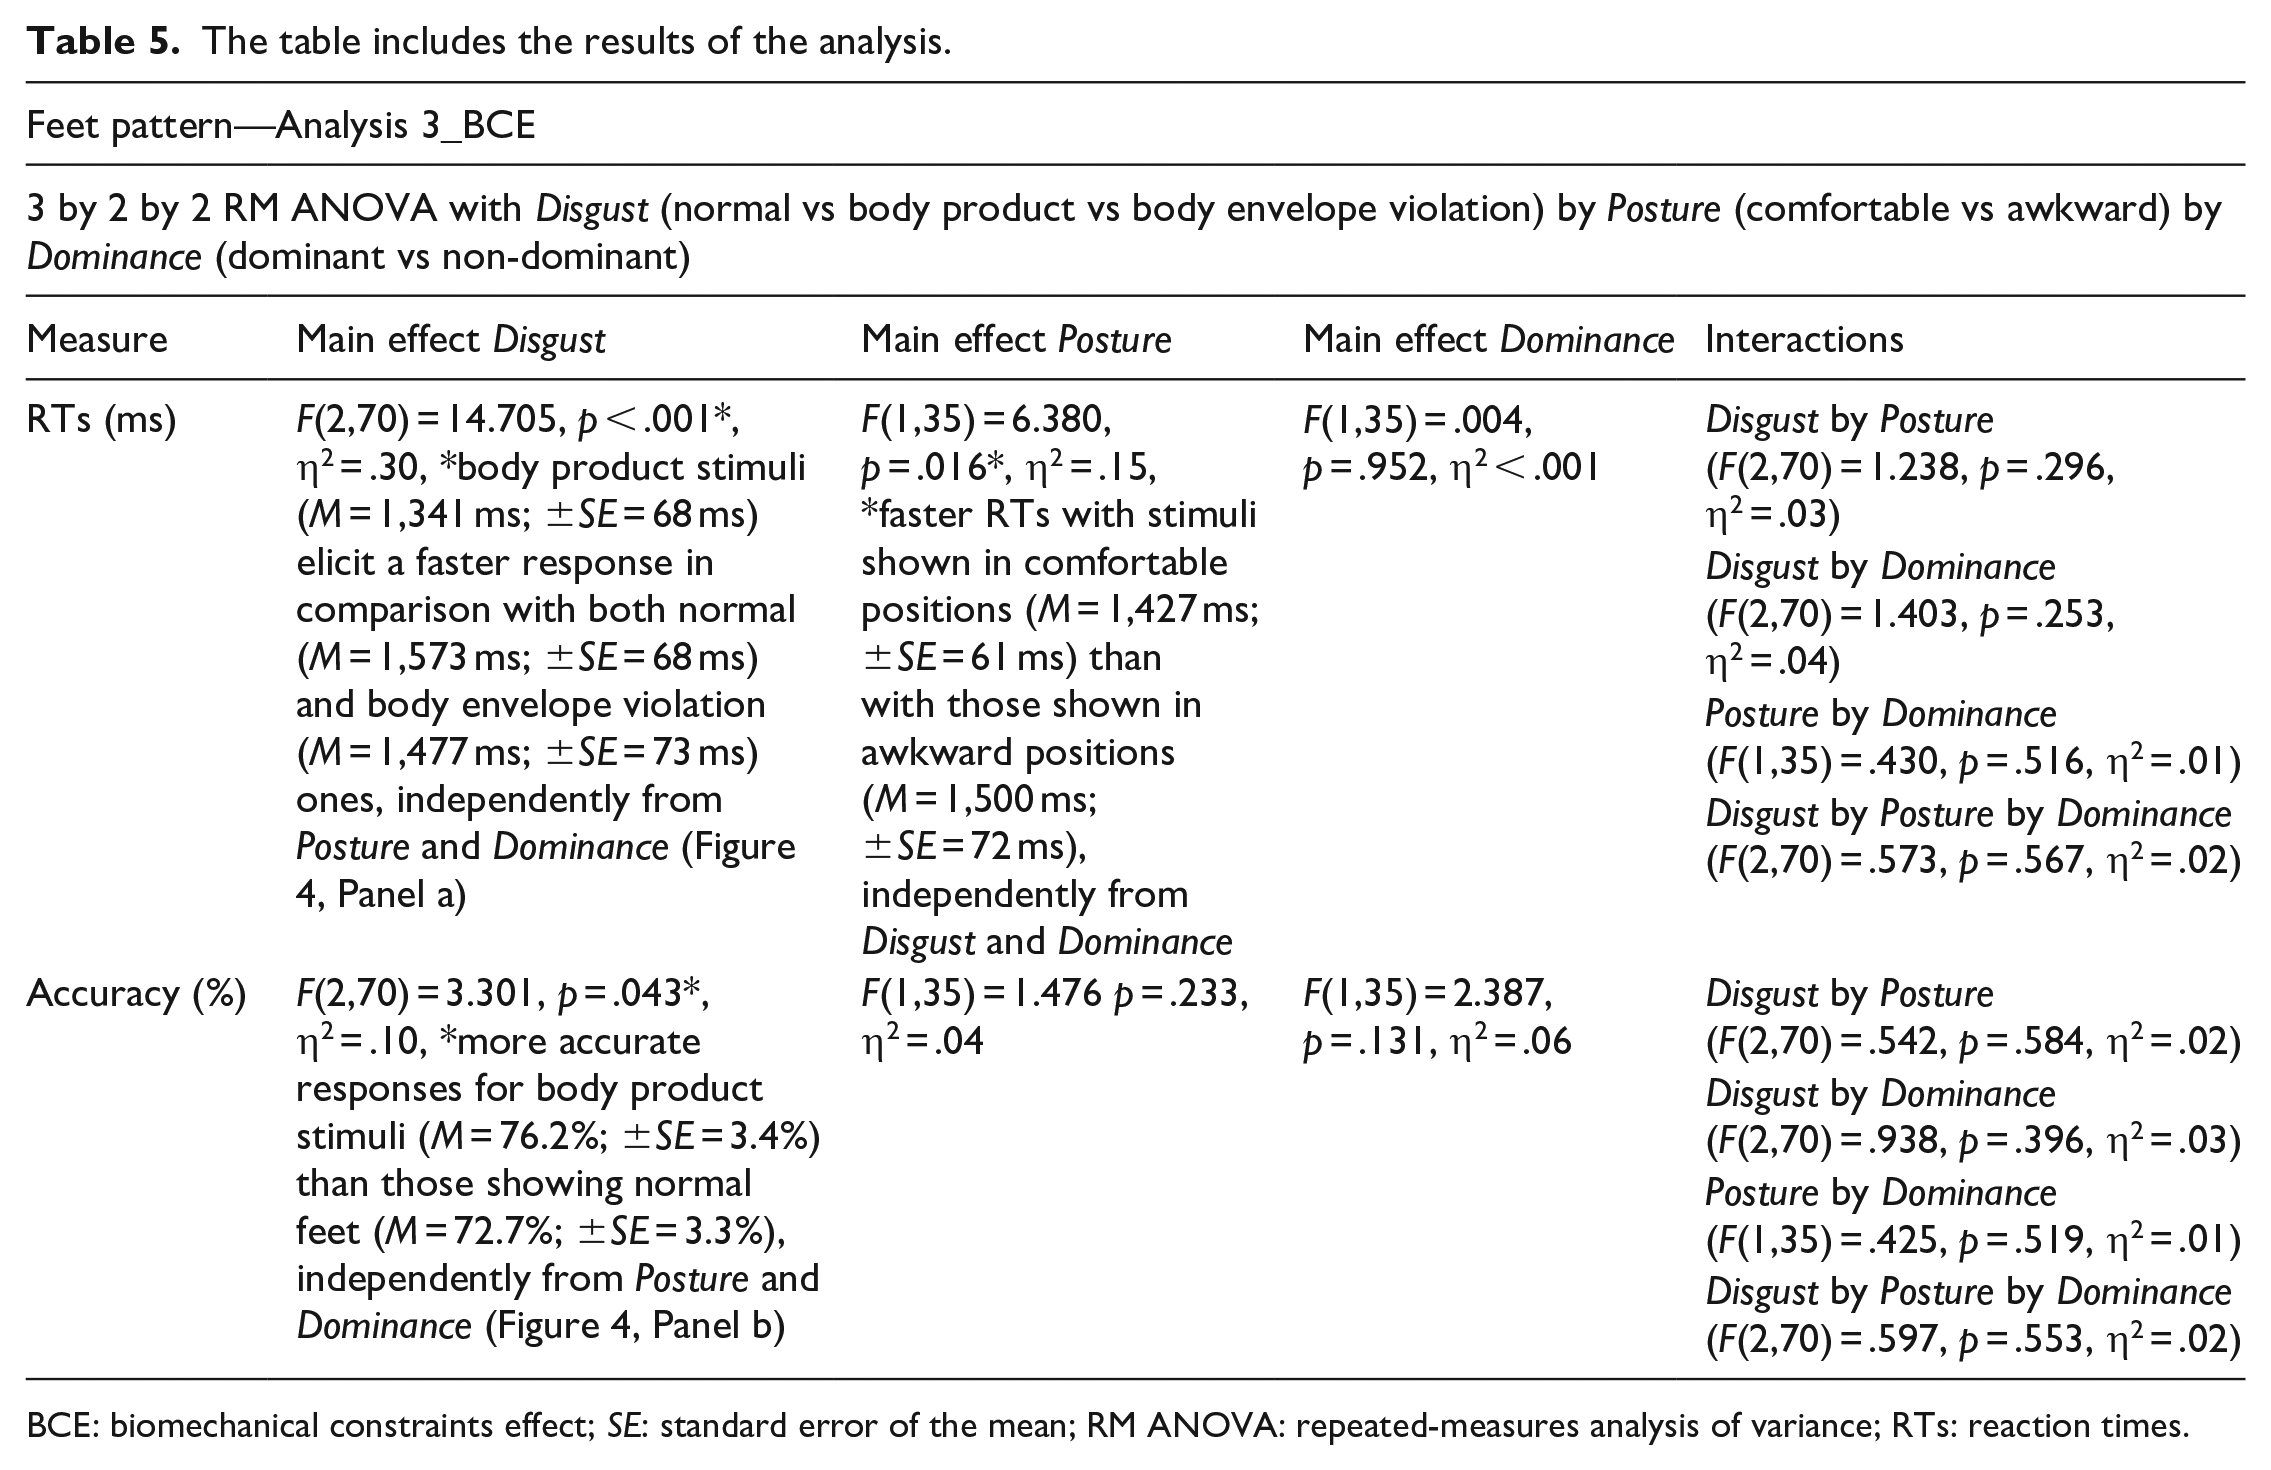
BCE: biomechanical constraints effect; SE: standard error of the mean; RM ANOVA: repeated-measures analysis of variance; RTs: reaction times.
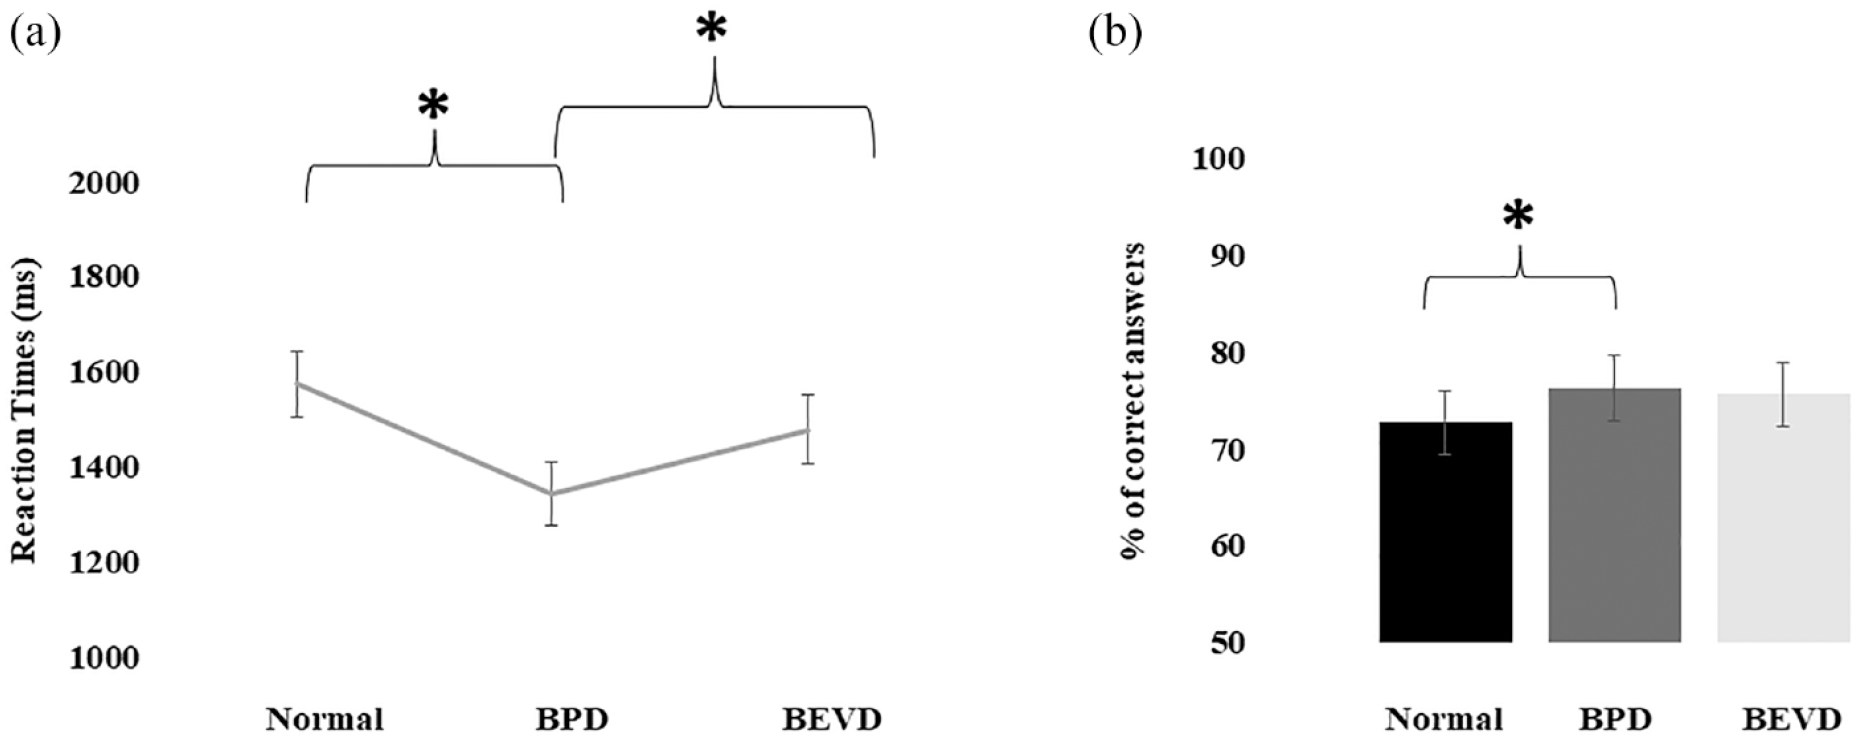
The graphs show the significant difference (lines and asterisks) observed within the main factor Disgust. Panel (a) shows faster responses for feet covered by faeces compared with normal feet and feet with a missing finger. The y-axis represents the RTs expressed in milliseconds. Panel (b) shows how responses for normal feet were less accurate if compared with feet covered by faeces. The y-axis represents the percentage of correct answers. In both Panels (a) and (b), bars represent the standard error of the mean. Normal = non-emotionally charged stimuli; BPD = body products driver; BEVD = body envelope violations driver; RTs: reaction times.
Hands versus feet—Analysis 4
The results of the analysis confirm the same pattern we observed in Analyses 1, 2, and 3 (see the online Supplementary material 2). Core to the research question, these results show that disgust does not influence differently the ability to mentally rotate hands and feet.
Discussion
Our mental representation of the body is dynamic (Ehrsson, 2012). For example, the ability to imagine the body with the mind’s eye is modified by injuries (Coslett et al., 2010; Fiori et al., 2014) as well as by experience (Habacha et al., 2014). While more is known about plasticity and dynamicity of body representation in relation to things we do, much less is known about the influence that what we feel, emotions, have on the mental body.
In our study, we were interested in exploring what happens when the hand or the foot that you are imagining are charged emotionally, with a “disgusting” message. To this aim, our participants were asked to complete a classic version of the HLT (Fiori et al., 2013) and FLT (Curtze et al., 2010), and two emotionally charged versions of the tasks, in which the limbs were partially covered in faeces (body products driver) or with the index finger/toe amputated (body envelope violations driver), following theories of disgust that classify drivers depending on their features (Olatunji et al., 2009). Importantly, we explored this question in both hands and feet, as usually studies are conducted only on hands, but we know how these body districts are different biologically and functionally.
Given the studies comparing hands and feet for motor imagery are scarce (e.g., Fiorio et al., 2006; Ionta & Blanke, 2009; Ionta et al., 2007), we first looked for baseline differences (i.e., related to a different mental representation of hands and feet), expressed by different RTs and accuracy responses between hands and feet. Our results indicate an overall greater accuracy for hands, whether we look at visual imagery or motor imagery, while in terms of processing velocity, the two limbs are comparable. When it comes to motor imagery, this difference is particularly true for comfortable positions.
One could wonder if the means used to respond to the task generate the difference: a compatibility effect between the stimulus shown and the mode of answering could have driven the difference in accuracy, as hands stimuli were answered using hands, but also feet were answered using hands. In previous studies that used the FLT, answers were recorded verbally (Fiorio et al., 2006; Ionta & Blanke, 2009; Ionta et al., 2007) or with a keyboard (Curtze et al., 2010). This did not influence the results, and given we did not observe this effect in RTs, we think it is unlikely that a compatibility effect can explain the differences. More likely, to explain these findings, one should consider the visual features of hands and feet. The fingers of a hand, differently from the toes of a foot, have a distinct shape whereby the thumb becomes an anchor point (Conson et al., 2021), quite salient when compared with the corresponding finger in the foot. This suggestion is also supported, e.g., by the use of control stimuli for the body, letters. In the Mirror Letter Discrimination task (Fiori et al., 2013), e.g., Fiori et al. (2013) selected the letters “F” and “J” because of the similar asymmetry of hands (i.e., thumb stands out).
So, overall, if the findings on emotional tasks are driven by baseline differences between hands and feet, we should expect a greater accuracy for hands in motor imagery parameters. This is not what our data show.
We hypothesised that the presence of disgusting features on body parts would lead to a specific effect, expressed by faster RTs for body parts shown in comfortable positions as these are more salient for actions (Parsons, 1987a, 1994).
Our findings show that the laterality judgement is faster for hands covered by faeces (body products driver) when compared with the other types of stimuli, independently from the Posture or the Dominance of the hands. Similarly to what was observed for hands, only body products influence the ability to mentally rotate feet, whereas body envelope violations do not. These findings do not support our hypotheses, as the effect is not specific for comfortable postures, rather a general pattern that we observe even when positions are awkward, in other words not resembling real actions. This is true for both hands and feet, and when directly comparing the two body parts, suggesting the results cannot be explained by baseline differences (i.e., specific pattern of responses highlighting differences in the mental representation of hands and feet in action), otherwise we would have found interactions with the factor Limb, which is not the case.
In terms of dominance, for both hands and feet, the ability to mentally rotate the dominant and non-dominant limb was not influenced by the presence of disgusting features either. Our results might be due to the counterbalancing we used, as in the classic versions of the task.
Our findings, when looking at visual imagery rather than motor imagery, further suggest a non-specialised effect of disgust. In hands, both drivers, body products and body envelope violations, affect RTs and accuracy. The fact that emotions enhance visual attention and the visual recognition of stimuli is a known phenomenon (Tyng et al., 2017). This is not surprising in the case of disgust, as this specific emotion helps us in terms of survival, allowing withdrawal from dangerous stimuli (Olatunji et al., 2009). The most powerful effect we found was for body products, making people faster and more accurate at both 0° (self) and 180° (other). Differently, the body envelope violations driver influenced how fast participants were in recognising stimuli at 180° (other) only. This might be because the presence of a contaminating substance on both my or someone else’s body is considered a more relevant source of danger than body envelope violations (Olatunji et al., 2009; Rozin & Fallon, 1987). It makes sense for us to be able to identify as fast as possible a potentially damaging stimulus over our body (e.g., stimuli presented at 0°—first perspective) or over the body of someone approaching us (e.g., stimuli presented at 180°—third perspective) (Brady et al., 2011).
One could argue that our results highlight more salience in general for body products than body envelope violations due to these stimuli being “easier” to process visually. We cannot rule out this aspect with the current data. Further studies could look at these basic visual processing, e.g., using more visually comparable stimuli (i.e., hands covered in paint to be compared with hands covered in faeces).
In summary, our findings show that disgust is indeed a salient feature of the stimuli we encounter, including body parts. This however does not mean that there is a specific influence on motor imagery or actions, and this is true when looking at both hands and feet, despite their functional and anatomical differences.
Supplemental Material
sj-docx-1-qjp-10.1177_17470218231207336 – Supplemental material for Exploring the role of disgust in hands and feet laterality judgement tasks
Supplemental material, sj-docx-1-qjp-10.1177_17470218231207336 for Exploring the role of disgust in hands and feet laterality judgement tasks by Federico Brusa, Mustafa Suphi Erden and Anna Sedda in Quarterly Journal of Experimental Psychology
Footnotes
Declaration of conflicting interests
The author(s) declared no potential conflicts of interest with respect to the research, authorship, and/or publication of this article.
Funding
The author(s) disclosed receipt of the following financial support for the research, authorship, and/or publication of this article: The work was supported by a PhD scholarship from the Centre for Applied Behavioural Sciences at Heriot-Watt University.
Availability of data and materials
References
Supplementary Material
Please find the following supplemental material available below.
For Open Access articles published under a Creative Commons License, all supplemental material carries the same license as the article it is associated with.
For non-Open Access articles published, all supplemental material carries a non-exclusive license, and permission requests for re-use of supplemental material or any part of supplemental material shall be sent directly to the copyright owner as specified in the copyright notice associated with the article.