
Abstract
Autism spectrum disorder (ASD) and the broader autistic phenotype (BAP) have been suggested to be associated with perceptual–cognitive difficulties processing human faces. However, the empirical results are mixed, arguably, in part due to inadequate samples and analyses. Consequently, we administered the Cambridge Face Perception Test (CFPT), the Reading the Mind in the Eyes Test (RMET), a vocabulary test, and the Autism Quotient (AQ) to a sample of 318 adults in the general community. Based on a disattenuated path analytic modelling strategy, we found that both face perception ability (β = –.21) and facial emotional expression recognition ability (β = –.27) predicted uniquely and significantly the Communication dimension of AQ. Vocabulary failed to yield a significant, direct effect onto the Communication dimension of the AQ. We conclude that difficulties perceiving information from the faces of others may contribute to difficulties in nonverbal communication, as conceptualised and measured within the context of BAP.
Keywords
Introduction
Autism spectrum disorder (ASD) is characterised by developmental impairments in social communication and cross-situational interactions, as well as non-adaptive repetitive behaviours, restricted activities, and narrow interests (American Psychiatric Association, 2013). Importantly, it has been argued that the dimensions that characterise ASD are trait-like (Comings, 1995), and thus, like other personality traits, correspond to a relatively continuous distribution in the general population (i.e., broader autism phenotype [BAP]; Ruzich et al., 2015).
ASD and BAP have been reported to be between 70% and 80% heritable (Bai et al., 2019; St. Pourcain et al., 2013). Furthermore, ASD and BAP may be linked aetiologically (Bralten et al., 2018), suggesting that investigating BAP in the neurotypical population may be useful, as the results may have implications for the ASD clinical population. The strong heritable/genetic component to ASD and BAP suggests that the facets of ASD may be mediated substantially by particular parts (or networks) of the brain, which, in turn, may be expected to impact specific perceptual/cognitive processes (Nomi & Uddin, 2015; Pisula, 2010). Correspondingly, various candidate mechanisms have been proposed to mediate, at least in part, the individual differences in BAP, including face perception ability and facial emotional expression recognition ability—arguably two important abilities for effective socialisation and inter-personal communication (Black et al., 2017; Parkinson, 1996; Webb et al., 2017).
To date, some research has reported negative correlations between some face-related perceptual–cognitive abilities (e.g., face memory; emotion identification) and BAP in adult samples (e.g., Bothe et al., 2019; Lewis et al., 2018; Walker et al., 2023). Such findings are considered to be potentially important, as they may help partially explain how some of the cognitive–behavioural difficulties associated with BAP arise. However, the results have been inconsistent, likely for several reasons, including failures to measure BAP in a multidimensional manner, and failure to deal with measurement error, in addition to relatively small (and unrepresentative) samples (N < 100). For typically sized individual difference in correlations (i.e., |.20|), a sample size of 190 would be required to achieve 80% statistical power (Gignac & Szodorai, 2016) and ≈ 250 to yield stable estimates (Schönbrodt & Perugini, 2013).
Consequently, the purpose of this investigation was to test the hypothesis that face perception ability and facial emotional expression recognition ability associate negatively with BAP in a relatively large, general community sample of adults, when measuring BAP in a multidimensional manner and dealing with measurement error. Measurement error is important to consider, as estimated effects from test scores tend to be attenuated, but they can be disattenuated to reflect true score effects (Nunnally & Bernstein, 1994). Furthermore, in the event that statistically significant, negative associations were observed, we sought to test a path analytic model predicting BAP, to estimate the unique effects associated with face perception ability and facial emotional expression recognition ability, while also taking into consideration individual differences in verbal ability, a known positive correlate of facial emotional expression recognition ability (Schlegel et al., 2020). On the basis of theory and previous research (discussed below), we hypothesised that the association between face perception ability and BAP will be mediated (at least partly) by emotional expression recognition ability.
Face perception ability and ASD/BAP
The ability to perceive faces represents the capacity to discern facial configurations and features accurately (Hildebrandt et al., 2012). According to the social motivation theory of ASD (Dawson et al., 2005), people with ASD have less motivation to engage socially, and, correspondingly, experience lower levels of reward elicited by social stimuli (Chevallier et al., 2012). Correspondingly, it has been suggested that BAP may be associated negatively with face processing abilities, as people who score high on BAP would be expected to have less experience perceiving and processing the faces of other people, given their preference to avoid social interactions (Sasson, 2006; Webb et al., 2017).
Neurophysiological theories of ASD suggest that differences in certain areas of the brain render some typical functions more difficult (Rozga et al., 2011). Some event-related potential research suggests that there are early stage visual face processing differences (i.e., slower latencies and smaller amplitudes over occipital–temporal regions) in children diagnosed with ASD that might impact face-perception ability (e.g., Batty et al., 2011). Weigelt et al. (2012) contended that, although people with ASD process faces in a manner that is qualitatively similar to people without ASD, there is a quantitative difference between the two groups. For example, people with ASD tend to have more difficulty (perform more slowly and less accurately) than non-ASD people on face identity tasks (Weigelt et al., 2012). Consequently, it is plausible to hypothesise a negative correlation between face perception ability and the BAP measured in the neurotypical population.
Conventional face perception tasks (e.g., the Cambridge Face Perception Test [CFPT]; Duchaine et al., 2007) test a person’s ability to discern the degree of similarity across essentially emotionless faces (frontal view) in relation to a target face (three-quarter view). Importantly, the nature of the CFPT items do not require memory span to complete successfully. Thus, the focus of the CFPT is relatively purely upon face perception ability, and not face memory span or emotion recognition ability (see also Logan et al., 2016). Such a distinction is important, because the observation of a negative association between face perception ability and BAP, especially a unique one, would suggest a more fundamental challenge with the perceptual/cognitive processing of faces for people who score high on BAP, as opposed to (or in conjunction with) more complex and socially pertinent processes (e.g., face emotion expression recognition ability).
To date, there has been little research published on the association between face perception ability and BAP. In a rare exception, Sasson et al. (2013) reported a negative correlation (r = –.32) between face perception ability (Benton Facial Recognition Test; Benton et al., 1983) and the pragmatic language difficulties subscale from the BAPQ (Hurley et al., 2007). Thus, higher levels of face perception ability were associated with fewer pragmatic language difficulties. However, the Sasson et al. (2013) study was based on only 73 participants, and they did not disattenuate their effects for measurement error. Thus, the effect at the true score level may be larger than what Sasson et al. (2013) reported.
As noted above, both face perception ability and facial emotion expression recognition ability have been suggested as candidate processes diminished in people with ASD. The ability to perceive faces and recognise emotional expressions in faces are known to be associated positively, though they are also distinct processes (Adolphs, 2002). Consequently, differential and/or unique effects (i.e., beta-weights) as predictors of BAP may be expected for face perception ability and face emotion expression recognition ability.
Facial emotional expression recognition ability and ASD/BAP
On the basis of a review of the empirical literature comparing ASD and controls on various face emotion recognition/labelling tasks, Harms et al. (2010) concluded that the results were mixed, perhaps, in part, because of small sample sizes. In a two-part investigation with a combined sample of individuals with Autism (n = 16) and without Autism (n = 16), Cook et al. (2013) failed to find a unique effect between Autism Diagnostic Observation Schedule (Lord et al., 2000) scores and emotion recognition ability, controlling for alexithymia. In addition, Halliday et al. (2014) failed to observe a statistically significant correlation (r = –.03; see also Palermo et al., 2018) between facial emotional expression recognition ability and total scores from the Autism-Spectrum Quotient ([AQ] Baron-Cohen, Wheelwright, Skinner, et al., 2010), based on a relatively small (N = 132) and non-representative sample of university students. Halliday et al. (2014) examined only total AQ scores, a questionable procedure, as the AQ is known to measure three relatively distinct dimensions: Social (pronounced introverted tendencies), Communication/Mind Reading (difficulties discerning people’s thoughts/feelings in conversation), and Details (preoccupation with details/obscure patterns) (Russell-Smith et al., 2011).
Although originally designed as a test of theory of mind, a commonly used measure of facial emotional expression recognition ability is the Reading the Mind in the Eyes Test (RMET; Baron-Cohen, Wheelwright, Hill, et al., 2001). People diagnosed with ASD have been reported to score between approximately 1 and 2 SDs lower on the RMET than the control groups (e.g., Baron-Cohen, Wheelwright, Hill, et al., 2001; Meyer-Lindenberg et al., 2022). Correspondingly, a small amount of individual differences research with the RMET suggests that there is a negative correlation between facial emotional expression recognition ability and BAP. For example, Voracek and Dressler (2006) reported a correlation of −.17 between RMET and AQ in a community sample (N = 423). More recently, Bothe et al. (2019) found that only the AQ-Communication sub-dimension correlated significantly and negatively with two emotion recognition tasks (labelling and matching). Thus, the potential impact of facial emotion recognition ability on BAP may be more substantial for the capacity to discern nonverbal communication, in comparison to ASD introverted tendencies (AQ-Social) and/or the preoccupation with details/obscure patterns (AQ-details). However, Bothe et al. (2019) was based on a relatively small (N = 145) and non-representative sample (undergraduates).
In summary, the magnitude of the true score association(s) between facial emotional expression recognition ability and the three dimensions of BAP typically discussed in the literature, that is, social, details, and communication, remains to be determined. In addition, whether both face perception ability and facial emotional expression recognition ability are associated with BAP uniquely has not yet been tested. Theoretically, the effect between face perception ability and BAP may be mediated by facial emotional expression recognition ability, as face perception ability may be expected to facilitate facial emotional expression recognition ability, rather than the other way around (Künecke et al., 2014).
Verbal ability and ASD/BAP
To date, a substantial amount of research has been published on the nature of the intellectual capacities of people with ASD. However, the research is highly inconsistent, with researchers variously contending the observation of lower general intellectual functioning (i.e., IQ < 90; Hedvall et al., 2014), essentially intact intellectual functioning (e.g., Dawson et al., 2007; Nader et al., 2016), or even relatively better intellectual functioning (e.g., Crespi, 2016). Finally, others contend that ASD is associated with a particular cognitive ability profile. For example, some research suggests that ASD is characterised by relatively high nonverbal intelligence relative to verbal intelligence (e.g., Gizzonio et al., 2014; Siegel et al., 1996), whereas other research suggests that ASD is characterised by relatively higher verbal intelligence relative to nonverbal intelligence (Kanai et al., 2012).
Although there may be a significant amount of heterogeneity in the presentation of intellectual functioning among people with ASD (Charman et al., 2011), it has been suggested that people with ASD, even high-functioning people with ASD, generally have difficulties with pragmatic language usage (Boucher, 2012; Lim, 2018). This would be commensurate with difficulties communicating verbally in a social context, rather than reduced word knowledge (i.e., verbal intelligence [VIQ]) (Bishop et al., 2004). Consequently, language ability (e.g., vocabulary) might not associate directly with any of the BAP dimensions.
However, while BAP might be essentially unrelated to general language knowledge in adults, it could be associated negatively with understanding emotionally related concepts. For instance, Hobson and Lee (1989) found that young autistic adults performed substantially worse on the emotion-related words within the British Picture Vocabulary Scale, in comparison to the emotion unrelated words. The age-matched control group did not show such a difference (see also Van Lancker et al., 1991). Consequently, an indirect effect 1 between verbal ability and BAP may be observed, on the basis of a positive association between verbal ability and facial emotional expression recognition ability, as facial emotional expression recognition ability tests tend to involve identifying the correct emotionally related word/concept with a particular face displaying a particular emotion (Baron-Cohen, Wheelwright, Hill, et al., 2001; Logan et al., 2016).
The Reading the Mind in the Eyes Test (Baron-Cohen, Wheelwright, Hill, et al., 2001) is an example that includes words such as “aghast” and “bewildered.” Knowledge of such worlds would be expected to be associated with verbal intelligence. Correspondingly, on the basis of a meta-analysis (k = 77), the correlation between verbal intelligence and RMET was reported at .24 (Baker et al., 2014). Undoubtedly, the true score correlation is non-negligibly larger than .24, as the verbal intelligence measures would have had imperfect reliability (say, α = .80), and the average reliability associated with RMET is approximately .65 (Vellante et al., 2013). Thus, the true score correlation may be closer to .33 (that is, .24/(√.80*.65)).
In contrast to facial emotional expression recognition ability, the association between verbal ability and face perception ability would be expected to be smaller, because there is no obvious verbal element to the manner in which face perception ability is typically tested (Duchaine et al., 2007; Logan et al., 2016). Furthermore, face perception ability is considered to be based on more primary perceptual processes, not worldly or conceptual knowledge (Adolphs, 2002). Nonetheless, a small, positive correlation between verbal ability and face perception ability may be expected, on the basis of the cognitive ability positive manifold (Euler & McKinney, 2019; Jensen, 1998). The possibility that vocabulary may be associated with an indirect effect onto BAP via face perception ability, in addition to an indirect effect via facial emotion expression recognition ability, was a research question addressed in this investigation.
Summary and purpose
Some empirical work suggests that face perception ability and facial emotional recognition ability are correlated positively (e.g., Bobak et al., 2016), however, the correlation has not yet been estimated in a relatively large community sample. In this investigation, we hypothesised that the correlation would be positive and statistically significant (hypothesis 1). Also, some research suggests that verbal ability is correlated positively with facial emotional expression recognition ability (Baker et al., 2014), however, little to no research has examined the association between verbal ability and face perception ability. Therefore, on the basis of previous face processing and intelligence research (Baker et al., 2014; Gignac et al., 2016 but see Wilmer et al., 2014), and the positive manifold more generally (Jensen, 1998), we hypothesised that verbal ability would correlate positively with both face perception ability (hypothesis 2) and facial emotional expression ability (hypothesis 3). In addition, we hypothesised that verbal ability would correlate more substantially with facial emotional expression ability than with face perception ability, as tests of facial emotional recognition ability tend to have an obvious verbal element to them (hypothesis 4). We also hypothesised that the correlation between face perception ability and facial emotional expression recognition ability would remain significant, controlling for the effects of verbal ability (hypothesis 5).
In addition, theoretical and empirical work suggests that face perception ability and emotional expression recognition ability may be associated negatively with the BAP construct, particularly the social and communication dimensions (Bothe et al., 2019; Sasson et al., 2013; Weigelt et al., 2012). However, the correlations have not yet been estimated in a relatively large (N > 200), neurotypical adult sample. Consequently, we hypothesised that face perception ability (hypothesis 6) and facial emotional expression recognition ability (hypothesis 7) would correlate negatively with one or more of the BAP dimensions, with greater expectations for the social and communication dimensions.
We also have three broader research questions. First, given that some research suggests that face perception ability and facial emotional expression recognition ability are correlated positively (Bobak et al., 2016), it would be useful to determine whether both abilities predict BAP, uniquely. Second, because face perception is considered to be a more primary process, and is suggested to facilitate facial emotional expression recognition (Künecke et al., 2014), the possibility that the association between face perception ability and BAP may be mediated by facial emotion expression recognition ability was also examined. In our modelling, we specified the face processing abilities as predictors of BAP, rather than the other way around, as we adopted a more neurophysiological orientation of ASD/BAP (Baron-Cohen et al., 2000; Nomi & Uddin, 2015; Schultz, 2005), as opposed to a more social/motivation orientation (Dawson et al., 2005). Third, as autism has been characterised, in part, as associated with difficulties with language usage, rather than language knowledge (Bishop et al., 2004), we did not expect to observe a significant (total or direct) association between verbal ability and any of the BAP dimensions. However, a verbal ability indirect effect onto one or more of the BAP dimensions via facial emotional expression recognition ability was investigated.
Method
Sample
Participants volunteered for this research via the TestMyBrain.org website, which offers visitors immediate performance feedback, relative to the broader population of volunteers, on a wide variety of carefully constructed tests. Data collected via TestMyBrain, in operation since 2009, have demonstrated comparable reliability, validity, performance levels, and patterns of performance across tests as compared with traditional laboratory testing (e.g., Germine et al., 2012). The original sample consisted of 18,864 respondents who completed at least one test. We initially excluded those who reported their age to be <18 years (n = 3,708) or >75 years (n = 132), and those who reported that English was not a first language (n = 4,947). For the ability-based tests (described below), the final samples were n = 10,840 for the Vocabulary test and CFPT. For RMET, the sample size was n = 9,767. A sample of 318 participants completed all of the tests, including AQ. The correlations reported below are based on a pairwise deletion procedure. The mean age for the complete sample (n = 318) was 37.18 years (SD = 15.07) and the sample was 67.8% female. The most frequent countries of residence included the United States (62.3%), Great Britain (8.2%), Canada (7.5%), Australia (4.7%), and India (4.4%). The most common ethnicities were European (67.0%), Asian (11.6%), and African (3.1%). Finally, the level of education of the sample (n = 317) was slightly greater than what would be expected from the general population: high school, 11.0%; some college, 23.0%; college, 33.3%; graduate degree, 25.2%; and other, 7.5%.
Measures
Individual differences in BAP were measured with AQ (Baron-Cohen, Wheelwright, Skinner, et al., 2001). AQ consists of self-report items designed to assess levels of autistic-like traits and behaviours in neurotypical individuals. Each item is rated by the participant on a 4-point Likert-type scale: definitely agree, slightly agree, slightly disagree, and definitely disagree. We followed Baron-Cohen, Wheelwright, Skinner, et al. (2001), who recommended recoding the responses dichotomously (i.e., into 1 = agreement or 0 = disagreement). High scores indicate greater levels of BAP. Although AQ is composed of 50 items, factor analytic work has found that only 28 items load onto three dimensions of trait-autism: Social Skills (e.g., “I find social situations easy.”), Details (e.g., “I tend to notice details that others do not.”), and Communication/Mind Reading (e.g., “I find it difficult to work out people’s intentions.”) (English et al., 2020; Russell-Smith et al., 2011). While we administered the full 50-item version, we analysed the 28-item version (see Russell-Smith et al., 2011, for further details).
Face perception ability was measured with a three-item short-form of the eight-item CFPT (Duchaine et al., 2007; Kim et al., 2022). In this investigation, a 3-item short-form was used (upright identities: m002, m021, and m047). CFPT was designed to measure people’s capacity to detect subtle differences between faces presented on a computer screen. Each item consists of a target face (three-quarter view) and six sortable faces (all frontal shots) with varying levels of similarity to the target face. The participant must order the six faces according to their impression of the degree of similarity with the target. The test is scored by first computing the total number of spaces that the sortable faces are away from their correct order (min 0, max 18), then subtracting this number from 18 (so higher scores indicate better performance), then dividing the result by 3 (so the max score for each item is 6, the max score for the whole test is 18, and chance performance, which is the score if one submits all faces in their original positions, is 6, or 33%). As evidence of predictive validity, on average, people with congenital prosopagnosia score between 1 and 1.3 SDs worse on CFPT than the typical population (Mishra et al., 2021; Palermo et al., 2018). In addition, convergent validity between CFPT and CFMT has been reported at approximately r ≈ .60 (N = 124; Bowles et al., 2009). 2
Emotional recognition ability was measured with a 16-item short version of the 36-item revised Reading the Mind in the Eyes Test (Kim et al., 2022; RMET Baron-Cohen, Wheelwright, Hill, et al., 2001). For each item, the participant must examine the photo of a portion of a person’s face that includes only the eyes and approximately 2 cm above and below the eyes. Each face expresses an emotion, and the participant must identify the word that best describes the facial expression conveyed by the eyes/face from four emotion (word) alternatives. Scored correct/incorrect, the maximum score is 16 (higher scores = better ability). The 16-item version was created by selecting the 16 items that loaded most highly on the first principal component computed on the full set of 36 items (Kim et al., 2022). Although the internal consistency reliability of RMET scores tend to be in the .60 to .65 range, reasonably respectable validity evidence has been reported; in particular, factorial validity (Vellante et al., 2013), and positive associations with self-reported cognitive empathy (Bayne & Hankey, 2020; Olderbak et al., 2015).
Finally, verbal ability was measured with a 5-item vocabulary test. Participants were presented with a target word and selected its synonym from among five options. The test has the same format as the TMB Vocabulary test (Hartshorne & Germine, 2015; Passell et al., 2019). Target words for the five items are adherence, rejoice, covenant, dormant, and vittles.
Procedure
The research was conducted in accordance with the guidelines set by the Committee for the Use of Human Subjects at Harvard University and Wellesley College. After providing informed consent, volunteers completed measures in the following order: basic demographics (age, gender), CFPT, Vocabulary, RMET, 20 RMET pilot items, AQ, and detailed demographics (ethnicity, native language, education). The 20 RMET pilot items, randomly selected for each participant from a larger pool of 109 newly designed items that were being piloted for a different study (Kim et al., 2022), are not analysed for this present article. Once a volunteer completed the battery, they were immediately provided with their results on each test.
Data analysis
As imperfect reliability is known to attenuate the magnitude of observed correlations between composite scores (Schmidt & Hunter, 1999), we disattenuated the observed correlations (and the upper-bound and lower-bound confidence intervals) with the well-known disattenuation formula (Charles, 2005; Nunnally & Bernstein, 1994). 3 Internal consistency reliabilities were estimated via Excel with McDonald’s omega formula and maximum likelihood standardised factor loadings (McDonald, 1999).
First, we estimated and tested for statistical significance the hypothesised bivariate associations on the basis of a series of partial correlations, that is, controlling for age. Then, we tested a theoretically derived path analytic model that included all of the test variables (Vocabulary, CFPT, RMET, and AQ). The path analytic model was estimated on the disattenuated, partial (controlling for age) correlation matrix, to better reflect the construct level effects in the population (Viswesvaran et al., 2014). The model included the AQ dimension of interest as the key dependent outcome variable (i.e., either AQ-Social, AQ-Details, or AQ-Communication). In addition, CFPT and RMET were specified as predictors of the AQ variable of interest, to estimate the unique, direct effects associated with face perception ability and facial emotional expression recognition ability. Also, the Vocabulary test was specified as a predictor of CFPT and RMET, to estimate any indirect effects between verbal ability and the BAP dimension of interest. Finally, attention was paid to the possibility that the Vocabulary test might have a meaningful direct effect onto the BAP variable of interest, although a significant direct effect was not hypothesised.
Recall that complete data were not available for all 10,840 of the respondents. Instead, the sample sizes for each measure corresponded to: CFPT n = 10,840; RMET n = 9,767; Vocabulary n = 10,840; AQ-Social n = 318; AQ-Details n = 318; and AQ-Communication n = 318. To best estimate the population effects, we analysed the data with a pairwise deletion strategy. Consequently, the sample sizes varied across several of the analyses (from N = 10,840 to n = 318), including the disattenuated partial correlation matrix (i.e., controlling for age). However, the path analytic model solution was estimated (maximum likelihood) with the specification of the smallest sample size (i.e., N = 318) and a more conservative alpha of .01 (and 99% CIs), to deal with the enhanced sampling variability associated with disattenuated effects (Charles, 2005). Standard errors, p-values, and CIs were estimated with bias-corrected accelerated parametric bootstrapping (2,000 resamples). All analyses were conducted with SPSS and Amos (data, syntax, and results output can be retrieved here: https://tinyurl.com/3v3yaseu.
Results
No outliers were identified based on the interquartile range outlier labelling rule with a 3.0 multiplier (Hoaglin & Iglewicz, 1987). Furthermore, most of the variables were associated with relatively normally distributed data (skew < |1.0|; see Table 1). However, an examination of the distribution of the vocabulary test scores suggested the presence of a ceiling effect (i.e., ≈ 36% of participants scored 100%; see the online Supplementary Material).
Observed partial correlations (controlling for age), 95% confidence intervals (above main diagonal), descriptive statistics and internal consistency reliabilities (in parentheses).
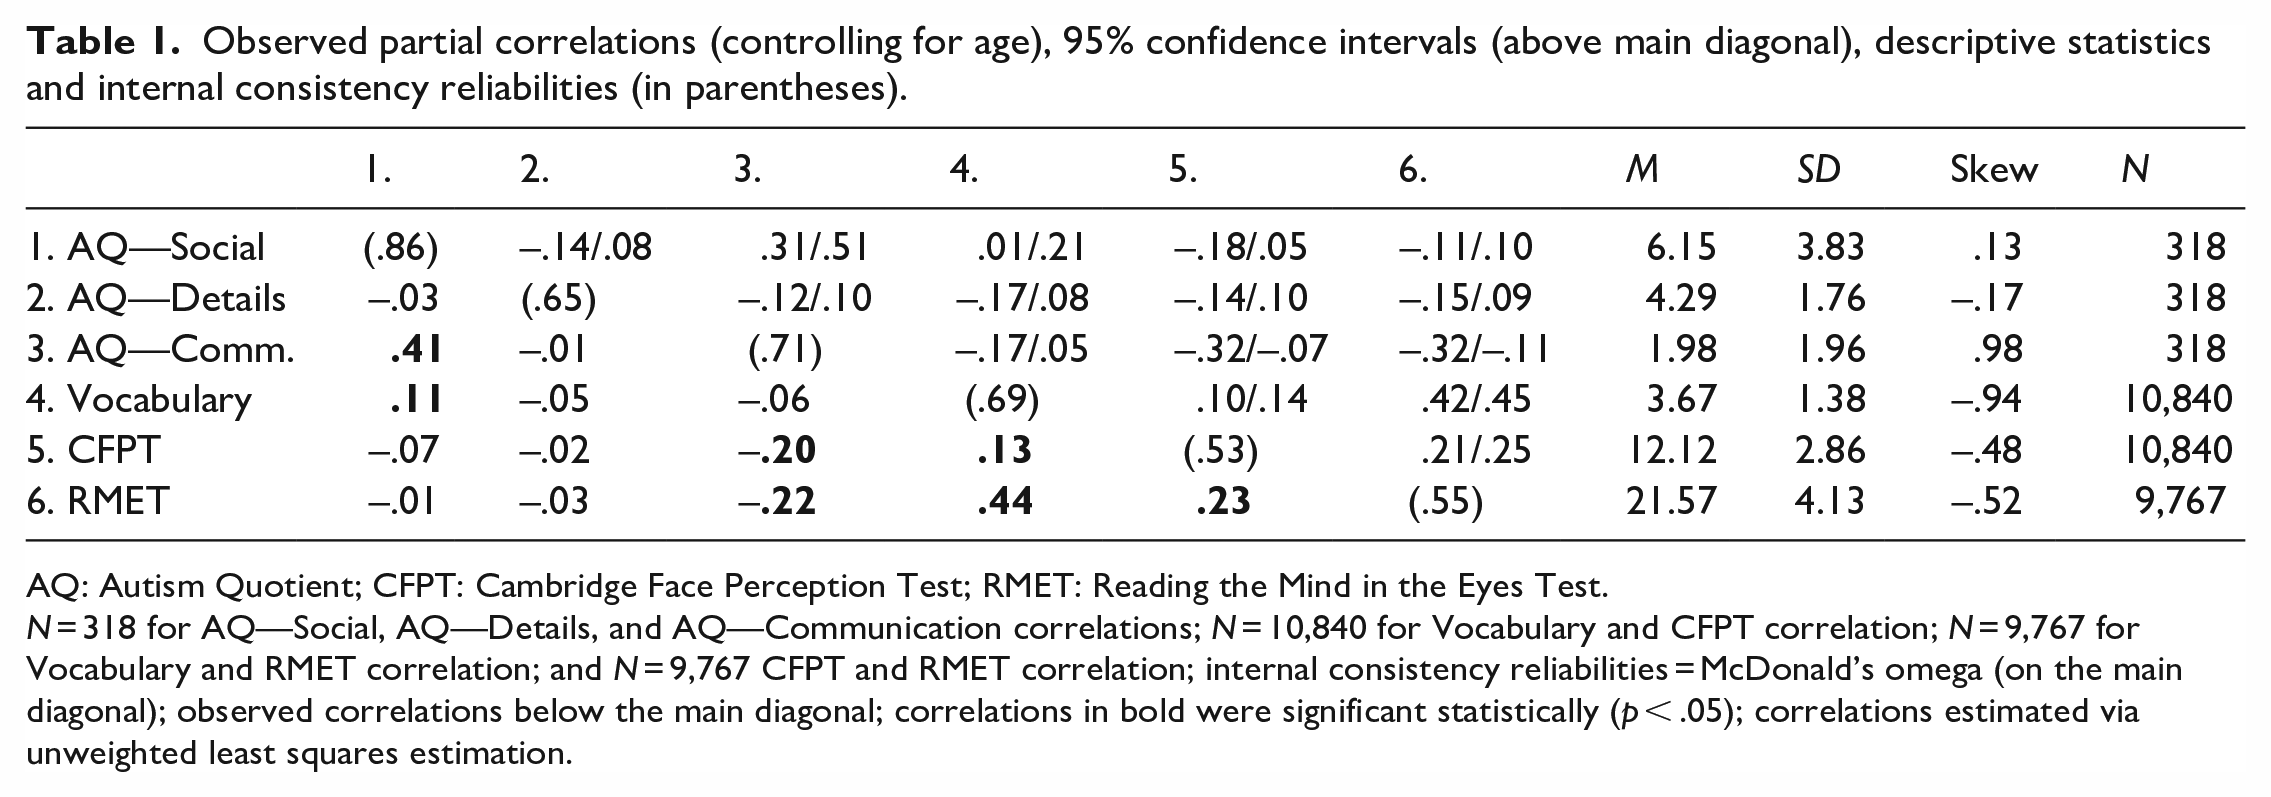
AQ: Autism Quotient; CFPT: Cambridge Face Perception Test; RMET: Reading the Mind in the Eyes Test.
N = 318 for AQ—Social, AQ—Details, and AQ—Communication correlations; N = 10,840 for Vocabulary and CFPT correlation; N = 9,767 for Vocabulary and RMET correlation; and N = 9,767 CFPT and RMET correlation; internal consistency reliabilities = McDonald’s omega (on the main diagonal); observed correlations below the main diagonal; correlations in bold were significant statistically (p < .05); correlations estimated via unweighted least squares estimation.
Descriptive statistics and correlations
The total sample yielded a mean total AQ scale score of 21.01 (SD = 7.20), which is somewhat larger than that reported for other community samples (e.g., Wheelwright et al., 2010; see Table 1 for all scale score descriptive statistics). A scatterplot matrix that shows raw associations among key variables for the entire data set is included as Figure 1 (Figure SI in the online Supplementary Material shows these relationships for only the 318 participants who had complete data). Prior to the primary analyses, we noted that age correlated negatively with AQ-Communication (r = –.12, p = .033, 95% CI = [–.22, –.01]) and positively with Vocabulary (r = .35, p = .001, 95% CI = [.33, .36]; see Table SI). Consequently, we estimated a partial correlation (rxy.z) matrix between all of the variables, controlling for the effects of age (see Table 1). Next, test score reliabilities (coefficient omega) ranged from .53 to .86 (see Table 1; main diagonal). Therefore, due to imperfect reliability in the test scores, we estimated (and focused upon) the corresponding partial correlation matrix disattenuated for imperfect reliability (r′ xy.z ) in the test scores (see Table 2). 4
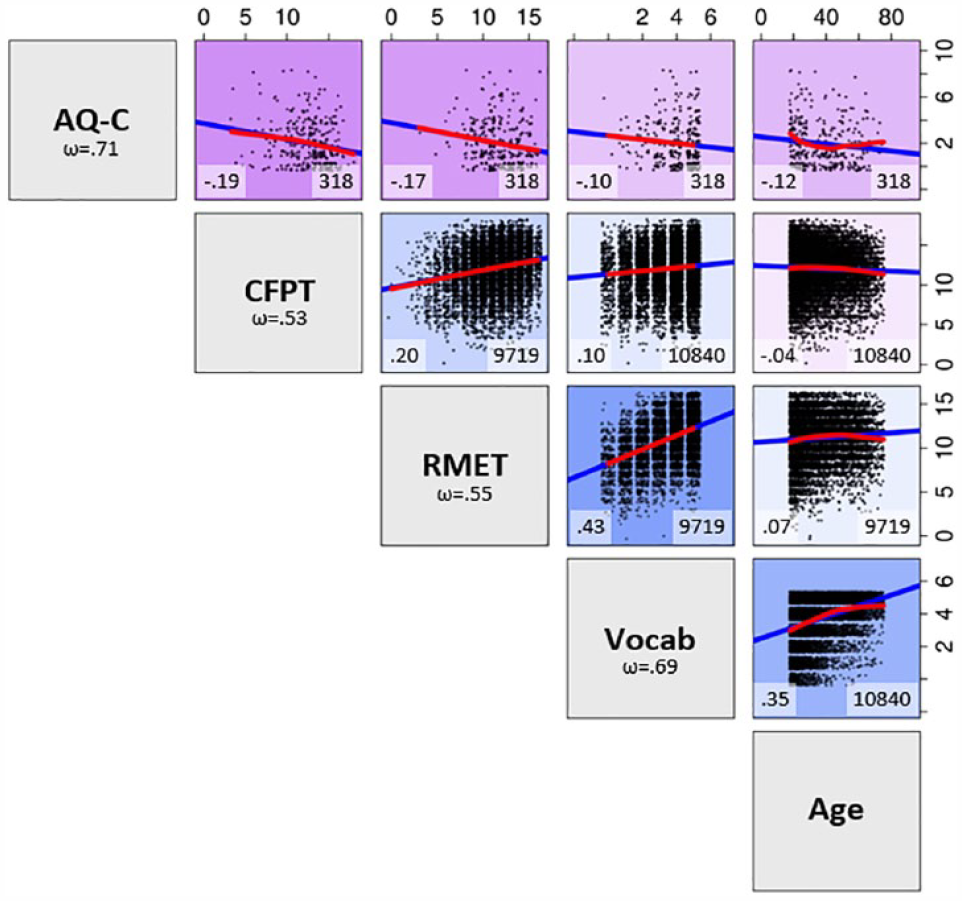
Observed associations among key variables.
Disattenuated partial correlations (controlling for age) and corresponding 95% confidence intervals (above main diagonal).
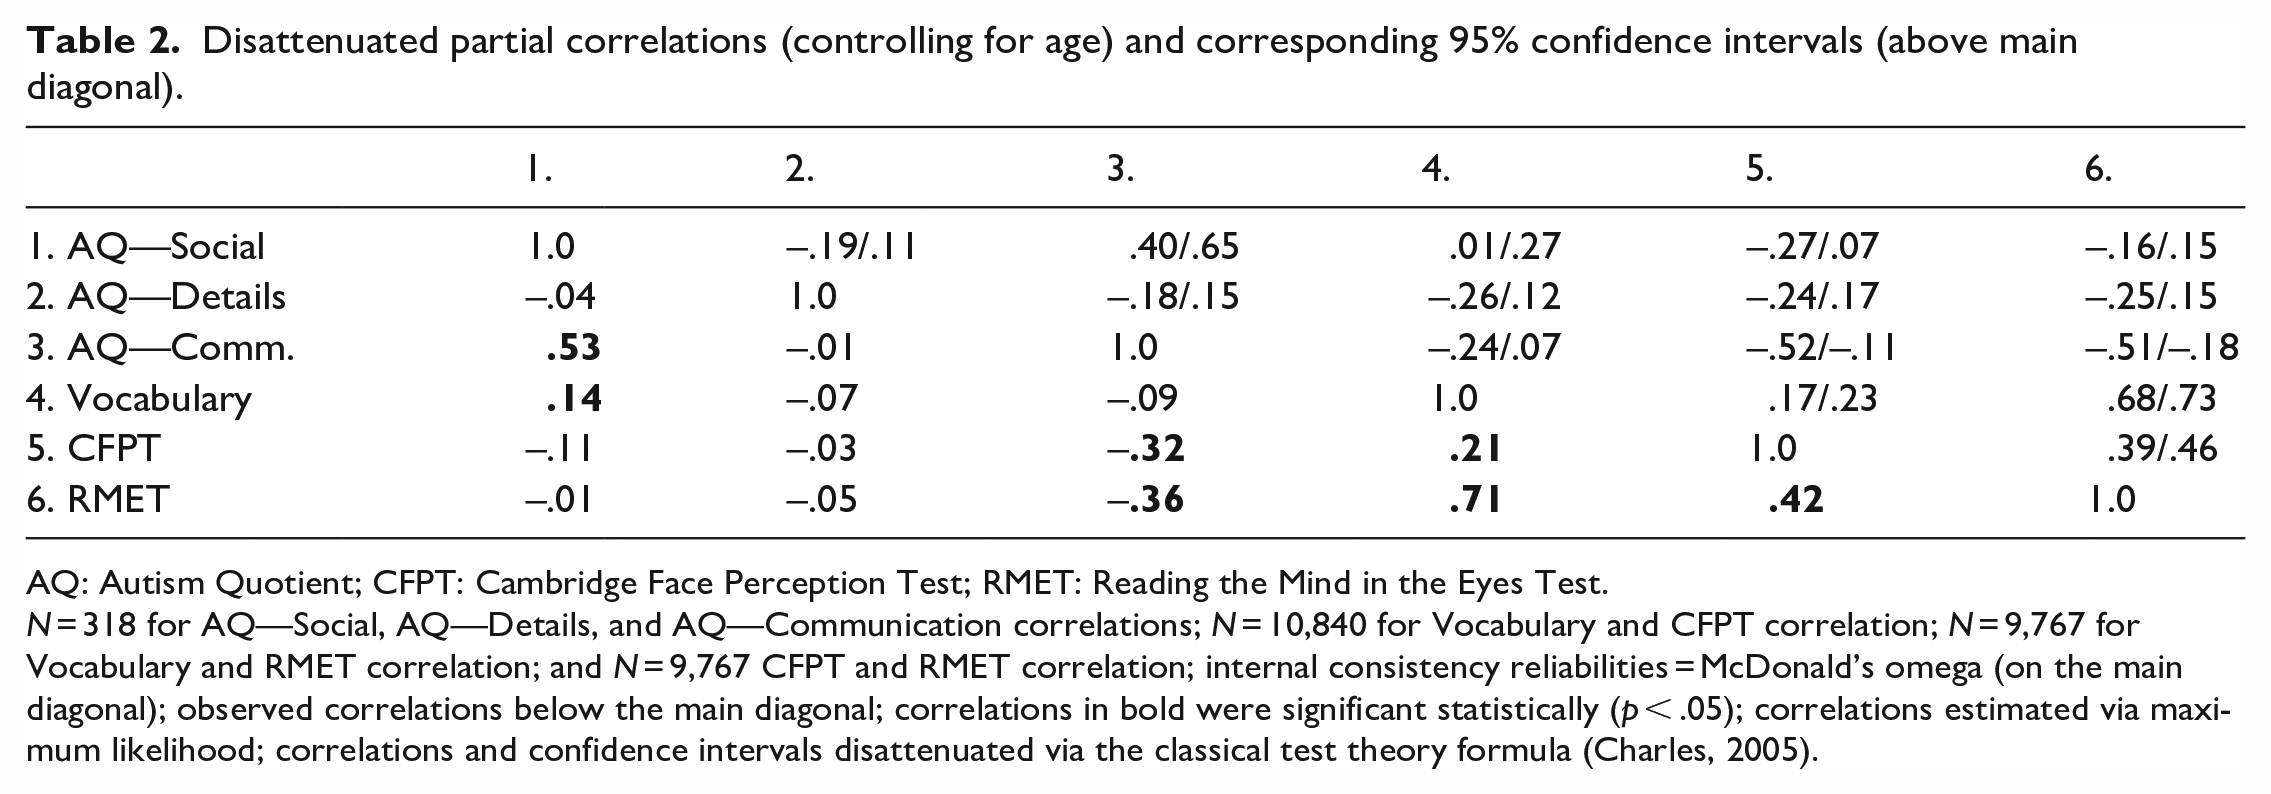
AQ: Autism Quotient; CFPT: Cambridge Face Perception Test; RMET: Reading the Mind in the Eyes Test.
N = 318 for AQ—Social, AQ—Details, and AQ—Communication correlations; N = 10,840 for Vocabulary and CFPT correlation; N = 9,767 for Vocabulary and RMET correlation; and N = 9,767 CFPT and RMET correlation; internal consistency reliabilities = McDonald’s omega (on the main diagonal); observed correlations below the main diagonal; correlations in bold were significant statistically (p < .05); correlations estimated via maximum likelihood; correlations and confidence intervals disattenuated via the classical test theory formula (Charles, 2005).
First, we note that all of the disattenuated partial correlations identified as statistically significant in Table 2 were correspondingly identified as statistically significant at the (more conventional) observed score level (see Table 1). As can be seen in Table 2, CFPT and RMET inter-correlated positively at r′ xy.z = .42 (p = .001, 95% CI = [.39, .46]), controlling for age, which supported hypothesis 1, that is, better face perception ability was associated positively with better facial emotional expression recognition ability. In addition, it was also noted that verbal ability correlated positively with both the RMET r′ xy.z = .71 (p < .001, 95% CI = [.68, .73]) and the CFPT r′ xy.z = .21 (p = .001, 95% CI = [.17, .23]), controlling for age, which supported hypotheses 2 and 3, respectively: better verbal ability was associated positively with better facial emotional expression recognition ability and better face perception ability. A test of the difference between the two partial correlations was found to be significant statistically (Δr′ xy.z = .50; 99% CI = [.57, .42], p < .001), which supported hypothesis 4, that is, verbal ability is associated more substantially with facial emotional expression ability than face perception ability. With regard to hypothesis 5, as expected, the correlation between face perception ability and facial emotional expression recognition ability remained significant, controlling for the effects of verbal ability and age, r′ xy.z.w = .37, 95% CI = [.35, .41], p < .001.
Next, we noted that both the CFPT (r′ xy.z = –.32, p < .001, 95% CI = [–.52, –.11]) and the RMET (r′ xy.z = –.36, p < .001, 95% CI = [–.51, –.18]) correlated negatively with AQ-Communication, controlling for the effects of age (see Table 2). Thus, higher levels of face perception and facial emotional expression recognition ability were associated with fewer self-reported communication/mind reading difficulties, supporting hypotheses 6 and 7, respectively. By contrast, face perception and facial emotional expression recognition ability were not found to correlate significantly with the other two AQ dimensions (i.e., AQ-Social and AQ-Details), controlling for age (see Tables 1 and 2). As neither CFMT nor RMET correlated significantly with the Social Skills or Details subscales of the AQ, we focused only on the AQ-Communications subscale with respect to the following path analysis.
Path analytic models
Next, we tested a theoretically derived model predicting AQ-Communication. As can be seen in Figure 2, both face perception ability (β′ = –.21, p < .001, 99% CI = [–.34, –.06]) and facial emotional expression recognition ability (β′ = –.27, p = .001, 99% CI = [–.40, –.13]) were associated with statistically significant unique, negative effects as predictors of AQ-Communication. Thus, with regard to the first research question, greater face perception ability and facial emotional expression recognition ability were both associated independently with fewer self-reported BAP communication/mind reading difficulties. We note that a test of the difference between the face perception and facial emotional expression recognition unique effects (standardised beta-weights) onto AQ-Communication was not significant statistically, Δβ′ = –.06, p = .497, 99% CI = [–.31, .18]. With regard to the second research question, the indirect unique effect of face perception ability onto AQ-Communication via facial emotional expression recognition ability (i.e., .29 * –.27) was significant statistically, β′ = –.08, p < .001, 99% CI = [–.13, –.04], suggesting partial mediation. That is, some of the potential influence of face perception ability onto AQ-Communication runs through emotional expression recognition ability.
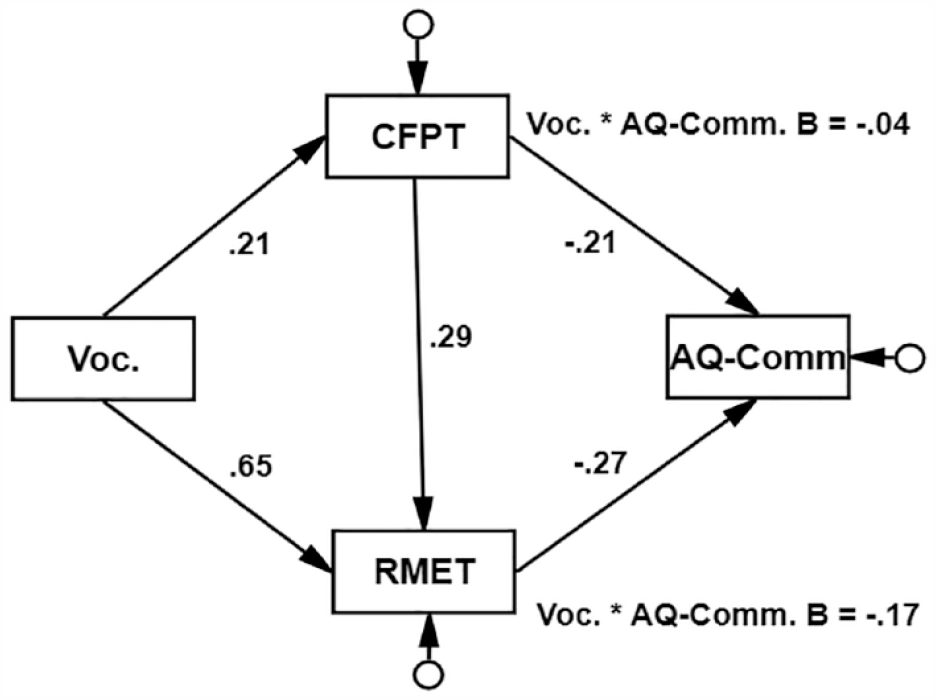
Disattenuated path analytic model completely standardised solution.
Finally, we examined the indirect effects of Vocabulary onto AQ-Communication (research question 3). The Vocabulary indirect effect via face perception ability was found to be significant, β = –.04, p < .001, 99% CI = [–.10, –.01]. In addition, the Vocabulary indirect effect via facial emotional expression recognition ability was also found to be significant, β = –.17, p < .001, 99% CI = [–.27, –.09]. We note that the Vocabulary indirect effect via facial emotional expression recognition ability was found to be statistically significantly larger than the corresponding indirect effect via face perception ability, Δβ = .13, p = .003, 99% CI = [.24, .01]. Furthermore, there was no clear evidence to suggest a direct effect of Vocabulary onto the AQ-Communication dimension, as the model depicted in Figure 2 was well-fitting, χ2(1) = 17.20, p < .001, CFI = .954, SRMR = .047. 5 The model accounted for 16.2% of the true score variance in AQ-Communication (model R2 = .162, p = .002, 99% CI = [.07, .26]). Thus, vocabulary, face perception ability, and emotional expression recognition ability combined predicted 16.2% of individual differences in self-reported difficulties discerning people’s thoughts/feelings in conversation (see Figure SIV for a supplementary model tested with a more conventional latent variable model and a non-pairwise deletion strategy).
Discussion
We found that face perception ability and facial emotional expression ability inter-correlated positively, and that a portion of that shared variance was accounted for by verbal ability. In addition, we found that both face perception ability and facial emotional expression ability correlated negatively (and significantly) with BAP, but only with the AQ-Communication dimension. Furthermore, both face perception ability and facial emotional expression ability predicted AQ-Communication, uniquely, and approximately to the same magnitude. We also found that face perception ability had an indirect effect onto AQ-Communication via face emotional expression ability. Finally, we found that verbal ability had a unique, indirect effect onto AQ-Communication via face emotional recognition ability, and also via face perception ability, but to a much smaller degree. Next, we interpret and discuss the implications of the findings for face perception ability, facial emotional recognition ability, and verbal ability, respectively.
Face perception ability and face emotional expression ability
The partial correlation between face perception ability and facial emotional expression ability (controlling for age) reported in this investigation (disattenuated r′ xy.z = .42; 18% shared variance) may be considered as relatively large for individual differences research (Gignac & Szodorai, 2016). Thus, these two face processes share nontrivial variance, and to about the same degree as face perception and face memory (McCaffery et al., 2018), supporting the notion of a global face processing factor (Verhallen et al., 2017). However, there is also evidence for some construct distinctiveness, as the correlation was far from 1.0.
Although we found evidence that facial emotional expression recognition ability mediated the total (negative) effect between face perception ability and the nonverbal communication dimension of BAP, it was only partial mediation (7% of the 16.2%). On one hand, such a result may be considered to be consistent with the neurophysiological account of autism (Nomi & Uddin, 2015), that is, there are diffuse idiosyncrasies in the brain relevant to face processing ability, including face perception ability, that, in turn, impact the desire/capacity to engage in nonverbal communication in people who score high on trait autism. However, consistent with the social motivation theory of autism (Dawson et al., 2005), it is also possible that a relative lack of experience socialising may impact negatively the development of face processing ability in people who score on trait-autism, and the impact is more generalised than simply emotion recognition ability. Theoretically, Bothe et al. (2019) suggested that face perception difficulties associated with BAP may arise from sensory sensitivities (e.g., over- or under-sensitive) that are also linked with higher scores on BAP (see Robertson & Baron-Cohen, 2017). More research in this area is encouraged to determine exactly how these dimensions could influence each other. Prior to doing so, however, it would be useful to determine whether the inclusion of unfamiliar face recognition ability, a key face processing ability with substantial individual differences (Wilmer, 2017) and possibly a negative correlate of BAP (Wilson et al., 2010), would reduce the direct effect between face perception and BAP to non-significance.
We also observed a significant, negative correlation between facial emotional expression recognition ability (i.e., RMET) and AQ-Communication (r = –.36; controlling for age). Our finding accords well with the correlation of –.31 between RMET and the AQ total scale reported by Miller and Saygin (2013), and the broader literature that has found ASD groups perform less well on recognising emotions in faces tests than non-ASD groups (e.g., Poljac et al., 2013). Our results extend the existing literature, as we estimated the effects across all three AQ dimensions, and the association was significant for only the AQ-Communication dimension, similar to Bothe et al.’s (2019) reported negative correlations between emotion matching/labelling and the AQ-Communication dimension (but not AQ-Details). In practice, people who score high on BAP may experience difficulties with social communication/mind reading, because they often fail to recognise accurately what emotions people express with their faces during conversations (Frith, 2009), as well as tend not to look at the eyes of a face (Dalton et al., 2005; Davis et al., 2017). We acknowledge alternative accounts, such as Cook et al. (2013), who contended that alexithymia, not autism, predicts emotion recognition ability. However, the majority of the items associated with alexithymia measures such as the Toronto Alexithymia Scale-20 (Bagby et al., 1994) are devoted to measuring difficulties in identifying and describing emotions—constructs highly similar conceptually to emotion recognition ability. We encourage further theoretical work to help distinguish alexithymia and dimensions represented by scores derived from objective measures of emotion processing ability.
Our results suggest that facial emotional expression recognition ability may be essentially uncorrelated (or weakly correlated, ⩽.10) with the AQ-Detail dimension, consistent with the wider failure to develop an empirically supportable theory to help explain the non-adaptive narrow interests commonly suggested to be characteristic of ASD (Levy, 2007; but see Davis et al., 2017). Our failure to identify any significant effects with the AQ-Social dimension is more difficult to integrate with the existing literature, however. Bothe et al. (2019) reported a significant, negative correlation between expression labelling and the AQ-Social dimension, though the correlation was non-significant with expression matching. Thus, taken together, it may be suggested that emotion recognition ability may have a more substantial association with the communication difficulties often encountered in BAP, in comparison to the more global social and non-social elements. Of course, with only three studies in the area of emotion recognition ability and BAP, firm conclusions would be premature.
We specified our path analytic model such that face perception ability and facial emotional expression recognition ability lead to individual differences in BAP. However, other researchers specify BAP dimensions that lead to face perception/cognitive processes (e.g., Bothe et al., 2019; Penton-Voak et al., 2007). Theoretically, it seems that the distinction between the two approaches resides in whether a more social/motivation theoretical orientation (BAP leading to ability) or a more neurophysiological theoretical orientation (ability leading to BAP) is used to guide the specification of the model. Consequently, our investigation may be viewed to be framed more closely with a primarily neurophysiological view of ASD/BAP (Nomi & Uddin, 2015), rather than a social/motivation view (Dawson et al., 2005). Of course, cross-sectional research cannot be expected to resolve the issue of directionality.
The role of verbal intelligence
Vocabulary correlated positively with both face perception ability and facial emotional recognition ability, as hypothesised. Given the correlation between vocabulary and face perception ability was not large (r ≈ .20), we believe the effect was simply an outcome of the well-known positive manifold typically observed across cognitive ability type tests (Euler & McKinney, 2019; Jensen, 1998). By comparison, vocabulary was much more substantially correlated with facial emotional expression ability (i.e., r ≈ .70), as measured by RMET. Our true score estimate is much larger than the meta-analytic observed score correlation reported by Baker et al. (2014) for verbal intelligence and RMET (r = .24). We believe our estimated correlation was larger (and more accurate) because our sample was a community sample, and we disattenuated the correlation for imperfect reliability. Thus, our results are consistent with the work that suggests that the perception of emotion is substantially dependent upon language (Fugate & Barrett, 2014).
Somewhat unexpectedly, vocabulary evidenced a statistically significant indirect effect onto the AQ-Communication dimensions via face perception ability, independently of the effects of facial emotional expression recognition ability. However, the effect was very small and perhaps practically inconsequential (β′ = –.04). By contrast, the unique, indirect effect of vocabulary onto AQ-Communication via facial emotional expression recognition ability was more substantial (i.e., β′ = –.17). Thus, vocabulary may play an indirect role onto BAP via its potential influence onto facial emotional expression recognition ability. Bishop et al. (2004) contended that those high in trait-autism experienced challenges in language usage, not language ability. Our results may be considered consistent with Bishop et al. (2004), in the sense that we did not observe a significant total or direct effect between vocabulary and BAP as measured by AQ. However, our results extend Bishop et al. (2004) by suggesting that vocabulary may have an indirect effect onto BAP, primarily through its potential influence on the ability to identify emotions in faces. Correspondingly, Otsuka et al. (2017) found that verbal fluency yielded a statistically significant indirect effect onto a measure of adaptive functioning via face emotion recognition ability.
Limitations
The dichotomous item-scoring strategy recommended for AQ (Baron-Cohen, Wheelwright, Hill, et al., 2001) was employed in this investigation. Research suggests that better validity (more variability) can be achieved by scoring the items 0–4 (e.g., Stevenson & Hart, 2017). Unfortunately, the manner in which AQ was programmed for this investigation precluded the possibility of employing a continuous scoring data analytic strategy. In addition, the vocabulary test yielded evidence of a ceiling effect. Furthermore, our total scale AQ mean was 21.01 (SD = 7.20), higher than that typically reported (i.e., 16.94; Ruzich et al., 2015). Thus, the degree to which our results generalise to a truly representative general population sample remains to be determined, although, on balance, we believe the limitations above led to some underestimation of effects, rather than overestimation.
Some of the emotion expression words included in RMET are relatively difficult (e.g., pensive), consequently, Baron-Cohen, Wheelwright, Hill, et al. (2001) made available a glossary to allow the participants to verify the meaning of the emotion word options. As we did not include the glossary in our protocol, the correlation between verbal ability and RMET was likely somewhat larger than it would have otherwise been.
We also acknowledge that the measurement of facial emotional expression recognition ability has been contended to be culture specific, at least to so some degree (Karmakar & Dogra, 2019), and RMET has not been evaluated extensively for cross-cultural validity; thus, some participants may have been biased against with respect to the measurement of their emotional expression recognition capacity. If this were the case, the reported results in this investigation would be attenuated. We note also that the RMET test scores were associated with internal consistency reliability of only ω = .58; however, such a value is typically reported in the literature (i.e., ≈ .60 to .65; Harkness et al., 2010; Vellante et al., 2013). Nonetheless, ideally, a more reliable version of RMET would be available. Finally, we acknowledge that several respectable measures of face perception ability (e.g., Glasgow Face Matching Test 2; White et al., 2022) and face emotion recognition ability (e.g., Geneva Emotion Recognition Test; Schlegel et al., 2014) have been published. Therefore, with a multi-test measurement approach, different results may have arisen in this investigation.
Conclusion
Difficulties in perceiving faces and identifying emotional expressions in faces may both play unique roles with respect to BAP-related nonverbal communication skill challenges. In addition, the relatively small correlations between the three BAP dimensions, in addition to the differential effects with face perception ability and face emotion recognition ability, underscores the importance of examining BAP at the sub-dimension level, rather than the commonly observed total scale level (English et al., 2020).
Supplemental Material
sj-docx-1-qjp-10.1177_17470218231203679 – Supplemental material for Face perception and facial emotional expression recognition ability: Both unique predictors of the broader autism phenotype
Supplemental material, sj-docx-1-qjp-10.1177_17470218231203679 for Face perception and facial emotional expression recognition ability: Both unique predictors of the broader autism phenotype by Gilles E Gignac, Romina Palermo, Ellen Bothe, Dana L Walker and Jeremy B Wilmer in Quarterly Journal of Experimental Psychology
Footnotes
Declaration of conflicting interests
The author(s) declared no potential conflicts of interest with respect to the research, authorship, and/or publication of this article.
Funding
The author(s) received no financial support for the research, authorship, and/or publication of this article.
Supplementary material
The supplementary material is available at: http://qjep.sagepub.com">qjep.sagepub.com
Data accessibility statement
Notes
References
Supplementary Material
Please find the following supplemental material available below.
For Open Access articles published under a Creative Commons License, all supplemental material carries the same license as the article it is associated with.
For non-Open Access articles published, all supplemental material carries a non-exclusive license, and permission requests for re-use of supplemental material or any part of supplemental material shall be sent directly to the copyright owner as specified in the copyright notice associated with the article.