
Abstract
Humans organise their social worlds into social and nonsocial events. Social event segmentation refers to the ability to parse the environmental content into social and nonsocial events or units. Here, we investigated the role that perceptual information from visual and auditory modalities, in isolation and in conjunction, played in social event segmentation. Participants viewed a video clip depicting an interaction between two actors and marked the boundaries of social and nonsocial events. Depending on the condition, the clip at first contained only auditory or only visual information. Then, the clip was shown containing both auditory and visual information. Higher overall group consensus and response consistency in parsing the clip was found for social segmentation and when both auditory and visual information was available. Presenting the clip in the visual domain only benefitted group agreement in social segmentation while the inclusion of auditory information (under the audiovisual condition) also improved response consistency in nonsocial segmentation. Thus, social segmentation utilises information from the visual modality, with the auditory cues contributing under ambiguous or uncertain conditions and during segmentation of nonsocial content.
Keywords
Introduction
Humans continuously make sense of their surroundings. For instance, when seeing a person pitch a tent, we automatically organise this action into discrete events, such as unfolding the tent, spreading it out, and inserting the poles (Zacks, 2020; Zacks, Speer, et al., 2006). The organisation of the environmental content into discrete events reflects the general process of event segmentation, or perceptual grouping by which incoming information is organised into meaningful units (Zacks, 2004; Zacks & Swallow, 2007; Zheng et al., 2020) which has recently been associated with specific brain networks and processing patterns (e.g., Stawarczyk et al., 2021). Similarly, social event segmentation reflects the ability to organise social events separately from nonsocial ones (Boggia & Ristic, 2015). Although social event parsing is thought to be an important process facilitating human social behaviour and understanding of our social environments (Boggia & Ristic, 2015; Zacks & Swallow, 2007), the contributing role of the two main perceptual modalities, visual and auditory perceptual information, remains unclear. Here, we examined the role of visual and auditory information, in isolation and in conjunction, and in social and nonsocial event segmentation.
Newtson and Engquist (1976) pioneered event segmentation using a unit marking procedure. Participants were asked to view a video clip and press a button when they judged that one meaningful event ended and another one began (Newtson and Engquist, 1976). Resulting event boundaries were identified as the time points in the clip for which the frequency of responses at the group level exceeded a standard deviation of the group mean. Newtson and Engquist (1976) observed a remarkable consistency in responses showing a high level of agreement in identifying the boundaries between events (Newtson, 1973; Newtson and Engquist, 1976). More recently, Boggia and Ristic (2015; see also Capozzi et al., 2019; Latif et al., 2019) extended this work to show that social information is grouped in distinct perceptual units compared to nonsocial information. Utilising a similar unit marking procedure, the authors presented participants with a clip involving several social and nonsocial elements and asked them to press a key when they judged one social (or nonsocial) event ended and another one began. As expected, participants overall consistently marked the boundaries of events. However, social event boundaries occurred separately from the nonsocial ones and overall showed higher group response agreement in the unit marking task. Furthermore, participants’ proportions of fixations directed to the eyes and face of the protagonists in the clip during the initial passive viewing and later social (but not nonsocial) segmentation task related reliably, suggesting that social event segmentation occurs spontaneously and captures naturalistic behaviour (Boggia and Ristic, 2015).
Both social and nonsocial segmentation are influenced by different types of sensory cues. Zacks (2004) investigated the contribution of visual movement and found that movement changes were predicted when participants indicated event boundaries (Zacks, 2004; see also Hard et al., 2006; Kurby & Zacks, 2022; Zacks, Swallow, et al., 2006). Similarly, for social segmentation, Latif et al. (2019) examined how auditory and visual movement information influenced social segmentation in contextually coherent relative to contextually incoherent clips (Latif et al., 2019). Results indicated that social but not nonsocial event boundaries were related to the dynamics of visual motion within the clip regardless of context coherence. However, in the contextually incoherent clip, participants’ social event boundaries were also influenced by the auditory information in that the frequency of their responses was significantly related to the intensity of the auditory signal. In other words, Latif et al. (2019) showed that social event segmentation was primarily driven by visual information when the content was presented within a typical coherent context (see also Wahlheim et al., 2022). However, auditory information aided social segmentation under conditions when the clip content was presented in a contextually incoherent manner. These results dovetail with work from Baron-Cohen and colleagues (1995, 2001), who hypothesised that visual modality was a primary vehicle of social information transmission (Baron-Cohen, 1995; Baron-Cohen et al., 2001; Wahlheim et al., 2022). Thus, while visual information appears to be an important source of information for social event segmentation (e.g., Latif et al., 2019; Zacks, 2004), it may be insufficient when the information contains stimulus ambiguities such as in cases of incoherent and/or incomplete contextual information. In these situations, auditory information appears to play a compensatory function (Latif et al., 2019; see also Davis et al., 1999).
However, this past work did not clarify the unique and joint contribution of visual and auditory modalities in social and nonsocial segmentation. The current study was aimed at addressing this question. To do so, we asked participants, who were randomly assigned to one of two experimental groups, to view a short clip containing a social interaction, and to segment this clip into social and nonsocial events. At first, each group viewed the clip containing only single-modality information—visual or auditory. Then, both groups viewed the clip containing both visual and auditory information. In line with past work (e.g., Boggia & Ristic, 2015), we expected the segmentation of social events to occur with higher response consistency relative to the segmentation of nonsocial events. Furthermore, we also expected responses under the audiovisual condition to yield overall higher response consistency in comparison to responses under the visual or auditory condition alone (Seitz et al., 2006; Zaki, 2013) as the integration between auditory and visual information is known to be important for social inferences (Dodd, 1977; Eisenberg et al., 2018; Zaki, 2013). However, we also expected that presenting the clip containing only visual or only auditory information in isolation might differently affect social and nonsocial segmentation, such that the information from a single modality alone might not be sufficient for optimal segmentation behaviour under all circumstances (Latif et al., 2019).
Methods
Participants
One hundred and twenty (N = 120) undergraduate students participated (108 Women; 1 Non-binary; Mean age = 20.5, range = 18–28) 1 . This sample size is in line with our previous work (e.g., Latif et al., 2019). Participants were recruited though the volunteer student participant pool and received course credits. All procedures were approved by the McGill University’s research ethics board.
Apparatus and stimuli
The experiment was coded in JavaScript using jsPsych (de Leeuw, 2015) and was administered online. Participants performed the task on their own computer devices producing data overall on par with our previous work, which employed similar online (Latif et al., 2019) and in-person (e.g., Capozzi et al., 2019) tests.
Figure 1 shows the stimuli and clip content. The stimuli were three versions of the same 135 s clip (1,024 × 768 pixels), which formed a part of the longer video that was first used in Boggia and Ristic’s (2015) original social event segmentation work, and later was examined in this shortened version by Capozzi et al. (2019). In the original work, Boggia and Ristic (2015) developed a video clip that was composed of 12 situations, all of which were filmed in a laboratory using constant lighting and without any editing cuts. Situations were independently standardised for length (to an average of 45 s; range = 30–63 s) and the number of people present (0, 1, or 2) such that in the original Boggia and Ristic (2015) stimulus video there were two social and two nonsocial situations, each containing zero, one, and two people. The shorter clip that was used in the present work and in Capozzi et al. (2019) depicts a social situation involving two people. In both Boggia and Ristic (2015) and Capozzi et al. (2019), this part of the clip was found to yield both social and nonsocial events. Specifically, in this clip (1) The actors play Sudoku individually while holding a conversation (Figure 1b; 0–27s); (2) One actor starts playing a different game (28–62s); (3) The actors start playing another game together talking about strategies (63–95s); (4) The game ends and the actors stop interacting (96–112s); (5) One actor continues to play individually while the other falls asleep (113–135s). Thus, the stimulus clip is well validated for content and its ability to elicit both social and nonsocial segmentation behaviour.
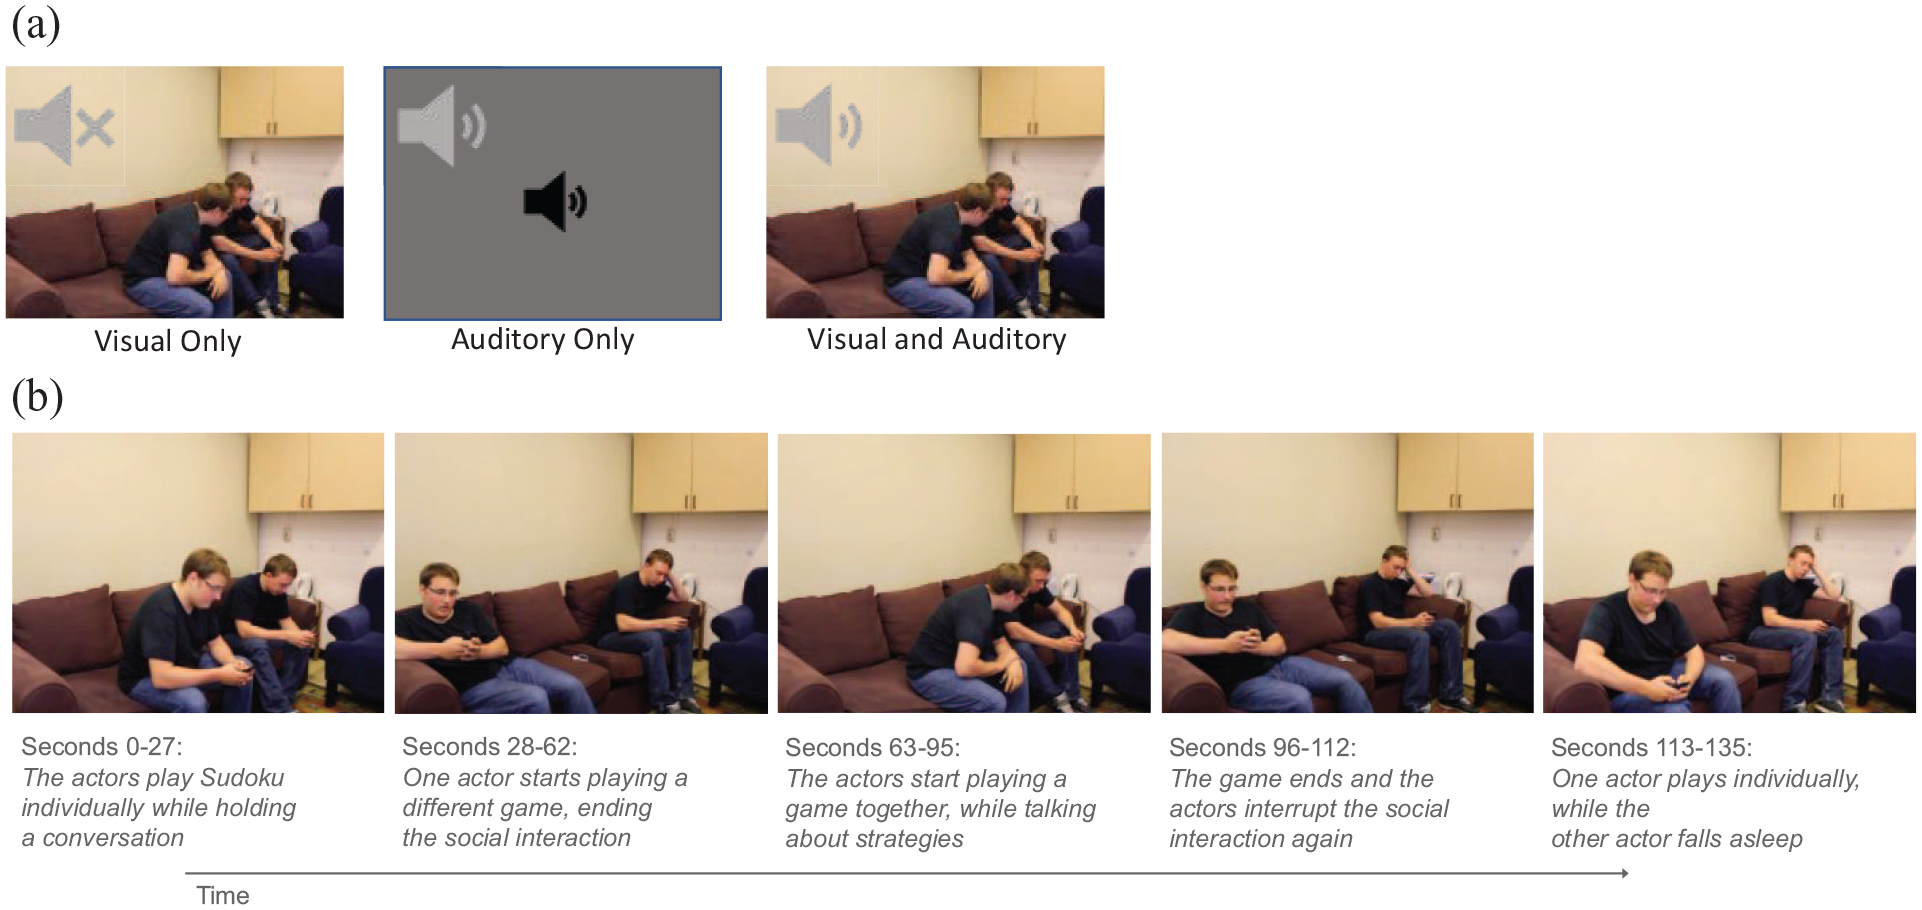
Example stimuli and Clip content. (a) Example stimuli presented under the visual, auditory, and visual and auditory conditions. The grey sound icons depicted in the top left corners are used for illustrative purposes and were not presented during the task. (b) Still images from the clip illustrating the content.
To investigate the contribution of sensory information in the auditory and visual domain, in the present work, participants first viewed the video clip in one of the two modalities (Figure 1a and Figure 2). Under the visual-only condition (Figure 1a), only the clip’s visual information was presented with the auditory content removed from the file. Under the auditory-only condition, only the clip’s auditory information was presented with the visual information removed from the file. Here, participants were presented with a grey screen showing a volume icon at the centre. Under the audiovisual condition, both the visual and auditory content were presented. The visual content of the clip content is depicted in Figure 1b. The transcription of the auditory content is presented in the online Supplementary Material.
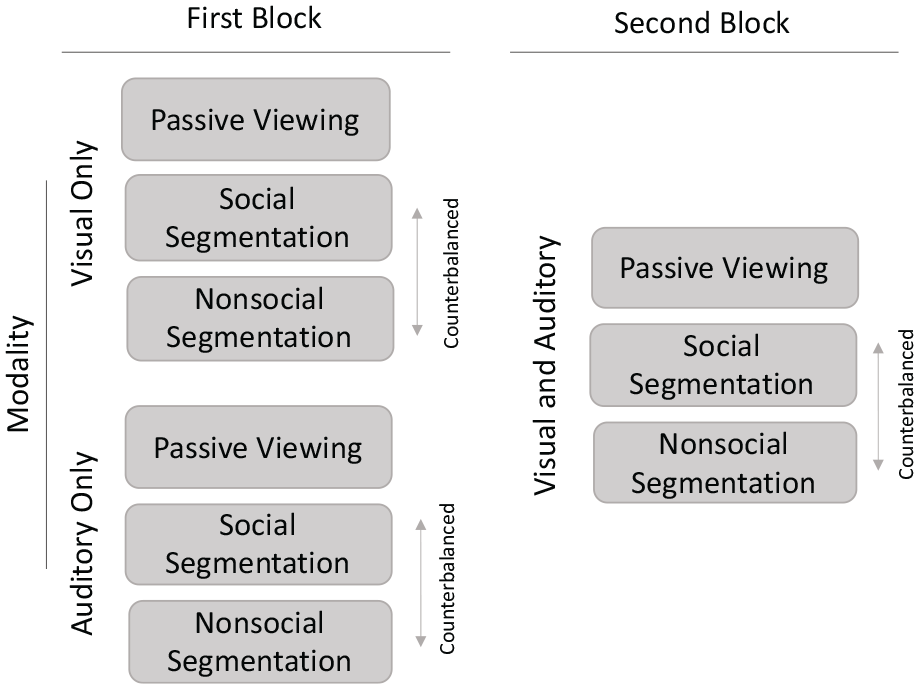
Schematic representation of the study design and conditions. In the first block, participants were assigned to either a Visual-only or Auditory-only group. They then at first passively watched the clip with a single modality either containing visual-only or auditory-only information. Then, the participants performed social and nonsocial segmentation tasks on the same clip in counterbalanced order. In the second block, all participants viewed the video containing both visual and auditory information. Passive viewing occurred first, followed by social and nonsocial segmentation tasks in counterbalanced order.
Design and procedure
Figure 2 shows the study design and task conditions. The study was a 2 × 2 × 2 mixed design with Group, Modality, and Task manipulated as variables. Group (Visual only; Auditory only; between-subjects) manipulated the type of perceptual information in which the clip was first shown. Participants were randomly assigned to view either the clip containing the visual-only information (N = 60) or the clip containing the auditory-only information in the first experimental block (N = 60). All participants viewed the clip containing both visual and auditory information in the second block.
Modality and Task were manipulated within subjects. Modality (2 levels: Visual or Auditory, Audiovisual) manipulated the type of perceptual information in the clip to examine if segmentation under impoverished conditions in which information was available in one modality only (Visual or Auditory) differed from segmentation under typical perceptual conditions (Audiovisual). Modality was presented in the same order for each group of participants (i.e., Visual or Auditory only in the first block and Audiovisual in the second block).
Finally, Task (2 levels: Social, Nonsocial) manipulated whether the participants performed a social or a nonsocial segmentation task. In the social segmentation task, participants were asked to indicate by a keypress when one social event had ended and another one had begun. In the nonsocial segmentation task, participants indicated when one nonsocial event had ended and another one had begun. The task order was counterbalanced across participants for each modality condition (see Figure 2).
The clip was presented three times in each modality condition, resulting in each participant viewing the clip a total of six times. In each block, participants first viewed the clip passively, to familiarise with the content. Passive viewing is typically included to ensure that the data reflect the effects of the manipulation itself rather than differences in video comprehension (Boggia & Ristic, 2015). As such, it is thought that passive viewing facilitates comprehension without affecting the later segmentation behaviour. Passive viewing instructions read: “Please
We have deliberately left the task instructions open, as we intended to capture naturalistic segmentation behaviour rather than to measure task-specific segmentation based on explicit instructions. Boggia and Ristic (2015) initially showed that this manner of instruction is effective at capturing naturalistic social segmentation processes, as attending to social cues in videos, such as faces and eyes during the initial passive viewing, was reliably associated with social but not nonsocial segmentation keypress behaviour. Furthermore, if instructions were not meaningful to participants and/or did not meaningfully induce differences in perception of social and nonsocial contexts, one would expect to observe no reliable effects of such instructional manipulation resulting in a random pattern of keypress data. A comparison of responses elicited by explicit vs. open instructions remains to be conducted in future work as well as a comparison of whether the two types of instruction (social vs. nonsocial segmentation) are equally well understood by the participants.
Across all conditions and participants, instructions were always the same and no further elaborations or definitions were provided. Participants controlled the start of each video and were instructed that once the trial began, they would be unable to pause the video. The experiment took about 1 hr. 2
Data and measures
Keypress data were used to examine both group-level and individual-level performance. At the group level, we analysed event boundaries to assess the group agreement in event marking. At the individual level, we analysed Reliability and Consistency in keypresses to further capture individual participants’ variability in responses. We have chosen to keep the event boundary analyses and procedures the same across the current and past work to provide a solid ground for replicability and extension of the findings relating to social and nonsocial segmentation (but see Footnote 3 for a convergent alternative treatment of data).
Event boundaries
As in previous research, event boundaries reflected the time points identified as the end of one event and the beginning of another one. To summarise event boundaries, the 135-s video clip was divided into sixty-seven 2-s time bins. In contrast to Boggia and Ristic (2015), who first analysed social behaviour using 15-s bins, this parsing provided a much more detailed account of the segmentation behaviour during the same part of the clip. Similar to naturalistic scenes where events do not abruptly offset or onset, the 2-s bin was established to guard against identifying discrete event boundaries across two adjacent bins that would unlikely reflect two distinctively perceived events and was used in past research in a similar vein (e.g., Capozzi et al., 2019; Eisenberg et al., 2018). Because of this, we decided on this temporal binning prior to data collection.
For each participant, we calculated keypress occurrence at each of the 67-time bins, controlling that no multiple keypresses occurred within the same bin (no multiple-press was detected). Then, we calculated the frequency of keypresses across all participants for each of the time bins, which we then transformed into z-scores. A time bin was identified as an event boundary when the response frequency for that bin exceeded two standard deviations from the group mean (see Capozzi et al., 2019). This threshold provided a conservative analysis of the event boundaries. We believe that such a stringent threshold captures commonalities in overall group behaviour.
We repeated this process separately for each task (social and nonsocial), each modality (visual, auditory, and audiovisual), and both groups (group that received the visual-only clip first, group that received the auditory-only clip first).
Reliability
Reliability was defined as the individual participant’s proportion of keypresses that were made within a group-defined event boundary. As such, it reflected the participant’s precision in identifying group-defined event boundaries. Reliability was calculated as the proportion of keypresses for each participant that were made within an event boundary relative to the total number of keypresses made by that participant.
Consistency
Consistency was defined as the proportion of group-level defined event boundaries that each participant also identified. As such, it reflected the extent to which each participant was in-line or was sensitive to the group-level identification of event boundaries. Indirectly, consistency also reflects group consensus in making event boundaries, as increased individual consistency would also indicate increased group consistency. Consistency was calculated as the proportion of each participant’s keypresses that were made within a group-defined event boundary relative to the total number of group-defined event boundaries in each condition (cf. Kurby & Zacks, 2011 for similar measures).
Thus, for example, a participant with high reliability and high consistency in responses would have identified as many event boundaries as the group as a whole and they would have done so using a low number of keypresses. In contrast, a participant with high consistency and low reliability in responses would have also identified as many event boundaries as the group, but they would have used more keypresses to do so.
Results
Event boundaries
Figure 3 illustrates the frequency of responses as a function of clip time for each modality and task condition.
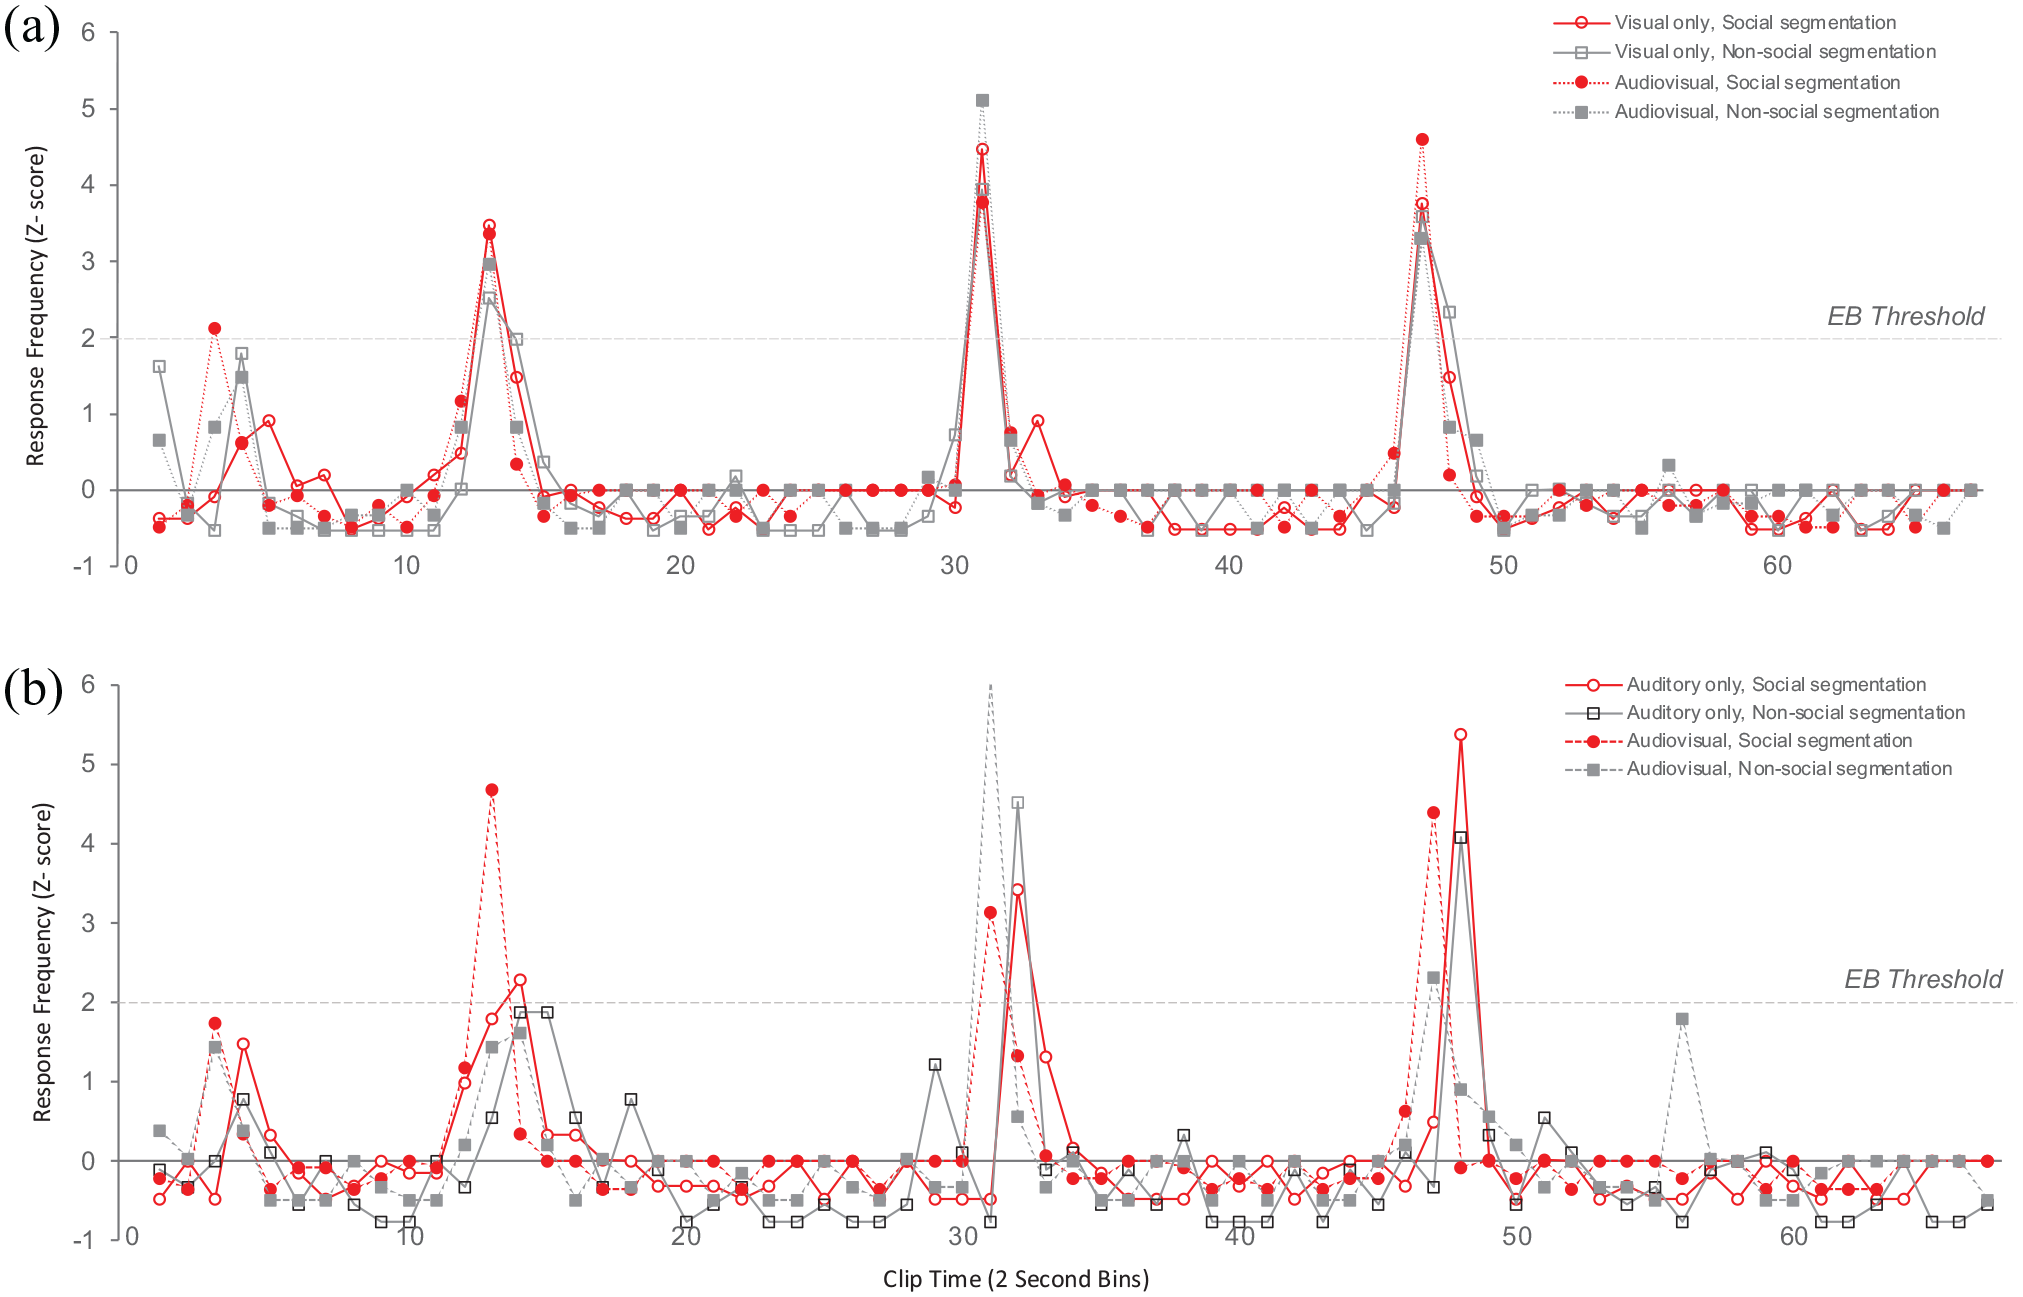
Response frequency (z-scores) as a function of Group (a: Group—Visual-only clip first; b: Group—Auditory-only clip first), Clip time (2 s bins) for each Modality and Task condition. The horizontal line indicates the threshold for Event Boundaries (EB Threshold—2 standard deviations above the mean).
Visual inspection of this Figure suggests that in the group that received the visual-only clip first (Figure 3a), event boundaries at bin 14 (Actors start playing games individually), bin 32 (Actors start playing together again), and bin 48 (Actors ending the interaction) largely overlapped across the visual and audiovisual modalities and for social and nonsocial segmentation tasks. A unique event boundary occurred at bin 4 (Actors starting conversing) for the social segmentation task in the audiovisual condition. This pattern of event boundaries in the audiovisual condition replicates previous work using the same clip by Capozzi et al. (2019).
Interestingly, the group that received the auditory-only clip first (Figure 3b) showed a somewhat different pattern of event boundaries. Bin 14 was identified as an event boundary for the social segmentation task in this group only and occurred in bin 15 rather than bin 14. The remaining event boundaries were consistent with other conditions but were identified with a slight time delay (i.e., bins 32 and 48).
In general, these data replicate previous research (Boggia & Ristic, 2015; Capozzi et al., 2019) by showing overlapping social and nonsocial event boundaries, which is consistent with the notion of natural social interactions contain alternating and possibly overlapping social and nonsocial events. Our results also suggest that viewing the clip containing the auditory-only information first changed and delayed the perception of event boundaries relative to viewing the clip containing both visual and auditory information. This may be a result of increased error-prediction processes due to increased task difficulty under sensory information ambiguity (Eisenberg et al., 2018). Furthermore, this ambiguity in segmentation behaviour appeared to mostly lie in determining nonsocial rather than social event boundaries, which is reflected in the data showing the most pronounced variability in event boundaries reaching the event threshold under the condition in which participants viewed the clip containing audio information only first. Within this context, it is possible that some nonsocial events are marked as sub-threshold as they did not reach the event boundary threshold, given the ambiguity in determining event boundaries under conditions of sensory uncertainty.
Future research is needed to understand the degree of overlap in the composition of social and nonsocial events. This could, for example, be done by measuring memory content for social and nonsocial events as well as by utilising additional measures like eye tracking or neuroimaging, which could provide a link to the informational content within social and nonsocial boundaries.
Reliability
To examine participants’ reliability in identifying event boundaries, we next subjected the proportions of keypresses made within an event boundary to a mixed effects ANOVA with Task (Social, Nonsocial) and Modality (Visual/Auditory, Audiovisual) included as within-subject factors and Group (Visual-only clip first, Auditory-only clip first) as a between-subject factor. This analysis indicated a main effect of Task, F(1,118) = 8.95, p = .003, ηp2 = .070, whereby participants were more reliable at identifying social (M = .414, SE = .020, 95% CI [.375, .454]) than nonsocial events (M = .334, SE = .024, 95% CI [.237, .381]. Figure 4a plots reliability as a function of task.
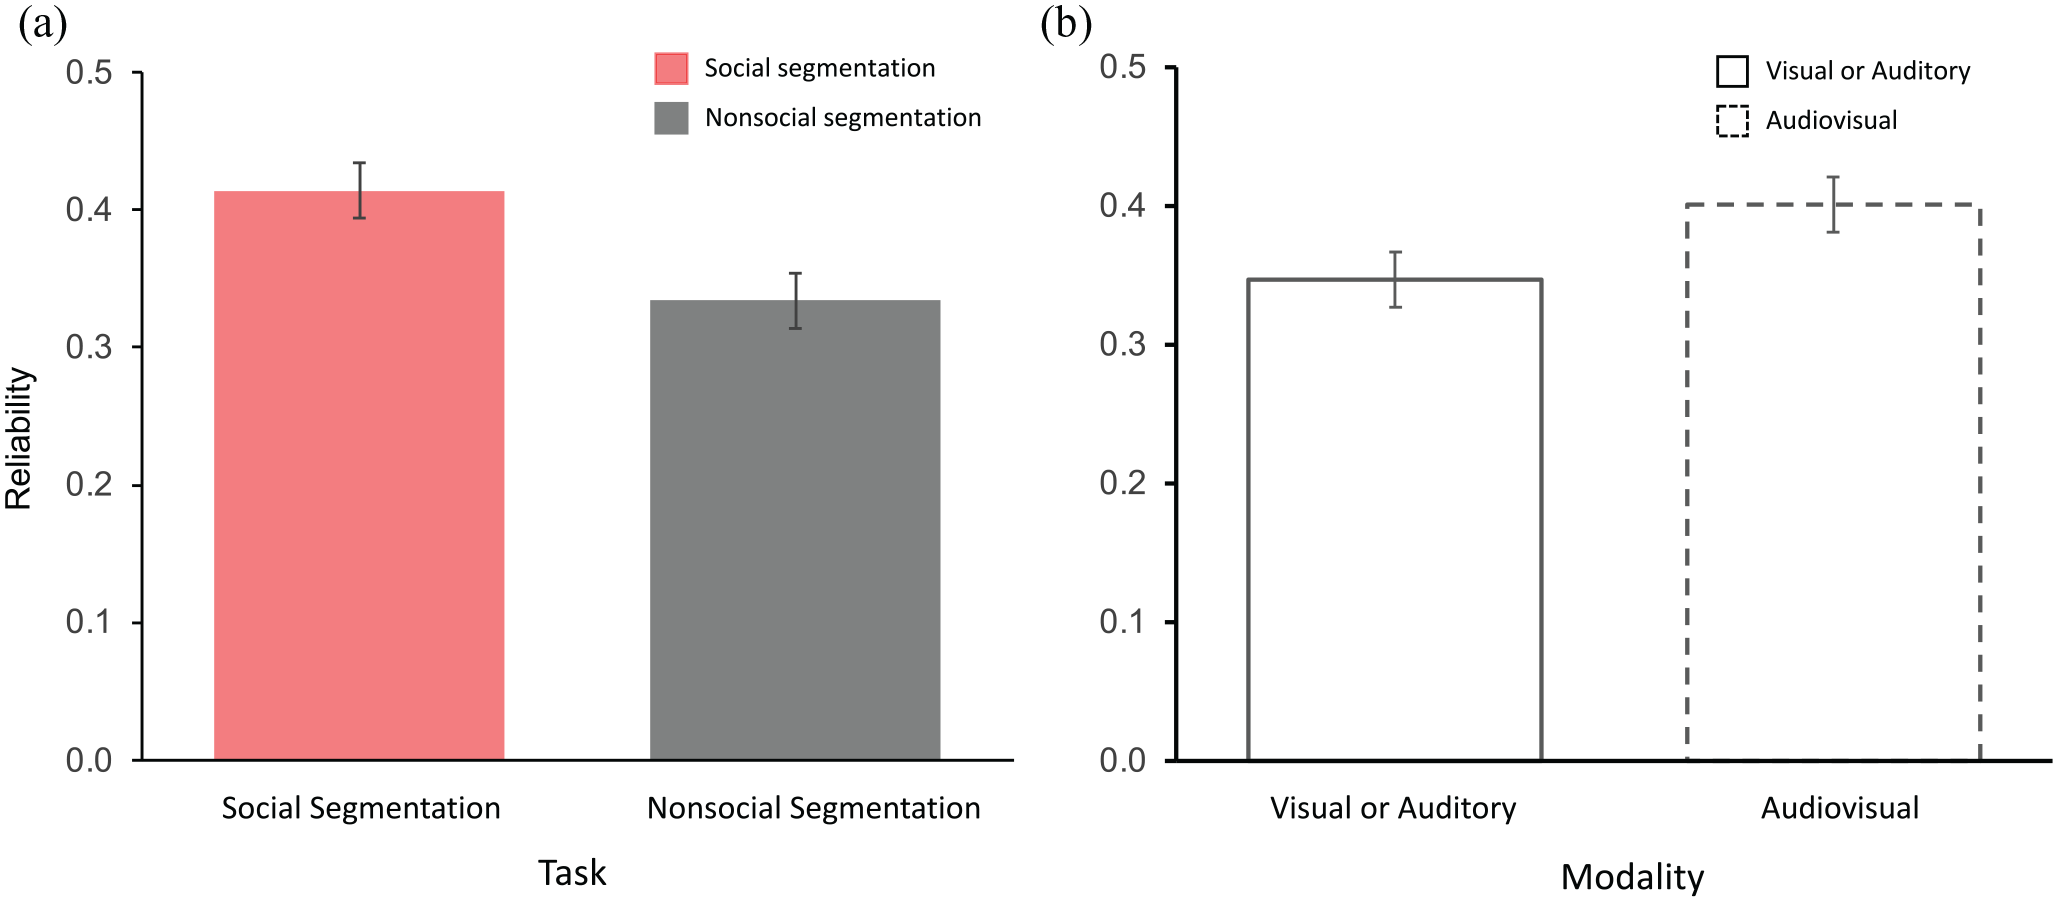
There was also a main effect of Modality, F(1,118) = 5.129, p = .025, ηp2 = .042, with higher reliability in responses for the clip containing both visual and auditory information (M = .401, SE = .022, 95% CI [.357, .446]) relative to the clips containing information in one modality only, either visual or auditory (M = .347, SE = .020, 95% CI [.308, .386]; Figure 4b). The Task × Modality interaction was not significant (F < 1).
Consistency
To examine participants’ consistency in identifying the event boundaries, we next subjected the proportion of each participant’s keypresses that were made within a group-defined event boundary to the same mixed effects ANOVA, with Task (Social, Nonsocial) and Modality (Visual/Auditory, Audiovisual) included as within-subject variables and Group included as a between-subject variable.
The analysis indicated a significant main effect Task, F(1,118) = 9.595, p = .002, ηp2 = .075, with greater consistency in responses for social (M = .504, SE = .022, 95% CI [.462, .547]) than nonsocial segmentation (M = .416, SE = .025, 95% CI [.367, .464]) and a marginal effect of Modality, F(1,118) = 3.505, p = .064, ηp2 = .029, with the response consistency for the clip containing either visual or auditory information (M = .433, SE = .023, 95% CI [.388, .478]) numerically lower than the response consistency for the clip containing visual and auditory information (M = .487, SE = .024, 95% CI [.440, .543]).
Importantly, this ANOVA also returned a three-way interaction between Group, Task, and Modality, F(1,118) = 3.971, p = .049, ηp2 = .033, indicating that consistency in responses varied as a function of whether the participants received the clip containing visual information first or auditory information first. To follow up on this interaction, we analysed consistency using two separate repeated measures ANOVAs conducted for each Group (Visual-only first, Auditory-only first) with Task and Modality included as variables. Figure 5 plots consistency as a function of Group, Task, and Modality.
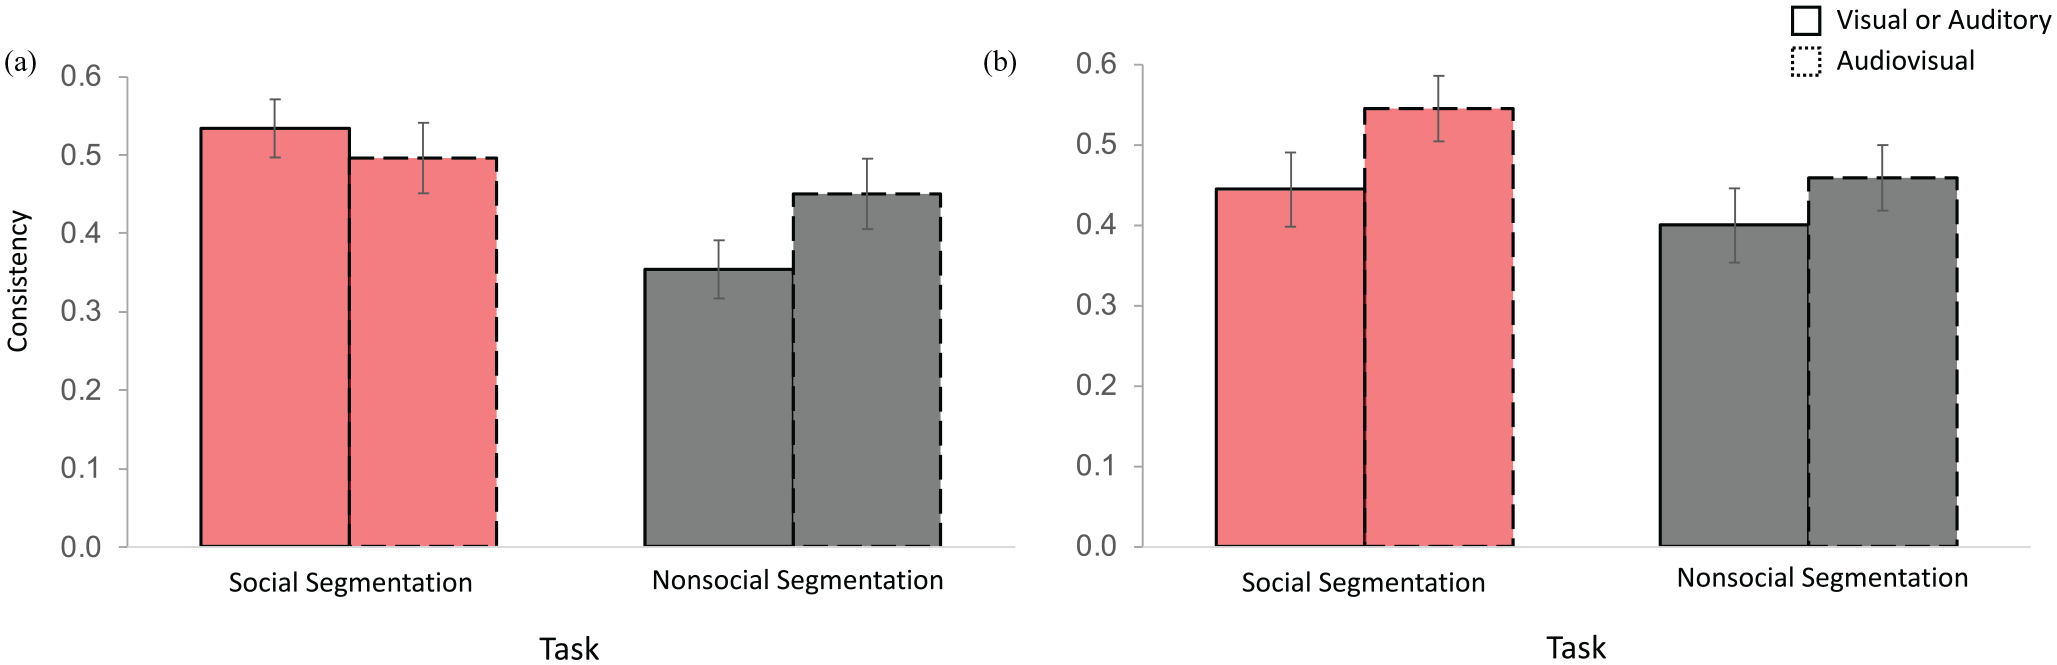
Consistency results. (a) Consistency for the group that has received the visual-only clip first as a function of Task and Modality. (b) Consistency for the group that has received the auditory-only clip first as a function of Task and Modality. Error bars reflect standard error.
The group that received the visual-only clip first (Figure 5a) confirmed the general main effect of Task, F(1,59) = 10.702, p = .002, ηp2 = .154, with higher consistency for social relative to nonsocial segmentation. In addition, the ANOVA revealed a two-way interaction between Task and Modality F(1,59) = 4.345, p = .041, ηp2 = .069. This interaction shows that the availability of visual and auditory information improved consistency for nonsocial (t(59) = −2.078, p = .042, two-tailed, paired) but not for social segmentation (t < 1, p = .497) relative to the availability of visual information only. As a result, social segmentation elicited higher agreement than nonsocial segmentation in the visual-only clip (t(59) = 3.913, p < .0001) but not in the audiovisual clip (t < 1, p = .343). The main effect of Modality was not reliable (F < 1). No reliable main effects or interactions were found in the group that received the auditory-only clip first (Figure 5b; Fs < 3.484, ps > .067).
To sum, individual-level results indicated that consistency in responses was higher for social relative to nonsocial segmentation and when the clip contained both visual and auditory information. Thus, both group and individual segmentation metrics indicated that social segmentation was more robust than nonsocial segmentation, overall. Reliability data additionally indicated that presenting the clip with auditory information alone had a limited effect on response reliability in both social and nonsocial segmentation tasks. However, presenting the clip in the visual modality only benefitted reliability in social segmentation, whereas adding the auditory information additionally benefitted reliability in nonsocial segmentation as well, thus mitigating the differences in performance between social and nonsocial segmentation tasks.
One might wonder if these results could be partially influenced by practice effects since participants segmented the same clip four times. There are three key reasons why we believe practice effects do not account for our data. One, our main question concerned understanding segmentation behaviour between the groups who first viewed the clip containing single auditory or visual modality information. Critically, exposure time in this comparison was equated across the two conditions. Two, the analyses of Group, which also implicitly examined the effects of task order, indicated differences across segmentation behaviour (social vs. nonsocial segmentation) despite the same presentation exposure. That is, these results showed that there were differences in segmenting the audiovisual clip depending on whether this clip was preceded by the presentation of the clip in auditory or visual modality only. This once again shows that exposure time did not determine the results. Finally, one could also predict that practice effects would be associated with response changes, specifically a decrease in the frequency of responses with increasing task exposure. If so, one would expect to find differences in the frequency of responses across the segmentation blocks in the auditory and visual groups. To examine this possibility, we have analysed the frequency of responses in each group using a repeated measures ANOVA which compared the number of keypresses across the four blocks of task (i.e., single modality_social; single modality_nonsocial; both modalities_social; both modalities_nonsocial) in each group (Auditory only; Visual only). No reliable differences in response frequency were found across tasks in either group (Auditory only, F(3,177) = 1.544, p = .205; Visual only, F(3, 177) < 1). Thus, the differences in perception rather than exposure time appear to influence how social and nonsocial events are segmented under conditions of impoverished and typical availability of perceptual information 3 .
Discussion
Human interactions contain information in multiple sensory modalities (Zaki, 2013; see also Chen & Hong, 2018; Kingsbury & Hong, 2020). In this study, we examined how visual and auditory information, in isolation and in conjunction, influenced social event segmentation. To do so, participants were first asked to segment social and nonsocial events in a clip that contained either visual-only or auditory-only information (Visual or Auditory condition). This was followed by a task in which they performed the same segmentation tasks with the clip which now contained both visual and auditory information (Audiovisual condition). The data showed that participants identified both overlapping and nonoverlapping social and nonsocial event boundaries across the task and modality conditions. Higher consistency and reliability in responses were found for social relative to nonsocial events and in the audiovisual condition relative to either the auditory or the visual condition, especially for the group that viewed the clip in the visual-only modality first. We next discuss three points related to these results.
First, our finding that event boundaries were consistently identified across modalities and tasks replicates previous studies (Boggia & Ristic, 2015; Capozzi et al., 2019) and supports the notion that event perception is relatively robust to environmental contextual variations (e.g., Latif et al., 2019). More specifically relating to social and nonsocial segmentation, and also replicating past work, here we once again found overlapping and nonoverlapping social and nonsocial event boundaries (Capozzi et al., 2019). These overlapping event boundaries may reflect the perception of an alternation of social and nonsocial events, with event boundaries reflecting transitions between these events. However, although the event marking procedure indicated overlapping social and nonsocial units, which may reflect the holistic perception and representation of the social situations in natural interactions (e.g., Capozzi et al., 2019), our additional measures of response Reliability and Consistency, which are agnostic to the type of an event boundary, suggested important processing differences in the marking of social and nonsocial events. Thus, although social and nonsocial event boundaries may be perceived and/or reported to occur at the same time, the nature of the underlying perceptual grouping that leads to social and nonsocial units likely differs.
We also found distinct event boundaries as a function of modality and task. Notably, in the group that received the visual clip first, bin 4 emerged as a unique social event breakpoint for the audiovisual condition. Similarly, in the group that received the auditory-only clip first, bin 14 emerged as a unique social boundary under the audiovisual condition, but it occurred later, that is, at bin 15 than the corresponding event boundary found for the group that received the visual-only clip first. Interestingly, no unique events were associated with the clip that presented auditory-only information even though the clip contained unique sounds associated with games the actors were playing. However, since the work on event segmentation remains mainly based on the keypress behaviour elicited by a limited number of video clips, future studies are needed to understand how social segmentation behaviour may generalise to other types of more complex stimuli or real-life interactions.
Furthermore, events which were identified during auditory-only conditions lagged the same ones identified during the visual-only or visual and auditory conditions. This occurred similarly for social and nonsocial segmentation tasks, suggesting a similar role of auditory information in both types of responses. Both the traditional thresholding procedure and correlation approaches yielded converging results on this question. Although preliminary, these temporal effects between segmentation behaviour may suggest differences in the role that visual and auditory information may play in the formation of event boundaries. This possibility warrants further investigation as it may indicate that visual information in the environment may carry stronger diagnostic value for the transmission of social information that subsequently influences social event segmentation. This notion would be consistent with the theoretical accounts implicating visual information as a key vehicle for social communication (e.g., Baron-Cohen, 1995). Future research is also needed to examine how information in the auditory modality may influence social event segmentation. One possibility is that when both visual and auditory information is available, auditory information supplements visual cues by providing richer context. In contrast, when visual information is not available, contextual information created by the auditory cues may not be sufficient on its own to create the unambiguous perceptual representation required for social parsing and thus may be processed in a more deliberate fashion, affecting the timing of segmentation processes. Future tests investigating how the availability of different auditory (e.g., speech, inanimate object sounds) and visual features (e.g., movement; Latif et al., 2019) may affect social and nonsocial segmentation would be able to shed light on the specific role of auditory signals in social event segmentation (for discussion, see Aglioti & Pazzaglia, 2011; De Groot et al., 2014; Groyecka et al., 2017; Hirst et al., 2018; Sharda et al., 2018; Wass et al., 2020).
Second, our measures of Reliability and Consistency in keypresses were able to reveal whether perceptual modalities influenced data in individual responses as well. Consistency, or a measure of the strength of the group consensus, or individual sensitivity to group event boundaries, was higher when both sources of perceptual information were present (i.e., visual and auditory) relative to when only partial perceptual information was present (i.e., visual or auditory). This result is in line with our hypotheses and is consistent with the notion that environment perception is fundamentally multisensory (Driver & Noesselt, 2008), with humans being better able to analyse and interpret their environment when more sources of perceptual information are present (i.e., multisensory perception vs. unisensory perception; Ball et al., 2018; Driver & Noesselt, 2008; Gondan et al., 2005; Van der Burg et al., 2008). The present study adds to this literature by showing that multisensory perception (i.e., the integration of auditory and visual information under the audiovisual condition of this study) also facilitates group consensus during social event segmentation (Zacks, Swallow, et al., 2006).
Third, both Consistency and Reliability in responses were overall greater when segmenting social relative to nonsocial events. Thus, Consistency data indicated that participants agreed more with the group in the identification of social relative to nonsocial event boundaries, whereas Reliability data indicated that participants were more precise in parsing social event boundaries relative to nonsocial event boundaries. Together, these findings are once again consistent with our hypotheses and replicate previous studies showing that social segmentation may be more natural and less effortful relative to nonsocial segmentation (Boggia & Ristic, 2015; Capozzi et al., 2019; Latif et al., 2019).
Importantly, Reliability data also indicated some differences across modality conditions. Specifically, in the group that received the visual-only clip first, the availability of information in both modalities improved nonsocial but not social segmentation performance. Response Consistency for nonsocial segmentation was lower under the visual-only condition relative to the audiovisual condition, whereas Consistency for social segmentation remained seemingly unaffected by the addition of auditory information. As such, these data indicate that visual information may be sufficient for social segmentation, thus extending and clarifying previous research on the primary role of visual information in social segmentation (Capozzi et al., 2019) and cognition (Emery, 2000). However, these data also indicate that visual information alone may not optimally support nonsocial segmentation, which instead appears to benefit more from the integration of auditory and visual information. This finding is consistent with the idea that nonsocial segmentation is a less spontaneous process than social segmentation (Boggia & Ristic, 2015) and as such may require richer information sources than social event segmentation (Boggia & Ristic, 2015). That is, in their original work, Boggia and Ristic (2015) reported that later social segmentation was more reliably linked to looking behaviour and attention paid to social cues during the initial passive viewing as compared to nonsocial segmentation, which was unrelated to patterns of looking during the passive viewing condition. This was interpreted to indicate that social segmentation task may capture the naturalistic perceptual and attentional processes while nonsocial segmentation may be based on a more deliberate task-relevant behaviour. As such, nonsocial segmentation may reflect a more deliberate process and thus require a richer source of environmental information relative to social segmentation, which may occur more spontaneously. Further to the idea implicating intentionality in nonsocial segmentation, past research suggests that visual information alone may be insufficient to resolve stimulus ambiguity in case of incoherent and/or incomplete contextual information (Latif et al., 2019; Lusk & Mitchel, 2016) and adds to the literature by pointing to the possibly fundamental role that auditory information has in the perception of complex naturalistic scenarios, in which visual information is not always precise and fully available (e.g., head and body movements momentarily obscuring fine-grained information such as facial expressions, eye-gaze direction, lip movements) and both social and nonsocial events unfold dynamically. Alternatively, the nonsocial segmentation task may be less well defined in general, given the relatively precise nature of social information in real life. Further research is needed to explore the nature of social and nonsocial event segmentation.
A question about the relationship between social and nonsocial segmentation dovetails with this discussion. It is possible that social and nonsocial segmentation may be independent processes, as social segmentation may occur spontaneously, and nonsocial segmentation requiring more deliberate task-relevant behaviour. This possibility would predict that social and nonsocial events could occur both separately and in an overlapping fashion, which we have observed here and in our previous work (Boggia & Ristic, 2015). Alternatively, it is also possible that social and nonsocial segmentation both rely on the general segmentation process which, depending on the task, utilises different environmental cues to parse the content. This account would predict more sequential processing of social and nonsocial boundaries, leading to nonoverlapping rather than overlapping social and nonsocial boundaries, given the centrality of theorised control processes. The present data agree with this notion less, since the social and nonsocial boundaries mostly overlapped. Future work is needed to understand how the processes of social and nonsocial segmentation relate, via, for example, control mechanisms or processing of available cues. Understanding the precise nature of social and nonsocial events, the spatial and temporal determinants of their boundaries, and the environmental cues which trigger social and nonsocial segmentation and grouping, would likely require integrated measurements from subjective (e.g., keypress) and objective measures (e.g., eye tracking, neuroimaging), which would be able to capture how differences in external inputs affect, change, and modulate internal processes relating to demarcation of social and nonsocial events and resulting grouping. For example, one could observe that similar cues may trigger social and nonsocial events in different environmental contexts and social contents. Alternatively, one could also find that some sensory cues signal social content more strongly than nonsocial content and, as a result, would lead to robust social grouping irrespectively from a larger context, as we have reported before (e.g., Latif et al., 2019).
Finally, we raise two points worth future consideration. One, while the classic approaches to the analyses of segmentation behaviour have been based on the thresholding of responses across bins, novel analytic approaches (e.g., Sasmita & Swallow, 2023) overcome some of the shortcomings of these classic approaches, such as variability in group and individual data (e.g., Swallow & Wang, 2020), potential arbitrariness of the choices of bin length and event boundary thresholds to provide a more objective way of quantifying both group and individual event perception data. Within this context, it would be important to apply those novel considerations to future work in social segmentation. Two, here we have introduced the measures of Consistency and Reliability in individual segmentation behaviour, which we reasoned captured two alternative ways in which individual segmentation behaviour connected with the overall group segmentation behaviour. These metrics conceptually connect well with the original Kurby and Zacks (2011) metric of segmentation agreement in which individual participants’ agreement with overall group behaviour is determined based on the correlation between individual’s indication of an event boundary and the proportion of participants who indicated an event boundary at each time bin. The main difference is that the segmentation agreement metric in Kurby and Zacks (2011) reflected a correlation between individual participants’ event boundary segmentation and the proportion of the group who indicated an event boundary at each time bin whereas the metrics we report here reflects two related but different aspects of the proportion of individual participants’ responses that align with group-level behaviour. Although the current approach may in general be vulnerable to event boundary threshold calculation and frequency of responding, it nevertheless contributes an additional layer of information to the individual segmentation behaviour performance.
To sum, the results of the present study show that social event segmentation utilises multiple sources of perceptual information, which is consistent with the notion that social interactions are rich and nuanced experiences that afford multiple levels of processing. However, they also suggest that information from the visual modality drives social segmentation more strongly than information from the auditory modality, which appears to exert a complementary function by aiding the understanding of rich and complex social situations.
Supplemental Material
sj-docx-1-qjp-10.1177_17470218231176471 – Supplemental material for The role of visual and auditory information in social event segmentation
Supplemental material, sj-docx-1-qjp-10.1177_17470218231176471 for The role of visual and auditory information in social event segmentation by Jelena Ristic and Francesca Capozzi in Quarterly Journal of Experimental Psychology
Footnotes
Acknowledgements
The authors wish to thank Emma Ponath and Nida Latif for their help with the project.
Declaration of conflicting interests
The author(s) declared no potential conflicts of interest with respect to the research, authorship, and/or publication of this article.
Funding
The author(s) disclosed receipt of the following financial support for the research, authorship, and/or publication of this article: Supported by the grants from the Natural Sciences and Engineering Council of Canada (NSERC; JR), Social Sciences and Humanities Research Council of Canada (SSHRC; JR; FC), William Dawson Funds (JR), and Fonds de Recherche du Quebec (FC).
Notes
References
Supplementary Material
Please find the following supplemental material available below.
For Open Access articles published under a Creative Commons License, all supplemental material carries the same license as the article it is associated with.
For non-Open Access articles published, all supplemental material carries a non-exclusive license, and permission requests for re-use of supplemental material or any part of supplemental material shall be sent directly to the copyright owner as specified in the copyright notice associated with the article.