
Abstract
Approach-avoidance conflict is observed in the competing motivations towards the benefits and away from the costs of a decision. The current study investigates the action dynamics of response motion during such conflicts in an attempt to characterise their dynamic resolution. An approach-avoidance conflict was generated by varying the appetitive consequences of a decision (i.e., point rewards and shorter participation time) in the presence of simultaneous aversive consequences (i.e., shock probability). Across two experiments, approach-avoidance conflict differentially affected response trajectories. Approach trajectories were less complex than avoidance trajectories and, as approach and avoidance motivations neared equipotentiality, response trajectories were more deflected from the shortest route to the eventual choice. Consistency in the location of approach and avoidance response options reduced variability in performance enabling more sensitive estimates of dynamic conflict. The time course of competing influences on response trajectories including trial-to-trial effects and conflict between approach and avoidance were estimated using regression analyses. We discuss these findings in terms of a dynamic theory of approach-avoidance that we hope will lead to insights of practical relevance in the field of maladaptive avoidance.
Many of our daily decisions require us to consider the potential for both positive and negative outcomes, and such evaluations influence whether we decide to engage in or avoid certain activities. For instance, we might consider the pros and cons of leaving a stable job (e.g., “I’ll be able to find something that aligns with my current interests, but what if it takes longer than expected or if it doesn’t pay well”), or weigh the benefits of taking a medication against its noxious secondary effects. Situations that include both a motivation to approach and avoid are termed approach-avoidance conflicts (AACs; Corr, 2013; Elliot, 2006; Lewin, 1935).
The investigation of AACs has a long history in psychology. Lewin (1935), drawing on field concepts from modern physics, defined motivational conflict as “the opposition of approximately equally strong field forces” (p. 88; see also Kelso, 1995; Killeen, 1992; Marr, 1992 for similar contemporary propositions). According to Lewin, when an organism encounters an AAC, the potential outcomes exert competing forces on the person’s actions until there is sufficient difference in the forces in favour of one action (or compatible actions). Thus, when conflicts arise, the stronger the conflict is (i.e., the more similar the competing valence forces), the longer a person will remain undecided prior to eventually producing the winning action. Lewin also postulated that the gradient of the strength of the negative valence that repels a person from an object or option (i.e., induces avoidance) increases more rapidly with increasing proximity to the object (whether in psychological or physical space) than does the strength of the approach impulse. That is, the motivation to avoid is more spatially concentrated than the motivation to approach, explaining how we can initially approach a feared object but then stop at a “safe distance” (overturning an initial advantage for the approach impulse into an advantage for the avoidance impulse).
Lewin’s topological conceptualisation facilitated numerous empirical and theoretical explorations of AACs at that time (e.g., Brown, 1948; Bugelski & Miller, 1938; Miller, 1944, 1951a, 1951b; Miller et al., 1943; Sears & Hovland, 1941; Sheehan, 1953). A topological approach suggests that one’s spatial location can be employed to infer relative approach and avoidance motivations. Indeed, this approach is the basis for Behavioural Approach Tasks in which spatial proximity to a potentially aversive stimulus is employed as an index of the aversive function for a participant. For example, Lang and Lazovik (1963, see also Davison, 1968) encouraged participants to get as close as possible to a live snake situated 15 feet away. Such a behavioural task produced an absolute measure of participants’ avoidance behaviour (if they touched or not the snake) as well as a relative measure based on the participants’ remaining distance from the snake. This approach has been extended to computer-generated stimuli (e.g., Chen & Bargh, 1999; Rinck & Becker, 2007), and with a variety of eliciting stimuli (e.g., de la Asuncion et al., 2015; Heuer et al., 2007; Khan & Petróczi, 2015; Maccallum et al., 2015; Radke et al., 2014; Snagowski & Brand, 2015; Wiers et al., 2011; see also Laham et al., 2015 for a systematic review).
Recently, there has been a renewed interest in investigating AACs (e.g., Aupperle et al., 2011; Bublatzky et al., 2017; Meulders et al., 2016; Pittig et al., 2014, 2018; Schlund et al., 2017; Schneider et al., 2015; Schrooten et al., 2014; Sierra-Mercado et al., 2015). In a typical AAC paradigm, participants’ responses tend to change such that they approach a previously avoided aversive consequence if it also provides access to a sufficiently attractive consequence (e.g., Meulders et al., 2016; Pittig et al., 2018; Rattel et al., 2017). Thus, how participants allocate their choices in an AAC paradigm provides an index of their relative approach and avoidance motivations. In addition, when the attractive consequence is close to the minimum required to switch from avoidance to approach, participants exhibit longer response times (RTs), indicative of increased AAC (e.g., Diederich, 2003; Gannon et al., 2011; Luce et al., 1997; Murray, 1975; Schrooten et al., 2014; Wirth et al., 2016). So, when approach and avoidance motivations are similar in strength, conflict is highest and the degree of conflict can be observed in RTs.
Instead of varying the size or strength of a consequence (cf. Rinck & Becker, 2007), an alternative approach is to spatially represent the probability of a consequence, such that locating an avatar nearer to an option increases the probability of that option. Such tasks typically require participants to press keys to move an avatar closer to or away from a choice to indicate their preferred probability (e.g., Aupperle et al., 2011; De Houwer et al., 2001; cf. Dibbets & Fonteyne, 2015). For example, Aupperle et al. (2011) employed a task wherein an avatar is located on a runway between two choices, each of which includes a set of positive and/or negative outcomes (e.g., view a positive stimulus vs. view a negative stimulus and earn two points). As the participant moves the avatar along the runway towards a choice, the probability of that choice increases. In this way, the location of the avatar provides an index of the relative preference of these choices and the strength of the competing approach and avoidance motivations.
In the foregoing paradigms, appetitive and aversive consequences are typically presented at opposite ends of a continuum on which the participant is situated. This orientation influences the expression of the approach and avoidance motivations on motion such that if no motion is possible that does not change the potency or probability of the consequences. Such direct competition suppresses early commitments to a choice that might otherwise be observed. In contrast, Buetti et al. (2012; see also Gallivan & Chapman, 2014; Hovland & Sears, 1938) devised a task in which participants, starting from a point in the middle of the screen, moved their finger to just below one of two visual stimuli (i.e., images of spiders, beetles or dragonflies) located on the sides of the screen. The participant’s hand movements from response initiation to completion were recorded. In this paradigm, movements directly up the screen that do not move left or right effect a compromise between the choices. Interestingly, spider fearful participants and controls did not have different RTs, but spider-fearful participants exhibited greater deviation away from the threat stimuli while responding. Analysing motor response trajectories, therefore, has the potential to complement traditional RT measures by tracking the dynamic resolution of AACs.
Moreover, traditional research approaches to the study of motivation are framed within models of sequential information processing (e.g., Sternberg, 1969), where actions are the result of a series of computing steps. The more complex the information (e.g., when stimuli compete across dimensions), the more processing steps necessary and the longer a person would take to produce a response. In accordance with this tradition, early research on conflicted motivation has shown that the level of conflict experienced is manifested in RTs (e.g., Aupperle et al., 2011; Boyd et al., 2011; de la Asuncion et al., 2015; Dignath & Eder, 2015; Radke et al., 2014; see also Diederich, 2003). However, RT indices are not sufficient to differentiate and detect the various motivational processes at play during conflict (Diederich, 2003; Wirth et al., 2016).
Sampling mouse cursor position frame-by-frame (mouse-tracking) during the course of a response trajectory provides a continuous measure of the dynamic influences on that response (see Freeman et al., 2011; Hehman et al., 2015; Koop & Johnson, 2013; McKinstry et al., 2008; O’Hora et al., 2013, 2016; Scherbaum et al., 2008, 2010; Song & Nakayama, 2008; Spivey, 2008; Spivey & Dale, 2004). Koop and Johnson (2013, experiment 1), for example, mouse-tracked the development of participants’ preferential choice of visual stimuli taken from the International Affective Picture System (IAPS; Lang & Bradley, 2007). Participants rated the visual stimuli for pleasantness and chose between pairs of stimuli at different levels of arousal difference. As expected, a higher arousal difference predicted a higher probability of choosing the more pleasant stimuli. Also, curvature analyses of the response trajectories revealed that they were more deviated towards the alternative non-chosen option when arousal difference was lower (i.e., greater approach-approach conflict). As such, mouse-tracking provides a fitting testbed for the study of AACs, as the trajectories of participants’ responses are subject to competing approach and avoidance influences while the responses are produced.
One class of models that seems particularly suitable for understanding the problem of integrating the competing effects of approach and avoidance motivations during decision-making is informed by dynamical systems theory (DST; e.g., Busemeyer & Townsend, 1989; Kelso, 1995; Killeen, 1992; Marr, 1992; Scherbaum et al., 2008, 2016; Spivey & Dale, 2006; van Rooij et al., 2013). DST models of decision-making consider the actions available to an organism to be attractors in a psychological or decision state space, and a decision is made when the current state in this decision space is at one of these attractors. The movement of the mouse cursor during a response trajectory reflects, to some degree, movement in this decision space (O’Hora et al., 2013; Zgonnikov et al., 2017, 2019). In approach-avoidance decisions, the decision space is updated continuously as the system evaluates the options.
The current experiments tracked mouse cursor movement during approach-avoidance decisions. Specifically, we established simple mouse-cursor responses that allowed participants to earn points (leading to approach), and then, in a subset of trials (threat trials), earning points required the participant to risk (20% chance of) a mild electric shock (leading to avoidance). We manipulated the amount of points available in each trial to vary the motivation to choose a given option (approach valence). In this way, it was possible to estimate the relative value of shock aversiveness in terms of points for each participant; we termed this estimate an individual’s indifference point (see Dshemuchadse et al., 2013 for a similar approach). During threat trials, therefore, approach trajectories implied earning points and a risk of shock, and avoidance trajectories implied losing points and no risk of shock. We hypothesised that threat trials would establish an AAC and, under these conditions, we expected that approach trajectories would be simpler than avoidance trajectories; in mouse-tracking metrics this translates into faster responses, with less deflection and with fewer vacillations. We also hypothesised that approach and avoidance trajectories would be most complex when AAC was highest. That is, when the reward number is close to the indifference point, trajectories should be more complex (slower, more deflected and with more vacillations) for both approach and avoidance responses—other things being equal. Finally, we employed time-continuous multiple regression (TCMR; Scherbaum et al., 2010) to investigate the evolution of experimental influences on approach response trajectories.
Experiment 1
Method
This research was approved by the Research Ethics Committee of the National University of Ireland, Galway (in line with the Helsinki declaration of ethical standards and the Irish Psychological Society).
Sample and participants selection
Seventy undergraduate students were recruited for this experiment through a university-based system for research participation. Students earned class credits and the opportunity to win a gift voucher worth €45. The data of three participants was removed due to problems with the synchronisation of the recording; consequently, 67 participants were retained (mean age = 23 [range 18–45], 42 females). This sample was informed by previous literature and also checked against a priori effect size estimates using G*Power (Faul et al., 2007); for the latter, anticipating mix-effects regression models, a medium effect size of .2 was considered acceptable, with an alpha of .05, power of .8, and 3 predictors, yielding a recommended sample size of 59. We exceeded the minimum sample size, since we had lower than expected attrition (we expected that individuals might opt out of the avoidance paradigm).
Experimental setting and apparatus
Participants sat facing the monitor with their heads fixed 80 cm from it (with the aid of a chin rest). The task was programmed in Python 2.7 using PsychoPy (Peirce, 2007) and PyGaze (Dalmaijer et al., 2014) libraries, and was run on a desktop computer with a 24-in digital monitor (1920 x 1080 resolution, refresh rate 60 Hz). A Logitech® Gaming Mouse G403 was used, with sensitivity (resolution) set at 600 dpi, and the sample rate of the mouse coordinates matched the computer-screen refresh rate.
Mild electric stimulation was delivered using a Lafayette Isolated Square Wave Stimulator (ISWS; model 82415-IS) The stimulation was restricted to a safe maximum output of 100 volt, lasting 50 ms. Disposable electrodes (ECG SKINTACT electrodes FS-50, Vermed EL504 medical sensors), were used to transmit the electric simulation to the participant’s skin. The electrodes were connected to the dorsal surface of the participant’s non-dominant forearm (roughly midway on the brachioradialis). To amplify the averseness of the electric stimulation, we paired it with an auditory stimulation, a loud beep that averaged 77 dB (70‒85 range).
Assessments and measures
During the experimental task, the mouse-cursor position was recorded in each trial from the moment a target stimulus was presented to a click response on one of the response areas. No response deadline was programmed, but responses longer than 2 s were excluded (see Data Processing). Eye-tracking data were also recorded but are not discussed here. Afterwards, participants completed the Behavioral Inhibition System/Behavioral Approach System (BIS/BAS; Carver & White, 1994) scale, the Brief Experiential Avoidance Questionnaire (BEAQ; Gámez et al., 2014), and the Fear of Pain Questionnaire III (FPQ-III; McNeil & Rainwater, 1998). They also provided basic demographical information and answered some task-related questions (see Supplementary Material).
Procedure and computer task
Before the experiment, the experimenter delivered a sample electric stimulation to the participants, starting with the lowest intensity. The experimenter gradually increased the level of stimulation until the participant either expressed unwillingness to experience a higher level of stimulation or rated it as “strong” on a self-report visual scale. Then, the participants read the task instructions and familiarised themselves with the task by responding to two practice blocks (maximum of 4 trials each). After that, the experimenter calibrated the eye-tracker and the experimental task began.
The experimental task was designed to establish AACs during decision-making. Participants were required to make points-based decisions in the presence or absence of a potential threat (Figure 1). The colour of the target stimulus on each trial informed the participant of the presence (red digit) or absence (green digit) of threat. The value of the target stimulus denoted the number of points that would be gained (“Take”) or lost (“Lose”) by clicking the corresponding response areas (labelled “T” or “L,” respectively) in the top left and right corners of the screen. In the absence of threat (80% of trials), participants were expected to approach the T response area and avoid the L response area. In the presence of threat, choosing T implied risking a potential shock, presenting a conflict between approaching the points and avoiding the potential shock.
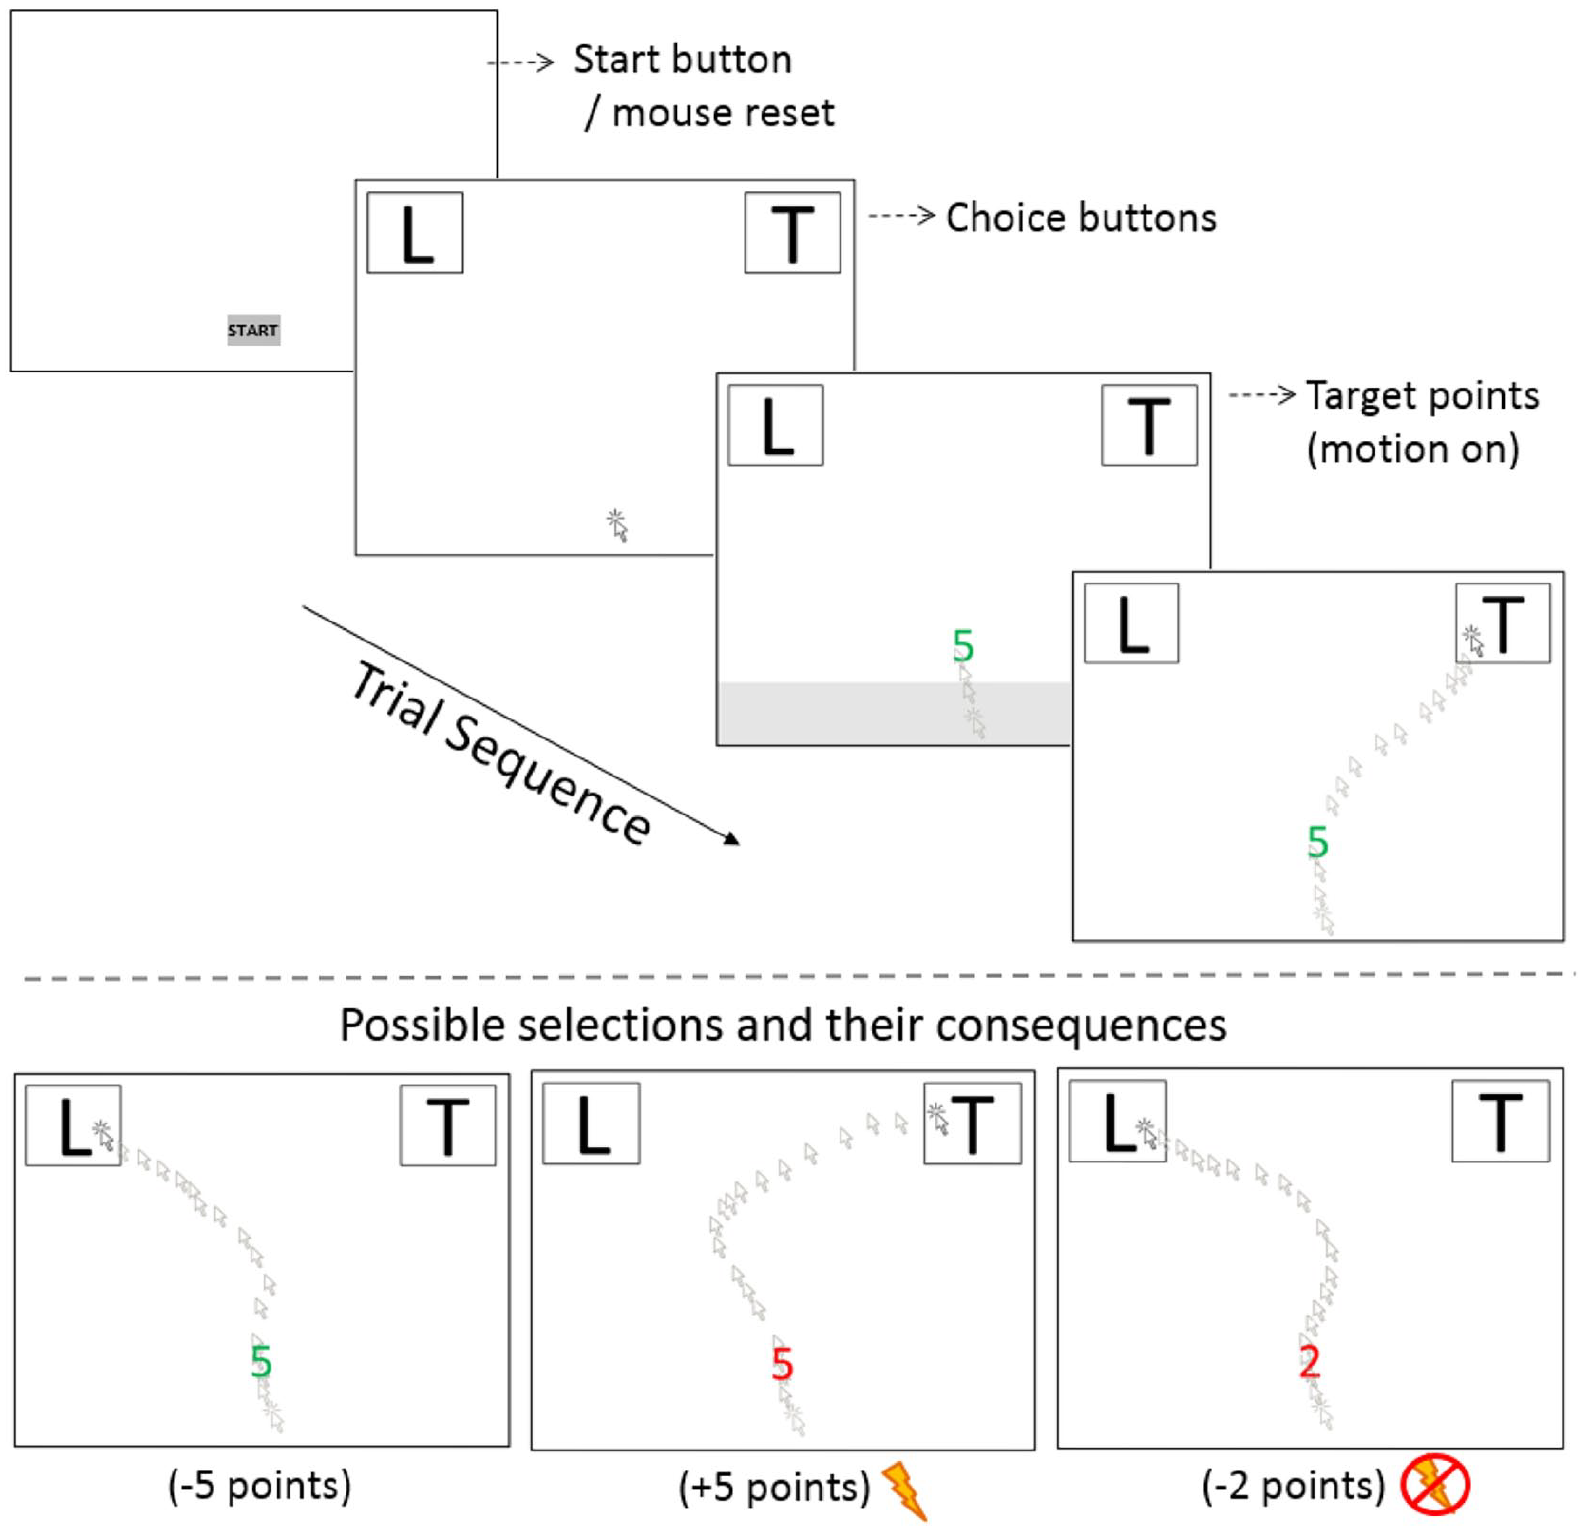
Schematic representation of a trial. Top: sequence of events from clicking on the “start button” which displays the “L” and “T” response areas, moving the mouse upwards to make the target reward number appear and making a selection-click. Below the dashed line: Possible consequences depending on whether the participant chose T or L when the target number was green (leftmost frame) or red (middle and rightmost frame). Namely, T selections always awarded the target points but, if these were red, it was accompanied by threat (shock and tone on 20% of the times). Alternatively, L selections always meant losing the target points but were “threat free.” The final screen of a trial (not shown here) provided feedback on earnings/loses, and delivered the aversive stimulation if applicable. The inter-trial break consisted of a black screen for 100 ms.
At the beginning of each trial block, participants were informed about the points they needed to accumulate to complete it (i.e., 225). Each trial started with participants clicking on the “start” button (Figure 1). Clicking this button resulted in its disappearance and the display of the T/L response areas at the upper corners of the screen (the location of T/L was randomised for the first trial and thereafter counterbalanced across trial-blocks). Participants had to move the mouse upwards (90 px) to make the target number appear. This requirement encouraged response movement prior to seeing the crucial stimulus, meaning that evaluation of the target occurred during movement (see Scherbaum & Kieslich, 2018). The target number represented the reward value that participants chose to “Take” or “Lose.” If a participant chose “Take,” the target number was added to the participant’s tally and if s/he chose “Lose,” the target number was deducted from their tally. Each selection was followed by feedback showing the points earned or lost and the updated tally. Clicking again removed this feedback screen and the next trial started. On 20% of trials, the target number appeared in red colour (instead of green), indicating the presence of threat (i.e., 20% probability of receiving a mild electric shock, accompanied by a startling tone) should the participant choose “Take.” If participants chose “Take” on all 90 threat trials (20% of 450), they would have experienced approximately 18 mild electric pulses (20% of 90). These values were used to effect a compromise between having enough shocks presented to induce avoidance and having as few shocks as possible to protect participants and inhibit habituation.
Participants were exposed to 10 blocks, each of which included a minimum of 45 trials. Each of the target numbers (1 to 9) was presented five times, once in a threat trial, establishing a 4:1 ratio of non-threat to threat trials. The 45 possible trials were presented in a quasi-random sequence, constrained such that the same digit could not occur more than twice in a row. If participants chose “Take” on every trial in a block, they earned 225 points and moved to the next block. If participants chose “Lose” in any trial, they completed additional trials to achieve 225 points before moving on. To create the additional trials, participants were exposed to a further 45-trial block of the same structure, but this block was terminated as soon as the participant achieved 225 points.
To summarise, if a participant found the threat stimulation aversive, she or he could always choose to avoid it by selecting the alternative response option “Lose,” but losing incurred a points-based time cost. To satisfy the points criterion, the participant completed extra trials to make up for the loss of points. Thus, the participant chose to take the points (and the risk of shock) or lose the points depending on whether points offered in a particular threat trial were “worth the risk.”
After completing the computer task, participants were debriefed about the rationale of the task and asked to complete the questionnaires (see Assessments and Measures).
Data processing
Most data analyses were carried out in R (R Development Core Team, 2017), using the “mousetrap” package (Kieslich & Henninger, 2017; Kieslich et al., 2019) for response trajectories, “lme4” (Bates et al., 2015) for mixed-effects regression models, and “ggplot2” (Wickham, 2016) for plots. Within-trial experimental influences were analysed using the TCMR toolbox (Scherbaum, 2018) for Matlab (2010).
We estimated the value of the shock in terms of earned points by calculating the number of points at which a participant was 50% likely to choose “Take” and 50% likely to choose “Lose.” To isolate this approach-avoidance indifference point (IP) for each individual, we fitted a logistic regression in which reward values predicted choosing “Take.” Individuals for which this indifference point estimate exceeded the 0–10 range were coerced to these limits (23 cases). These were individuals who chose to approach or avoid almost exclusively (i.e., more than 95% of the time) but for whom a few exceptional responses resulted in inaccurate estimates.
We extracted a value we termed target valence to index each participant’s evaluation of a target number. Participants varied in their relative evaluation of points and shock, so, by subtracting the target point value from each participant’s IP, we were able to develop an index of “distance” from subjective equality. If the target number on a trial was 7, and the participant’s indifference point was 3, then the target valence was +4 in that trial; the target number exceeded subjective equality by 4. If a different participant, with an IP of 8 was presented with a target number of 7, then the target valence would be −1 for that participant. This enabled us to test our conflict dynamics hypotheses; the first participant would probably approach (Take 7) and do so quickly (large target valence, far from equality), whereas the second participant would probably avoid (Lose 7) and might do so more slowly (smaller target valence, closer to equality).
To eliminate responses characterised by pauses, we excluded response trajectories longer than three seconds (approximately 1% of the data). All response trajectories were shifted so that they all started at the mean first position across all trials. The durations of the trajectories were normalised to 101 equally sized time steps through linear interpolation from first to last mouse-coordinates’ samples (Spivey et al., 2005). Approximately 2% of all response trajectories were excluded during mouse data cleaning (e.g., erratic movements tracing uninterpretable loops). The remaining dataset consisted of a total of 32,213 response trials.
AAC during the decisions was investigated via the following measures: first, the duration of the response was measured from the presentation of the target number to the selection of a response option (RT). Second, attraction towards the available choices was characterised by the maximum absolute deviation (MAD); the perpendicular deviation of the response trajectory from a hypothetical straight line connecting response start and endpoints. MAD is considered a measure of the strength of the competition between choices (Koop & Johnson, 2011; Spivey et al., 2005). Third, given the fact that response options are located on one side of the screen or the other, the number of reversals in response direction along the x-axis (x-flips) is considered an indicator of vacillation (e.g., Freeman, 2014; O’Hora et al., 2016; Spivey et al., 2005); potentially, a reflection of the concurrent dynamic attraction towards the alternative response option (e.g., Spivey, 2008; Spivey et al., 2005). Fourth, sample entropy analyses are considered a measure of how irregular and unpredictable trajectories are (Dale et al., 2007; Richman & Moorman, 2000; see also Calcagnì et al., 2017; Hehman et al., 2015); hence, it is a measure of response complexity. Fundamentally, sample entropy’s underlying algorithm loops over a specified sample of data points and estimates how much each datum differs from one another in the time series. The greater the entropy values the more variability detected, hence, the higher the complexity present in the trajectories. As per Dale et al. (2007), the tolerance for sample entropy calculations was .2 and a—stringent—sample of m = 3 (see Dale et al., 2007; and Richman & Moorman, 2000 for details). Overall, the four mouse-tracing metrics (RT, MAD, x-flips, sample entropy) provided us with the means to quantify response conflict.
For statistical analyses, we used generalised and linear mixed-effects regression models (see Baayen et al., 2008; Brauer & Curtin, 2017; Yang et al., 2014). RTs and trial number variables were subject to logarithmic transformations for these analyses. First, the target value variable was used to predict approach. For the rest of the variables, to include both approach and avoidance trials in our analyses, we used the target valence value and allowed it to vary across participants (specified as random slope and intercept effects in the models predicting the mouse-tracking metrics; see Supplementary Material). Moreover, using the absolute target valence eased the comparison of the effects of this variable over approach/avoidance responses, so increases in target valence lead to greater approach or avoidance respectively; consequently, no significant interactions are expected between these variables. The number of trials was included as a predictor in all models to control for learning effects. The models included random intercepts for absolute target valence and participant and random slopes for target valence within participant.
Finally, we applied the TCMR method (Scherbaum et al., 2010) to investigate the moment at which the different properties of the task influenced relative approach-avoidance inclinations towards the final decision. This method computes regression analyses per each time step of a trial, yielding time-sensitive beta-weights on response direction tendency (i.e., difference in response angle relative to the y-axis between two time-steps, across all normalised steps) as they change within a trial. Thus, it captures response changes as a function of the characteristics of a trial enabling us to examine and draw inferences about the underlying psychological processes at play with more precision (see Scherbaum et al., 2015).
In the remainder of the article, we will refer to the variables of interest as follows: approach: choosing to “Take” the reward option when there was a probability of receiving the aversive consequence (i.e., shock); avoidance: choosing to “Lose” the reward during threat trials; threat: trials where the target number appeared in red and entailed shock probability; safe trials: with no threat (target numbers in green).
Results
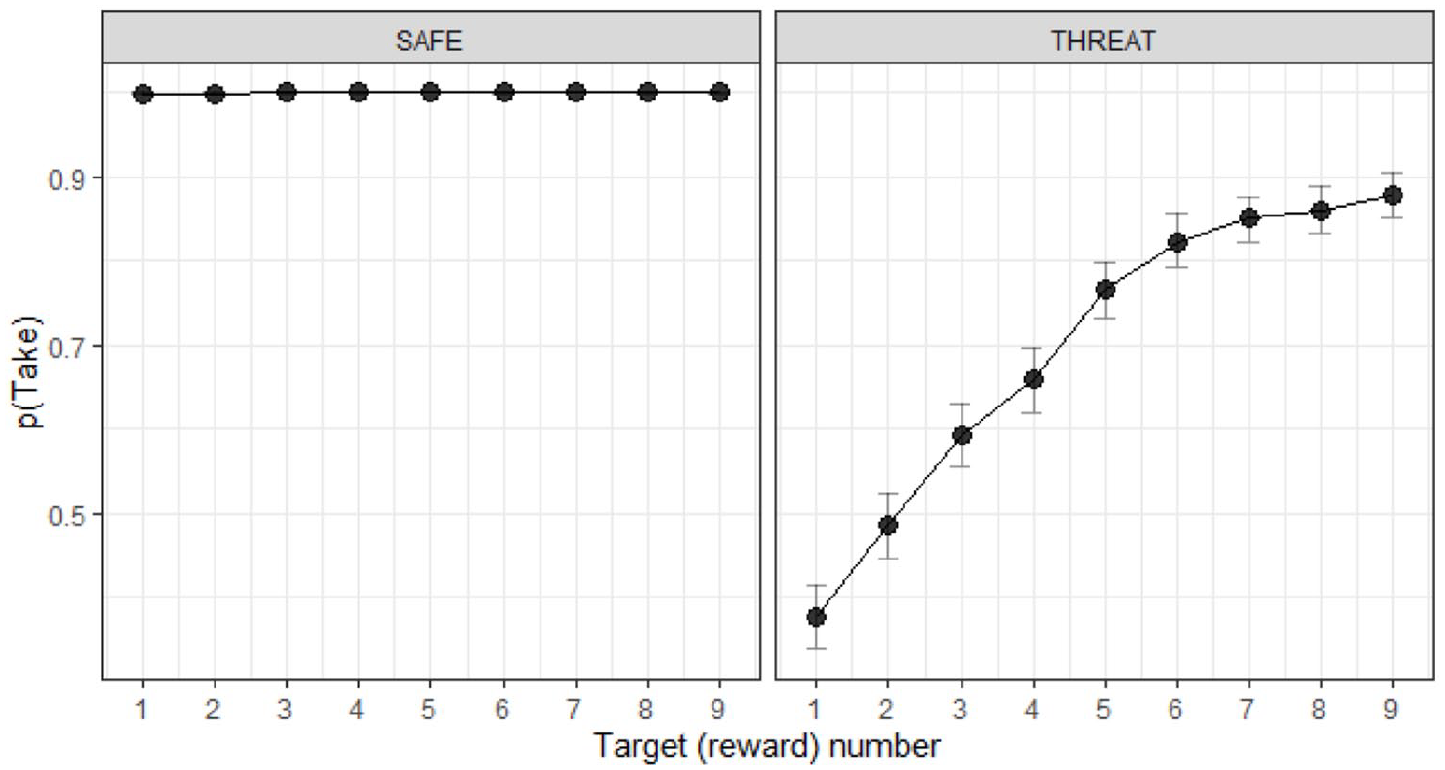
The current study examined the action dynamics of approaching an aversive consequence (i.e., a one in five chances of experiencing the shock-tone pair) or avoiding it. Participants were exposed to an average of 531 (range 448–753) trials, of which approximately 20% were threat trials. As expected, in the absence of threat, participants chose the “Take” response consistently regardless of the target value. During threat, approaching was dependent on the target value (see Figure 2).
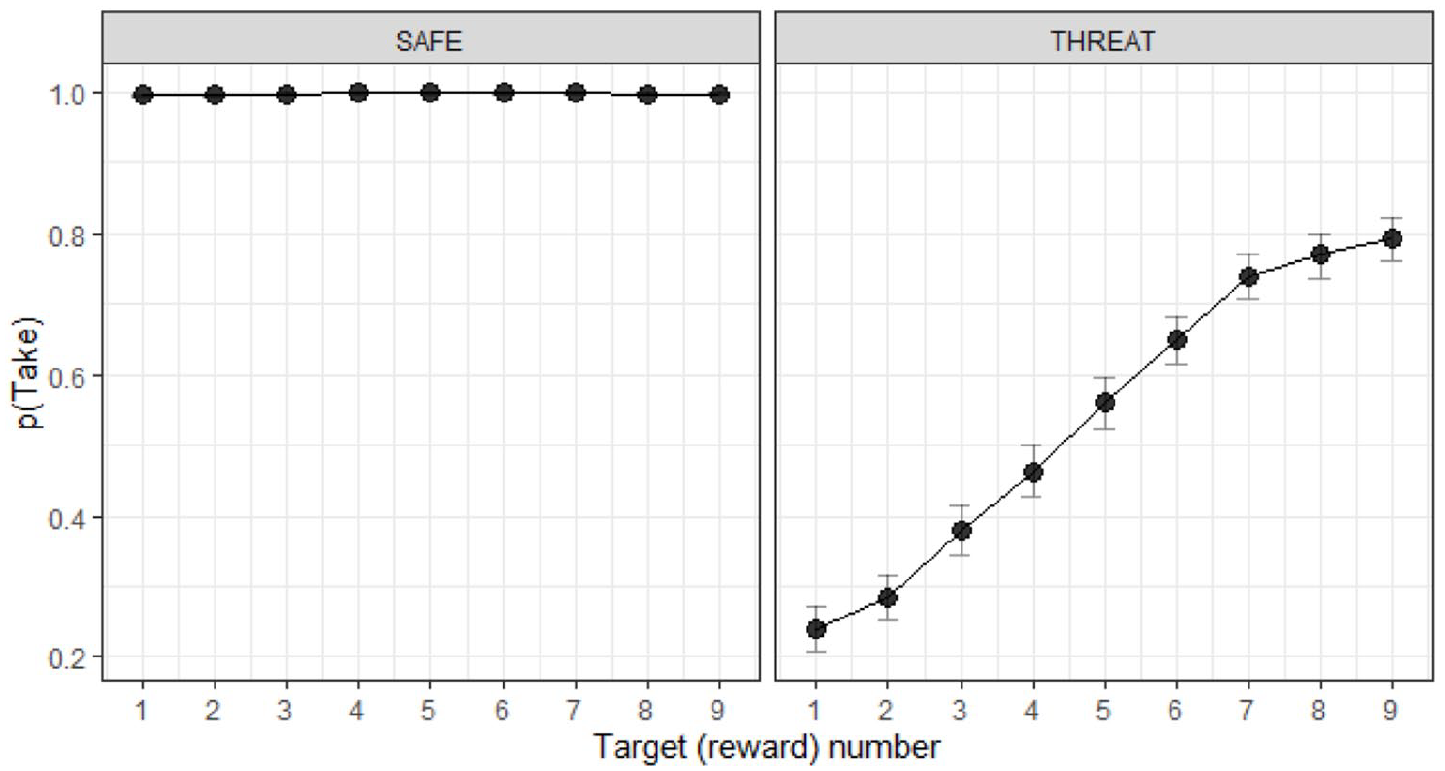
Probability of choosing the “Take” option as a function of the target reward value (abscissa), for all participants. The left panel shows mean data (95% confident intervals) for each target value when participants responded to non-threat trials (“safe”); the right panel (“threat”) shows responses to trials with shock probability.
This was further corroborated by a binomial mixed-effects model estimating the effects of target value on approach (b = 1.019, SE = 0.098, z = 10.35, p < .001, odds ratio [OR] = 2.77, 95% confidence interval [CI]: [2.28, 3.36]). Next, we estimated each participant’s willingness to pay points to avoid a chance of shock. Logistic regressions were employed to calculate each participant’s indifference point; that is, the point value at which participants were 50% likely to choose the “Take” or “Lose” options (see Data processing). Participants were also asked whether during the task they developed a threshold value of points that was the minimum they would accept to choose “Take” during threat. Thirty-two participants out of 67 reported such a value: Pearson’s correlation coefficient between participant’s self-reported “approach threshold” and their indifference point was r = .70, p < .001, 95% CI: (0.69, 0.70), suggesting that these participants had awareness of their own performance. Neither the FPQ (r = –.05, p = .67) nor the BEAQ (r = .1, p = .43) nor the BIS/BAS scales (BIS r = .05, p = .68; BAS drive r = –.1, p = .41; BAS fun r = .02, p = .89; BAS reward r = .02, p = .84) predicted the indifference point (cf. May et al., 2016).
We expected two primary sources of variation in the dynamics of responding during threat trials. First, approach trajectories should be simpler than avoidance trajectories. The approach was much more common, so these responses benefitted from the development of default motor movements and default decisions (especially since “Take” was presented consistently on one side within blocks and threat was present only 20% of the time). Second, target numbers at a greater psychological distance from the participant’s indifference point (higher target valence) should give rise to simpler trajectories than target numbers closer to the participant’s indifference point (i.e., threshold for switching from approach to avoidance). That is, if the target was closer to the participant’s indifference point (lower target valence) the attraction towards approach and avoidance should be more equal, creating greater AAC.
Figure 3 provides heatmaps of the raw trajectory coordinates for approach and avoidance responses for targets at varying levels of target valence; average interpolated trajectories are also presented. This visualisation technique reveals the behaviour involved in the continuous evaluation of the options as participants respond during trials. The effect of the default approach response can be seen in the differences between the top row of trajectories and the bottom row. Approach responses moved towards the “Take” option during the whole trial and did not typically change direction towards the “Lose” option. In contrast, avoidance responses initially move towards the “Take” option before switching towards the “Lose” option. The effects of target valence were also as hypothesised. At the extreme right of the figure, target valence is highest and conflict between approach and avoidance motivations is weakest; approach trajectories were quite straight and avoidance trajectories switched earlier and lower on the screen than at lower levels of psychological distance. At the extreme left of the figure, target valence is lowest and the greatest conflict can be observed in both types of responses; approach trajectories were more deflected towards “Lose” and avoidance trajectories switched later and closer to the “Take” option.
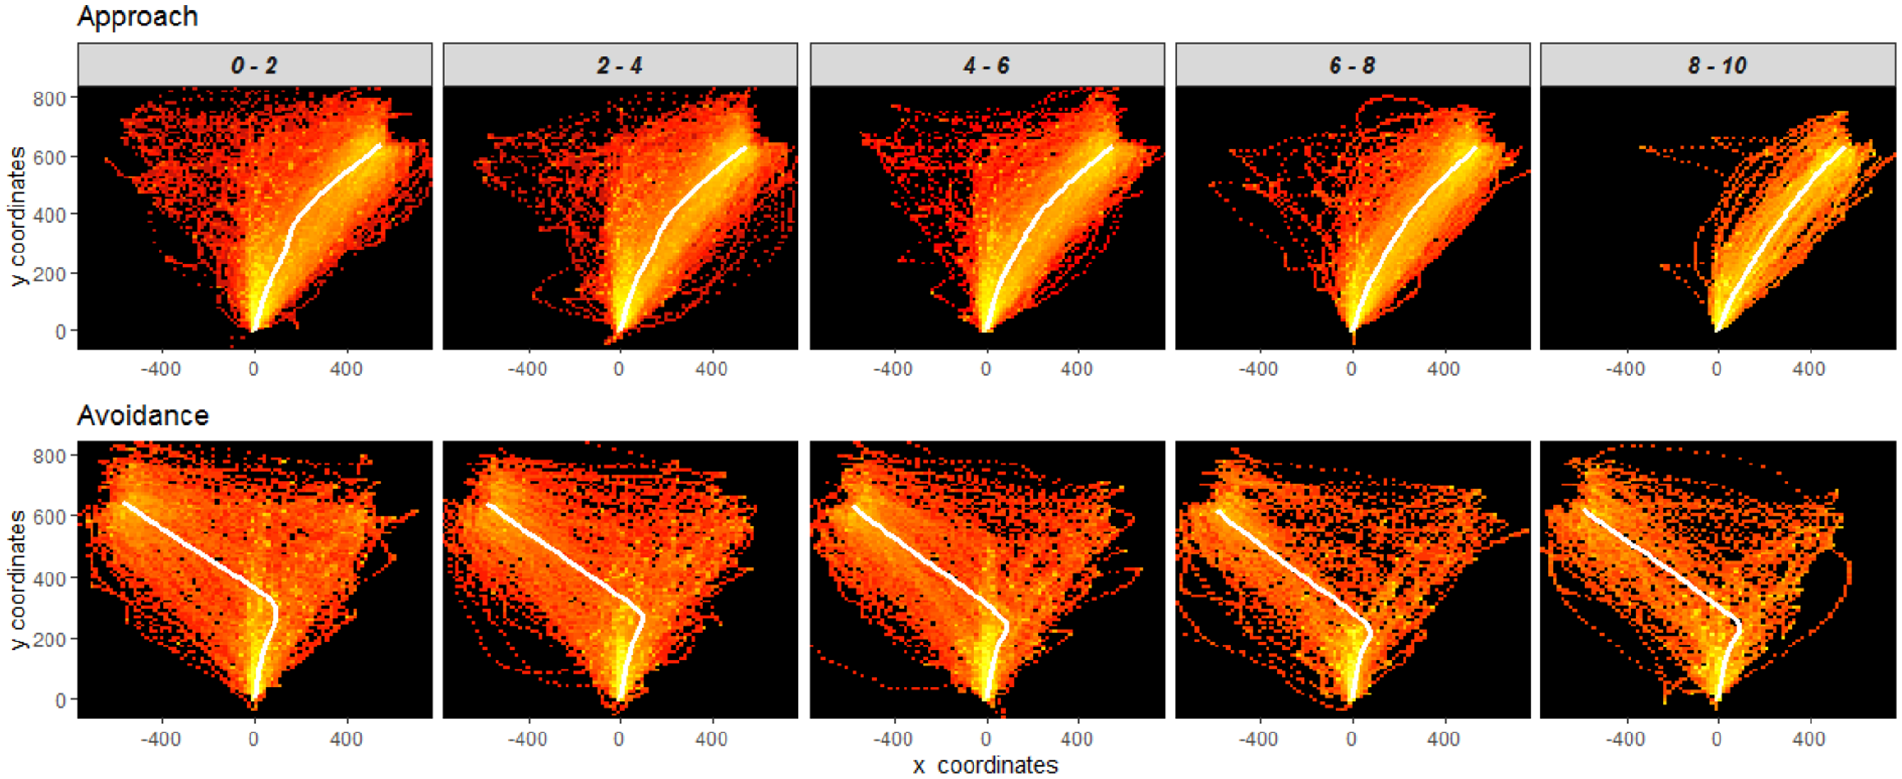
Heatmaps (i.e., density plots going from red to yellow) of raw trajectories per index of conflict. The targets have been binned down to five target sets, where proximity to zero indicates a greater level of psychological conflict (proximity to indifference point). The superimposed white line on each graph is the respective mean trajectory. The “dotted” appearance of the raw trajectories corresponds to their 101 interpolated time steps (see Data processing). Irrespective of the actual location of the response options during the task, approach and avoidance trajectories have been mapped to different sides of the screen (in accordance to Figure 1) for visualisation and comparison purposes.
During threat trials, increased AAC was expected to affect response trajectories such that they would increase in duration (RT), deflection from the final choice (MAD), vacillation (x-flips) and complexity (x-sample entropy). Figure 4 shows the effects of approach-avoidance and absolute target valence on these indices. In Figure 4a, it can be seen that RT increased with target valence for negative valences (during avoidance); and decreased with target valence for positive valences (approach). This pattern is also observed for MAD (Figure 4b), x-flips (Figure 4c), and sample entropy (Figure 4d).
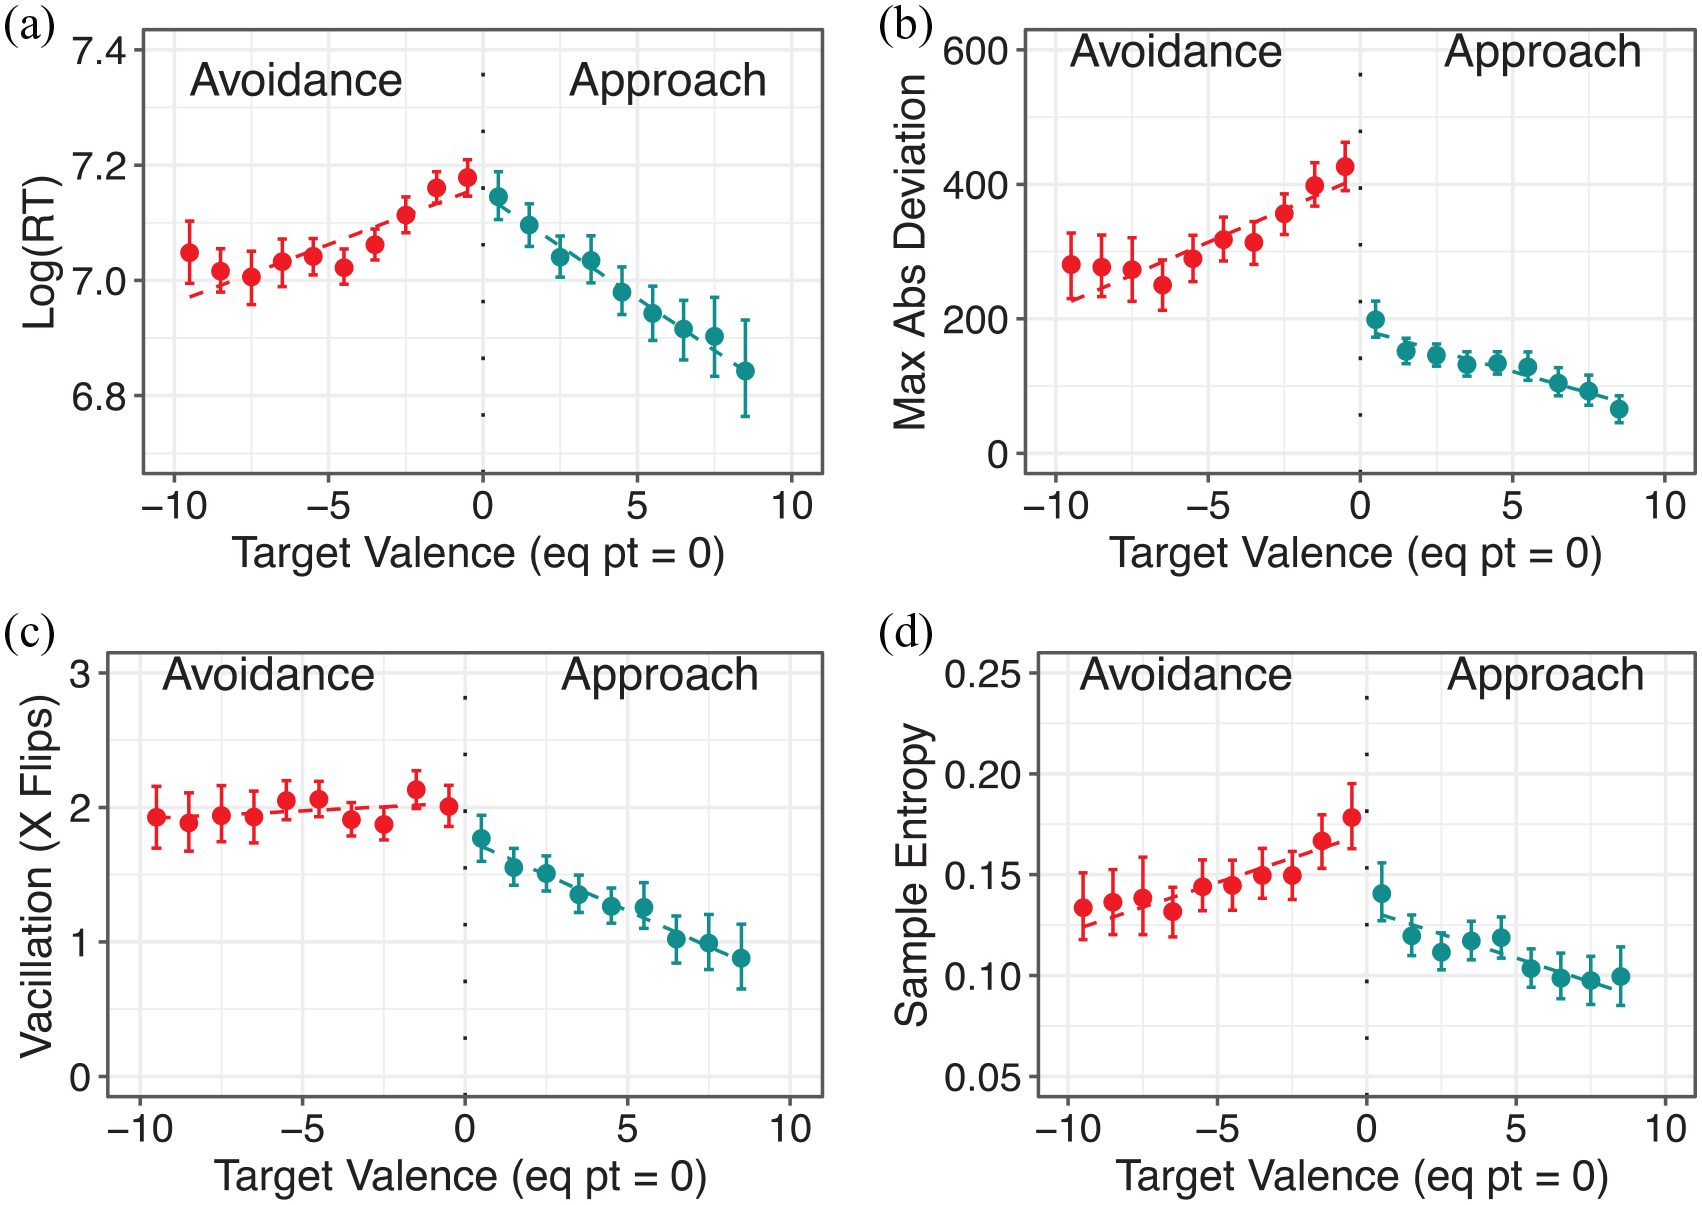
Data as a function of psychological conflict (i.e., proximity to the indifference point centered at zero) during both avoidance and approach for each of the measures of interest: (a) response time (logarithmically transformed, reported in ms), (b) maximum absolute deviation (px), (c) number of x-axis reversals, and (d) x-sample-entropy. Each data point consists of the mean (95% confidence intervals). The abscissa represents the target valence values, normalised across participants based on the distance from their indifference points; thus, proximity to zero indicates greater psychological conflict. Avoidance (in red) has been re-coded so it consists of negative values to the left of the plot (below zero), and approach (in blue) to the right.
This graphical evaluation of the response trajectories as a function of conflict was corroborated via regression models. Mixed-effects models estimated the effects of absolute target valence and approach-avoidance on each of the aforementioned measures of conflict (see Table 1). Except for RT, there was a significant main negative effect of approach, suggesting that approach was characterised by less deflection, vacillation, and complexity than avoidance. Across all measures, there was a significant main effect of absolute target valence, corroborating that as absolute target valence increased from the point of subjective indifference, decisions became easier and conflict was reduced. Unexpectedly, when predicting RT the main effect of approach was positive (longer reaction times for approach) and the effect of absolute target valence was moderated by approach-avoidance. Specifically, absolute target valence was a stronger predictor of reduced conflict during approach than during avoidance (see Figure 4a). This was not a very strong effect, but it was likely due to the relative simplicity of approach trajectories (they mostly moved in the same direction) compared to avoidance trajectories. Additional robustness checks (see Supplementary Information) were conducted, due to a high proportion (40%) of consistent responders, who either avoided or approached on all threat trials. The models described above were also run, excluding consistent responders and another set of models controlled for interactions with the participant’s indifference point. Of the significant effects noted here, the positive effect of approach and the moderation by response type (approach or avoid) of the target valence effect on log RT, and the target valence effect on x-flips were not replicated in these additional analyses.
Statistical analyses on predictors for conflict variables (Experiment 1).
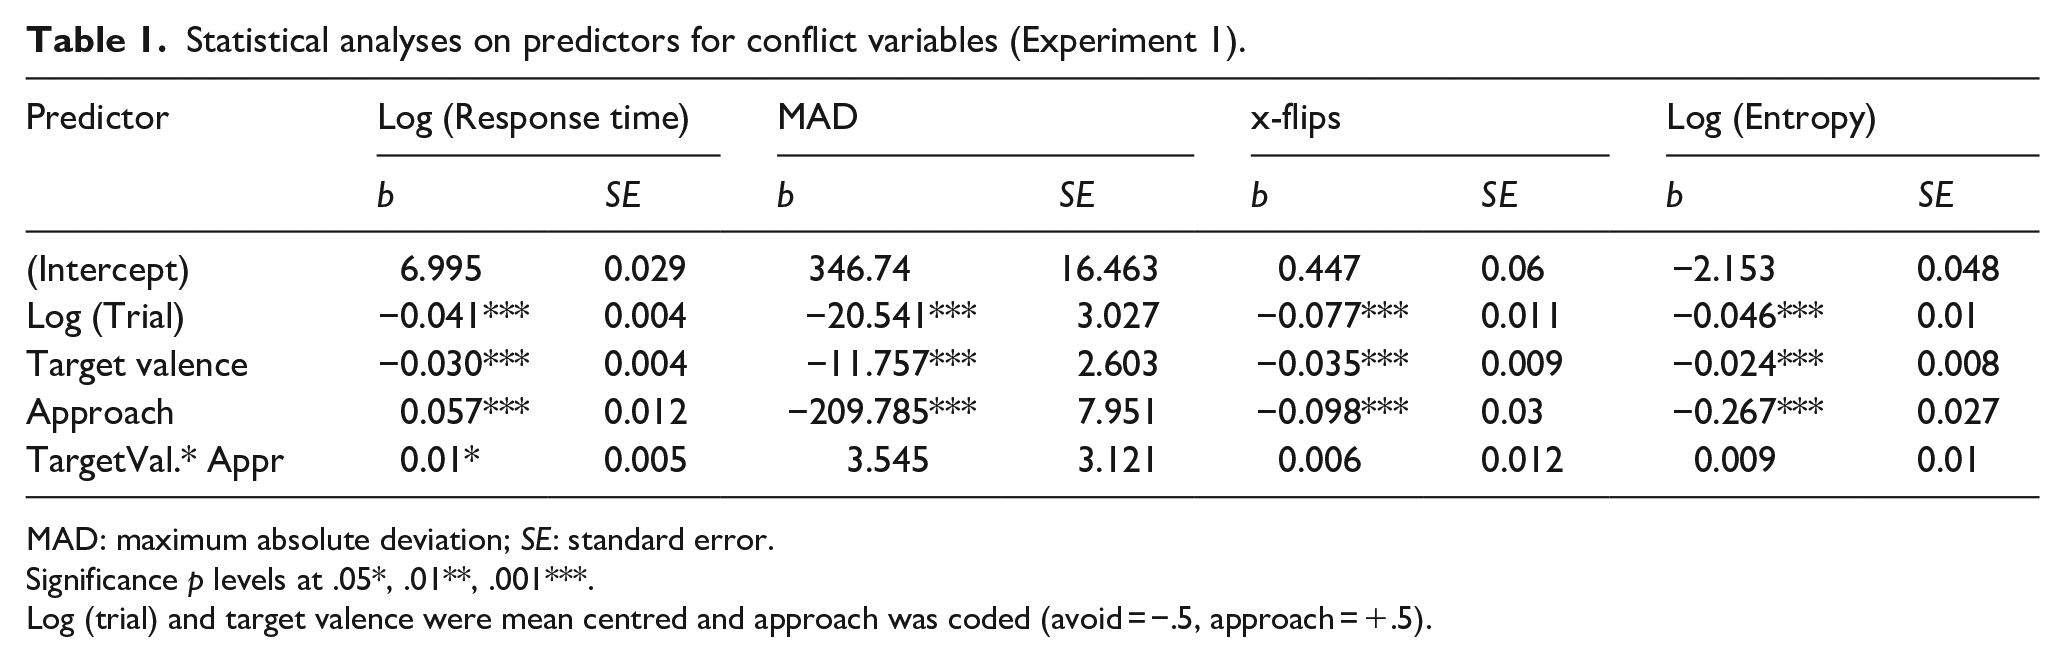
MAD: maximum absolute deviation; SE: standard error.
Significance p levels at .05*, .01**, .001***.
Log (trial) and target valence were mean centred and approach was coded (avoid = −.5, approach = +.5).
To investigate the degree to which features of the experimental context exerted control over the direction of response trajectories within each response, TCMR was employed (Scherbaum et al., 2010). Unlike the previous analyses, for TCMR, both threat (20%) and safe (80%) trials were included but we considered “Take” responses only as they were considerably more numerous than “Lose.” We assessed the effects of the response in the previous trial, whether the current trial implied threat or not, whether the participant had been shocked in the previous trial or not, and the target stimulus. For each time step, TCMR assessed whether these factors influenced the direction of the trajectory at that step. The TCMR indicated that these factors exerted influence at different times during the trajectory (see Figure 5). The effect of the previous response peaked twice, once at the beginning of the trajectory and once at step 41. The effect of previous shock peaked at step 25 and the effect of current threat peaked at step 50 (see Table 2). The effect of current threat was considerably larger than the other factors. Target value had a weak effect on the trajectory, which was limited to the middle of the trajectory. In summary, the properties of the previous trial affected trajectory direction early in the trajectory, while the properties of the current trial affected the middle and later parts of the trajectory.
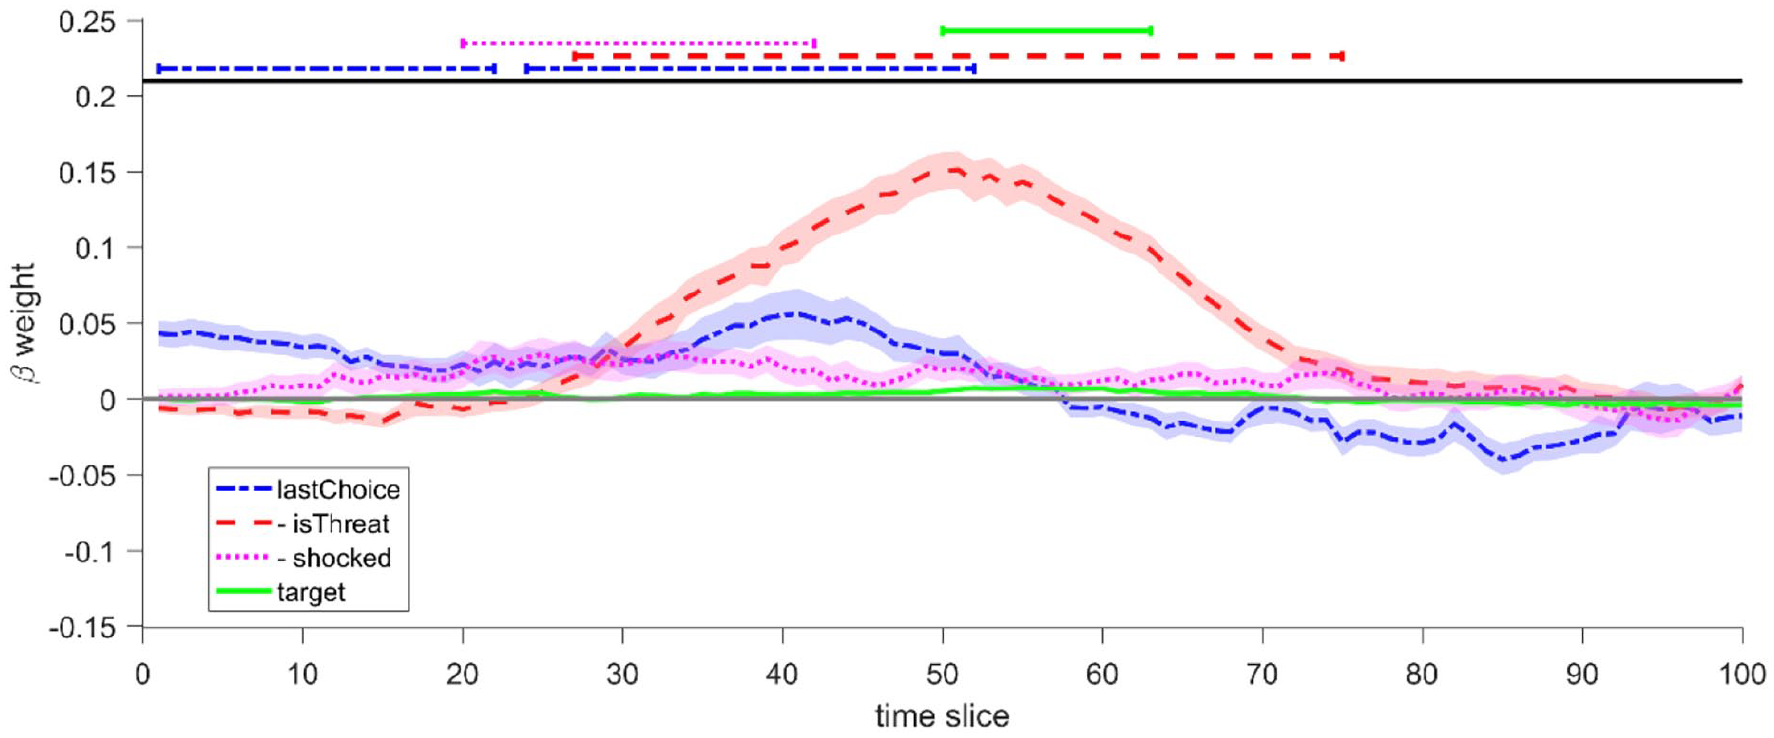
Influence of experimental variables on trajectory angle during response movement. The line at zero represents the intercept, where positive values above the line indicate an angle towards the final “T” choice. Shaded bands around each predictor indicate their respective standard errors. The horizontal lines on the top highlight the regions of significance for the corresponding regressors (i.e., time step during which a regressor influenced response direction) when approaching (family-wise estimated error with p < .05 for 10 consecutive t-tests). In each step the angle towards the “Take” response was predicted by the following variables: (a) lastChoice: response choice in the previous trial; (b) lastMove: response movement of the previous trial; (c) isThreat: whether the approach choice entailed threat probability; (d) shocked: whether participants received a mild electric pulse in the previous trial; (e) target: the amount of the points available as a reward. The variables isThreat and shocked are negatively coded indicating movement in the opposite direction (the deflection from isThreat is away from the “T” option).
Descriptive values for each variable in the TCMR (Experiment 1).
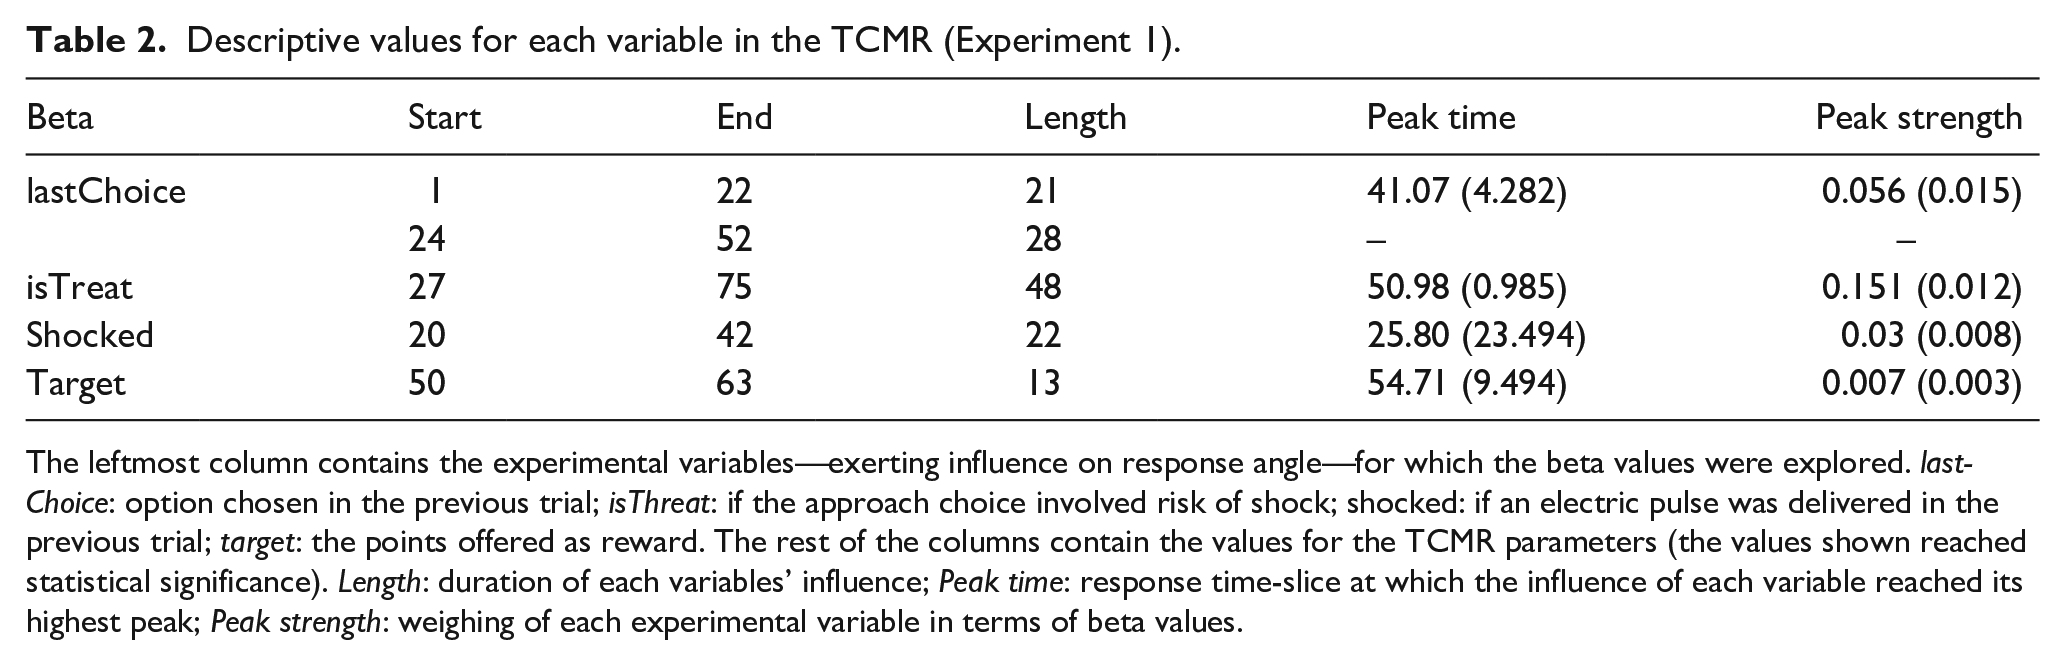
The leftmost column contains the experimental variables—exerting influence on response angle—for which the beta values were explored. lastChoice: option chosen in the previous trial; isThreat: if the approach choice involved risk of shock; shocked: if an electric pulse was delivered in the previous trial; target: the points offered as reward. The rest of the columns contain the values for the TCMR parameters (the values shown reached statistical significance). Length: duration of each variables’ influence; Peak time: response time-slice at which the influence of each variable reached its highest peak; Peak strength: weighing of each experimental variable in terms of beta values.
Discussion
The findings of Experiment 1 support the main experimental hypotheses concerning approach and avoidance responses under threat conditions, and a strong default expectation of approach. First, approach trajectories were simpler than avoidance trajectories; they were faster, less deflected and less complex than avoidance trajectories. Second, when presented with stimuli that generated very high or very low approach motivations (i.e., target valence), AAC was reduced and trajectories were simpler. When presented with target numbers farther from the participants’ indifference point, participants avoided low numbers more quickly with less deflection and less complexity (“definitely not worth it”), and approached high numbers more quickly with less deflection and less complexity (“definitely worth it”).
Furthermore, the TCMR method allowed us to track the time course of the influence by the experimental variables within a response trajectory. In addition, the relative duration and strength of the influences were estimated. The waxing and waning of these experimental influences suggest a time course of potential psychological processes engaged by the task. The choice in the previous trial influenced early movement, followed by shock recency, the presence of threat and reward values which affected the middle phase of the decision. Of these, the effect of current threat was by far the strongest influence on trajectories demonstrating its expected effect of AAC.
Response angle TCMRs suggested that persistent activation due to the choice from the preceding trial influenced the beginning of new trajectories, and possibly constituted a bias early in the decision process. This “carry over” effect from the previous choice has been demonstrated previously in simple decision-making paradigms (e.g., Bissett & Logan, 2012). Two features of Experiment 1 might have contributed to such an effect: (a) the locations of “Take” and “Lose” were consistent within blocks of trials (i.e., always on the left or right), generating a motor default (i.e., moving in the same direction as the last trial); and (b) safe trials (in which approaching “Take” was almost always observed) were four times as common than threat trials leading to a default expectation of choosing “Take.” It was not possible to isolate the effects of these defaults in Experiment 1, but these were explored in Experiment 2.
Experiment 2
A second experiment was carried out to partially replicate the findings from Experiment 1 and investigate the effect of two methodological adjustments. The same method as in the previous experiment was implemented, with the exception of two specific changes: (a) the positions of the choice options was randomised across trials (constrained to no more than three consecutive repetitions of the response area’s location) and (b) the tone accompanying the delivery of shock was removed.
The former modification was considered given the potential to dissociate response movement with choice location. Regarding the removal of the tone, such a modification allows us to compare whether presenting the shocks without the tone might render such a stimulation less aversive. Some studies with human participants have found shocks to yield stronger conditioning effects when compared to sounds (Glenn et al., 2012), and research with non-human animals suggests that a combined shock-tone stimulus may act as a stronger aversive than a single modality stimuli (Phillips & LeDoux, 1992). In light of this, it is reasonable to assume that by presenting the shock as threat stimulus on its own will yield a weaker effect than that observed in the first experiment (i.e., a weaker conflict).
Participants
Sixty-eight new volunteers were recruited following the protocol of Experiment 1. Data from three participants were removed as they were corrupted due to synchronisation issues. The remaining sample consisted of 65 participants (mean age = 20 [18–52], 51 females).
Data processing
All data filtering followed the same process as in Experiment 1. The indifference point estimate for individuals exceeding the range limits and requiring estimate adjustment (31 cases) was treated as previously. Exclusion of responses longer than 3 s amounted to approximately 2% of the response trajectories, and an additional 2% of all response trajectories were excluded during quality checks and filtering of the mouse data. The remaining dataset consisted of a total of 32,225 response trials.
Results
The same data analyses were carried out as in Experiment 1. Participants completed an average of 495 (450–731) trials. As in the first experiment, the participants always chose “T” during safe trials, whereas for threat trials the probability of choosing “T” depended on the value of the target stimuli, characterised by an increasing trend (see Figure 6). Mixed-effects models, once more, corroborated the positive effect of target value on approach (b = 1.106, SE = 0.125, z = 8.78, p < .001, OR = 3.02, 95% CI: [2.36, 3.86]). Participants’ verbal estimation of their behaviour (n = 42) and the relation with their actual performance is reflected in the correlation between the self-reported approach threshold and calculated indifference point (r = .55, 95% CI: [0.54, 0.56], p < .001). The FPQ scale yielded a significant weak correlation with participants’ indifference point (r = .26, p = .03). The BEAQ scale did not correlate significantly with participant’s indifference point (r = .25, p = .05). Likewise, none of the BIS-BAS scales predicted the indifference point (BIS r = –.03, p = .80; BAS drive r = .15, p = .23; BAS fun r = .05, p = .70; BAS reward r = –.06, p = .66).
Probability of choosing the “Take” option as a function of the target reward value (abscissa), for all participants (Experiment 2).
Raw trajectory heatmaps of approach and avoidance trajectories as a function of target valence (Figure 7) allows a direct appraisal of the impact of the randomisation of response area location. Specifically, the effect of the motor default was weaker, compared to that which was observed in the first experiment. On some trials, approach responses exhibited a temporary attraction towards the “Lose” option during the trial, and these trials were more common when the greatest decision conflict was induced (i.e., when psychological distance to indifference point was the lowest). Avoidance responses were similar to those in the first experiment, showing an initial movement towards the “Take” option and redirecting towards the “Lose” option. Overall, similar to Experiment 1, approach trajectories were simpler than avoidance trajectories. However, the effects of target valence on response trajectories are less clear in Experiment 2. For approach trajectories, we found no evidence of an effect of target valence and, for avoidance trajectories, the effect is the reverse of that expected. That is, higher target valence gave rise to more deflected trajectories rather than less deflected trajectories. It should be noted, however, that there were considerably fewer avoidance trajectories in this experiment than in Experiment 1.
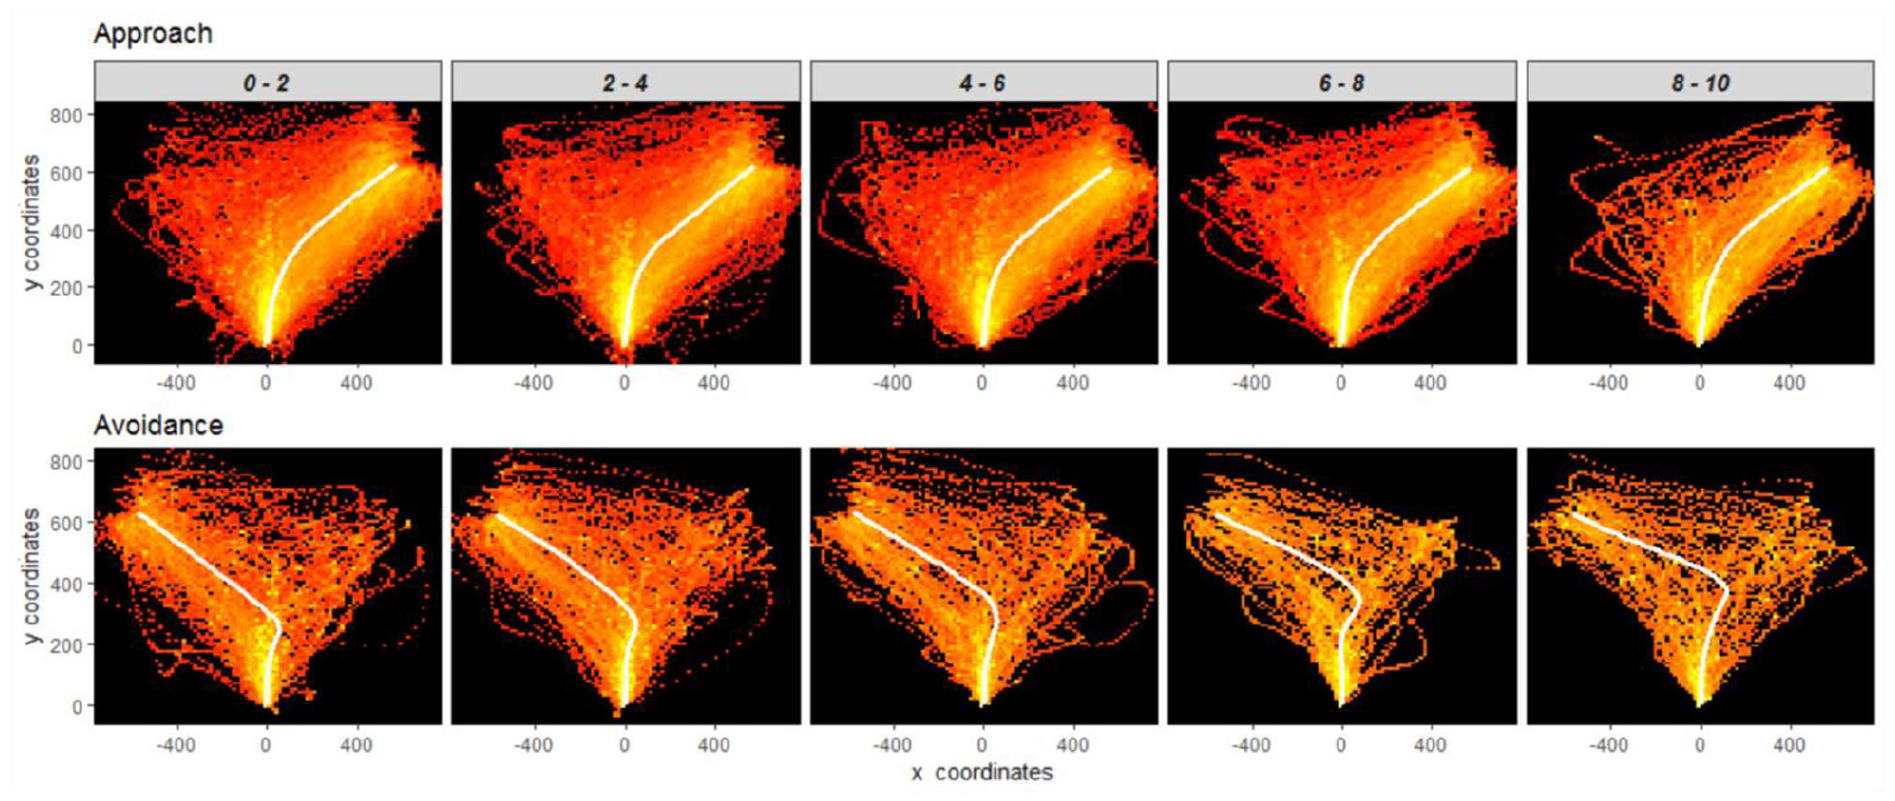
Heat map of raw and mean trajectories per index of conflict (Experiment 2). Proximity to zero (left column) indicates a greater level of psychological conflict.
Figure 8 displays the average effect of approach-avoidance and target valence on the variables of conflict, and Table 3 contains their corresponding estimates. Once more, approach yielded simpler trajectories than avoidance; characterised by faster responses, less deflection, vacillation, and entropy. In contrast to Experiment 1, the degree to which approach-avoidance and target valence affected each of the measures of conflict was noisier in this experiment. For example, the effects found for avoidance conflict as indexed by MAD and x-entropy were in disagreement with the trends observed in Experiment 1. 1 Mixed-models yielded a main effect of target valence on RT and MAD, suggesting that as target valence distanced from the point of subjective indifference, responses were faster and followed a straighter trajectory towards the chosen option. However, such a relation was not as linear for RT (see Figure 8a) and the MADs did not significantly differ for approach (see Figure 8b). In addition, increases in target valence neither significantly reduced the number of x-flips (see Figure 8c) nor did it result in less x-entropy (see Figure 8d). Similar to the first experiment, target valence was a stronger predictor of reduced conflict during approach than during avoidance for RT, as indicated by the interaction between these variables. Once again, robustness checks (see Supplementary Information) were conducted (almost 50% of participants consistently avoided or approached on all threat trials). Two further sets of models were estimated: (1) excluding consistent responders and (2) controlling for interactions with the participant’s indifference point. Of the significant effects noted here, only the main effect of response type (approach or avoid) on log RT and the trial number effects on log RT, x-flips, and sample entropy were not replicated in these additional analyses.
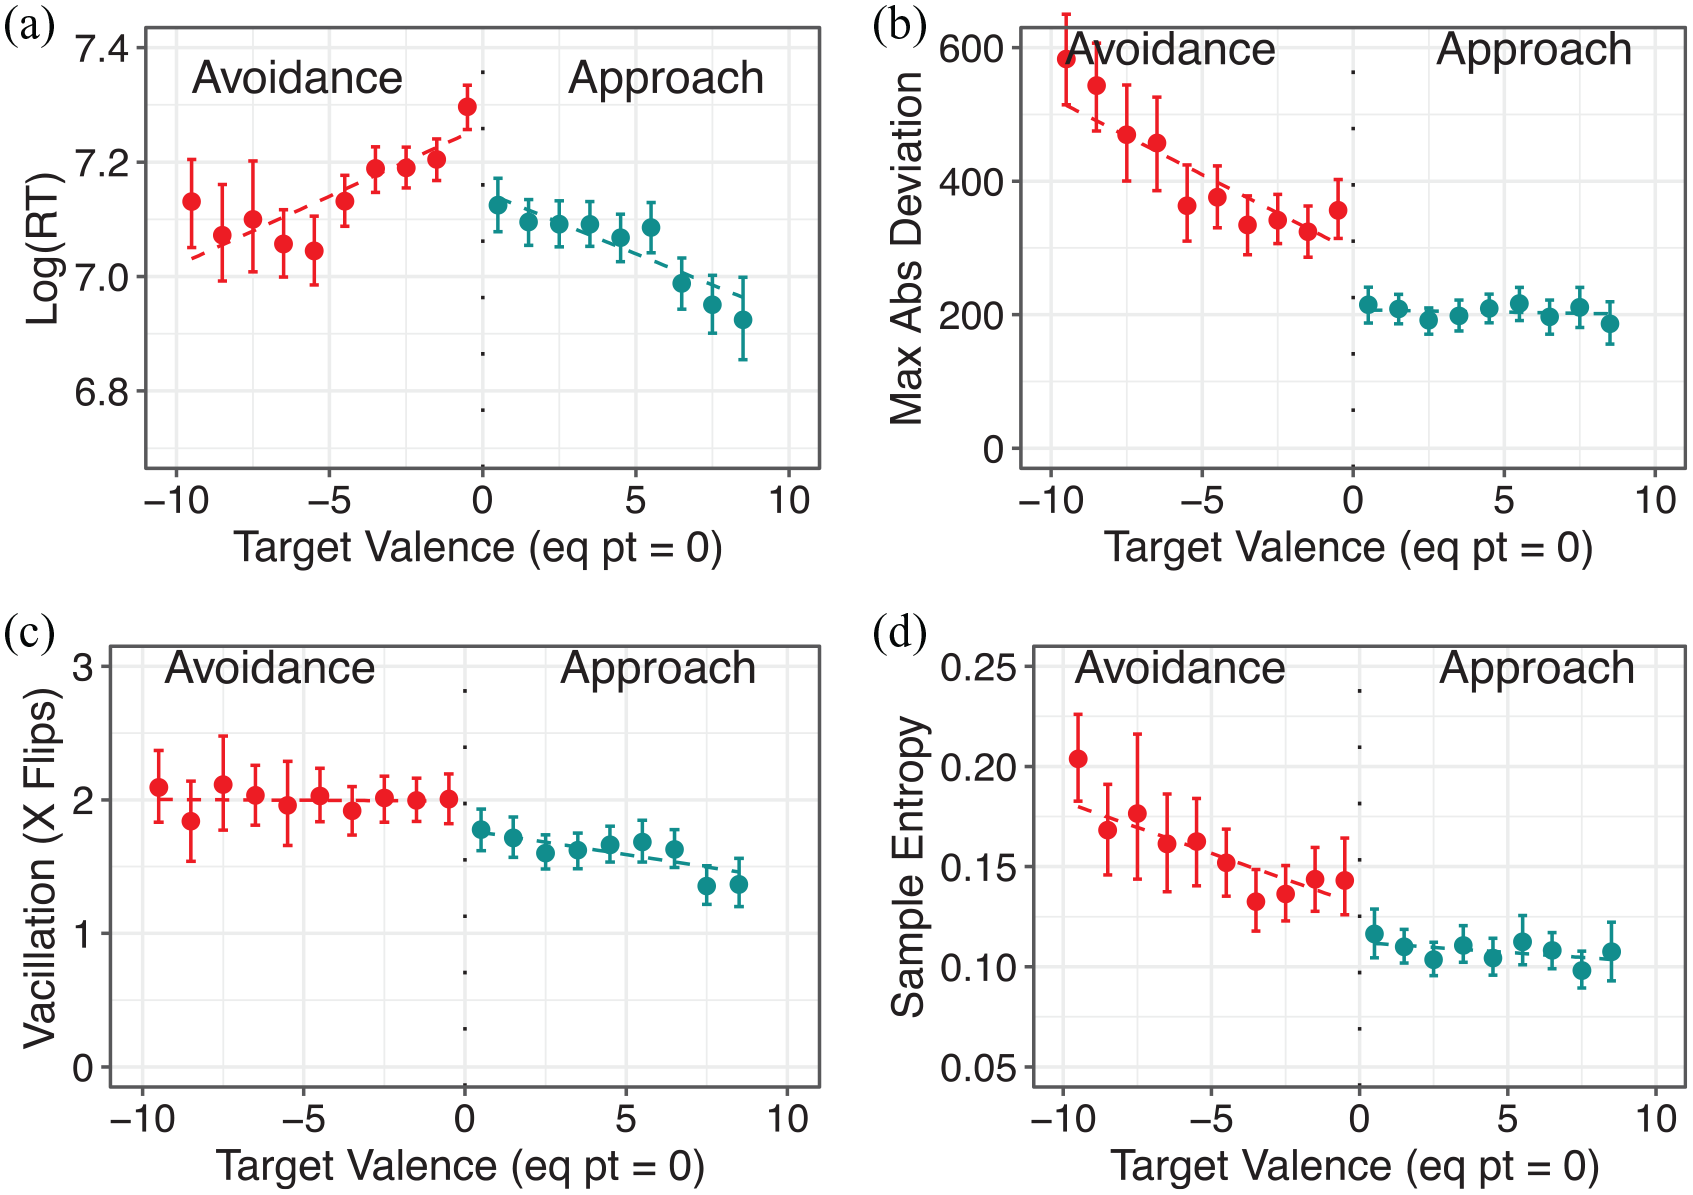
Data as a function of psychological conflict for each of the measures of interest (Experiment 2): (a) response time (ms), (b) maximum absolute deviation (px), (c) number of x-axis reversals, and (d) x-sample-entropy. The abscissa represents the target valence values, normalised across participants based on the distance from their indifference points; proximity to zero indicates greater psychological conflict. Avoidance (in red) consists of negative values to the left of the plot (below zero), and approach (in blue) to the right.
Statistical analyses on predictors for conflict variables (Experiment 2).
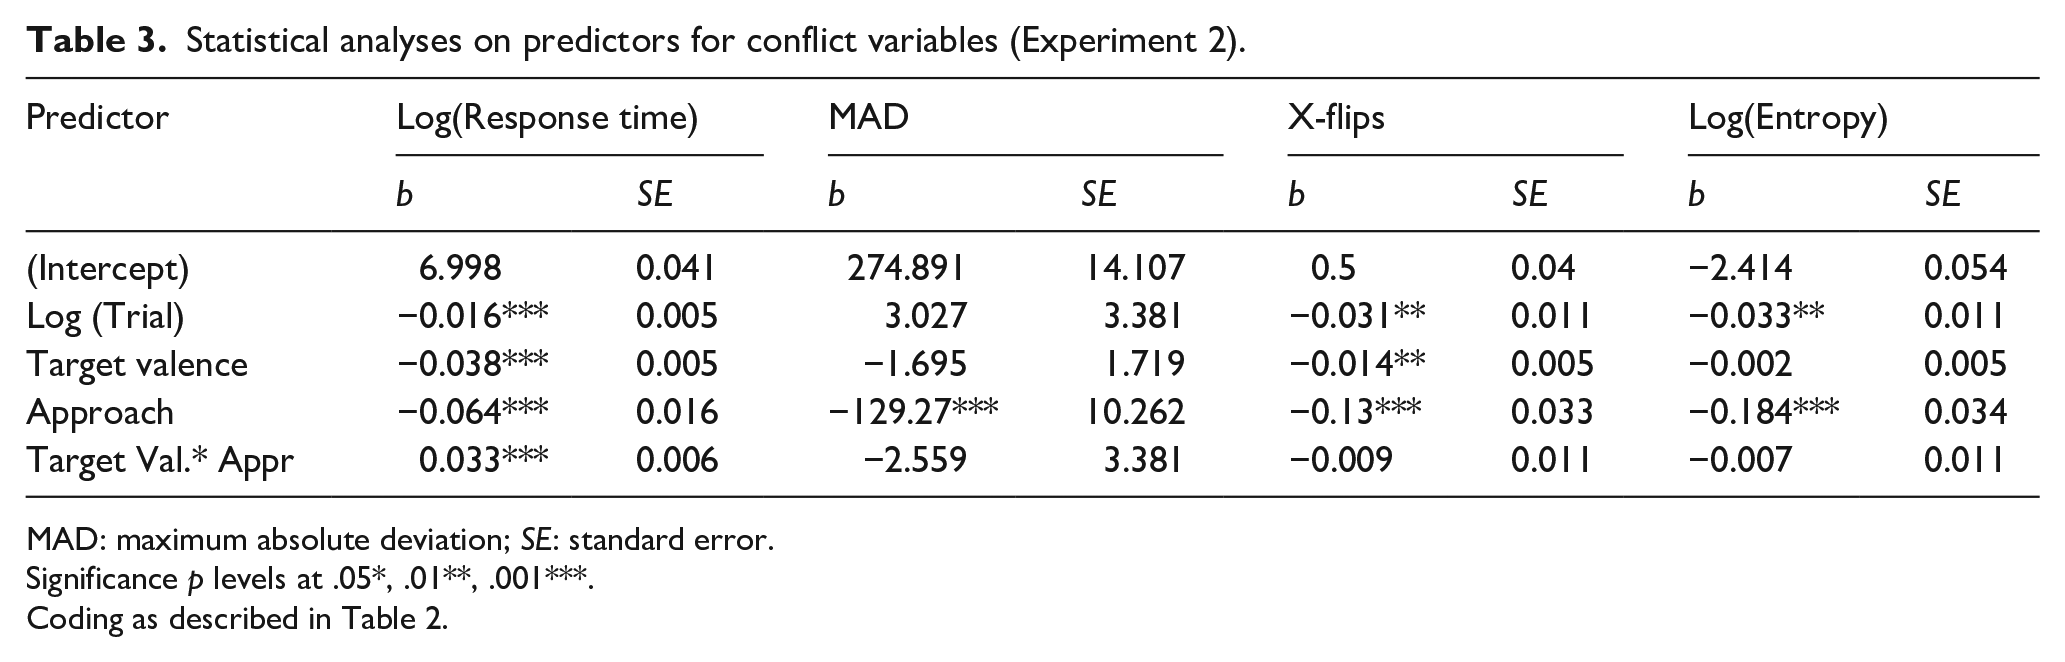
MAD: maximum absolute deviation; SE: standard error.
Significance p levels at .05*, .01**, .001***.
Coding as described in Table 2.
As previously, TCMR analyses of approach responses revealed the factors affecting the angle of the current response at each time step of the trajectory. The same variables as in Experiment 1 were explored but this time we also recorded the response movement executed during the previous trial as independent from choice (see Figure 9). Counterbalancing across trials enabled us to single out the contribution from both the choice and the movement direction of the last trial.
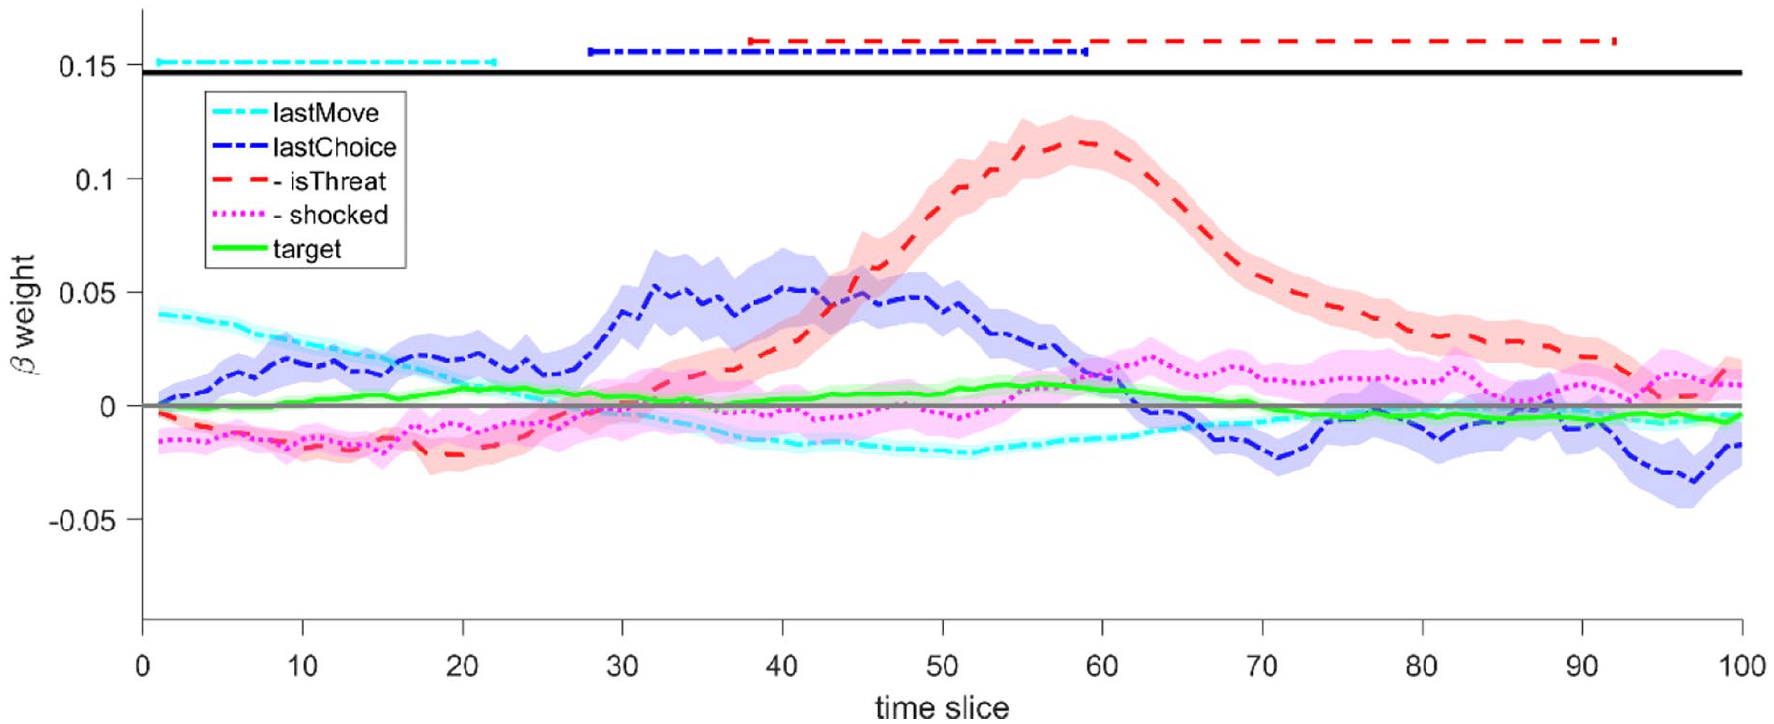
Influence of experimental variables on trajectory angle during response movement (Experiment 2). The line at zero represents the intercept, where positive values above the line indicate angle towards the final “T” choice; except for isThreat and shocked which indicate movement in the opposite direction. The horizontal lines on the top highlight the regions of significance for the regressors.
The effect of the previous response movement peaked at the beginning of the trajectory whereupon it dropped at a stable rate. Interestingly, the trajectory angle was next affected by the previous response, the effect of which peaked at time step 33 (cf. Figure 5, lastChoice’s dual peak). The effect of having experienced a shock during the previous trial peaked at time step 63 and the presence of threat in the current trial peaked at time step 58. Similar to Experiment 1, the effect of current threat was the strongest among the variables exerting influence over the trajectory angle, and the effect of target value had a weak effect at time step 56 (see Table 4).
Descriptive values for each variable in the TCMR (Experiment 2).
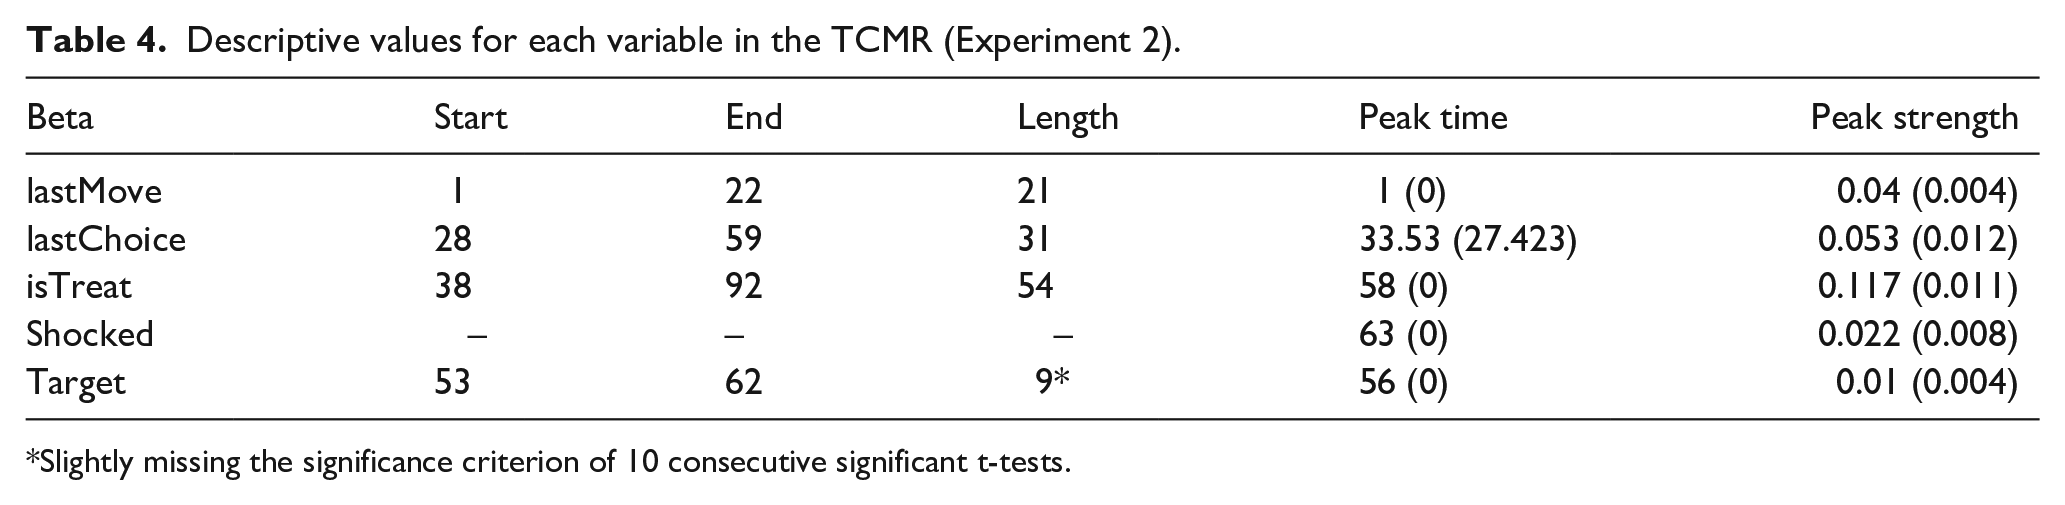
Slightly missing the significance criterion of 10 consecutive significant t-tests.
Discussion
Experiment 2 assessed whether the findings of Experiment 1 concerning approach and avoidance responses under threat conditions, would be replicated if a trial-based counterbalancing of response areas locations was implemented. Such a procedural variation represented a context that retained a strong default expectation of approach, but controlled for the response area location. Weakening the connection between the default approach expectation and response area location via trial-based counterbalancing weakened the default motor response established in Experiment 1. Similar to Experiment 1, approach trajectories were faster, less deflected and less complex than avoidance trajectories. Moreover, the effects of target valence on movement were less consistent across indices in Experiment 2 than in Experiment 1. Increased target valence reduced RT and marginally reduced MAD, but did not affect vacillation or complexity (see section “General Discussion” for further elaboration on this finding).
TCMR analyses detected similar influences to those found in Experiment 1; that is, shock recency, the presence of threat and reward value affected the middle phase of the decision, with threat having the strongest effect over trajectory angle, and target value the weakest. Furthermore, by randomising response area location across trials, it was possible to dissociate the influences of a default motor response (i.e., moving in the same direction as before) and a default choice expectation (i.e., choosing “Take”) within the approach trajectories. In Experiment 1, two peaks were observed in the trial-to-trial influence, one at the very beginning of a movement and one at approximately 40% of the time course of the trajectory, both pertaining to a default choice expectation (our lastChoice variable). However, in Experiment 2, the peak influence of the default motor response (our lastMove variable) was at the very beginning of the trial, and the peak influence of the default choice expectation was at approximately 40% of the trajectory (and the second strongest effect). Thus, it is reasonable to interpret the dual peak detected in Experiment 1 as the effect of two different processes at play, as demonstrated in Experiment 2.
General discussion
In this article, we investigated the action dynamics of behaviour during AAC and identified patterns of approach and avoidance response movement that were sensitive to each participant’s subjective level of conflict. Approach responses were simpler than avoidance responses and response trajectories became more complex as approach and avoidance motivations were more equally matched.
The current study contributes to the rich literature on AACs that indicates that humans appraise both the appetitive and aversive consequences of a decision. If the appetitive consequences are “worth it,” they will accept aversive consequences or the risk of aversive consequences (Bublatzky et al., 2017; Clark et al., 2012; Mitte, 2007; Pittig et al., 2018; Rattel et al., 2017; Schrooten et al., 2014; Schulreich et al., 2016; Sierra-Mercado et al., 2015; Stocco & Fum, 2008). Furthermore, the data reported herein provide new insights into AACs and offer a new investigative tool for research in the area. Conventional research shows that, at the discrete level (i.e., based solely on the chosen options), threat appraisal consistently varies across groups of individuals when classified based on their level of self-reported fear or degree of avoidance (cf., Supplementary Materials Figure S1). However, when behaviour is recorded in a continuous fashion over time, our data suggest that the psychological processes involved are indeed more complex and dynamic (cf. Wirth et al., 2016).
Our findings demonstrated the dynamic continuity of conflict resolution during AACs. Even though participants’ discrete threat appraisals were quite consistent across trials, their response dynamics suggested that the relative appraisals of threat and point losses evolved during each trial. That is, the outcome of the decision-making process was relatively similar from trial to trial, but the conflict was resolved dynamically in each case. According to Lewin (1935) and Miller (1944), the strength of attraction towards and repulsion from the available actions will be a function of the approach and avoidance valences, the effects of avoidance valences being more locally concentrated. A potential landscape derived from this decision space would originally depict slopes towards the available choices that are influenced by the relative approach valences of the actions (cf. Townsend & Busemeyer, 1989). A stronger attraction would induce a steeper slope towards the choice, thus greater speed and straighter trajectories in its direction. However, as one approaches a contingency associated with an aversive outcome, the landscape may tip in favour of a previously unfavoured outcome, resulting in a sharp change in direction towards the new choice.
The general motion pattern observed in the response trajectories in which participants approach but then redirect their movement is in line with Miller’s (1944) shallow-slope approach and steep avoidance gradients. In trials that were close to a participant’s indifference threshold point, conflicts took longer to resolve and response trajectories were more complex. For Experiment 1, this was evidenced by slower responses, greater deflection, more vacillation, and greater entropy when the points available were close to the indifference point threshold. In Experiment 2, decisions at higher levels of conflict were longer in duration and exhibited greater deflection but were not significantly different in vacillation or entropy. Nonetheless, the action dynamics in the data revealed the dynamic competition between approach and avoidance motivation that underlies complex decision-making.
The TCMR allowed us to further investigate the relative influences of experimental variables during each response. These analyses focused solely on those responses on which participants decided to gain points, with a subset of these responses occurring under threat conditions. The strongest influence on response trajectories was the presence of threat and this was observed in the middle of the trajectory. This supports the assumption that threat played a crucial role in inducing conflict when approaching; unfortunately, the same could not be corroborated during avoidance due to insufficient available data to conduct these analyses.
Through TCMR, we were also able to gain an insight into response biases. Prior to the effect of the repulsion from the preferred choice induced by the threat condition, response trajectories were influenced by the motor response (choosing the left or right option) and the decision (approach or avoid) in the previous trial. In Experiment 1, the approach and avoid options were presented on the left or the right consistently within blocks of responses. This procedure generated a stable mapping between a particular directional response and a choice, arguably contributing to less noisy patterns of response conflict. Nevertheless, due to this stable mapping, it was not possible to isolate the effects of moving in a particular direction from the decision to approach or avoid. In Experiment 2, the locations of the approach and avoid options changed unpredictably across trials, meaning that the mapping between motor response and choice was not consistent (see Wirth et al., 2020 for an analysis on methodological variables and potential influences on movement). In so doing, it was then possible to isolate independent effects on response trajectories due to motor preparation and choice preparation; with the motor preparation effect exerting its influence earliest in the trajectory followed by the choice preparation effect. This choice preparation effect aligns with previous research that has demonstrated that inhibition can be facilitated across trials in a stop-signal reaction time task (Bissett & Logan, 2012). The TCMR approach holds considerable promise for identifying independent effects on response trajectories from various experimental variables in AACs (cf. Scherbaum et al., 2018a, 2018b; Scherbaum, Frisch, Dshemuchadse, Rudolf, & Fischer, 2018; see also Sullivan et al., 2015; but cf. Zhang et al., 2018).
In the current study, participants developed expectations across trials that affected their trajectories prior to contact with the conditions established in each trial. This default model was biased towards choosing the “Take” option, but was updated in light of trial properties (i.e., the colour of the target stimulus and the value of the target stimulus). The TCMR analysis indicates that this default model included both cognitive and motor defaults. When considering whether approach is simpler than avoidance, this must be taken into account. Indeed, many life contexts induce approach or avoidance defaults based on past experience, and we would expect those defaults to be expressed into the relative dynamics of these behaviours when they are defaults and when they are not. Similarly, in the current study, a participant’s current probability of approach and avoidance based on trials experienced interacts with specific trial properties to give rise to the observed response dynamics. A dynamical systems account of decision making constitutes one means of accommodating the contributions to each response from the default model (the intrinsic dynamics) and novel information (behavioural information) and provides a parsimonious explanation of various findings in the current study (e.g., Kelso, 1995; Killeen, 1992; Marr, 1992; Scherbaum et al., 2016).
The effect of target valence on trajectories suggests that it played a role as a control parameter that tipped the scales towards “Take” or “Lose.” Close to a participant’s indifference threshold, the attractors at “Take” and “Lose” approached equipotentiality leading to greater decision conflict, reflected in longer RTs, greater trajectory deflection and more vacillations. From this point, as the target valence increased, “Take” responses became more probable and less conflicted; and as target valence decreased, “Lose” responses became more probable and less conflicted. Our TCMR comparative analyses between Experiments 1 and 2 isolated motor and cognitive biases (i.e., expectation of choosing “Take”) across trials, demonstrating that the default model includes these expectations at the start of a trial.
It is our hope that a greater understanding of AACs will lead to insights of practical relevance in the field of maladaptive avoidance to build a bridge between experimental and applied research (Kirlic et al., 2017; Sierra-Mercado et al., 2015). Indeed, it has been argued that approach-avoidance paradigms are more representative of the kind of realistic behaviour that scientists aim to understand (Beckers et al., 2013; Krypotos et al., 2018). Recent research has already begun to shed light on the dynamic processes involved in avoidance (e.g., Bublatzky et al., 2017; Pittig et al., 2015, 2018; Schlund et al., 2017; Stein & Paulus, 2009). For example, Pittig et al. (2018) demonstrated that competing incentives can instigate approach towards an initially avoided feared stimulus, highlighting how the interaction between approachable and avoidable consequences may be more effective in reducing avoidance than verbally cueing safety in isolation (cf. Garcia-Guerrero et al., 2014).
Moreover, it has been suggested that, in clinical anxiety, approach and avoidance contingencies work in parallel, and even in combination with each other (Forsyth et al., 2006) since, without competing approach motivations, avoidance is quite functional (Costello, 1970; Hayes, 1976). Studying the dynamic resolution of AACs may help elucidate some of the factors underlying pathological avoidance which has been resistant to extinction in clinical populations (Luciano et al., 2013; Vervliet & Indekeu, 2015; cf. Volpp et al., 2009).
Supplemental Material
sj-pdf-1-qjp-10.1177_17470218221087625 – Supplemental material for The action dynamics of approach-avoidance conflict during decision-making
Supplemental material, sj-pdf-1-qjp-10.1177_17470218221087625 for The action dynamics of approach-avoidance conflict during decision-making by Santiago Garcia-Guerrero, Denis O�Hora, Arkady Zgonnikov and Stefan Scherbaum in Quarterly Journal of Experimental Psychology
Footnotes
Declaration of conflicting interests
The author(s) declared no potential conflicts of interest with respect to the research, authorship, and/or publication of this article.
Funding
The author(s) received no financial support for the research, authorship, and/or publication of this article.
Notes
References
Supplementary Material
Please find the following supplemental material available below.
For Open Access articles published under a Creative Commons License, all supplemental material carries the same license as the article it is associated with.
For non-Open Access articles published, all supplemental material carries a non-exclusive license, and permission requests for re-use of supplemental material or any part of supplemental material shall be sent directly to the copyright owner as specified in the copyright notice associated with the article.