
Abstract
Sound symbolism is the phenomenon by which certain kinds of phonemes are associated with perceptual and/or semantic properties. In this article, we explored size sound symbolism (i.e., the mil/mal effect) in which high-front vowels (e.g., /i/) show an association with smallness, while low-back vowels (e.g., /ɑ/) show an association with largeness. This has previously been demonstrated with nonwords, but its impact on the processing of real language is unknown. We investigated this using a size judgement task, in which participants classified words for small or large objects, containing a small- or large-associated vowel, based on their size. Words were presented auditorily in Experiment 1 and visually in Experiment 2. We did not observe an effect of vowel congruence (i.e., between object size and the size association of its vowel) in either of the experiments. This suggests that there are limits to the impact of sound symbolism on the processing of real language.
Introduction
Sound symbolism refers to the phenomenon by which certain kinds of phonemes are associated with certain kinds of qualities. One of the most well-studied examples is the mil/mal effect, named after the stimuli used by Edward Sapir (1929). It is the finding that individuals tend to associate vowels articulated with the tongue high and front in the mouth (e.g., /i/ as in heed; /ɪ/ as in hid) with small objects, and vowels articulated with the tongue low and back in the mouth (e.g., /ɑ/ as in hawed, /oʊ/ as in hoed) with large objects (Newman, 1933; Sapir, 1929).
Several explanations have been put forth for this association (for a review, see Sidhu & Pexman, 2018). One is that it derives from a small/large space in the mouth as either kind of vowel is articulated, which is then associated with smallness/largeness in objects in the world (e.g., Sapir, 1929). Another is that it arises through an internalisation of the statistical regularity with which certain frequencies co-occur with certain sizes in the world. In particular, the fact that small/large things tend to resonate at higher/lower frequencies, respectively (see Spence, 2011). Yet another proposal is that it arises from an evolved, species-general, association between small/large entities and high-/low-frequency calls (Ohala, 1994).
Sound symbolism has usually been demonstrated using nonwords, and this is true for the mil/mal effect as well. In typical experiments, the participant is presented with objects of varying sizes, along with nonwords differing in their vowel content, and asked to pair them in the way that seems most appropriate. This regularly results in pairings that are consistent with the mil/mal effect (e.g., Thompson & Estes, 2011). The mil/mal effect has also emerged on some more implicit tasks. For instance, using an implicit association task, Parise and Spence (2012) found that participants were faster to respond when mil/small shapes and mal/large shapes shared a response button than when this pairing was reversed. In addition, Ohtake and Haryu (2013) demonstrated that participants were faster to categorise the size of a target (relative to a comparison shape) if presented with a vowel that was sound symbolically congruent versus incongruent with the decision category (e.g., hearing /i/ vs. /ɑ/ when the shape to be classified was small). Drawing on the cross-modal correspondence literature, this might be conceptualised as vowels lowering the criterion for a congruent response and/or increasing the criterion for an incongruent response (e.g., hearing /i/ lowers the criterion for responding SMALL and increases the criterion for responding LARGE; see Marks, 2004).
In this study, we explored whether the mil/mal effect influences responses to real words. In particular, whether participants are faster to categorise a word as referring to a small object if it contains a high-front vowel as opposed to a low-back vowel, and vice versa for large objects. To give an example: are individuals faster to categorise flea (containing the small-associated /i/) as small than they are wasp (containing the large-associated /ɑ/)? This could suggest that phonemes evoke sound symbolic associations even when contained in real words, and that these evoked associations then affect responses. While demonstrating sound symbolism with nonwords is informative, it is important to begin to examine the relationship between sound symbolism and real language.
There has been limited exploration of whether sound symbolic effects emerge in the processing of real words. Indeed, some have proposed that real words may be processed in such a way as to diminish the effects of sound symbolism (Westbury, 2005). An exception is work by Aryani and Jacobs (2018) which found that exciting (calming) words are processed faster if they contain phonemes previously shown to be judged as exciting (calming). There is a great deal of evidence from the closely related topic of ideophones: a marked class of words that depict sensory experiences (see Dingemanse, 2018). Notably, some ideophones depict sensory experience by way of sound symbolic associations. Take, for example, the Japanese words goro and koro, meaning a heavy and a light object rolling, respectively. These make use of the sound symbolic association between voiced and unvoiced consonants (e.g., /g/ vs. /k/) and heaviness and lightness, respectively (Saji et al., 2013). There is evidence that ideophones are easier to remember (Lockwood et al., 2016), learn (Imai et al., 2008), and show differences in patterns of brain activity (Kanero et al., 2014; Lockwood & Tuomainen, 2015) compared with non-ideophones. Researchers have not, however, explored whether ideophones are processed faster than non-ideophones, and thus whether sound symbolism can affect the earliest stages of language processing. It is also important to reiterate that ideophones are a marked class of word, which could limit the extent to which their processing applies to words in the lexicon in general.
The question of whether sound symbolic effects extend to real language also pertains to the broader concept of the arbitrariness in language. For the majority of words, form is not related to meaning in any special way (e.g., the sounds in cat have very little to do with the animal to which they refer). However, some words display iconicity when their forms map onto their meanings through resemblance. The most notable example of this is onomatopoeia in which the sound of a word directly resembles its meaning (e.g., bang, crash, oink). However, a word like flea could also be considered iconic, in a more indirect and associative way. While its form does not resemble its meaning directly, it does evoke features (e.g., /i/ evoking smallness) that do resemble its meaning. We refer to this as cross modal iconicity.
There is evidence of facilitated processing of iconic words. Sidhu et al. (2020) demonstrated that onomatopoeia are processed faster and more accurately than non-iconic words (see also Meteyard et al., 2015; cf. Peeters, 2016; Vigliocco et al., 2020). Their interpretation was that there are special links between phonology and semantics in iconic words, and that this facilitates their processing. However, save for the dimension of arousal (Aryani & Jacobs, 2018), there has not been evidence that crossmodally iconic words (e.g., flea) are processed faster. Yet, if they have the same privileged links between phonology and semantics, this could be another mechanism by which sound symbolism could emerge with real words. Conversely, it could be that these privileged links only exist for onomatopoeia. In that case, processing would not be facilitated for crossmodally iconic words.
The present study
In this study, we examined whether or not sound symbolic associations emerge for real words and affect responses on a speeded, forced choice task. This might be indicative of one of at least two mechanisms taking place: (1) phonemes evoking associations that facilitate congruent responses, and/or (2) special links between phonology and semantics in iconic words which facilitate their processing. We used nouns with vowels sound symbolically associated with smallness or largeness and employed a size judgement task. If sound symbolism plays a role in the processing of these real words, participants should be faster to respond SMALL or LARGE when the vowels in a target word are sound symbolically congruent with that category.
Experiment 1
Method
Participants
Participants were 48 undergraduate students at the University of Calgary who participated in exchange for course credit. All participants reported English fluency and normal or corrected to normal vision.
Materials and procedure
To develop our list of stimuli, we began with a list of single syllable nouns referring to objects. We only considered nouns containing either a symbolically small (i.e., high-front; /i/ or /ɪ/) or large (i.e., low-back; /ɑ/ or /oʊ/) vowel. In a pilot study, a separate group of 36 participants rated the size of the objects these nouns referred to on a scale from 1 (the size of an ant) to 9 (the size of downtown Calgary). 1 Based on these ratings, nouns were classified into those referring to small objects (mean rating <3.05) and those referring to large objects (mean rating >3.05). This cut-off was chosen because it was the point in the scale that distinguished objects that could and could not fit inside of an average bucket (the instruction given to participants on the main experimental task). We used size ratings and vowel type to select 20 nouns of each of the following four types: small vowel/small object (e.g., flea), small vowel/large object (e.g., ship), large vowel/small object (e.g., wasp), and large vowel/large object (e.g., boat). Each of these lists was matched (all ps ⩾ .18) on letter length, subtitle word frequency (Brysbaert & New, 2009), orthographic Levenshtein distance (Yarkoni et al., 2008), age of acquisition (Kuperman et al., 2012), concreteness (Brysbaert et al., 2014), and imageability (Cortese & Fugett, 2004). In addition, the size ratings of small objects of either vowel type were matched (p = .80), as were the size ratings of large objects of either vowel type (p = .14). See Table 1 for the properties of each word type.
Means and standard deviations of lexical and semantic properties of each word type used.
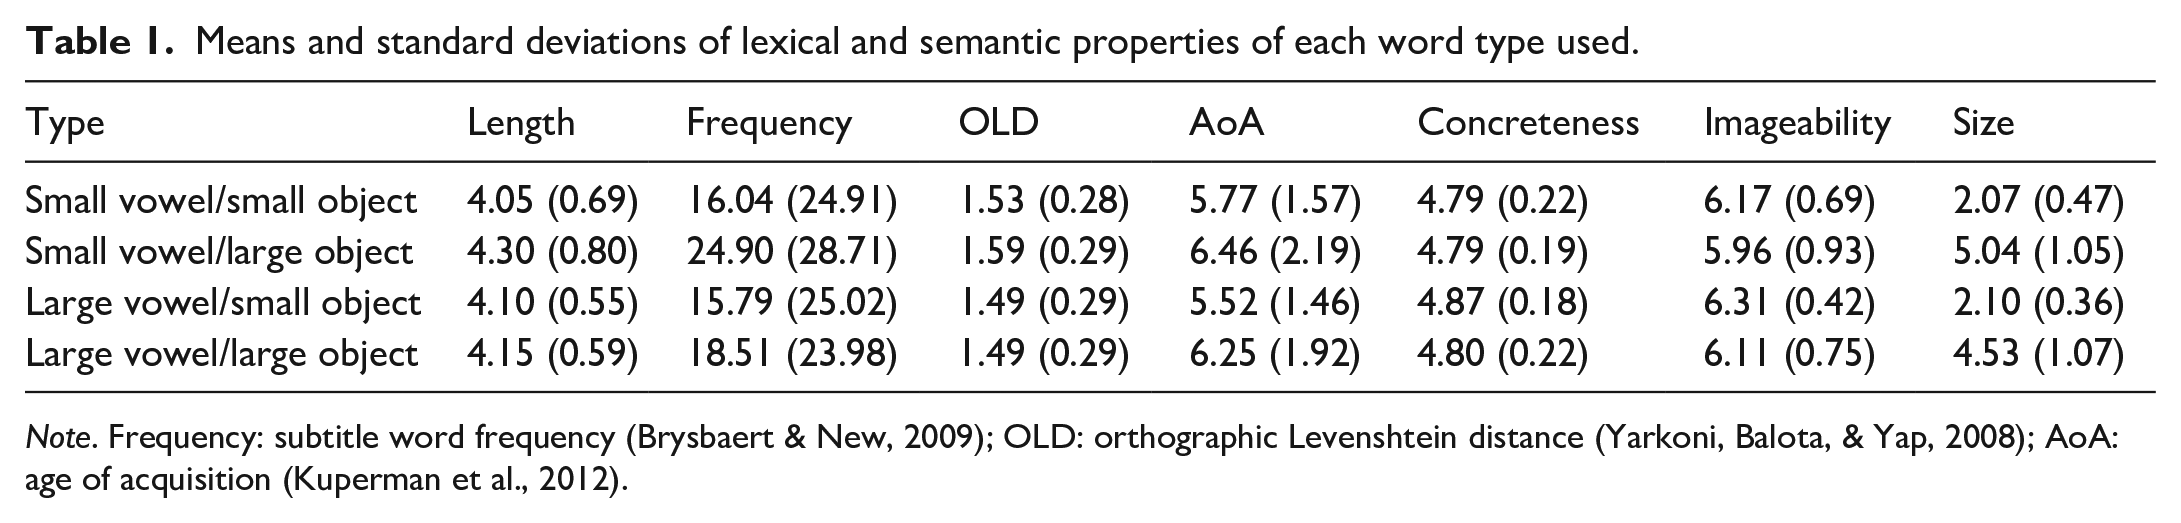
Note. Frequency: subtitle word frequency (Brysbaert & New, 2009); OLD: orthographic Levenshtein distance (Yarkoni, Balota, & Yap, 2008); AoA: age of acquisition (Kuperman et al., 2012).
Participants were instructed to decide whether a series of objects were small or large. For reference, they were told that small objects are those that would fit inside an average bucket, while large objects are those that were bigger than an average bucket. Stimuli were presented auditorily through headphones; audio files were recorded by a professional voice actor naïve to the purpose of the study. Each trial began with a fixation cross for 1,000 ms. The stimulus was then presented, and participants responded through button press on a response box. Assignment of left and right buttons to “small” versus “large” was counterbalanced across participants. Stimuli were presented in a random order.
Results
We performed our analyses in R [3.5.1] (R Core Team, 2016) using the packages “lme4” [version 1.1-18-1] (Bates et al., 2015), “afex” [0.23-0] (Singmann et al., 2015), “prediction” [0.3.6] (Leeper et al., 2019), and “RePsychLing” [0.0.4] (Baayen et al., 2015). We developed each model’s random effects structure using the approach suggested by Bates et al. (2015). In brief, we began with all relevant random slopes and intercepts. We then performed a principal components analysis on this structure to determine the number of random effects that could be supported by the data and removed random slopes until arriving at this number. We then also tested the inclusion of correlations between random slopes and intercepts, and the inclusion of random slopes themselves, using likelihood ratio tests. We used the “lmerTest” package [3.0-1] (Kuznetsova et al., 2017) to generate p-values for predictors in linear models using the Satterthwaite’s degrees of freedom method. Finally, we used the packages “rstanarm” [2.21.1] (Goodrich et al., 2020) and “bayestestR” [0.7.5] (Makowski et al., 2020) to conduct Bayesian analyses. Code and data for all analyses are available at: https://osf.io/53rkt/
Reaction time
We removed two items that had an average accuracy below 50%: inn and sloth (only correctly categorised as large 37.50% and 43.75% of the time, respectively). In the analysis of reaction times, inaccurate trials (19.90%) were removed. Next, we calculated the uniqueness point for each word in milliseconds. This was how long into each word the phoneme that disambiguated it from all other words appeared (Luce, 1986). We used this to calculate the uniqueness point corrected reaction time for each trial (i.e., reaction time minus uniqueness point). We then removed any remaining trials with a uniqueness point corrected reaction time faster than 200 ms or slower than 3,000 ms, and then removed trials more than 2.5 SDs from a participant’s mean (5.50% of trials altogether). This left a total of 2,834 trials in the analysis. Finally, we log-transformed the data (raw reaction time; not uniqueness point corrected reaction time) to ensure residuals were normally distributed.
We used a mixed-effects linear regression analysis where the dependent variable was the log transformed time it took a participant to categorise a word as referring to a small or large object. (Note that this was reaction time proper, not uniqueness point corrected reaction time.) The congruency between object and vowel size was the predictor of interest (effects coded; −0.5 = incongruent, 0.5 = congruent). We also included audio file duration in milliseconds, uniqueness point in milliseconds, number of phonemes, log subtitle frequency (Brysbaert & New, 2009), phonological Levenshtein distance (Yarkoni et al., 2008), concreteness (Brysbaert et al., 2014), imageability (Cortese et al., 2004), and size extremity (defined as the absolute distance from mean size of all words) as control variables. We also included several control variables that could affect perceptions of size: vowel length (effects coded; −0.5 = short, 0.5 = long), syllable structure (effects coded; −0.5 = CVC, 0.5 = non-CVC), and consonant size association. This latter variable was based on a reanalysis of data from Westbury et al. (2018), who quantified the fit between nearly 8,000 nonwords and various categories. Participants in the Westbury et al. study were presented with a nonword both visually and auditorily, along with a target category (e.g., something large; something small). Their task was to accept or reject that nonword as a good name for something from that category. We analysed data from the large and small category trials using ridge regression (to guard against large coefficients). We included the presence of each possible phoneme as a predictor of the likelihood that a person endorsed a given nonword as a good word for either something large or small. This allowed us to quantify the association (i.e., the resulting coefficient) between each phoneme and the category of large and small. We then subtracted the small coefficients from the large coefficients, to generate a single size predictor for each phoneme (these are available on OSF). We averaged the coefficient values for consonants in the onset 2 and the second consonant positions. Words without a consonant in a given position (e.g., eel) received a 0 for that position. All continuous predictors were standardised. The resulting model suggested that congruency had no effect on reaction time (b = −0.01, p = .73, 95% confidence interval [CI] = [−0.04, 0.03]), see Table 2.
Resulting linear mixed-effects model predicting reaction time in Experiment 1.
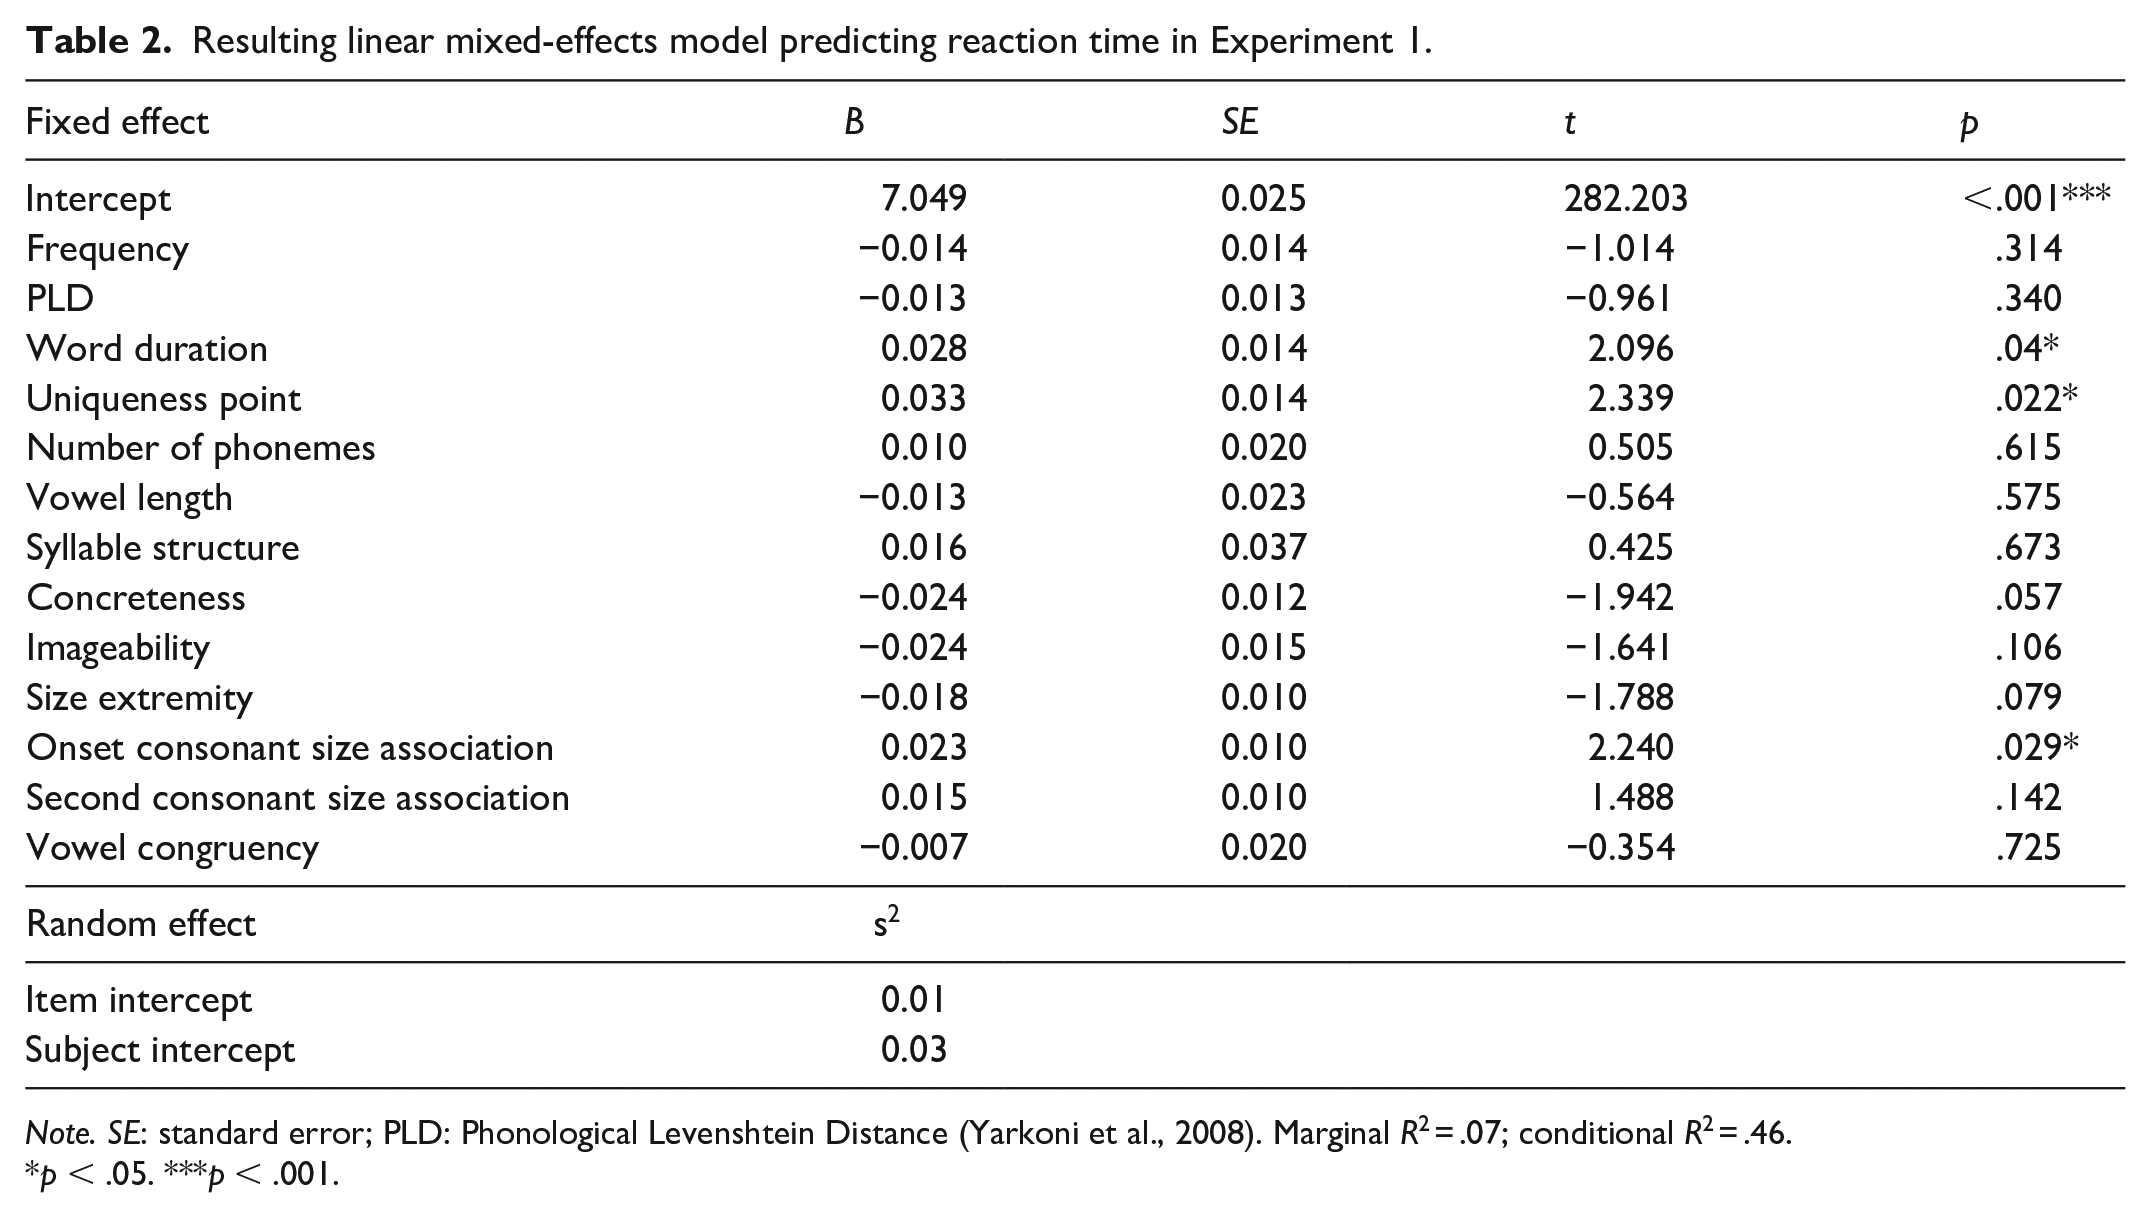
Note. SE: standard error; PLD: Phonological Levenshtein Distance (Yarkoni et al., 2008). Marginal R2 = .07; conditional R2 = .46.
p < .05. ***p < .001.
To quantify the evidence in favour of the null hypothesis, we conducted a version of the above analysis using Bayesian mixed-effects regression. A full introduction to this approach is beyond the scope of this article and we refer the reader to Vasishth et al. (2018) for a tutorial. We did not take the approach of calculating Bayes Factors, as they are especially sensitive to one’s prior beliefs (see Vasishth et al., 2018), and we did not have a substantive literature on which to base informed priors. Instead, we chose a region of practical equivalence (ROPE) analysis (see Kruschke, 2018). This method examines the percentage of the 95% highest density interval (HDI; i.e., the 95% most credible values for each parameter) that falls within a region of practical equivalence. That is, instead of treating the null hypothesis as a point value of 0, it treats a range of values around 0, that are practically equivalent to 0, as representing the null. Here, we adopt Kruschke’s (2018) suggestion of a range of ±0.1 SDs in the dependent variable as the ROPE. This equates to what Cohen (1988) considered a negligible effect size. As suggested by Kruschke (2018), we avoid making a discrete decision regarding the null or alternate hypothesis, and instead report the percentage of the HDI that falls within this region. Intuitively, this can be understood as follows: of the most probable values of a given parameter, what percentage are practically equivalent to 0.
All Bayesian models included random subject and item intercepts, as well as a random subject slope for vowel congruency. Fixed effects were given the generic prior of a normal distribution with a mean of 0 and a standard deviation of 2.5. Models initially consisted of four chains, each with 2,000 iterations (1,000 of which were treated as warm-ups). If these models did not show good convergence (i.e., an effective sample size of at least 10% that of the total number of samples; Vasishth et al., 2018), additional iterations were added. In the Experiment 1 analyses, we removed the predictor for syllable structure in the Bayesian analyses because of an issue of multicollinearity with number of phonemes. In this analysis, 83.41% of the HDI for congruency fell within the ROPE.
We next examined the possibility that congruency would only have an effect on either small or large objects. We did this by computing a model that included object size (effects coded; −0.5 = small, 0.5 = large) and its interaction with congruency. The interaction between predictors was not significant (b = −0.02, p = .69, 95% CI = [−0.12, 0.08]), nor was the effect of congruency (b = −0.01, p = .61, 95% CI = [−0.05, 0.03]).
Previous research has demonstrated an association between left and right space, and small and large size (Sellaro et al., 2015; a specific instance of the spatial-numerical association of response codes [SNARC] effect, Dehaene et al., 1990). Thus, we examined the possibility that reversing this natural pairing in half of the participants (i.e., those pressing the left button for large) may have attenuated the potential congruency effect. We ran a model including button assignment (i.e., condition; effects coded; −0.5 = SNARC consistent; 0.5 = SNARC inconsistent), as well as its interaction with congruency, as predictors. The interaction between predictors was not significant (b = 0.02, p = .30, 95% CI = [−0.02, 0.05]) nor was the effect of congruency (b = −0.01, p = .77, 95% CI = [−0.04, 0.03]). There was, however, a significant effect of condition (b = 0.10, p = .031, 95% CI = [0.01, 0.19]) such that participants with SNARC consistent button pairings responded faster than those with the inconsistent pairings (see Figure 1). In Figure 2, we present the average residualised reaction time for each word, after controlling for all previously mentioned control variables.
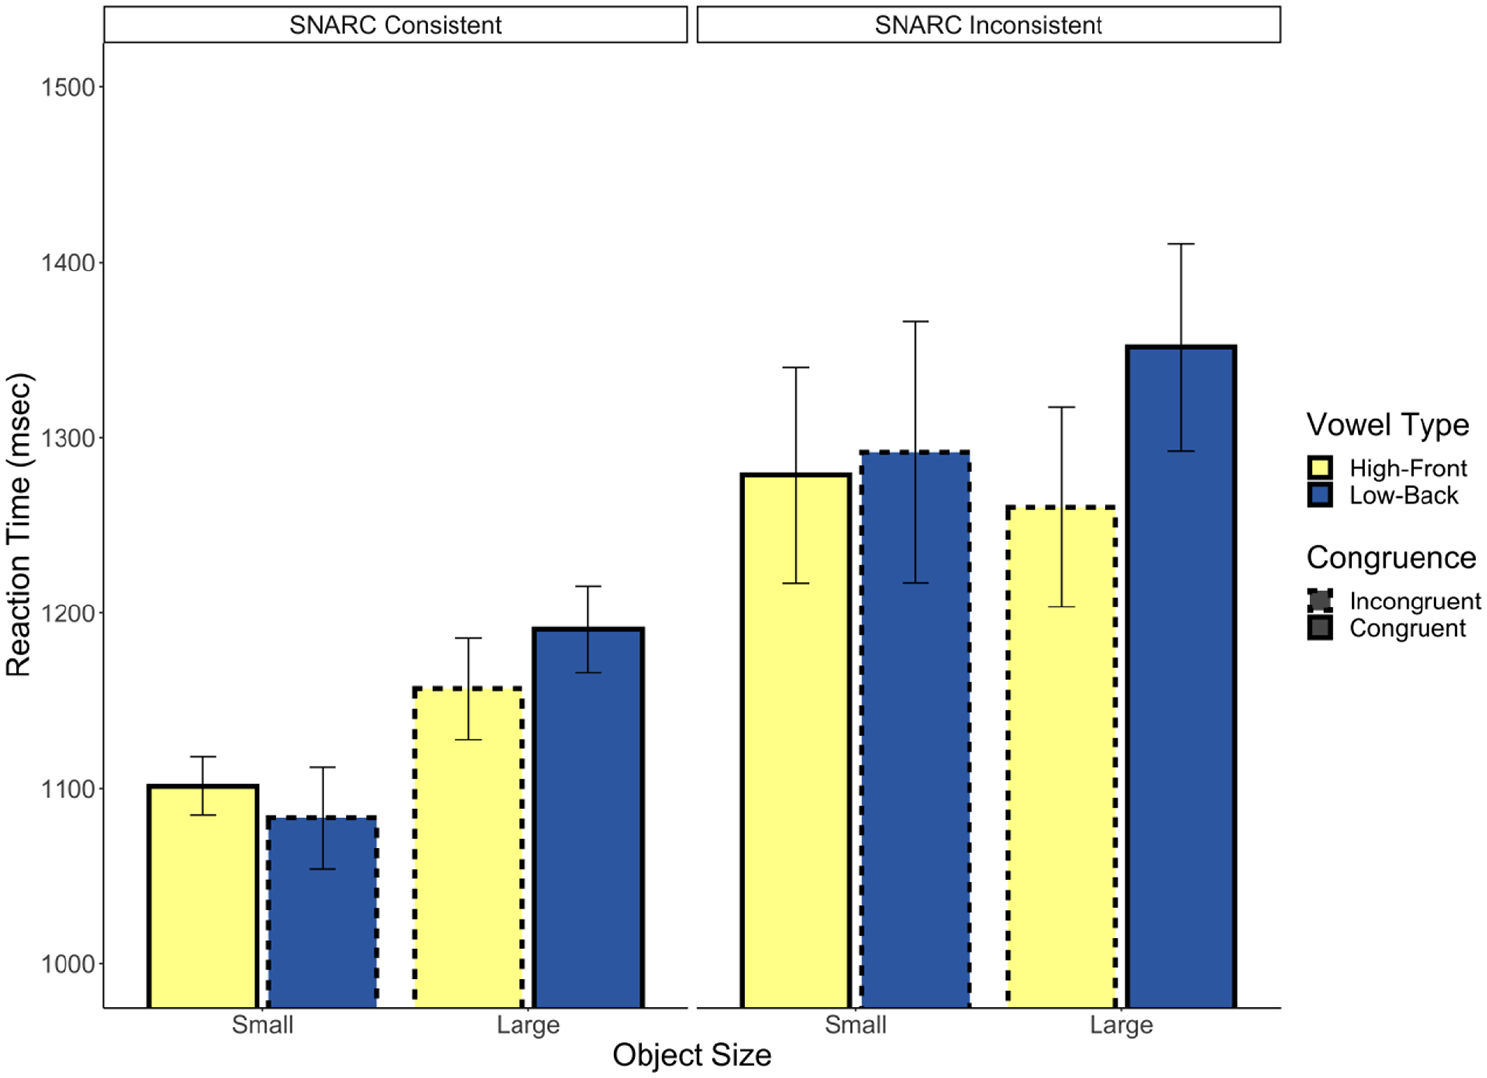
Experiment 1 reaction time.
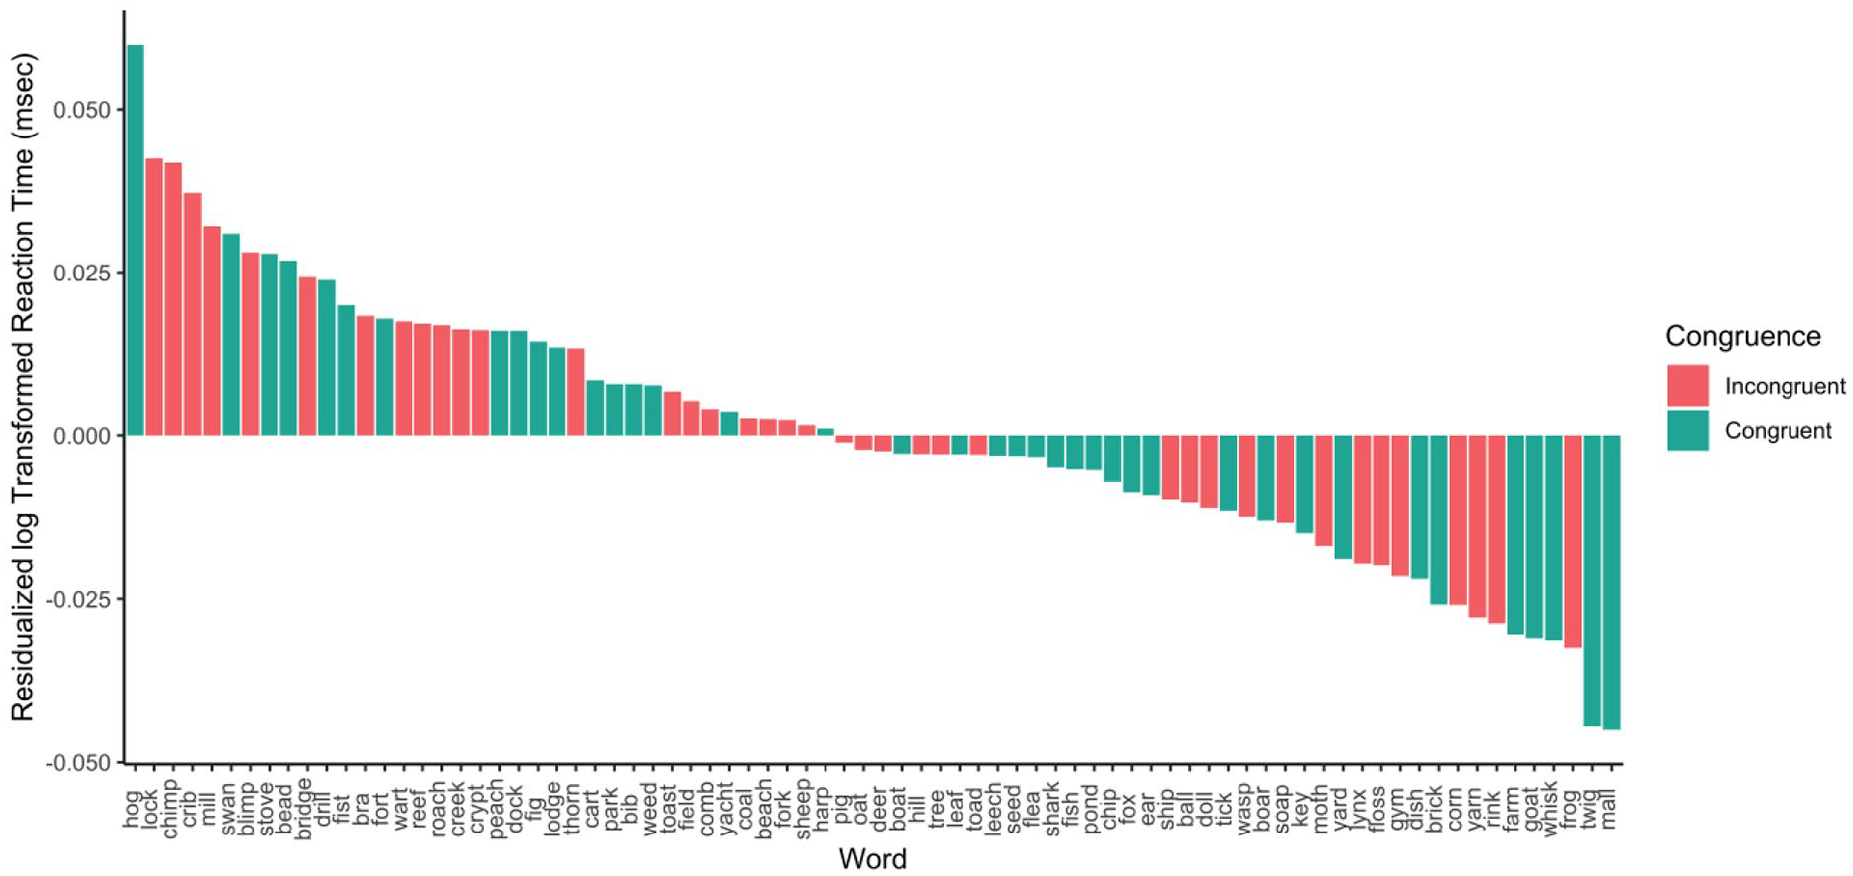
Average residualised reaction time by word in Experiment 1.
Finally, in a series of supplemental analyses, we examined whether congruence based on other predictors might predict reaction time. To begin with, we recoded congruence based on vowel length (e.g., a word with a long vowel and large referent was considered congruent) and found that it was not a significant predictor (b = −0.00, p = .84, 95% CI = [−0.04, 0.03]). In two separate analyses, we also found that the interaction between number of phonemes and object size was not a significant predictor (b = 0.04, p = .067, 95% CI = [0.00, 0.07]), nor was the interaction between onset consonant size association and object size (b = −0.01, p = .75, 95% CI = [−0.04, 0.03]).
Accuracy
In the analyses of accuracy, we followed the same process of excluding trials as in the reaction time analysis, except we retained inaccurate trials (8.93% of trials were removed). This left a total of 3,497 trials in the analysis. We used a mixed-effects logistic regression to analyse the data using accuracy on each trial as the dependent variable. The model included the same variables as the analysis of reaction time. The resulting model suggested that congruency had no effect on accuracy (b = 0.15, p = .41, 95% CI = [−0.22, 0.52]) (see Table 3).
Resulting logistic mixed-effects model predicting response accuracy in Experiment 1.
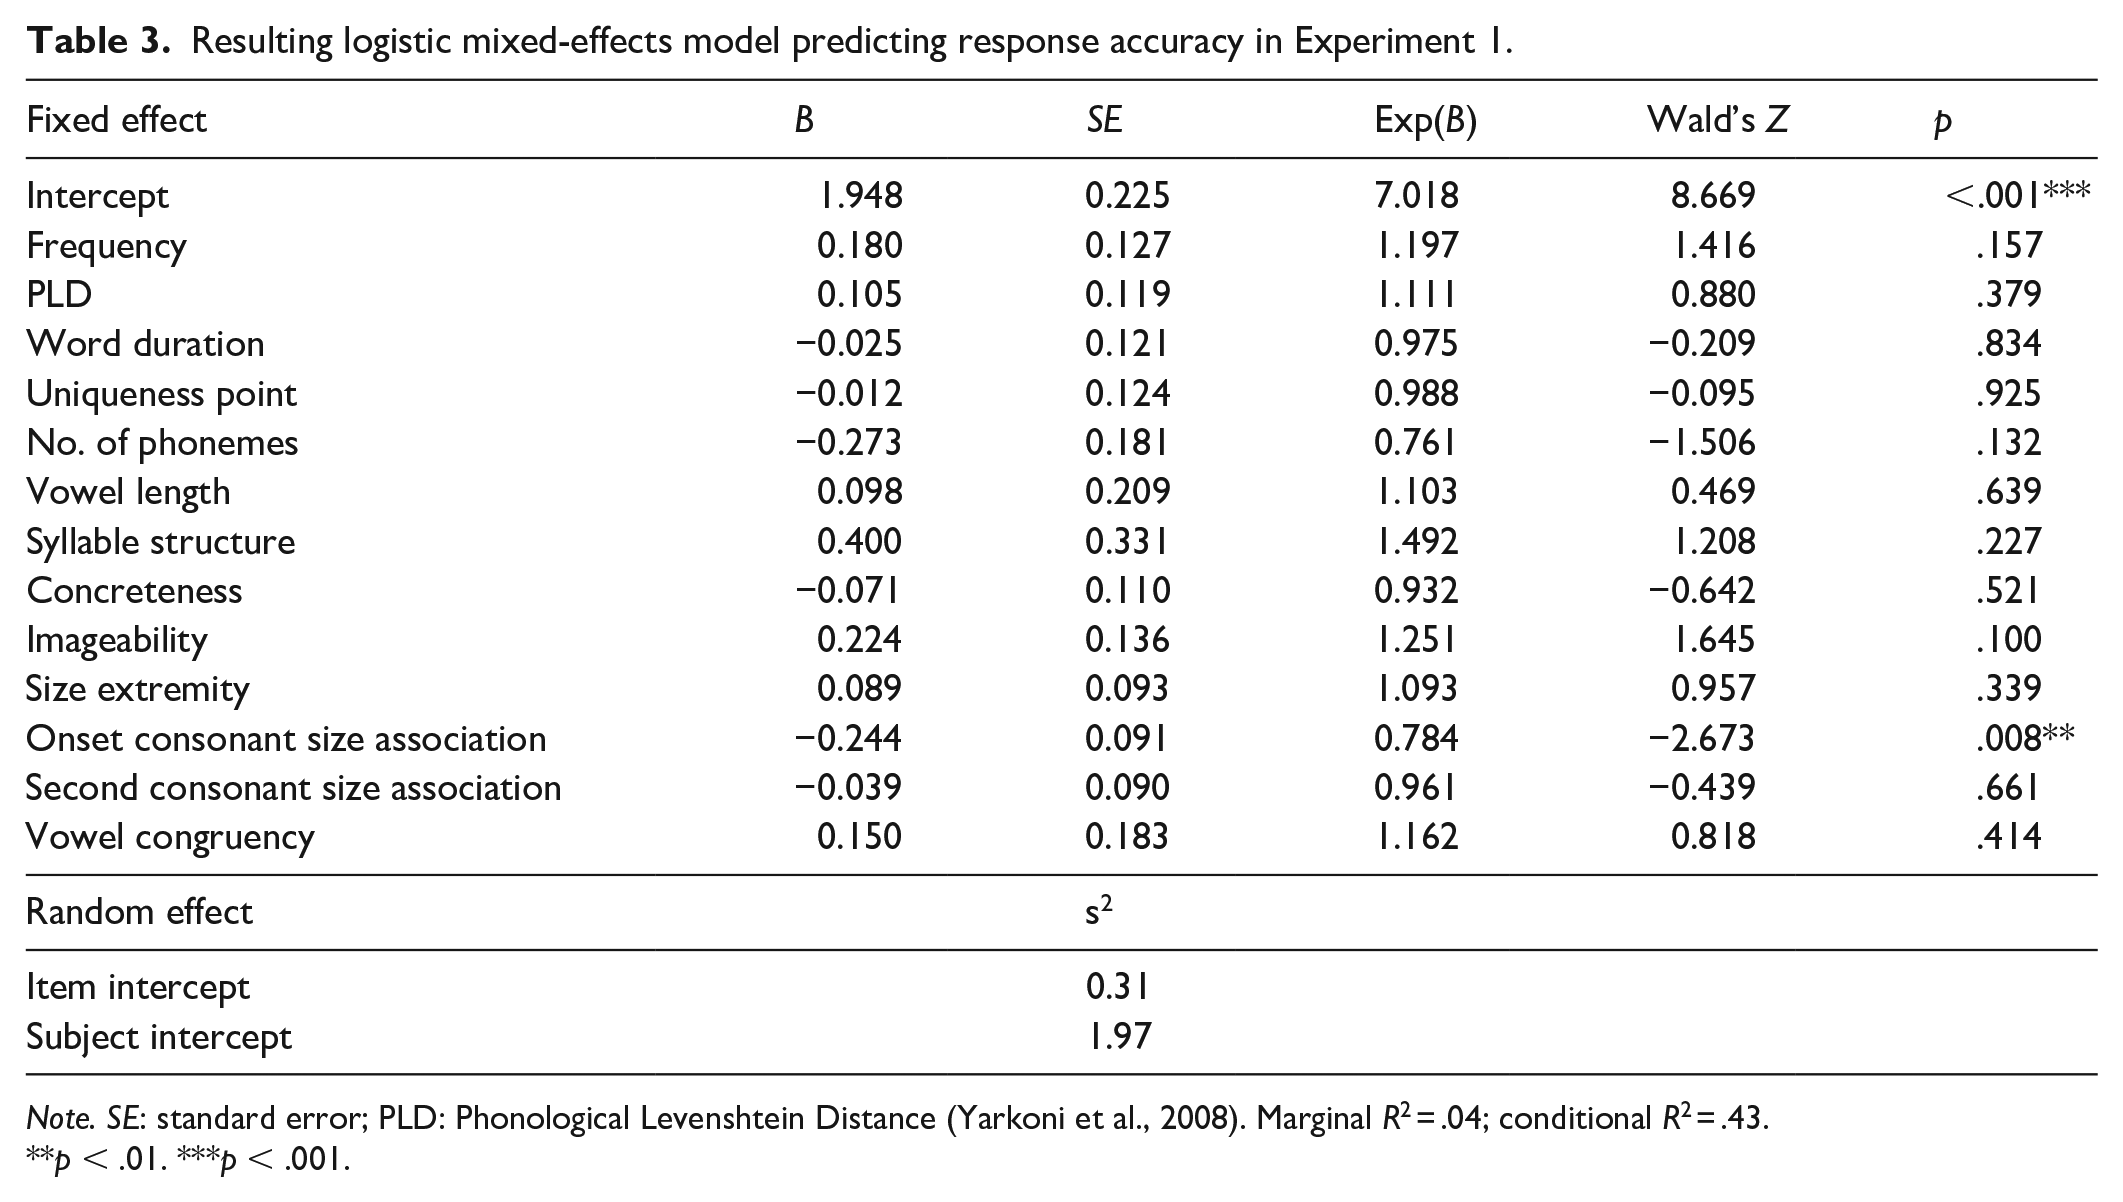
Note. SE: standard error; PLD: Phonological Levenshtein Distance (Yarkoni et al., 2008). Marginal R2 = .04; conditional R2 = .43.
p < .01. ***p < .001.
As in the analysis of reaction time, we conducted a version of the above analysis using Bayesian mixed-effects regression. We used the package default ROPE for logistic regression, which is equal to coefficients ranging from ±0.18. This analysis found that 44.19% of the HDI for congruency fell within the ROPE.
We next computed a model that included the object size and its interaction with congruency. The interaction between predictors was not significant (b = −0.06, p = .91, 95% CI = [−1.01, 0.92]) nor was the effect of congruency (b = 0.16, p = .37, 95% CI = [−0.21, 0.53]). There was, however, a significant effect of object size (b = −0.93, p = .005, 95% CI = [−1.62, −0.26]) such that responses were more accurate to small objects compared with large objects.
Next, we ran a model including button assignment, as well as its interaction with congruency, as predictors. The interaction between predictors was not significant (b = −0.03, p = .89, 95% CI = [−0.45, 0.39]) nor was the effect of congruency (b = 0.15, p = .41, 95% CI = [−0.22, 0.52]). There was, however, a significant effect of condition (b = −1.01, p = .01, 95% CI = [−1.81, −0.22]) such that participants with the SNARC consistent button assignment responded more accurately than those with the inconsistent pairing (see Figure 3). In Figure 4, we present the average residualised reaction time for each word, after controlling for all previously mentioned control variables.
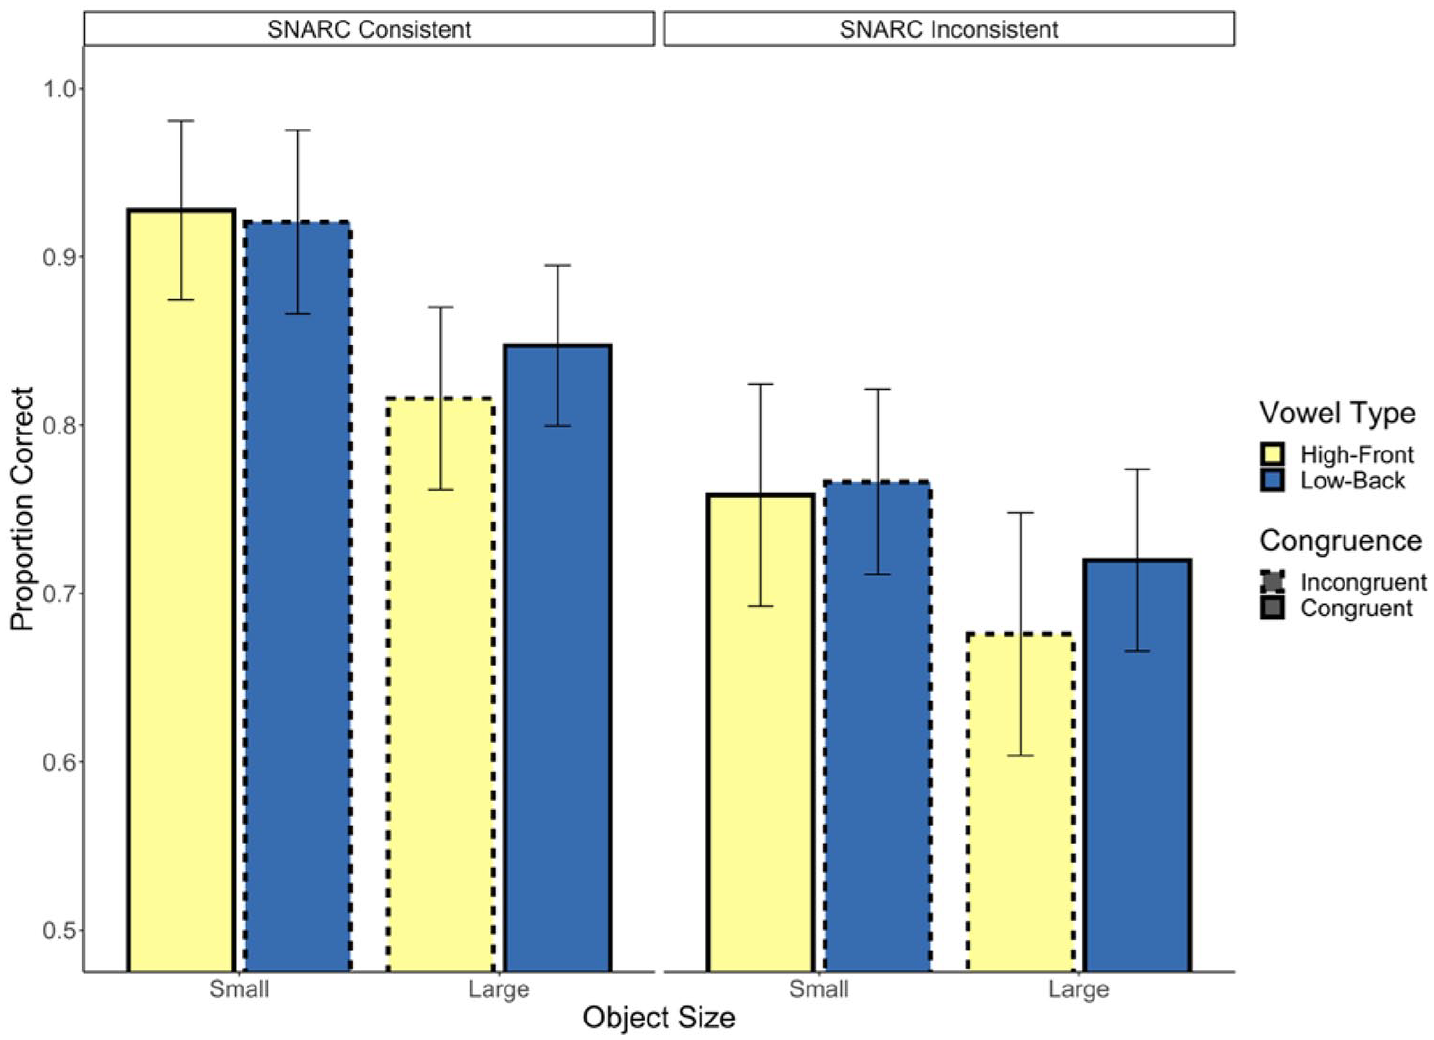
Experiment 1 response accuracy.
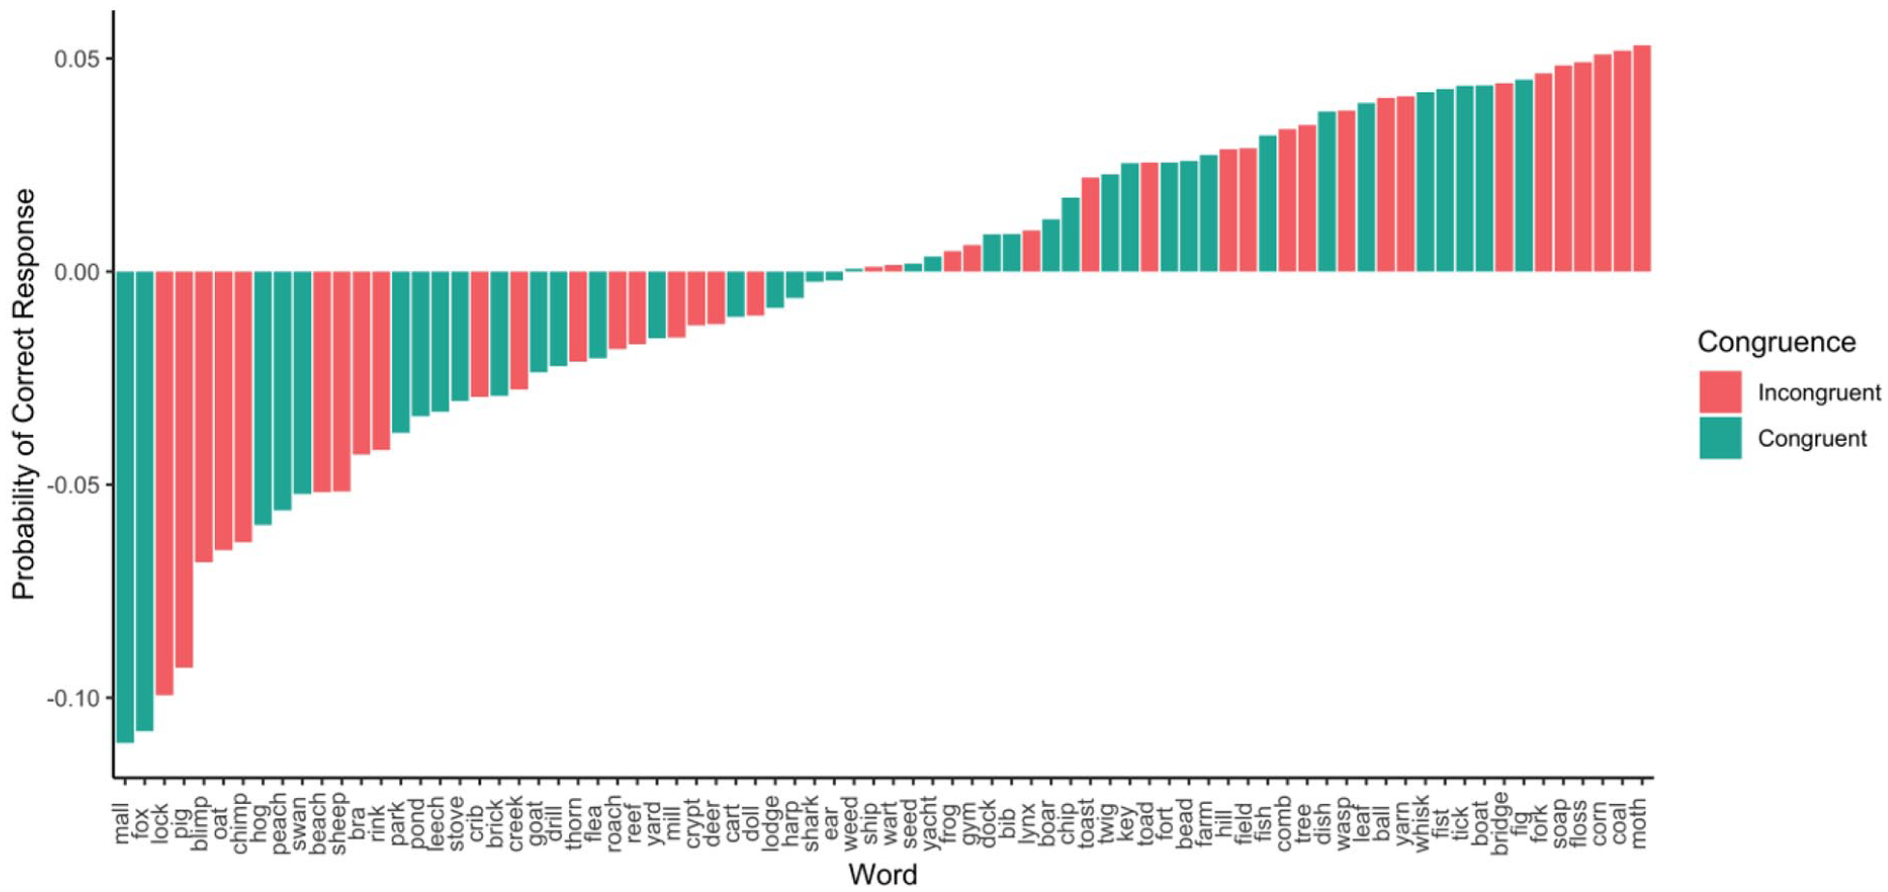
Average response accuracy by word in Experiment 1.
Finally, in a series of supplemental analyses, we examined whether congruence based on other predictors might predict response accuracy. Vowel length congruence was not a significant predictor (b = 0.15, p = .45, 95% CI = [−0.24, 0.54]). In two separate analyses, we also found that the interaction between number of phonemes and object size was not a significant predictor (b = −0.16, p = .39, 95% CI = [−0.54, 0.22]), nor was the interaction between onset consonant size association and object size (b = 0.19, p = .30, 95% CI = [−0.18, 0.56]).
Discussion
We did not observe any evidence that nouns with sound symbolically congruent vowels are processed faster or more accurately than incongruent nouns. This was true for both large and small objects, and for participants in both the SNARC consistent and inconsistent conditions.
Experiment 2
In Experiment 2, we used visual stimuli to avoid complications arising from auditory stimuli with different lengths and uniqueness points.
Method
Participants
Participants were 44 undergraduate students at the University of Calgary who participated in exchange for course credit. All participants reported English fluency and normal or corrected-to-normal vision.
Materials and procedure
The materials and procedure were identical to Experiment 1 with the following exceptions. Word stimuli were presented visually. Each trial began with a fixation cross for 1,000 ms, followed by visual presentation of the stimulus word. Participants made their responses through button press on a response box. Given the apparent difficulty participants had with button assignments that were inconsistent with the SNARC effect, the left button always indicated small, while the right button always indicated large. Their response triggered a 500-ms blank screen, after which the next trial began.
Results
The data were analysed in the same manner as in Experiment 1.
Reaction time
In the analysis of reaction times, inaccurate trials (7.53%) were removed. The rest of the data were cleaned in the same manner as described for Experiment 1 (3.81% of trials were removed). This left a total of 3,131 trials in the analysis.
Analyses were the same as those in Experiment 1 except that the control variables were log subtitle frequency, orthographic Levensthein distance (Yarkoni et al., 2008), letter length, concreteness (Brysbaert et al., 2014) imageability (Cortese et al., 2014), size extremity, vowel length, syllable structure, onset consonant, and second consonant size association. Our predictor of interest was congruence. The resulting model suggested that congruency had no effect on reaction time (b = 0.02, p = .22, 95% CI = [−0.01, 0.06]) (see Table 4). We explored this further with the same Bayesian analysis as in Experiment 1 and found that 66.25% of the HDI for congruency fell within the ROPE.
Resulting linear mixed-effects model predicting reaction time in Experiment 2.
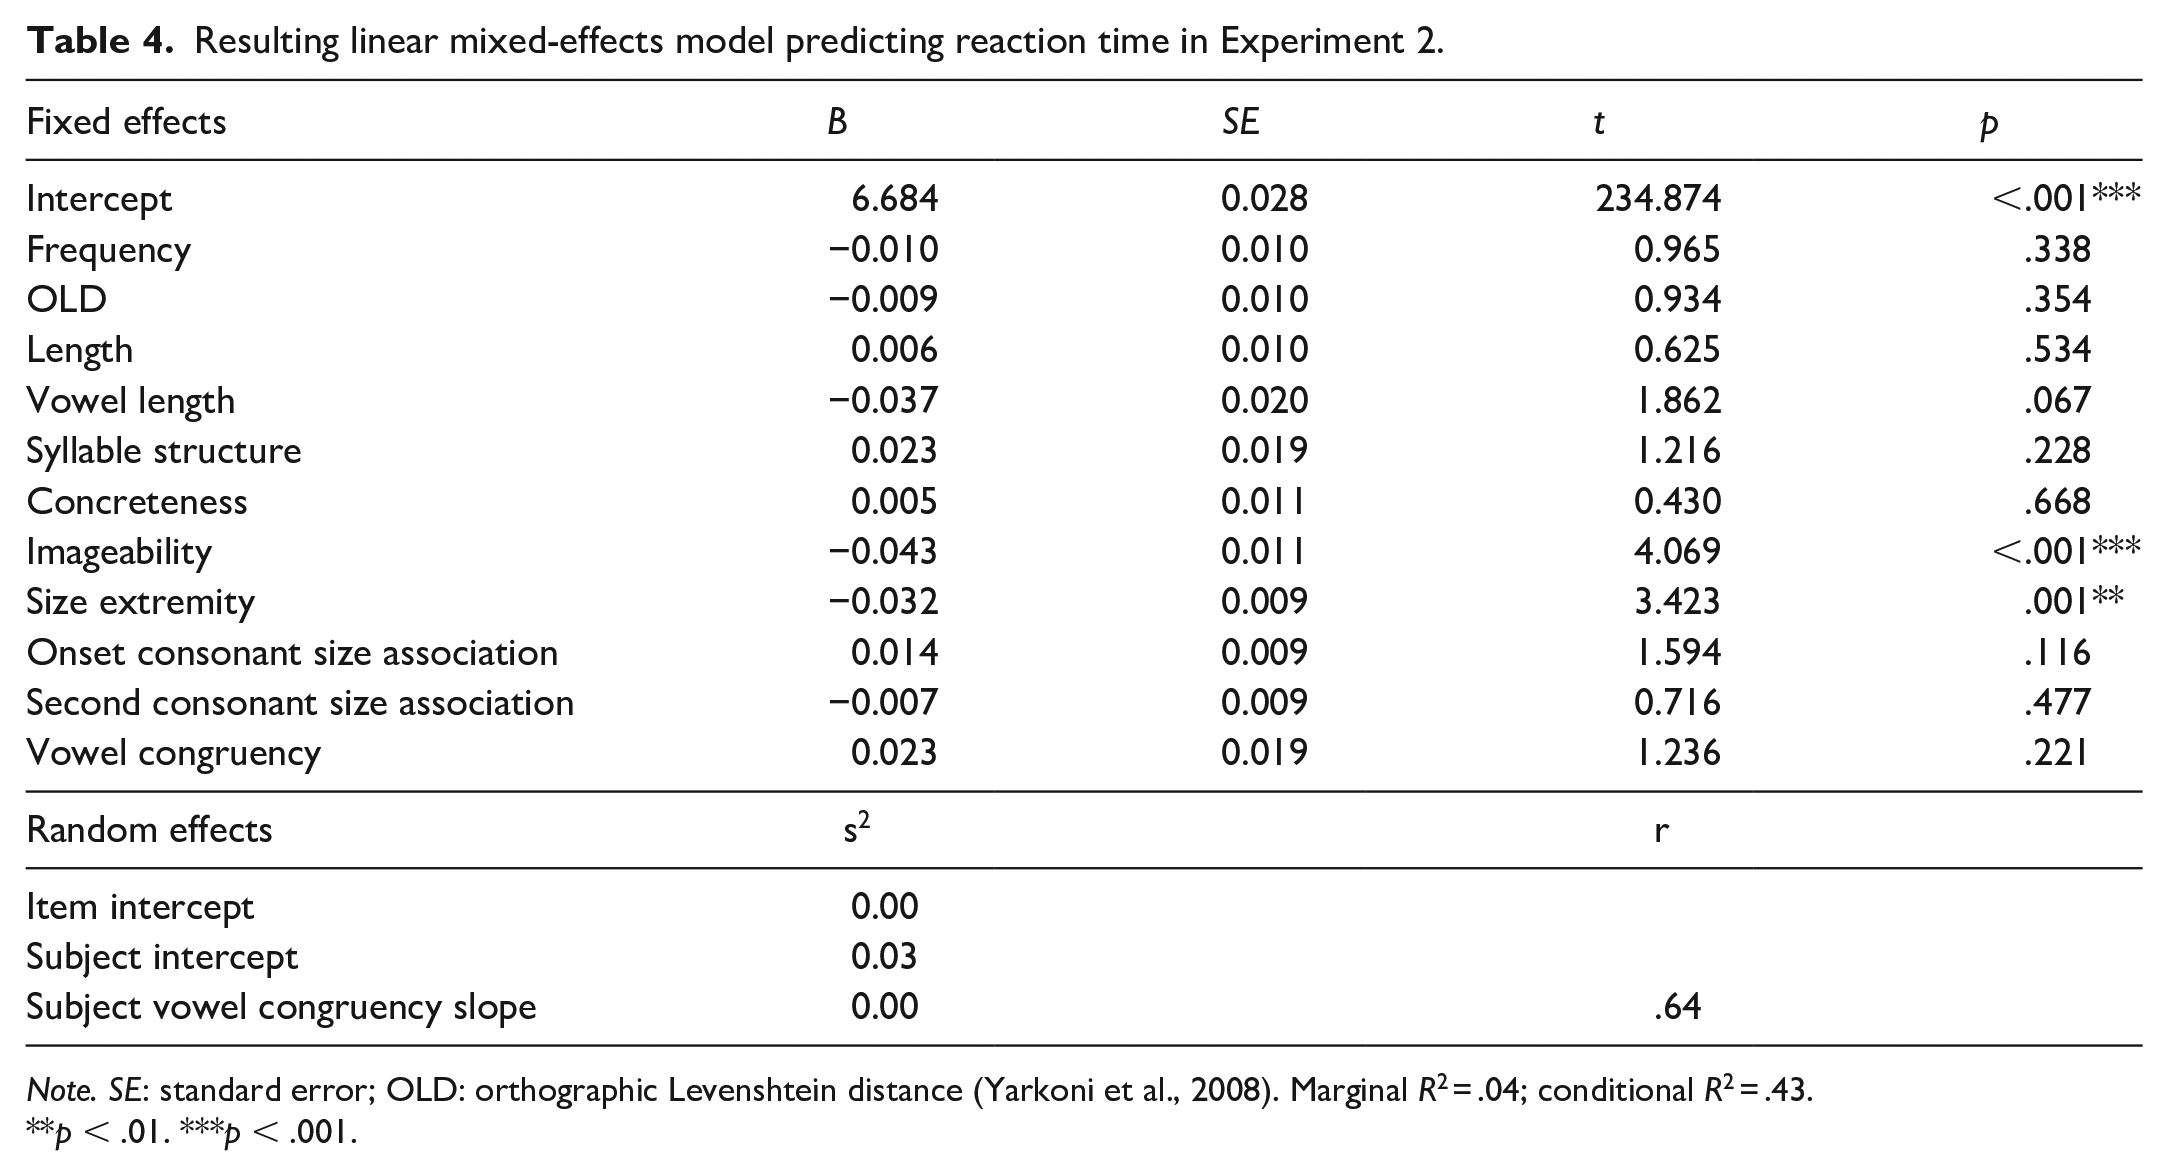
Note. SE: standard error; OLD: orthographic Levenshtein distance (Yarkoni et al., 2008). Marginal R2 = .04; conditional R2 = .43.
p < .01. ***p < .001.
We next included object size and its interaction with congruence as predictors. The interaction was not significant (b = −0.03, p = .48, 95% CI = [−0.12, 0.05]), nor was the effect of congruency (b = 0.02, p = .35, 95% CI = [−0.02, 0.05]). There was a significant effect of object size (b = 0.04, p = .049, 95% CI = [0.00, 0.09]) such that responses were faster to small objects (see Figure 5). In Figure 6, we present the average residualised reaction time for each word, after controlling for all previously mentioned control variables.
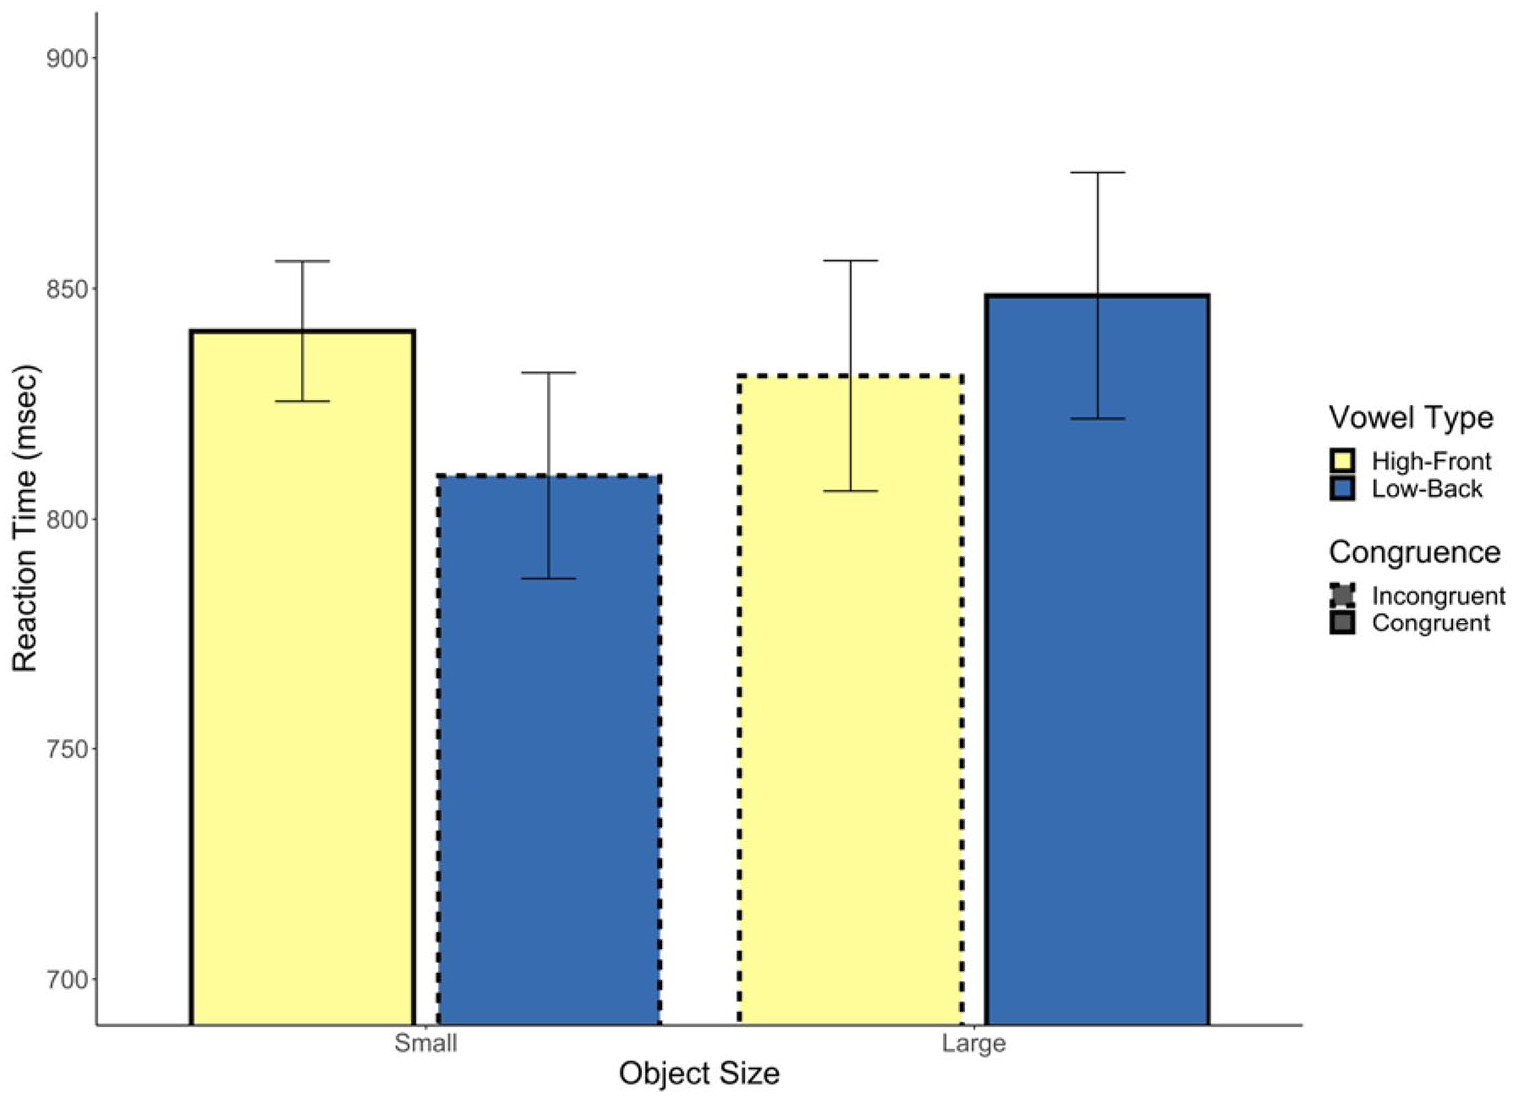
Experiment 2 reaction time.
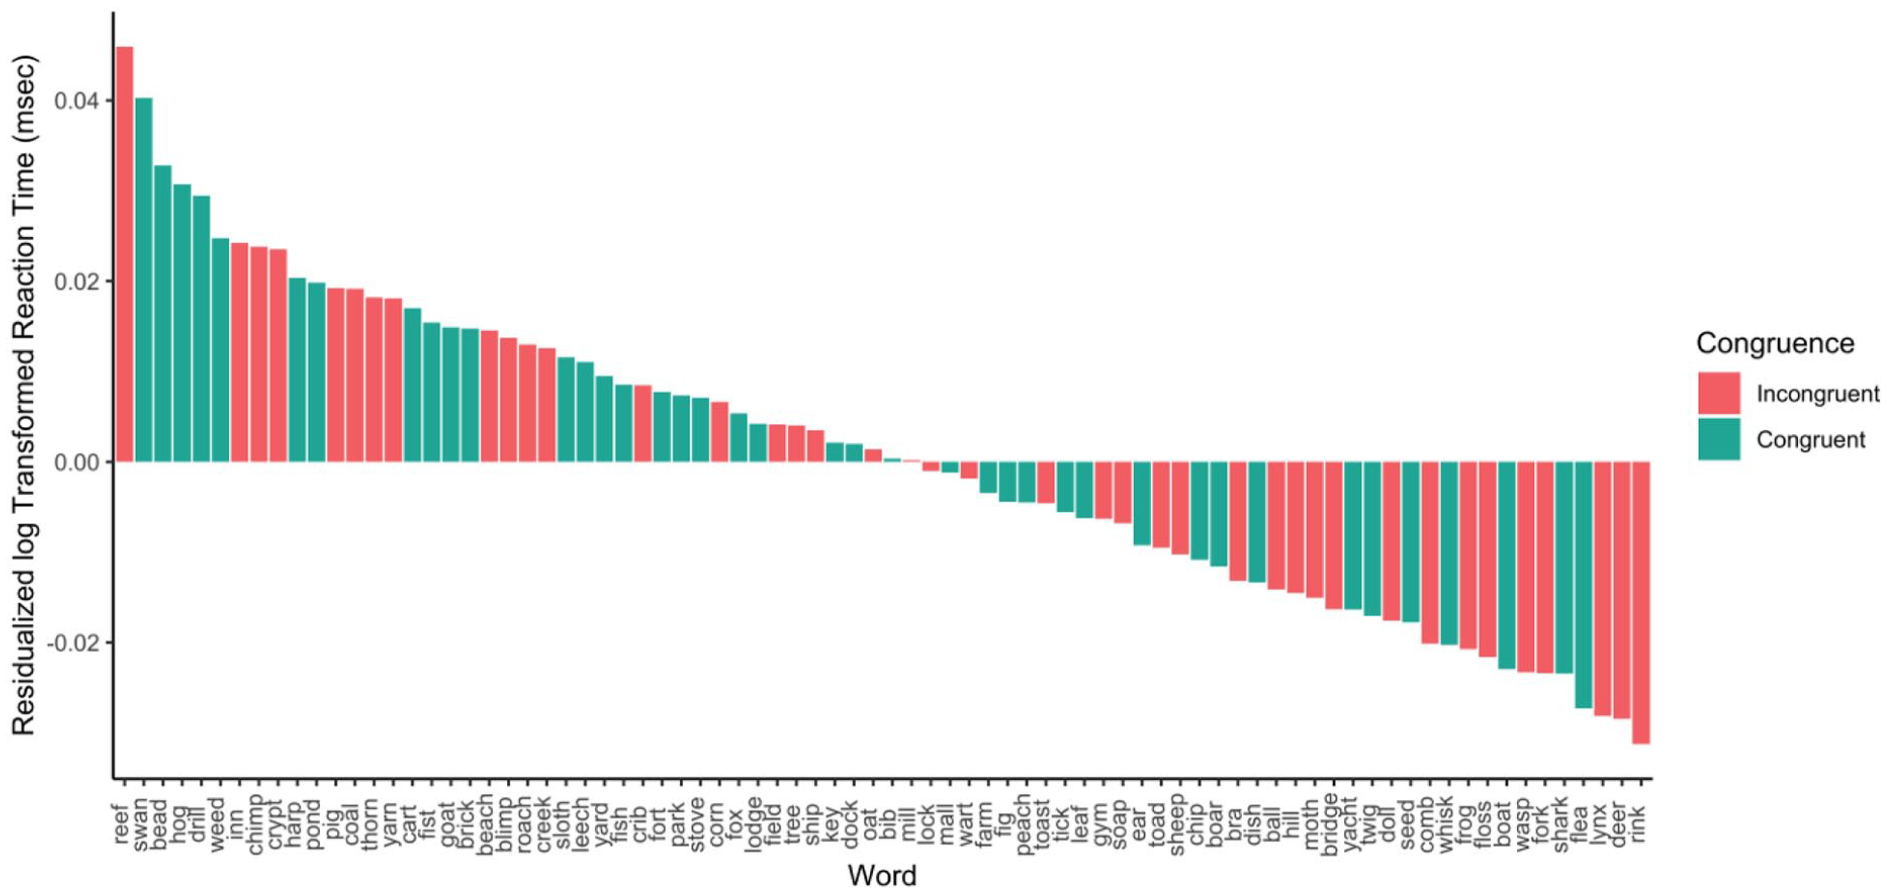
Average residualised reaction time by word in Experiment 2.
Finally, in a series of supplemental analyses, we examined whether congruence based on other predictors might predict reaction time. Vowel length congruence was not a significant predictor (b = 0.03, p = .13, 95% CI = [−0.01, 0.06]). We also found that the interaction between letter length and object size was not a significant predictor (b = −0.02, p = .27, 95% CI = [−0.05, 0.01]). However, there was a significant interaction between the onset consonant association and object size (b = −0.05, p = .01, 95% CI = [−0.08, −0.01]). The nature of this interaction was that words referring to a large object were responded to more quickly if their onset consonant was associated with larger sizes (see Figure 7). We also tested for an interaction between second consonant size association and object size and found a non-significant interaction (b = 0.00, p = .98, 95% CI = [−0.03, 0.03]).
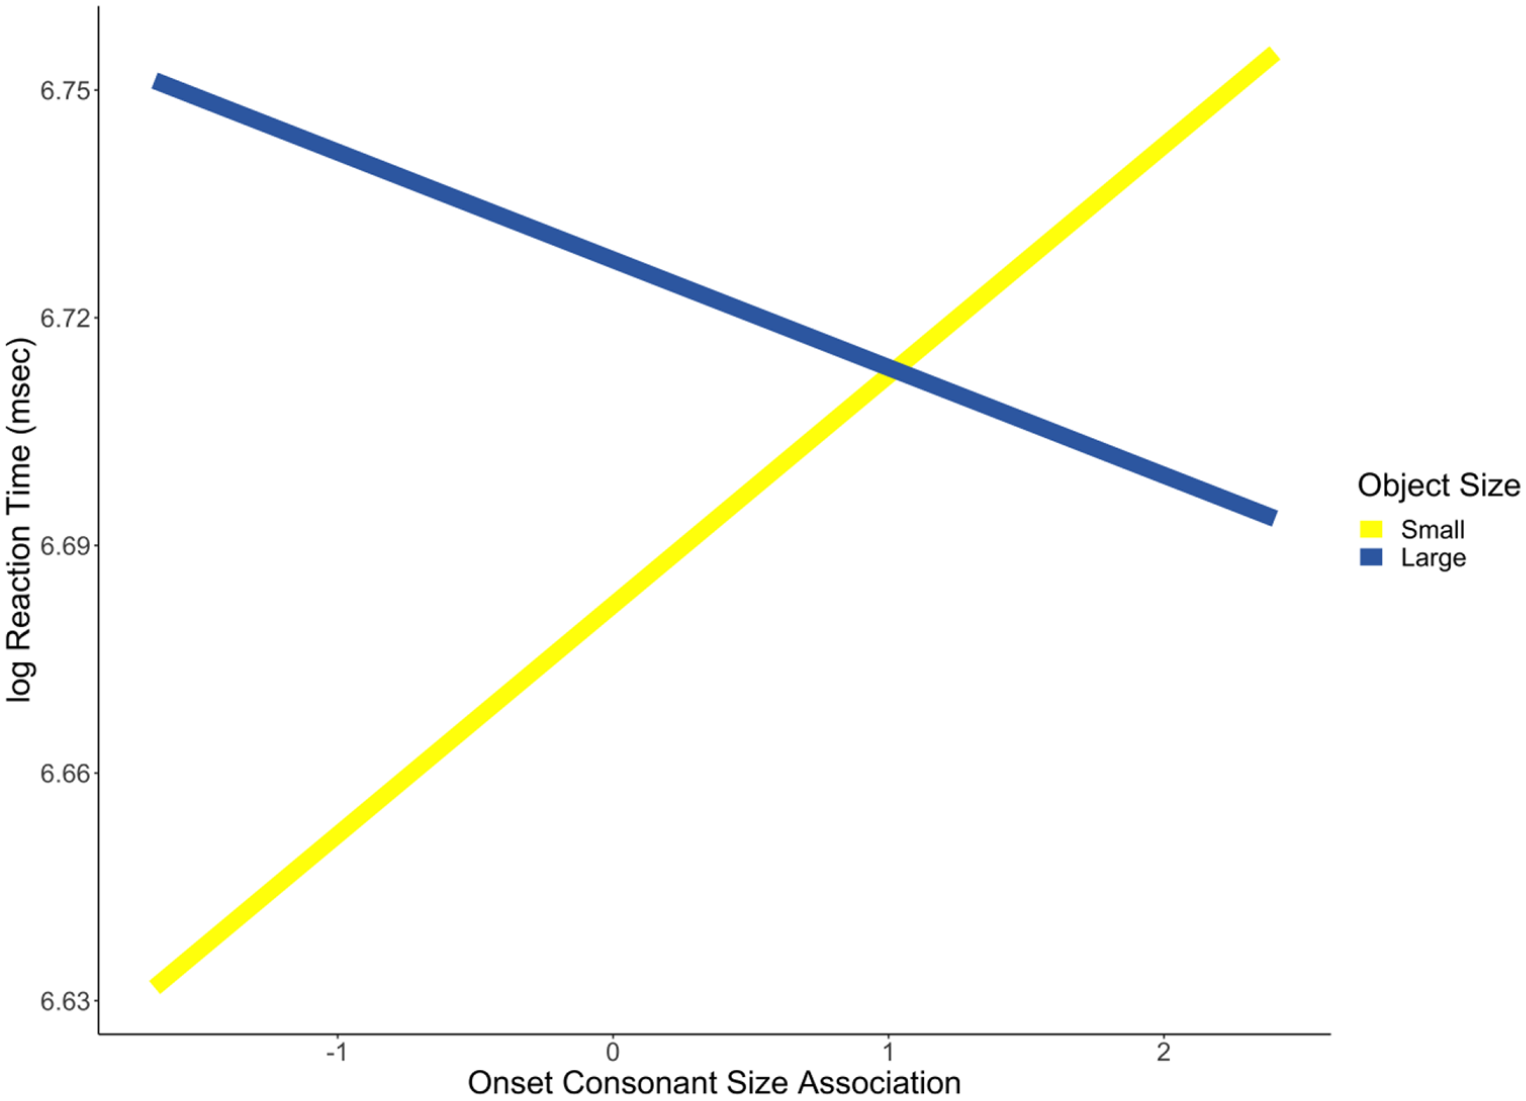
Consonant size × object size interaction.
Accuracy
In the analyses of accuracy, we followed the same process of excluding trials as in the reaction time analysis, except we retained inaccurate trials (3.75% of trials removed). This left a total of 3,388 trials in the analysis. We used a mixed-effects logistic regression to analyse the data. The predictors were the same as in the analysis of reaction time. Our dependent variable was whether or not a given word was responded to correctly. The resulting model suggested that congruency had no effect on accuracy (b = 0.05, p = .86, 95% CI = [−0.48, 0.56]) (see Table 5). We explored this further with the same Bayesian analysis as in Experiment 1 and found that 43.30% of the HDI for congruency fell within the ROPE.
Resulting logistic mixed-effects model predicting response accuracy in Experiment 2.
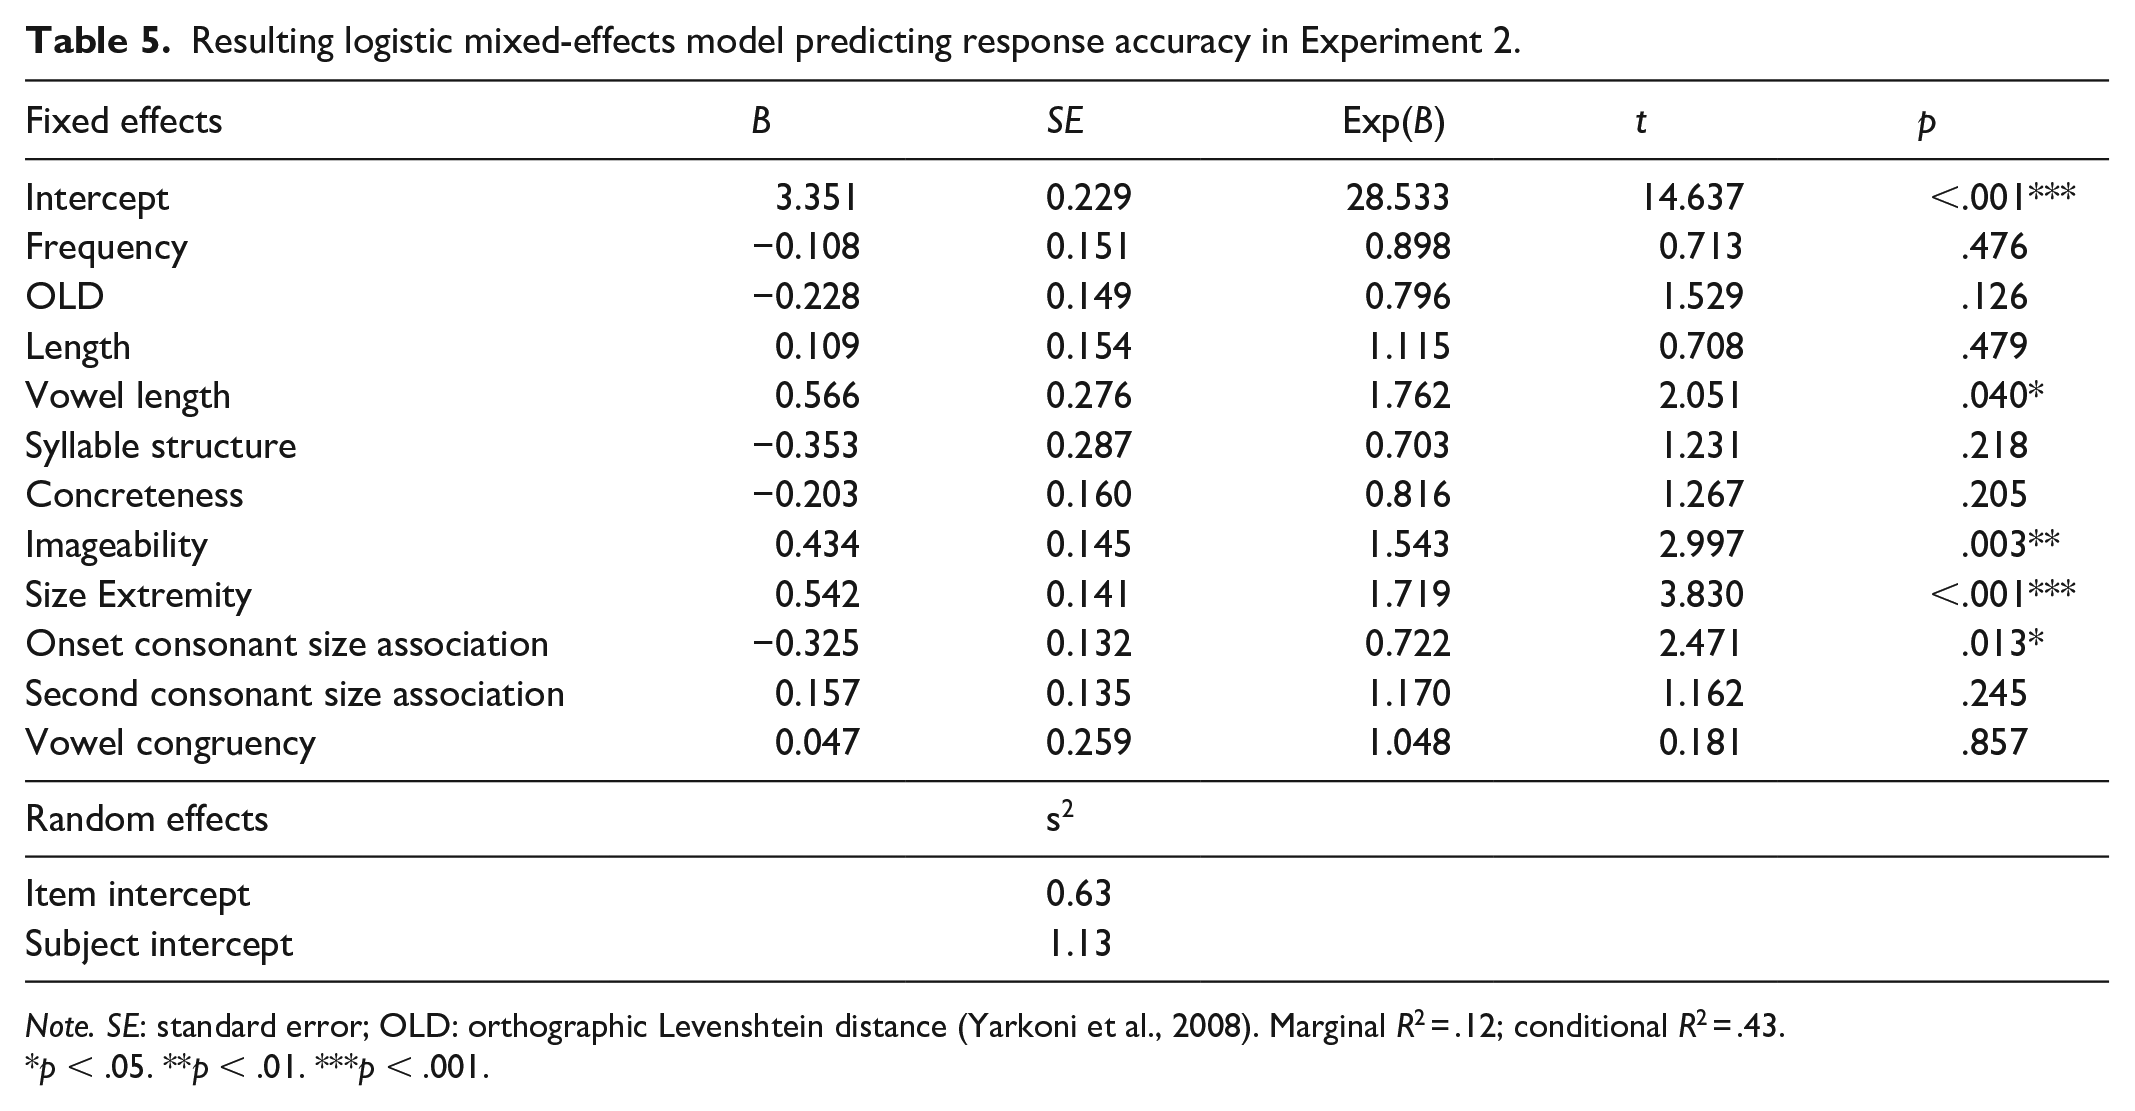
Note. SE: standard error; OLD: orthographic Levenshtein distance (Yarkoni et al., 2008). Marginal R2 = .12; conditional R2 = .43.
p < .05. **p < .01. ***p < .001.
We next computed a model that included object size and its interaction with congruency. The interaction between predictors was not significant (b = 1.11, p = .08, 95% CI = [−0.15, 2.37]) nor was the effect of congruency (b = 0.09, p = .69, 95% CI = [−0.36, 0.54]). There was, however, a significant effect of object size (b = −1.23, p < .001, 95% CI = [−1.74, −0.76]) such that responses were more accurate to small objects (see Figure 8). In Figure 9, we present the average residualised probability of a correct response for each word, after controlling for all previously mentioned control variables.
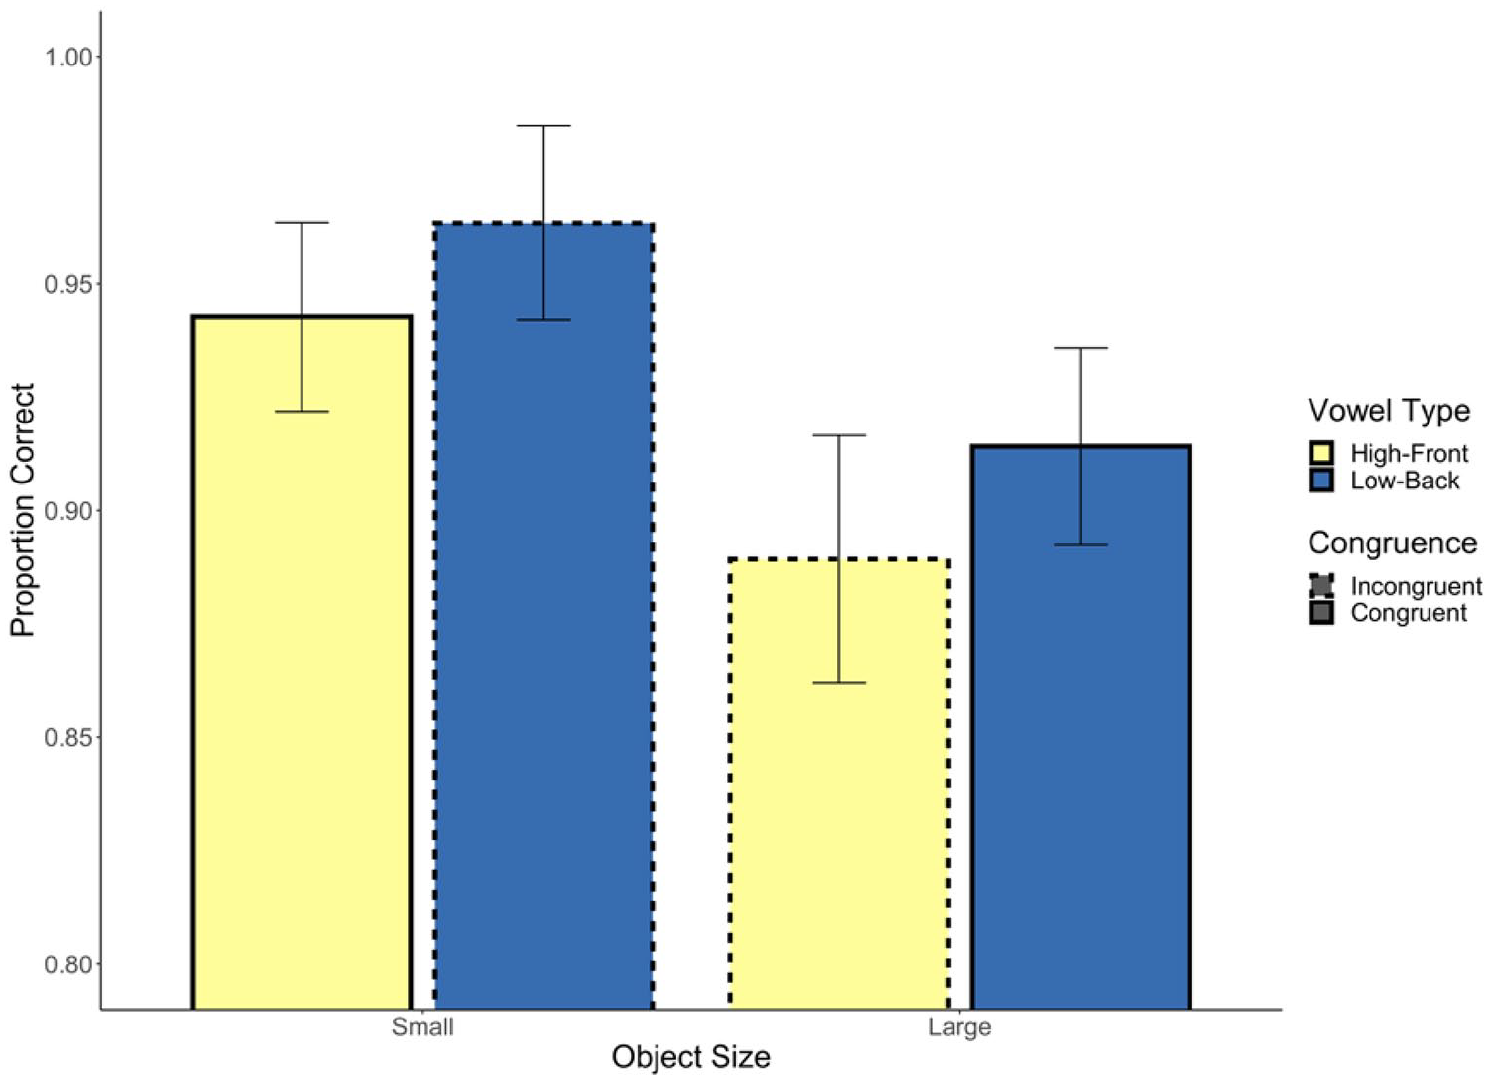
Experiment 2 response accuracy.
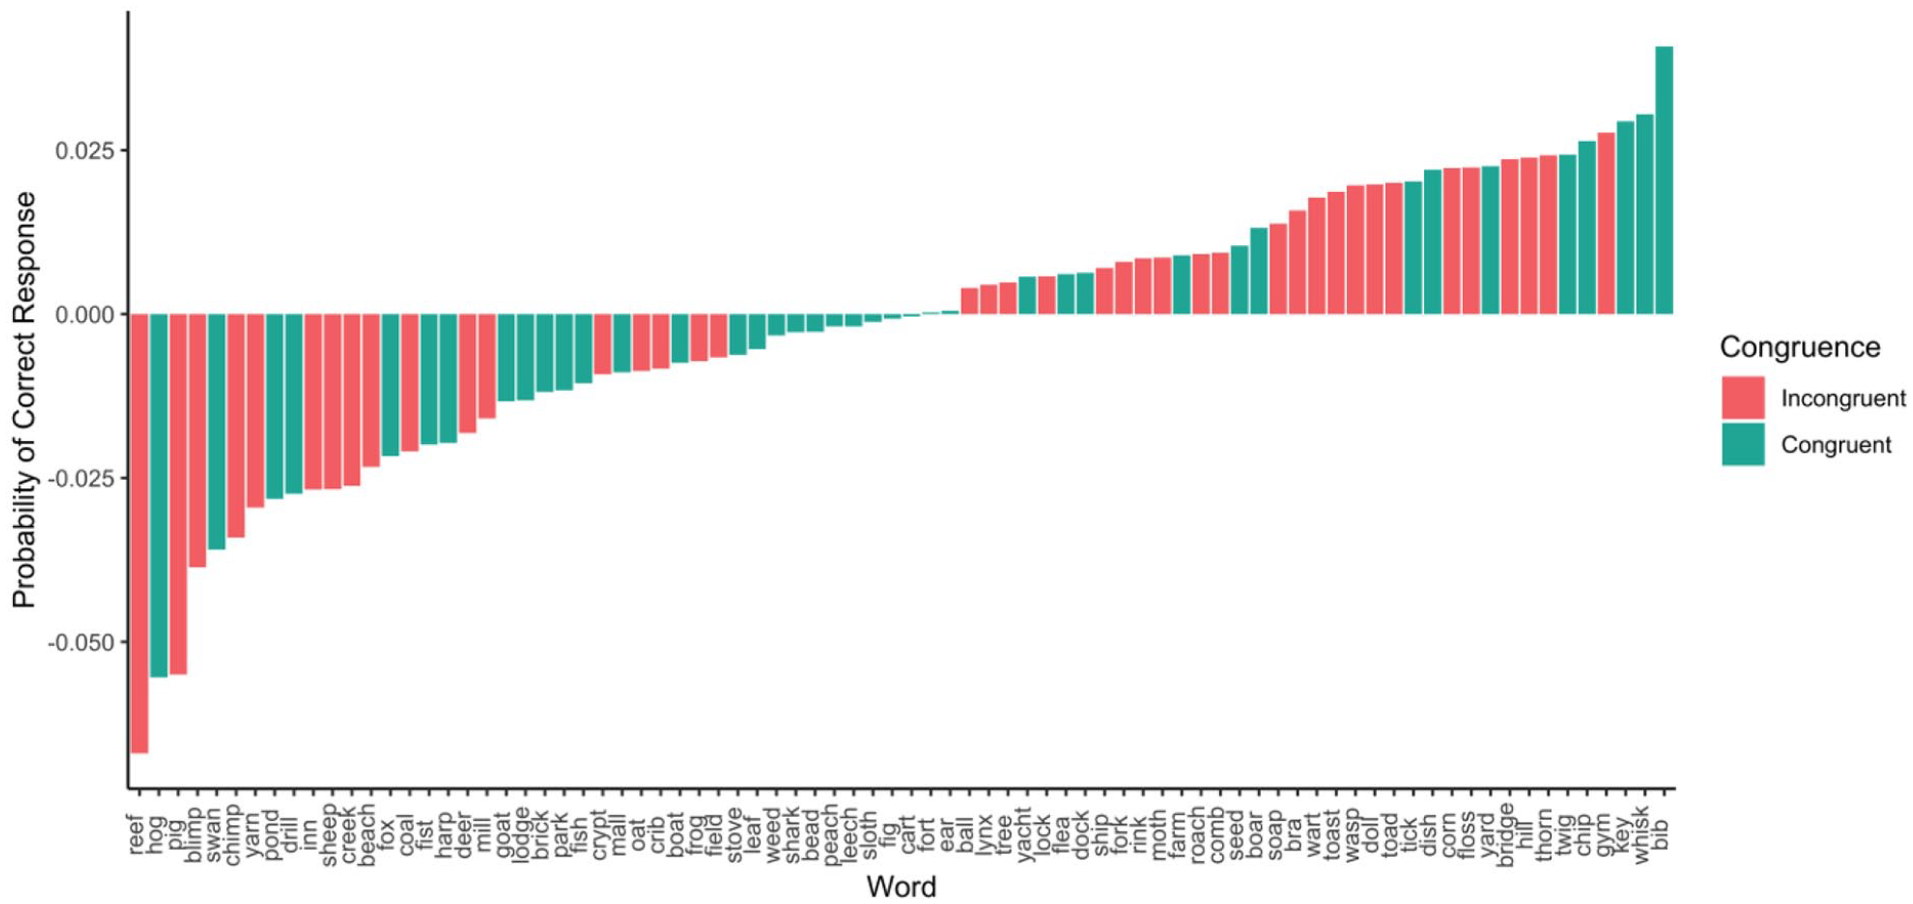
Average response accuracy by word in Experiment 2.
Finally, in a series of supplemental analyses, we examined whether congruence based on other predictors might predict response accuracy. Vowel length congruence was not a significant predictor (b = −0.47, p = .07, 95% CI = [−1.00, 0.05]). We found that the interaction between letter length and object size was not a significant predictor (b = 0.13, p = .60, 95% CI = [−0.38, 0.63]), nor was the interaction between onset consonant association and object size (b = 0.36, p = .15, 95% CI = [−0.14, 0.85]).
Combined reaction time analysis
To quantify the overall evidence in favour of the null hypothesis, we conducted a final analysis combining the data from Experiments 1 and 2. The dependent variable was log corrected reaction time. Note that here we measured reaction time in Experiment 1 from each word’s uniqueness point. In addition to congruency, this analysis included log subtitle frequency (Brysbaert & New, 2009), orthographic and phonological Levenshtein distance (Yarkoni et al., 2008), letter length, number of phonemes, concreteness (Brysbaert et al., 2014), imageability (Cortese et al., 2014), size extremity (defined as the absolute distance from mean size of all words), vowel length, consonant size association for onset and second consonants, and study, as control variables. The analysis also included an uncorrelated random item slope for study. This analysis found that 93.40% of the HDI for congruency fell within the ROPE.
Discussion
As in Experiment 1, we did not observe any evidence that nouns with sound symbolically congruent vowels are processed faster or more accurately than incongruent nouns. However, we did find evidence of onset consonant size association facilitating response times for objects with a congruent size.
General discussion
Previous work has shown that nonwords containing high-front vowels are more likely to be paired with small shapes, while those with low-back vowels are more likely to be paired with large shapes (Sapir, 1929; Thompson & Estes, 2011), an effect known as (size) sound symbolism. There has also been some evidence that responses on reaction time tasks are faster when shapes are paired with congruent versus incongruent nonwords (Ohtake & Haryu, 2013; Parise & Spence, 2012). These findings have been taken as evidence for implicit associations that can affect responses. However, there has been little evidence that sound symbolism affects the processing of real word stimuli. In two experiments, we examined whether participants would be faster to categorise a word for a small (large) object if it contained a vowel associated with smallness (largeness). We did not find any evidence of such an effect, whether stimuli were presented auditorily (Experiment 1) or visually (Experiment 2). A Bayesian ROPE analysis found that 83.41%, 66.25%, and 93.40% of coefficient estimates for the effect of congruency on reaction time fell within the ROPE, for Experiments 1, 2, and a combination, respectively. A much smaller percentage fell within the ROPE for response accuracy. Although we found null effects of congruency in our categorisation task, other effects did emerge, namely the SNARC-type congruency effect. This suggests that the task was sensitive enough to detect other implicit effects.
While the main focus of these experiments was on vowel sound symbolism, we did observe a congruency effect between onset consonant size association and size judgements in reaction time in Experiment 2. One interpretation of this is that there may be stronger effects for consonant—as opposed to vowel—sound symbolism in the processing of real words (for evidence of this in a nonword study on shape sound symbolism, see Ozturk et al., 2013). Perhaps, consonants are more perceptually salient (e.g., Berent & Perfetti, 1995) and thus more likely to affect processing. It is also worth noting that onset consonant size association was a significant predictor of object size (see Footnote 2), potentially suggesting that this association is present in English. However, with regard to the reaction time effect in Experiment 2, it is important to note that consonant size association was included in analyses as a control variable, and items were not well balanced on this variable. Indeed, words referring to larger objects tended to contain onset consonants with larger size associations, t(76.69) = 2.14, p = .04. Thus, we are hesitant to make conclusions before this is replicated with an item set that is better designed to examine this effect (i.e., with consonant size association and object size manipulated orthogonally). In the remaining discussion, we focus on the null result with regard to vowel sound symbolism.
In the Introduction, we hypothesised two mechanisms by which sound symbolically congruent words might be processed faster. One idea was that phonemes might evoke associations of small or large and that these could then facilitate a SMALL or LARGE response. A similar mechanism has been proposed for reaction time effects in studies of crossmodal correspondences. For instance, some of these tasks employ a speeded categorisation of perceptual stimuli based on a certain dimension (e.g., small vs. large), while an irrelevant stimulus is presented (e.g., a high vs. low tone). Participants are faster to respond on trials including a congruent (e.g., small-high) versus incongruent pairing (e.g., small-low; Gallace & Spence, 2006). One way of conceptualising this is that the irrelevant stimulus lowers the criterion for making a congruent response (see Marks, 2004). We did not observe any evidence of a similar process taking place here.
Researchers have speculated that real words might be processed differently than nonwords, in a way that might diminish effects of sound symbolism for real words (see Westbury, 2005). The present results are consistent with this perspective. It may be that when individuals process nonwords (i.e., linguistic stimuli without semantics), the associations evoked by the nonwords’ phonology are more salient. Note that the previously referenced studies of crossmodal correspondences involve the categorisation of perceptual rather than linguistic stimuli. It could be that nonwords are processed in a way that is more consistent with perceptual stimuli (e.g., based on their pitch). In addition, perhaps when a word with existing semantics is processed, and its phonology is used to retrieve those semantics, the word’s phonology does not activate sound symbolically associated properties (e.g., size).
The results we observed stand somewhat in contrast to those of a study by Aryani and Jacobs (2018) which found that exciting (calming) words containing phonemes previously rated as exciting (calming) were categorised faster. Presumably, this effect originated from the sounds of phonemes activating feelings of excitement/calm. An important difference may be that exciting/calming phonemes capitalise on fundamental aspects of human communication (see Aryani et al., 2018). That is, these sounds may be inherently exciting/calming because of evolved associations to certain kinds of acoustic properties. Thus, exciting/calming phonemes might directly result in feelings of excitement/calm through a different process than that by which the phonemes studied here evoke associations of size. Perhaps emotion sound symbolism is in an ideal position to affect the processing of real language for this reason.
Another possibility we raised was that crossmodally iconic words (e.g., flea) could have special links between sound and meaning that facilitate their retrieval. This is the mechanism that has been proposed for the faster processing of onomatopoeia (see Meteyard et al., 2015; Sidhu et al., 2019). There was no evidence in this study that the links between sound and meaning for flea and wasp are different in a way that would facilitate the processing of one versus the other. A key difference may be that onomatopoeia directly imitate their meanings, while the stimuli used here resemble their meanings indirectly, through sound symbolic associations. Another difference is that in onomatopoeia, the sounds of words resemble the whole meaning of the word. In the case of indirectly iconic words, the sounds of words resemble (via association) one feature of the word’s meaning. This might also lead to the expectation of attenuated effects.
In addition, onomatopoeia (and ideophones more broadly) are phonologically and syntactically marked (Dingemanse, 2018). It has been theorised that this markedness might invite participants to interpret the words as performances or depictions of sensory events (see Dingemanse, 2012). This might be a key difference in comparison with the nouns studied here: they are not marked in such a way that invites individuals to interpret them as depictions, an interpretation which may have highlighted their sound symbolic associations.
While the present results show no evidence of vowel sound symbolism affecting real language processing on a reaction time task, they do not rule this out under other conditions or tasks. In fact, it is worth noting that while some sound symbolism studies have found reaction time effects with nonwords (e.g., Ohtake & Haryu, 2013; Parise & Spence, 2012), others have not (e.g., Sidhu & Pexman, 2015; Westbury, 2018). It may be that sound symbolism could have an effect on the processing of real words on slower paced tasks, in which participants have more of an opportunity (or are more motivated) to consider the sound of a word. Indeed, there has been work on the effects of sound symbolism in the presumably more motivated experience of reading poetry (e.g., Auracher et al., 2010). There has also been work suggesting the sound symbolic associations of a real first name can have an impact on the personality traits with which it will be associated (Sidhu et al., 2019; Sidhu & Pexman, 2015). It is also notable that the auditory stimuli used here were all read with a flat intonation. There is evidence that prosody can embellish iconicity (Dingemanse et al., 2016). A future study could examine these effects using stimuli spoken in such a way as to emphasise the iconicity of each word’s vowel (e.g., using a higher pitch for high-front vowels). Another possibility could be to use neural or physiological measures to examine effects that may not be detected with behavioural measures.
There are limitations to this study, in particular the restricted set of items. Our stimuli were very homogeneous in that they were all monosyllabic and only contained one of the four vowels. A future study might examine a broader range of syllable structures and vowel phonemes. One could quantify the sound symbolic association of vowels using the same continuous measure that we used here for consonants. 3 In addition, we did not consider effects of coarticulation. That is, we modelled the effects of consonants and vowels separately. A future study could quantify size associations at the level of CV pairs to account for this.
The proliferation of research on sound symbolism over the past decade is evidence that it is fruitful topic of study, capable of providing many insights into the study of language and cognition. As our knowledge of sound symbolism expands, it is natural that we will hit on boundary conditions. The present findings suggest one such condition for vowel sound symbolism. Characterising these helps us gain a clearer picture of the phenomenon.
Footnotes
Acknowledgements
The authors thank Bryan van Delft for providing audio recordings and Natalia Czarnecki, Courtney Miller, and Morgan Teskey for running the experiments.
Declaration of conflicting interests
The author(s) declared no potential conflicts of interest with respect to the research, authorship, and/or publication of this article.
Funding
The author(s) disclosed receipt of the following financial support for the research, authorship, and/or publication of this article: This research was supported by the Natural Sciences and Engineering Research Council of Canada (NSERC) through a Discovery Grant to P.M.P. (RGPIN 217309-2013), and a Graduate Scholarship to D.M.S. (CGSD3 476111 2015). It was also supported by Alberta Innovates Health Solutions (AIHS) through a Graduate Scholarship to D.M.S. (201500125-1 CA# 3874).