
Abstract
This study aims to improve understanding of how distracting information and target task demands influence the strength of gaze and non-biological (arrow and moving line) cuing effects. Using known non-predictive central cues, we manipulated the degree of distraction from additional information presented on the other side of the target, and target task difficulty. In Experiment 1, we used the traditional unilateral cuing task, where participants state the location of an asterisk and the non-target location is empty (no distraction). Experiment 2 comprised a harder localisation task (which side contains an embedded oddball item) and presented distracting target-related information on the other side. In Experiment 3, we used a discrimination task (upright or inverted embedded T) with distracter information that was unrelated or related to the target (low vs. high distraction, respectively). We found that the magnitude of cuing scaled with the degree of combined distraction and task demands, increasing up to six-fold from Experiments 1 and 2 to the high-distraction condition in Experiment 3. Thus, depleting attentional resources in this manner appears to weaken the ability to ignore uninformative directional cues. Findings are discussed within the framework of a resource-limited account of cue inhibition.
Introduction
The ability to guide another individual’s attention is a vital aspect of human communication, allowing us to convey information about what is important in the environment with ease. This communication can be achieved directly through biological social signals such as eye gaze, as well as indirectly via symbolic and learned cues such as arrows or words. In addition to being effective at transmitting signals of communication, humans are sensitive to receiving these signals and respond quickly and efficiently to them. Sensitivity to directional eye gaze emerges from birth (Farroni et al., 2002), while response to arrow signals is learned by the time a child is about 30 months old (Jakobsen et al., 2013, Experiment 1). These simple communicative signals appear to be processed rapidly, guiding attention faster than they can be consciously processed (e.g., Frischen et al., 2007; Hommel et al., 2001).
How spatial attention is guided by these biological and non-biological directional signals has been the focus of extensive research. In traditional studies, participants locate, detect, or discriminate a unilaterally displayed target while a centrally presented non-predictive communicative cue (usually gaze or arrow) indicates a potential target location with 50% validity. Despite the cue’s uninformative nature, results show faster reaction times (RTs) for localisation, detection, and discrimination of items which appear in the validly cued location compared with the invalidly cued location (Driver et al., 1999; Friesen & Kingstone, 1998; Frischen et al., 2007; Tipples, 2002), known as the “cuing effect.” These gaze and arrow cuing effects are found to be reliably sustained across cue–target stimulus onset asynchronies (SOAs) of between 100 and 1,440 ms, and because of the cue’s non-predictive nature are considered to reflect an automatic, although not necessarily reflexive, orienting response (Driver et al., 1999; Friesen & Kingstone, 1998; Frischen et al., 2007; Hommel et al., 2001; McKee et al., 2007; Ristic et al., 2002; Taylor & Klein, 2000; Tipper et al., 2008; Tipples, 2002; Xu & Tanaka, 2015). The timescale of this effect is of particular interest, as the early effects from these centrally presented, endogeneous cues (SOAs up to 300 ms) mirror those of peripheral, exogenous cues (e.g., Posner & Cohen, 1984), and are therefore indicative of rapid, reflexive orienting. Later cuing effects (SOAs greater than 300 ms) indicate that both gaze and arrow direction signals continue to be processed in a more volitional and strategic manner despite the cue’s uninformative nature (e.g., Müller & Rabbitt, 1989).
However, despite the extensive research so far conducted on gaze and arrow cuing, we know very little about how these signals influence attention orienting in a busy everyday environment in which additional information requires attentional resource and can also be distracting. In the lab, cuing tasks predominantly involve unilateral displays where salient target information is presented in only one location to the side of the cue. The other side of the cue remains a blank space. This design, based on the Posner cuing task (Posner, 1980), served a clear purpose in allowing us to understand how attention can be covertly guided by such unambiguous signals without eye movements.
However, an issue has been raised regarding the contribution of attentional capture in the cueing effect from the abrupt onset of the unilateral target, which can act as a bottom-up attentional signal of the type seen in exogenous cuing tasks (e.g., a peripheral flash). While researchers have still found cuing effects in studies where distracter stimuli were presented in the non-target location (Bonmassar et al., 2019; Burra et al., 2017; Hermens, 2017; Hermens & Walker, 2012), how this directly compares with cuing effects under no distraction is of interest. Attentional capture by sudden, unilateral target onset is argued to potentially mask or interfere with attention orienting responses to the central cue itself (Xu & Tanaka, 2015), and there is a question as to what extent cuing effects are driven by the cue or the target, or a combination of both.
To examine the dissociation between cuing effects elicited by sudden target onset and directional cue signal, bilateral displays have been used where distracters are presented in the location unoccupied by the target, and cuing effects in the bilateral display are compared with those elicited by the traditional unilateral display containing no distracters (Friesen et al., 2005; Xu & Tanaka, 2015). While the key aim of these studies was to investigate the influence of sudden onset of the target by adding other information to the scene, they also provide the first insight to the influence of distracting perceptual information on spatial orienting to social and non-biological cues. Friesen et al. (2005) compared the influence of a non-predictive schematic face cue on attention orienting in a traditional unilateral task (target only) with a bilateral task in which a non-target distracter shape was presented on the other side of the cue. They used a go/no-go detection task where participants pressed a key when they saw a pre-defined target shape and witheld a response otherwise. The results showed cuing in both conditions, but critically no difference in cuing magnitude (invalid RTs minus valid RTs) between the two tasks, and no influence of SOA (105, 300, 600, 1,005 ms). They did however find a difference in RTs overall, with participants responding significantly faster in the no-distractor condition, which they conclude is due to the target capturing attention independent of the cue in the no-distractor condition, but not in the distractor condition, thus facilitating participant response. The findings suggest that sudden target onset does not appear to influence the gaze cuing effect, further, adding concurrent distracter information in a bilateral display does not appear to modulate the effect of schematic gaze cues on attention orienting.
In contrast, Xu and Tanaka (2015) did find an effect of distraction on cuing magnitude. They used a discrimination task (participants stated whether the target was a circle vs. square), and compared a traditional unilateral cuing display where the non-target location was left blank with a bilateral paradigm in which a task-irrelevant distracter shape (triangle) was presented in the location opposite to the target. They used a realistic gaze cue and compared this with arrow cues. For both gaze and arrow cues, the cuing effect was signficantly larger in the distracter condition than in the non-distracter condition (this was not significantly modulated by SOA: 0, 105, 300, 600, 1,005 ms). They reasoned that smaller cuing effects in the unilateral, non-distracter task were due to the sudden onset of the target interfering with the directional signal transmitted by the cue, so that the influence of gaze and arrows on attention orienting was weakened. It is worth noting that Xu and Tanaka (2015) used a fairly realistic avatar including the torso and hands, with this person making a head turn to the shape it held in one hand versus the other hand, while the cue Friesen et al. (2005) used was a simple schematic drawing of a face. It is possible that more realistic and contextualised cues may be more sensitive to distraction, but this is unlikely to be the reason for the discrepant findings between studies, as Xu and Tanaka also found the same pattern of results using a simple arrow cue, indicating that the effect was not due to social processes per se.
While the aim of Xu and Tanaka’s (2015) study was to assess the contribution of sudden target onset, and their discussion focuses on this, we might also interpret their distracter effect within an attentional resource and inhibition framework. Attentional resource is limited in capacity, and is required to both select relevant and inhibit irrelevant information in the environment (e.g., Conway & Engle, 1994; Engle et al., 1995; Nakagawa, 1991). Although orienting responses to non-predictive gaze cues (and arrow cues) are thought to be hard to suppress (Frischen et al., 2007; Gabay et al., 2012; Sato et al., 2007; Tipples, 2002), Xu and Tanaka’s findings suggest that there may be variability in the extent to which potent but non-informative directional signals are attended, with this depending on the availability of attentional resource. Given that a non-predictive central cue can be considered an irrelevant distracter in itself, Xu and Tanaka’s enhanced cuing effect in the bilateral distracter condition could be interpreted to reflect poorer inhibition of irrelevant gaze and arrow cues when attentional resources are depleted by the need to filter out other information, namely, the non-target distracter. It is important to note that previous studies have demonstrated that manipulating other elements of the cuing task in gaze cuing studies can modulate the effects of the cue, demonstrating that the effect is influenced by top-down processes. For example, factors such as competition (Ciardo et al., 2015), humaness of the cue (Martini et al., 2015), gender and dominance of the cue (Ohlsen et al., 2013), task goals (Ricciardelli et al., 2013), amount of eye contact (Kompatsiari et al., 2018), cue agency (Wykowska et al., 2014), cue reliability (Wiese et al., 2014) as well as whether the cue can see the target (Morgan et al., 2018; Teufel et al., 2010, although see Cole et al., 2015) have all been found to modulate the cuing effect. However, here we are interested in how the demands of the task itself can influence cuing for both eye gaze and arrow cues.
It must also be noted that other work shows that a concurrent working memory (WM) task (random number generation), also thought to increase task demands, diminishes rather than enhances gaze cuing effects within the traditional unilateral target paradigm (Bobak & Langton, 2015). This indicates that depleting such cognitive resources may weaken the influence of a non-predictive cue, and does not align with an attentional resource account per se. But others have found no impact of concurrent WM load on gaze cuing (Law et al., 2010) using verbal and visuo-spatial tasks; see also Hayward and Ristic (2013) for use of predictive and counter-predictive cues. Furthermore, gaze cuing magnitude has been shown to be unaffected by increased perceptual load within the target task itself (Xu et al., 2011). We therefore still understand relatively little about whether or how the availability of attentional resources influences attentional orienting to gaze and other salient spatial cues.
Our current study aims to address the potential efficacy of the attentional resource theory of inhibition in the context of social and non-biological spatial cuing effects, by manipulating the degree of both distraction and task demands. It is particularly important to understand the influence of combined distraction and task demands on sensitivity to gaze and symbolic cues because in day-to-day life important and potentially relevant information is often present in multiple locations simultaeneously, and attentional resources need to be distributed effectively depending on current goals (Ciardo et al., 2015; Perez-Osorio et al., 2015; Teufel et al., 2010; Vogt et al., 2010; Wiese et al., 2012). For example, a child may need to be sensitive to caregiver gaze direction to direct them towards or away from important or salient information/events; a driver needs to select from multiple sources of directional information from road signs. Directional cues can also be used to navigate visually cluttered environments to help focus attention on task-relevant information in the environment, for example, an arrow pointing out the correct exit among many doors and passageways, or a wave from a friend in a crowd. While we have learned a great deal about patterns and mechanisms of gaze and arrow cuing using simple displays containing clear and uncluttered target information, it is valuable to better understand how communicative directional signals guide attention in an environment in which attentional resources are depleted from distracting information and greater task demands.
There may also be varying degrees to which gaze and non-biological cues can be suppressed to attenuate cuing effects that depend on varying degrees of attentional resource availability. For example, ignoring a non-predictive directional cue may be especially difficult when higher target task demands involve deeper levels of processing, such as a shape discrimination task, and thus further deplete attentional resources. There are conflicting findings on this currently. Friesen and Kingstone (1998) found that increasing required levels of processing in the target task (detection > localisation > discrimination) did not modulate the magnitude of gaze cuing effects using a traditional unilateral task (see also Xu et al., 2011). However, recently, Bonmassar et al. (2019) investigated the influence of gaze and arrow cues on saccadic eye movements using a non-target distracter that was closely related to the target in a bilateral task. The target task was to discriminate whether a diamond was missing a section from the top or bottom, and the non-target distracter was a full diamond with no piece missing. Over two experiments, they investigated the influence of non-predictive gaze (realistic, full face) and arrow cues on target responses using a 250 ms and a 750 ms SOA. In Experiment 1, the discrimination task was easy with a large piece being missing from the target diamond, while in Experiment 2, the piece missing was smaller, thus the task was more difficult. They found that the magnitude of the cuing effect was larger in Experiment 2 for both the eye gaze and arrow cues. This somewhat replicates Xu and Tanaka (2015) and indicates that task demands can influence the potency of the cuing effect.
The level of task demands is one possible reason that Xu and Tanaka (2015) provide to explain why they found a distracter effect on cuing using a shape discirmination task while Friesen et al. (2005) did not find an effect using a go/no-go task. While the go/no-go task requires additional response inhibition, Xu and Tanaka’s task may be cognitively more difficut and require deeper level processing of target identity, the speed of which could be more vulnerable to distraction. In addition, Xu and Tanaka suggested that Friesen et al.’s distracters were not that distracting, and thus easy to ignore, because they blocked distracter/non-distracter conditions which created a predictable trial event. In contrast, Xu and Tanaka randomised distracter and non-distracter trials, which they suggest could have increased the salience of distracters when they appeared unpredictably and thus made them more distracting. However, note that in Bonmassar et al. (2019), the easy versus difficult discrimination tasks were presented across separate experiments, therefore, the key element is likely to be task difficulty rather than predictability.
In the current study, we manipulated the degree of target task demands and the degree of perceptual distraction across three experiments, using non-predictive gaze and non-biological (arrow, moving line) cues to also examine whether any effects are socially specific. Experiments 1 and 2 comprised a target localisation task that was either simple or intermediate in difficuly, respectively, while Experiment 3 comprised a higher-level discrimination task. Although Xu and Tanaka’s (2015) study and Friesen et al.’s (2005) study demonstrated how attention might be affected when a task relevant target onset is accompanied by a completely non-relevant distracter in the non-target location, they do not tell us how attention might be affected when both locations contain potentially target-relevant information. Furthermore, while Bonmassar et al. (2019) do shed light on how attention is affected when both locations contain potentially target-relevant information, we do not know how this compares with a situation where the non-target location contains a non-relevant distracter. Therefore, across three experiments, we not only manipulated whether distracting information was absent or present, but we also varied the relative perceptual overlap between the target and distracter information.
In Experiment 1, we tested the influence of gaze, arrow, and moving line cues on attention orienting in a traditional unilateral cuing task, where participants had to localise a target asterisk. This allowed us to understand the cues’ basic orienting effects in the absence of distraction across five SOAs (150, 300, 500, 750, and 1,000 ms). In Experiment 2, we created a novel bilateral oddball task. Here participants were required to locate (left/right) a single oddball upright or inverted target T shape that was embedded in an array of three differently oriented uniform Ts. On the other side of the cue, there was a distracter which comprised four upright or inverted Ts in the same orientation (no oddball). Again, we used the five SOAs used in Experiment 1, and all three cues were tested. In this bilateral task, all information presented is potentially task-relevant and target-related and should thus afford a greater degree of perceptual distraction. Finally, in Experiment 3, we investigated the influence of gaze and arrow cues at 150 ms SOA and 500 ms SOA in a modified version of the oddball task, where participants stated the orientation of the oddball target T (upright or inverted) rather than localise it. The target was embedded in an array of distractor shapes which looked like the T except that they had the same length line at the top and the bottom, thus resembling capital letter Is to interfere with both upright and inverted T perception. On the distracter side of the display, we presented either a simple grid image (low distractability; no relevance to target display) or an array of I shapes (high distractability; relevant to target display), and manipulated this within-subjects in a blocked design. Furthermore, unlike in Experiments 1 and 2, in this discrimination task, participant response was not lateralised and thus there was no response mapping to cue location.
Under the more attention-demanding target and distracter conditions within Experiments 2 and 3, support for an attentional resource account of spatial cuing would be evidenced in larger cuing effects if inhibiting our reflexive/natural tendency to follow the directional signal of a cue is impaired when attentional resources are depleted. In addition, we used a range of short (150 ms) to long (1,000 ms) SOAs to allow us to assess whether depleting attentional resources renders cuing responses especially difficult to suppress at short SOAs. Gaze cues were compared with arrow cues in all experiments (and to moving line cues in Experiments 1 and 2) to assess whether any effects are specifically social in nature.
Experiment 1—simple localisation task, no distracters
Method
Participants and apparatus
Forty-one undergraduate students (6 males, 35 females, mean age 21 years, range 17–41 years) from the University of Aberdeen participated for course credits. All participants had normal or corrected to normal vision and ethical approval was obtained from the School of Psychology Ethics Committee at the University of Aberdeen. Stimuli were presented using E-prime software version 2.0 (Schneider et al., 2002) on a Dell LCD monitor (32-bit true colour; resolution 1,280 × 1,024 pixels).
Stimuli
All cue stimuli were identical to those used in Gregory and Jackson (2017).
Gaze cue
We selected a set of 12 faces (6 male, 6 female) to use as gaze cues from the Radboud Faces Database (Langner et al., 2010). Each face identity had three photographed natural gaze states—left, right, and direct—were cropped to remove hair, and presented in grayscale to limit variation between the distinct direct and averted gaze images presented. Faces were presented in the centre of the screen and face dimensions were uniform (109 × 151 pixels).
Arrow cue
The arrow cue comprised three different states: a left pointing arrow, a right pointing arrow, and a central line for the initial “direct” presentation (as per Gregory & Jackson, 2017). The central version matched the central line cue stimulus (see below). We took care to design an arrow cue that was relatively symmetrical in nature (see Lambert et al., 2006). The arrow was created by taking the bisecting line from the direct line condition and angling the sections above and below the line 45° to form an arrow. The arrow’s point fell inside the midline, shifted 8 pixels to the left/right depending on the arrow’s direction in order for the core to remain over the midpoint, preserving symmetry. The left and right arrows were the same image transposed.
Moving line cue
The line cue consisted of a horizontal black line 109 pixels in width, with a 5 pixel thickness, bisected by an equally thick black vertical line measuring 31 pixels in height. The vertical line crossed the horizontal line at its midpoint, so that there was as much above as below the line. At the start of a trial, the vertical line crossed the horizontal line at the centre; it then shifted either left or right 18 pixels from the centre point to mimic the magnitude of eye gaze shift in the gaze cue condition. This line is used to assess the influence of lower-level, kinetic directional information devoid of symbolic communicative meaning on attention orienting, and is a useful comparison with dynamic gaze cues in which the eyes change from direct to averted pose. This line cue has been shown to speed target localisation at very short SOAs, but unlike gaze and arrow cues showed little or no effect on attention orienting at longer SOAs (Gregory & Jackson, 2017).
The target was an asterisk (25 × 25 pixels), presented 110 pixels to the left or right of the cue’s edge. All visually presented information appeared inside a boundary of 11.60° of the visual angle (approximately 60 cm viewing distance), within macular vision (18°), and close to paracentral vision (8°). Figure 1 illustrates the three cues within a trial structure.
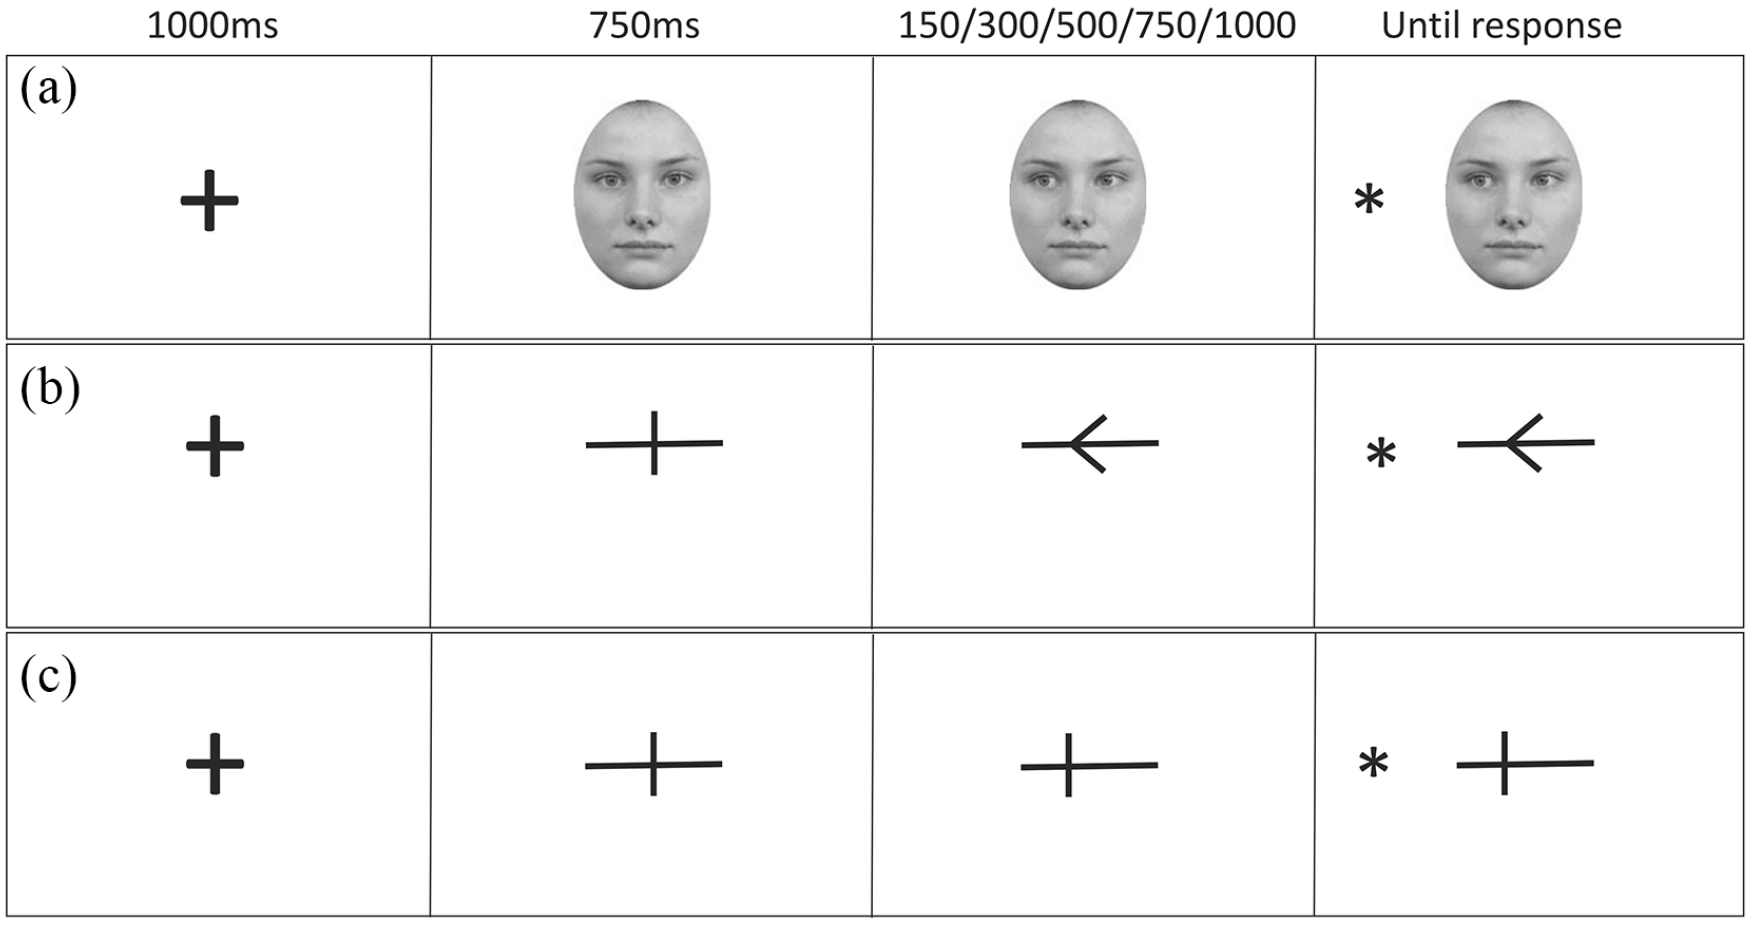
Illustration of the trial procedure and SOA conditions for the three cue conditions: gaze (a), arrow (b), and line (c) All show the validly cued condition.
Design
Within-subjects independent variables were cue type (gaze, arrow, line), SOA (150, 300, 500, 750, 1,000 ms) and cue target validity (50% valid or 50% invalid, pseudorandomised and balanced across each cue type and SOA condition). The experiment therefore had 10 separate conditions per cue type pseudorandomised to present 24 trials per condition. The experiment was separated into three cue type sections, counterbalanced between participants, within which there were three blocks of 80 trials, resulting in 240 trials per cue type. Participants were informed of the cue type before beginning each section and were encouraged to take breaks between blocks and between cue types. The dependent variable was RT to correctly locate the target. To become familiar with the task, a nine-trial practice session preceded the main experiment, demonstrating each cue type to the participant.
Procedure
All cue types were presented using the same procedure. We adopted the parameters of the traditional central cuing paradigm where the cue remains on screen for the entire trial (e.g., Driver et al., 1999; Friesen & Kingstone, 1998). Figure 1 illustrates an example trial sequence for each cue type. A fixation cross was presented at the centre of the screen for 1,000 ms, then replaced by the central form of the cue for 750 ms. This was then replaced by the shifted version of the cue (left or right, counterbalanced) and remained on screen for 150, 300, 500, 750, or 1,000 ms before the target appeared. Participants were informed that the direction of the cue did not predict the location of the target and were instructed to maintain focus in the centre. On valid trials (50%), the target appeared on the side towards which the cue had shifted; on invalid trials (50%), the target appeared on the opposite side. A target was present on all trials. Participants had to state the location of the target as quickly and as accurately as possible using the “Q” key with their left index finger for targets appearing on the left, and the “P” key with their right index finger for targets appearing on the right (response side was counterbalanced, as was correspondence to cued location). The target and the cue remained on screen until a response was made, and there was no response window cut off. The inter-trial interval was 1,000 ms.
Data analysis
Accuracy outliers were determined using the median absolute deviation (MAD; Leys et al., 2013) at the recommended threshold of the median ±2.5 times the MAD. We used MAD in preference to standard deviation (SD) because outliers can adversely skew calculation of SD but not MAD. There were no accuracy outliers present in Experiment 1. We analysed the data from correct trials only, and used median RT data for analysis to remove the need to eliminate RT outliers and control for the positively skewed nature of RTs data (see Jensen, 1992; Ratcliff, 1993).
We conducted the main analyses on cue magnitude values, as this is the simplest and clearest way to assess differences in attention orienting across cue types. Cue magnitude values were computed by subtracting median RTs in the valid condition from median RTs in the invalid condition, thus positive values indicate biased orientation towards the validly versus invalidly cued location, and negative scores indicate biased orientation towards the invalidly versus validly cued location. Cue magnitude values that are not significantly different from zero indicate no cuing effect. We were additionally interested in the polynomial contrasts, looking specifically at the change in cuing magnitude across each SOA for each cue. These can inform us of the meaning of the shape of the cue’s effects, for example, a quadratic trend where the curve is concave (i.e., an inverted U shape) would demonstrate that the cue influenced attention most strongly at the mid-SOAs used and more weakly/had no effect at the shortest and longest SOAs. RTs were also examined to determine any overall speed of orienting differences to gaze, arrow, and line cues. All pairwise comparisons were Bonferroni (Dunn’s) corrected where necessary (for simplicity of reporting, we corrected by multiplying the p value by number of tests, rather than adjusting the alpha value, thus corrected results are considered significant when p < .05).
To allow other researchers to observe which SOAs yielded reliable cuing effects, we also present a full table of results for each SOA showing the cuing magnitude and whether it is significantly larger than 0 at each SOA. Due to this purpose, these tables show results uncorrected for multiple comparisons, although values that remain significant when corrected are marked for clarity. In addition, data from all studies are accessible here: https://osf.io/g62yu/
Results
Everyone performed at or above 95% accuracy (median = 99%); however, one participant lost interest in the task during the face cue section, resulting in the majority of RTs being excessively long (above 1,000 ms, population average in the face condition = 347 ms); thus, this participant was excluded entirely from the analysis. Data from incorrect trials were excluded from the RT analysis (1.4% of data).
Analysis of the raw RT scores demonstrated that median RTs were not significantly different between gaze (340 ms), arrow (341 ms), and line (337 ms) cued stimuli, F(2, 38) = 0.491, p = .616,
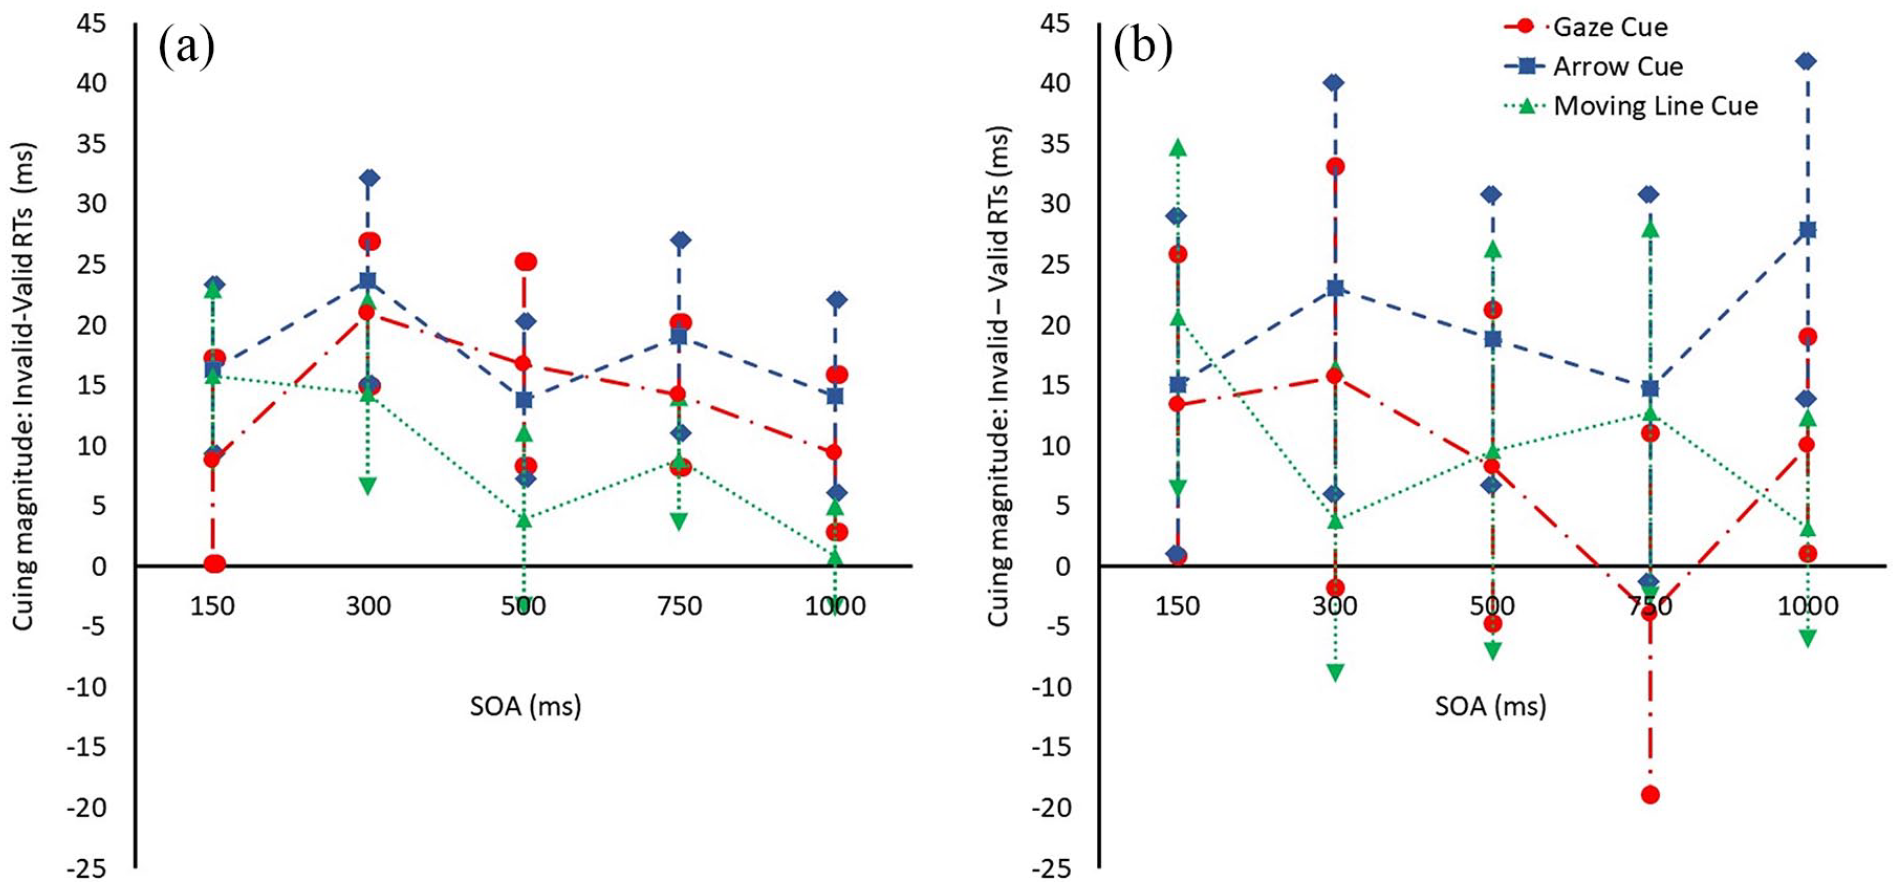
Results from Experiment 1 (a) and Experiment 2 (b). Cuing magnitude at each SOA for the gaze, arrow, and line cue. Positive magnitude means that participants were faster for the valid than the invalid location.
Experiment 1: Simple localisation task, no distracters. One-sample t-test results for each cue at each SOA (df = 39).
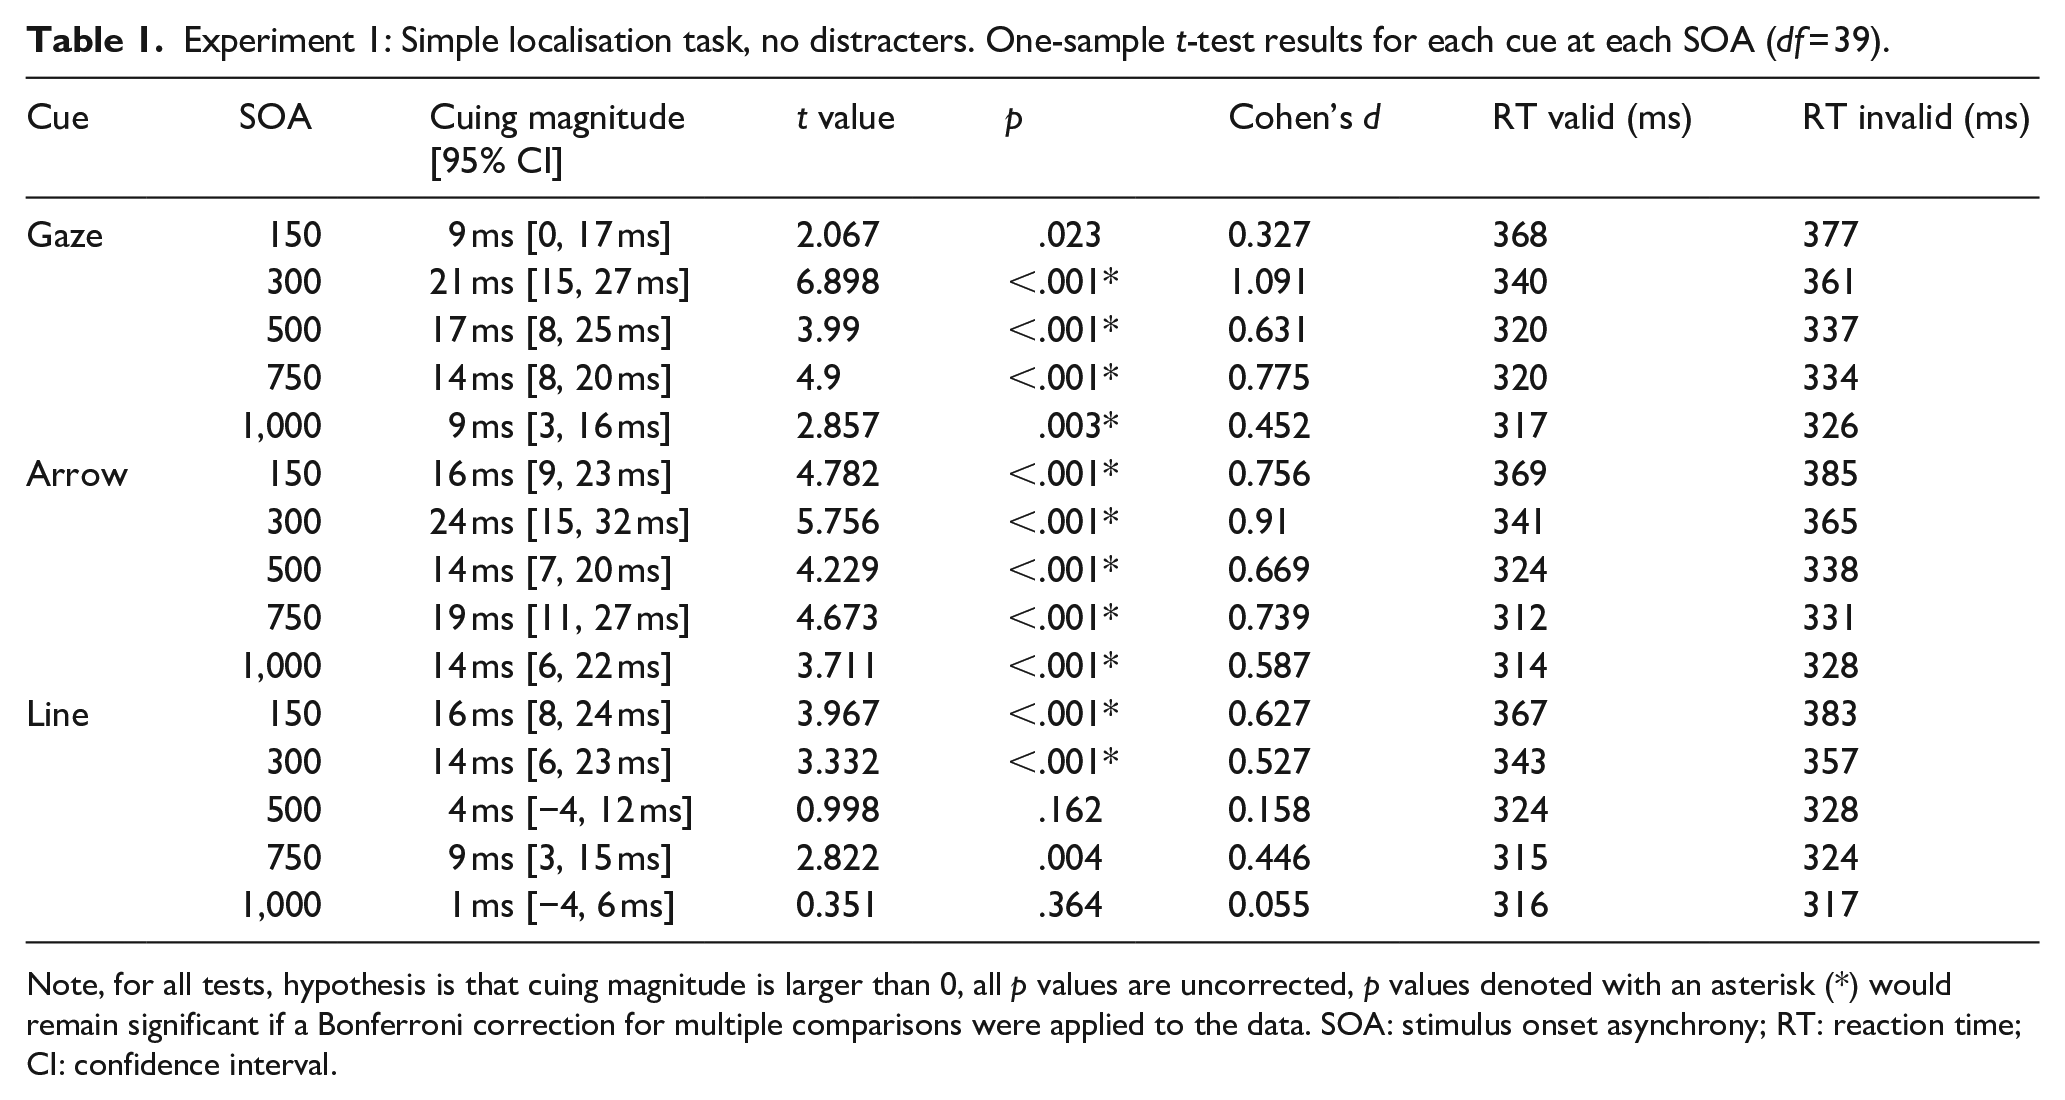
Note, for all tests, hypothesis is that cuing magnitude is larger than 0, all p values are uncorrected, p values denoted with an asterisk (*) would remain significant if a Bonferroni correction for multiple comparisons were applied to the data. SOA: stimulus onset asynchrony; RT: reaction time; CI: confidence interval.
A repeated-measures analysis of variance (ANOVA) on cue magnitude data with cue type (gaze, arrow, line) and SOA (150, 300, 500, 750, 1,000) as within factors showed a significant main effect of cue type, F(2, 38) = 7.820, p = .001,
There was a significant main effect of SOA, F(4, 36) = 4.964, p = .003,
In light of the significant quadratic interaction between cue type and SOA, and to better understand how the influence of each of the cues varied across the various SOAs, we conducted a repeated-measures ANOVA across all SOAs using the data from each cue individually (all p values are Bonferroni corrected). For the gaze cue, the effect of SOA showed a significant quadratic trend; F(1, 39) = 6.756, p = .039,
To summarise, this unilateral cuing paradigm with no distraction and a simple target localisation task shows that gaze and arrow cues have very similar effects on attention orienting over time. Both guide attention at short and longer SOAs, although while the effect of the arrow cue is consistently sustained, the effect of the gaze cue rises then falls over time. Interestingly, the overall magnitude of the cuing effects of the gaze and line cue were not significantly different, but the line cuing effects were less sustained. These findings replicate other studies that used the traditional unilateral paradigm and found no overall difference in cuing magnitude between gaze and non-biological cues such as arrows (Green et al., 2013; Hietanen et al., 2008; Hommel et al., 2001; Ristic et al., 2002; Tipples, 2002; Xu & Tanaka, 2015). Lack of difference between gaze and moving line cues, other than a slightly later cuing peak for the former, indicates perhaps that the influence of dynamic gaze cues might in part be due to the low-level movement of the eyes. Thus, as others have found, there appears to be nothing particularly unique about observers’ attention orienting response to social gaze cues versus meaningful symbolic cues.
Experiment 2—intermediate localisation task, distraction present
Method
Participants
Forty-one adult volunteers were recruited from the University of Aberdeen in exchange for course credit or monetary reimbursement (5 males, 36 females, mean age 21 years, range 18–46 years). Four participants (one male) were removed from analysis due to poor accuracy compared with the rest of the sample. All removed participants had accuracy ⩽88% (median = 96%, MAD = 2.5%). Thirty-seven participants remained in the final analysis.
Stimuli
The fixation-cross and cuing stimuli matched those used in Experiment 1. The target and distractors were capital T shapes, made up of a vertical line crossed by a horizontal line at the top. The lines were both 5 pixels thick, the T was 27 pixels in height, with the cross 29 pixels in width (0.7° × 0.8° visual angle at an approximate viewing distance of 60 cm). The Ts were presented either upside down with the horizontal line crossing at the bottom, or the right way up with the line crossing at the top. The target T was either a right-way-up T in an array of upside-down Ts or an upside-down T in an array of right-way-up Ts. The Ts were presented in two 2 × 2 grids on either side of the central cue. The array was presented at 1.7° visual angle (59 pixels) from the edge of the cue, and the Ts were presented 1 pixel apart from each other. Thus, all visually presented information appeared inside a boundary of 10° of visual angle, within macular vision (18°), and close to paracentral vision (8°). Figure 3 illustrates the three cues within a trial structure.
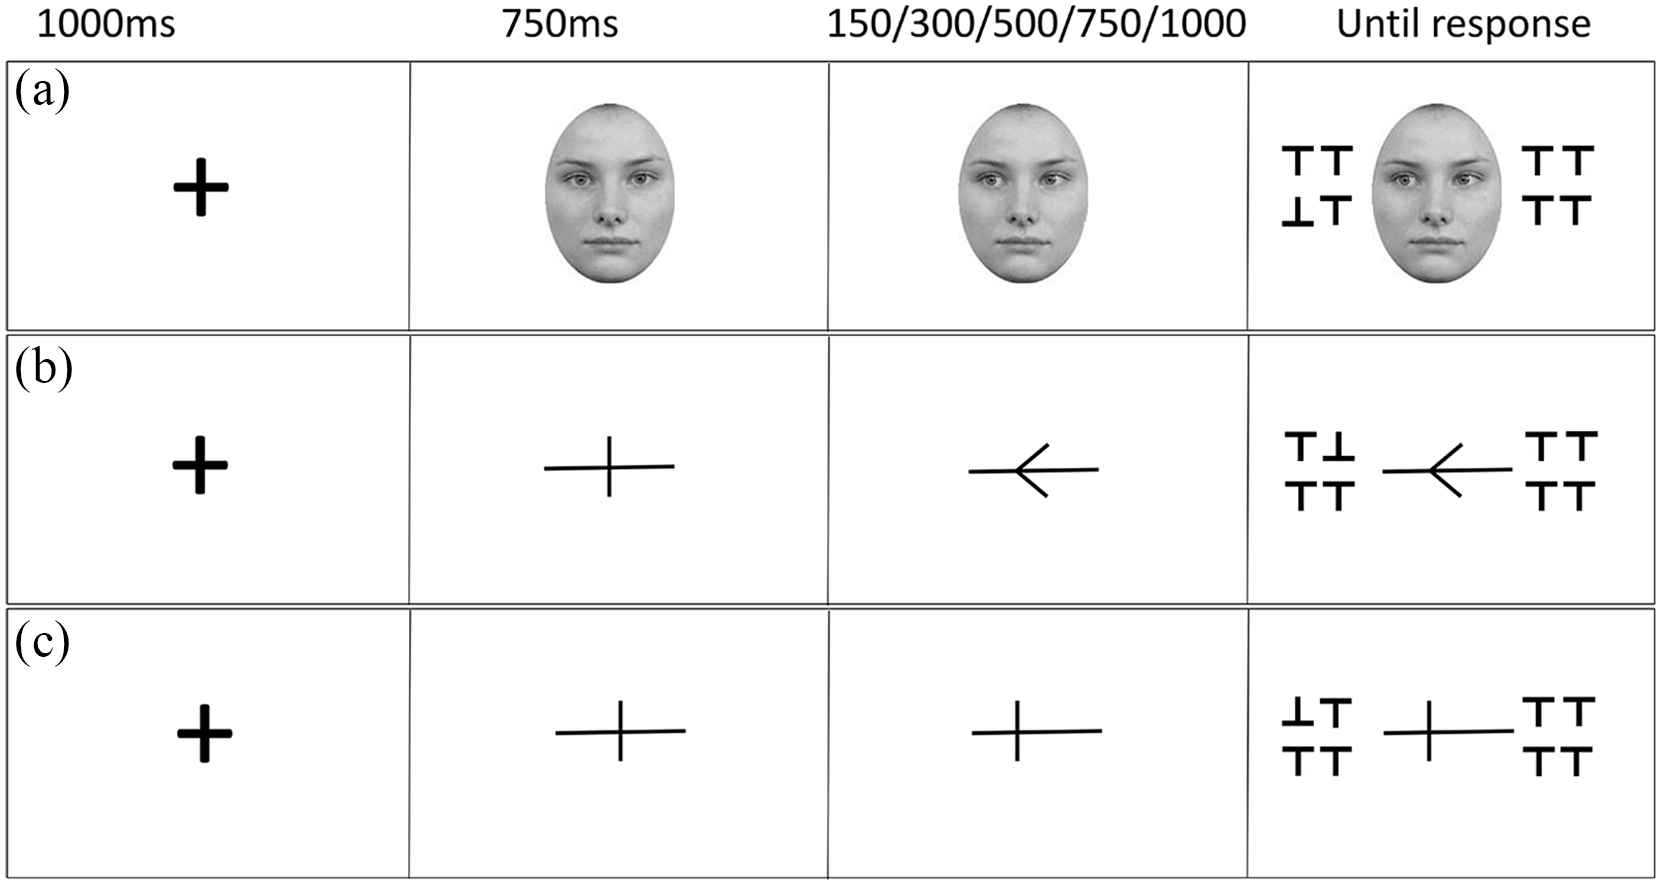
Illustration of the trial procedure and SOA conditions for the three cue conditions: gaze (a), arrow (b), and line (c). All show a present target validly cued condition, with the odd one being an upside-down T. Not to scale.
Design
Within-subjects independent variables were cue type (gaze, arrow, line), SOA (150, 300, 500, 750, 1,000 ms), and cue target validity (valid or invalid). There was an additional variable of whether a target was present or absent; however, this was not part of the main analysis—only data from target present trials were analysed. The experiment was separated into three cue type sections, counterbalanced between participants. There were 264 trials per cue type, made up of 24 absent trials (approximately 9%) and 240 present trials (720 present trials and 72 absent trials in total). Absent trials served as catch trials to ensure participants could not make their location decision by attending one side only. Absent trials were only examined to check overall accuracy, then discarded. The present trials were analysed both for accuracy and as part of the main cue magnitude analysis. Thus, to check accuracy, we combined the target present and absent trials and then calculated the percent accuracy to check that participants engaged with the task properly. There were 10 separate target present conditions (validity at each SOA) per cue type pseudorandomised to present 24 present trials per condition, resulting in 240 present trials per cue type, presented in three 80 present-trial blocks (with 8 additional absent trials randomly presented within each block). The orientation of the target and distractor Ts was also balanced and randomised. Participants were informed of the cue type before beginning each section and were encouraged to take breaks between blocks and between cue types. The dependent variable was the difference between RT to correctly locate the target for valid versus invalid trials. To become familiar with the task, a 19-trial practice session preceded the main experiment, demonstrating each cue type and each of the target display types to the participant, including absent trials.
Procedure
All cue types were presented using the same procedure. As in Experiment 1, the cue remained on screen for the entire trial. Figure 3 illustrates an example trial sequence for each cue type. A fixation cross was presented at the centre of the screen for 1,000 ms, then replaced by the central form of the cue for 750 ms. This was then replaced by the shifted version of the cue (left or right, counterbalanced) which remained on screen for 150, 300, 500, 750, or 1,000 ms before the target array appeared. Participants were instructed to maintain focus in the centre and informed that the direction of the cue did not predict the location of the target. For present trials, on valid trials (50%), the target appeared on the side towards which the cue had shifted; on invalid trials (50%), the target appeared on the opposite side. On target absent trials, all Ts were the same orientation, these were balanced for upright and inverted Ts and for cue shift direction (left/ right); however, SOA was randomised but not balanced. For target present trials, participants had to state the location of the target as quickly and as accurately as possible using the “Q” key with their left index finger for targets appearing on the left, and the “P” key with their right index finger for targets appearing on the right (response side was counterbalanced, as was correspondence to cued location). If the target was absent, participants were required to press the spacebar. The target array and the cue remained on screen until a response was made, and there was no response window cut off. The inter-trial interval was 1,000 ms.
Results
To ensure that participants correctly performed the task, we checked accuracy across target present and target absent trials. This initial accuracy analysis showed that participants engaged with the task (average accuracy 95%) except for the four participants removed, three of which showed less than 50% accuracy on target absent trials. We also compared RTs for the target absent trials with RTs for the valid and invalid target present trials (correct trials only, collapsed across SOA) to check whether the participants searched both locations for the target, or whether the target popped out, meaning there was no need to fully attend to both locations. If there is no significant difference between present and absent RTs, particularly for the invalid condition, this would indicate that the T “popped out” making it easy to say if there was no T present, and making it unlikely that participants attended to the distracter non-targets during the task. Conversely, slower RTs on absent versus present trials would indicate serial search across locations, although note that both locations are clearly visible as all items are presented centrally within macular vision and close to paracentral vision. The difference between RTs for present (valid/invalid) versus absent trials was significant, F(2, 35) = 328.703, p < .001,
Data from incorrect target present trials were excluded (1% of data); no other exclusion criteria were applied. Analyses of the raw RT scores demonstrated no significant difference in median RTs between cue types, F(2, 35) = 0.512, p = .604,
Experiment 2: Intermediate localisation task, distraction present. One-sample t-test results for each cue at each SOA (df = 36).
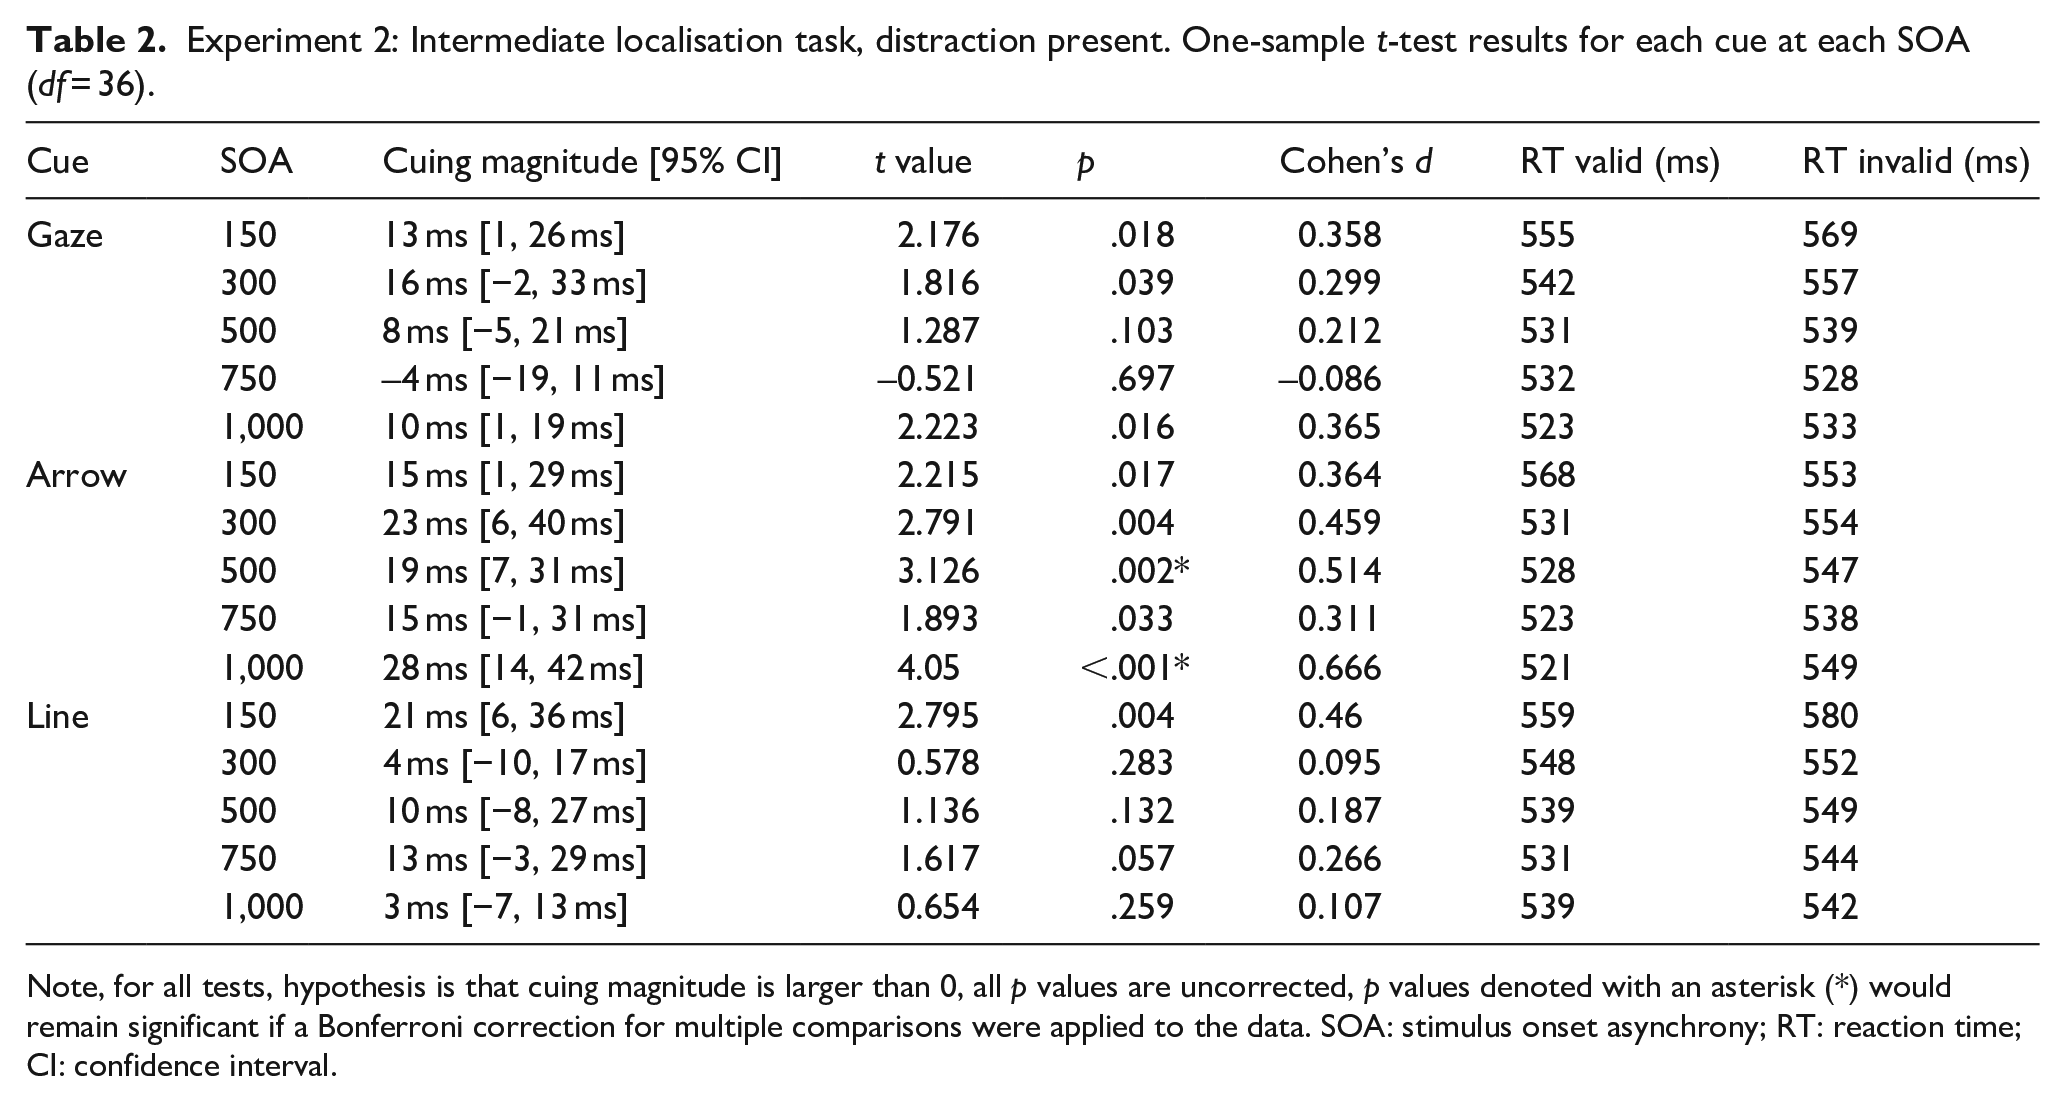
Note, for all tests, hypothesis is that cuing magnitude is larger than 0, all p values are uncorrected, p values denoted with an asterisk (*) would remain significant if a Bonferroni correction for multiple comparisons were applied to the data. SOA: stimulus onset asynchrony; RT: reaction time; CI: confidence interval.
A repeated-measures ANOVA on cue magnitude data with cue type (gaze, arrow, line) and SOA (150, 300, 500, 750, 1,000) as within factors showed a significant main effect of cue type, F(2, 35) = 5.950, p = .010,
In sum, we find a distinction between the overall magnitude of gaze and arrow cuing effects, and interestingly, it is the arrow cue effect that is larger. This finding is notably rare, as research typically demonstrates strong similarities between gaze and arrow cue effects using the unilateral cuing paradigm, as found here in Experiment 1 and elsewhere (Brignani et al., 2009; Green et al., 2013; Guzzon et al., 2010; Ristic et al., 2002; Xu & Tanaka, 2015). This finding is also notably different from that of Bonmassar et al. (2019) who showed no difference between the cuing effect of arrow and gaze cues in a bilateral target task, although their task involved discrimination rather than localisation.
Experiment 1 versus Experiment 2
A cross-experimental analysis was also conducted to directly compare cuing effects between no-distracter and distracter paradigms. Analysing the raw RT data demonstrated that RTs were significantly slower overall in the distracter task of Experiment 2 (543 ms) than the no-distracter task of Experiment 1 (339 ms), F(1, 75) = 206.557, p < .001,
A mixed ANOVA with distraction condition (no distracter/distracter) as a between factor, and cue type (gaze, arrow, line) and SOA as within factors, was conducted on cue magnitude data. The main effect of distraction was non-significant, F(1, 75) = 0.02, p = .887,
Interim summary/discussion
In Experiment 1 (no distracter—unilateral display,) we used a traditional cuing paradigm where an asterisk target appeared on either the right or left side of a central biological or non-biological cue (gaze, arrow, moving line) and the other side of the cue remained blank, using SOAs between 150 and 1,000 ms. Participants reported the location of the cue as quickly and accurately as possible using a left/right key response. We found that the magnitude of cuing overall was equivalent for gaze versus arrow cues and gaze versus moving line cues, but the cuing effect was smaller for line versus arrow cues. The time-course of cuing effects across SOAs did, however, vary according to cue type: arrow cues showed the most sustained and robust attention orienting over time; gaze cue effects rose from 150 ms SOA to peak at 300 ms then steadily declined; line cue effects were largest at the shortest SOA (150 ms) then attenuated over time in a similar manner to gaze cues.
In Experiment 2 (distracter—bilateral display), we designed a harder cued localisation task where the target was a single upright or inverted T embedded among three other conversely oriented Ts, and critically the other side of the central cue was inhabited by a distracter image of four upright or four inverted Ts. Participants stated the location of the target display that contained the single oddly oriented T (left-right response). Xu and Tanaka (2015) found larger cuing effects in a distracter versus no-distracter condition. Thus, according to an attentional resource account of spatial cuing, we reasoned that the presence of a target-relevant distracter in our task may add a greater element of distraction, deplete attentional resources, and thus enhance cuing effects in comparison with the lack of distraction in Experiment 1. However, we found that cuing effects were not distinguishable between no-distracter (Experiment 1) versus distracter (Experiment 2) conditions, indicating that presenting target-relevant distracter information in the non-target location did not significantly alter the impact of the central gaze, arrow, and line cues on attention orienting. We can therefore conclude that increasing the difficulty of the target localisation task by embedding the target item within its own distracters had no impact on cuing, despite evidence that participants engaged in a more difficult target search.
Experiment 3—discrimination task with low versus high distraction
Our findings from Experiments 1 and 2 contrast with those of Xu and Tanaka (2015) and Bonmassar et al. (2019) who found that the magnitude of the cuing effect for both gaze and arrow cues was larger when the task was more difficult due to either added distracters or greater target task demands, respectively. Instead, our findings support those of Friesen et al. (2005). However, there are two key differences between these studies and ours. First, Xu and Tanaka (2015) conducted a within-subjects manipulation of distracter present versus absent conditions while we conducted these manipulations across different groups of participants (Bonmassar et al., 2019, varied task difficulty between groups). Second, both Xu and Tanaka and Bonmassar et al. used a target discrimination task while we used a target localisation task (albeit a slightly more demanding localisation task in our Experiment 2). The nature of the target task could be particularly important when investigating the influence of distracter information on cued attention orienting. A target discrimination task, such as that used by Xu and Tanaka, requires that observers employ deeper level processing to interpret the target’s identity. In contrast, a target localisation task requires little, if any, target identity processing, even when the task is to locate an oddball.
Therefore, in Experiment 3, we employed a target discrimination task within a bilateral display where the distracting information on the other side of the cue was either of low or high distractibility (within-subjects). Unlike Xu and Tanaka (2015), we used a blocked design to ensure that our two conditions were clearly distinct, which allows us to better examine whether distinct attentional responses were elicited and not potentially contaminated by preceding trial task demands (e.g., a low-distracter trial following a high-distracter trial or vice versa). This was particularly important because unlike in Xu and Tanaka’s task, both our high- and low-distraction conditions had a non-target distractor, making it more important that the conditions were separated.
Method
Participants
Forty-three adult volunteers were recruited from Aston University in exchange for course credit or monetary reimbursement (12 males, 31 females, mean age 26 years, range 18–53 years). All participants were included in the final analysis.
Stimuli
The fixation-cross and cuing stimuli (gaze and arrow cues) matched those used in Experiments 1 and 2. The target was a capital T shape, and the distractors were capital I shapes. The T stimuli matched those used in Experiment 2, while the I stimuli were essentially the same but had an additional line at the bottom. Matching the T stimuli, the distractor Is were also 27 pixels in height. The Ts were presented either upside down with the horizontal line crossing at the bottom, or the right way up with the line crossing at the top. Here only one T was ever presented in an array, thus the target was either a right-way-up or upside-down T in an array of Is. The stimuli were presented in a 2 × 2 grid on either side of the central cue. In the low-distraction version, a space filler grid was presented in the non-target location, this was created to take up the same amount of space as the T/I display. The outside lines of the grid were the same thickness as the lines of the T (5 pixels thick), with the grid lines being 4 pixels thick to keep them in the centre of the grid. In the high-distraction version, where target-relevant information is presented on both sides, a target-relevant distractor array containing the distractor I stimuli was presented in the non-target location. The stimuli array was presented at 1.7° visual angle (59 pixels) from the edge of the cue, and the Ts/Is were presented 1 pixel apart from each other. Thus, all visually presented information appeared inside a boundary of 10° of visual angle, within macular vision (18°), and close to paracentral vision (8°). Figure 4 illustrates the task.
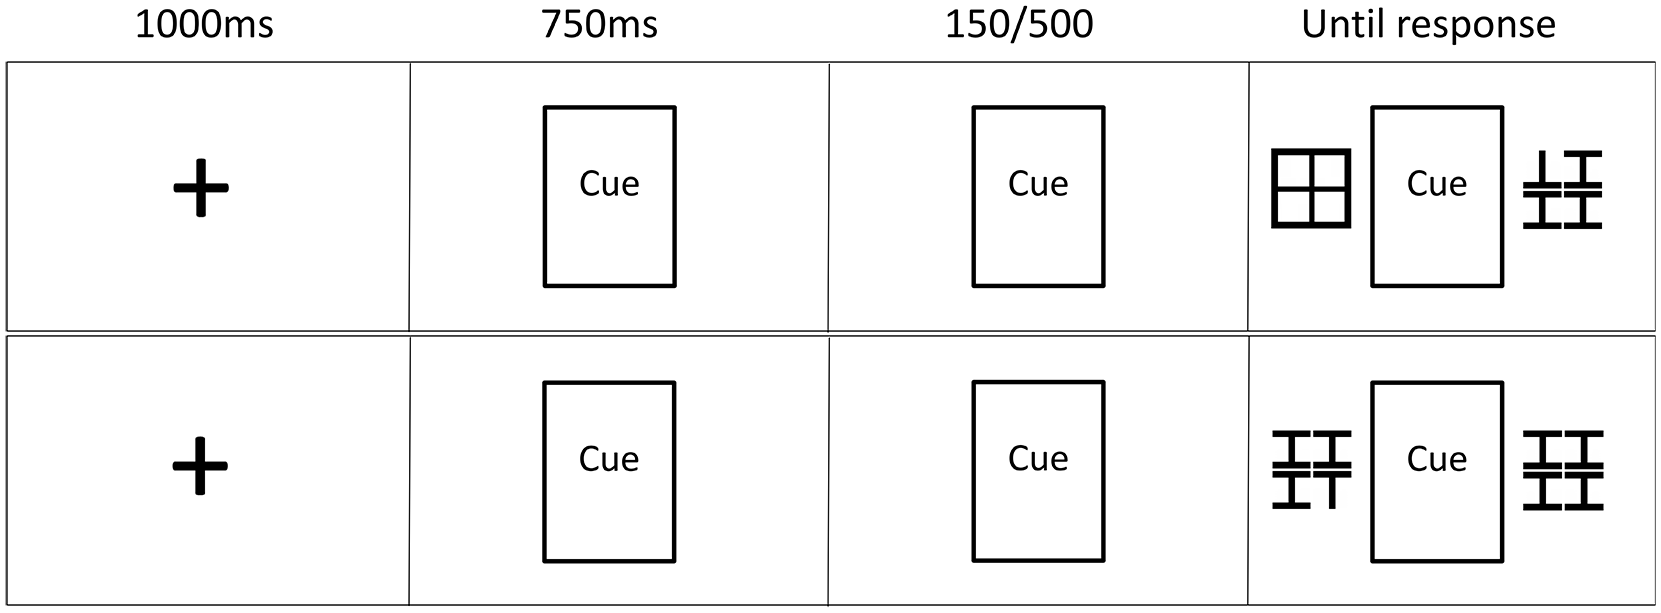
Illustration of the trial procedure and SOA conditions for the two distraction load conditions: low distraction (top) and high distraction (bottom). For the top display, the correct response would be the down arrow, for the bottom display, the correct response would be the up arrow. Not to scale.
Here we also included a no-shift condition in a separate block at the end of the session, where either the gaze remained direct or no arrow was shown (the cue simply showed a line in the centre). This no-shift condition allows us to assess whether the high-distraction condition was more attention-demanding than the low-distraction condition in the absence of any cuing.
Design
Within-subjects independent variables were distraction load (low, high), cue type (gaze, arrow), SOA (150, 500 ms), and cue target validity (valid, invalid). The experiment was blocked by distraction load and by cue type, both counterbalanced between participants. SOA and validity (50% valid) conditions were randomised. There were 128 trials per cue type per distraction load condition (512 trials in total) with 32 trials in each of the specific SOA/validity conditions. The orientation of the target T was balanced and randomised so that there were as many upright as upside-down T trials. In addition, the location of the T in the array was also balanced, so that it could appear in any of the four array locations. Participants were informed of the cue type and distraction load condition before beginning each section and were encouraged to take breaks. The dependent variable was the difference between RT to correctly identify the orientation of the single T (upright vs. inverted) on invalid minus valid trials (cuing magnitude). To become familiar with the task, a 16-trial practice session preceded the main experiment, demonstrating each cue type and distraction load condition to the participant.
Procedure
All cue types were presented using the same procedure. As in Experiments 1 and 2, the cue remained on screen for the entire trial. Figure 4 illustrates an example trial sequence for each cue type. A fixation cross was presented at the centre of the screen for 1,000 ms, then replaced by the central form of the cue for 750 ms. On shift trials, this was then replaced by the shifted version of the cue (left or right, counterbalanced) and remained on screen for 150 or 500 ms before the target array appeared. Given the lack of impact of SOA on distraction effects across Experiments 1 and 2, here we focused on just these two SOAs to probe rapid reflexive versus volitional orienting. Participants were instructed to maintain focus in the centre and informed that the direction of the cue did not predict the location of the target to be discriminated. On valid trials (50%), the target appeared on the side towards which the cue had shifted; on invalid trials (50%), the target appeared on the opposite side. Participants had to state the orientation of the T as quickly and as accurately as possible using the up and down arrows with their right hand. The target array and the cue remained on screen until a response was made, and there was no response window cut off. For correct response trials, the inter-trial interval was 1,000 ms. When participants responded incorrectly, they were presented with feedback, and so for incorrect trials, the inter-trial interval was 2,500 ms. This was to ensure that participants completed the task properly.
We also presented a no-shift baseline condition as part of the main experiment but always in a separate block at the end, with the distraction load and cue type condition blocked and counterbalanced. This was added to confirm whether the high-distraction condition was more attention-demanding than the low-distraction condition in the absence of any cuing, evidenced by slower RTs in the former. Note that for this no-shift condition, the SOA started from the moment that the central stimuli (either a cross or a face looking ahead) is presented. We therefore presented these stimuli for 1,250 ms; this matches the timing for the 500 ms SOA, as we would normally present the central cue prior to the shift for 750 ms. Again, there were 32 trials per cue type and distraction load condition. The task was the same as described for the shift condition, but there is no validity aspect, the target is simply on either the left or the right of the central stimulus.
Results
All participants had at least 95% accuracy in the task. Analysis of the raw RT scores showed longer RTs in the high- (924 ms) versus low-distraction condition (845 ms), implying that participants indeed found the same target T discrimination cuing task more difficult with greater perceptual distraction on the other side, F(1, 42) = 52.903, p < .001,
Results from Experiment 3 (shift condition only) showing cuing magnitude at each SOA for the gaze and arrow in the low-distraction and high-distraction target conditions. Positive magnitude means that participants were faster for the valid than the invalid location.
Low- and high-distraction conditions, Experiment 3. One-sample t-test results for each cue at each SOA (df = 42), to indicate the presence or absence of cuing.
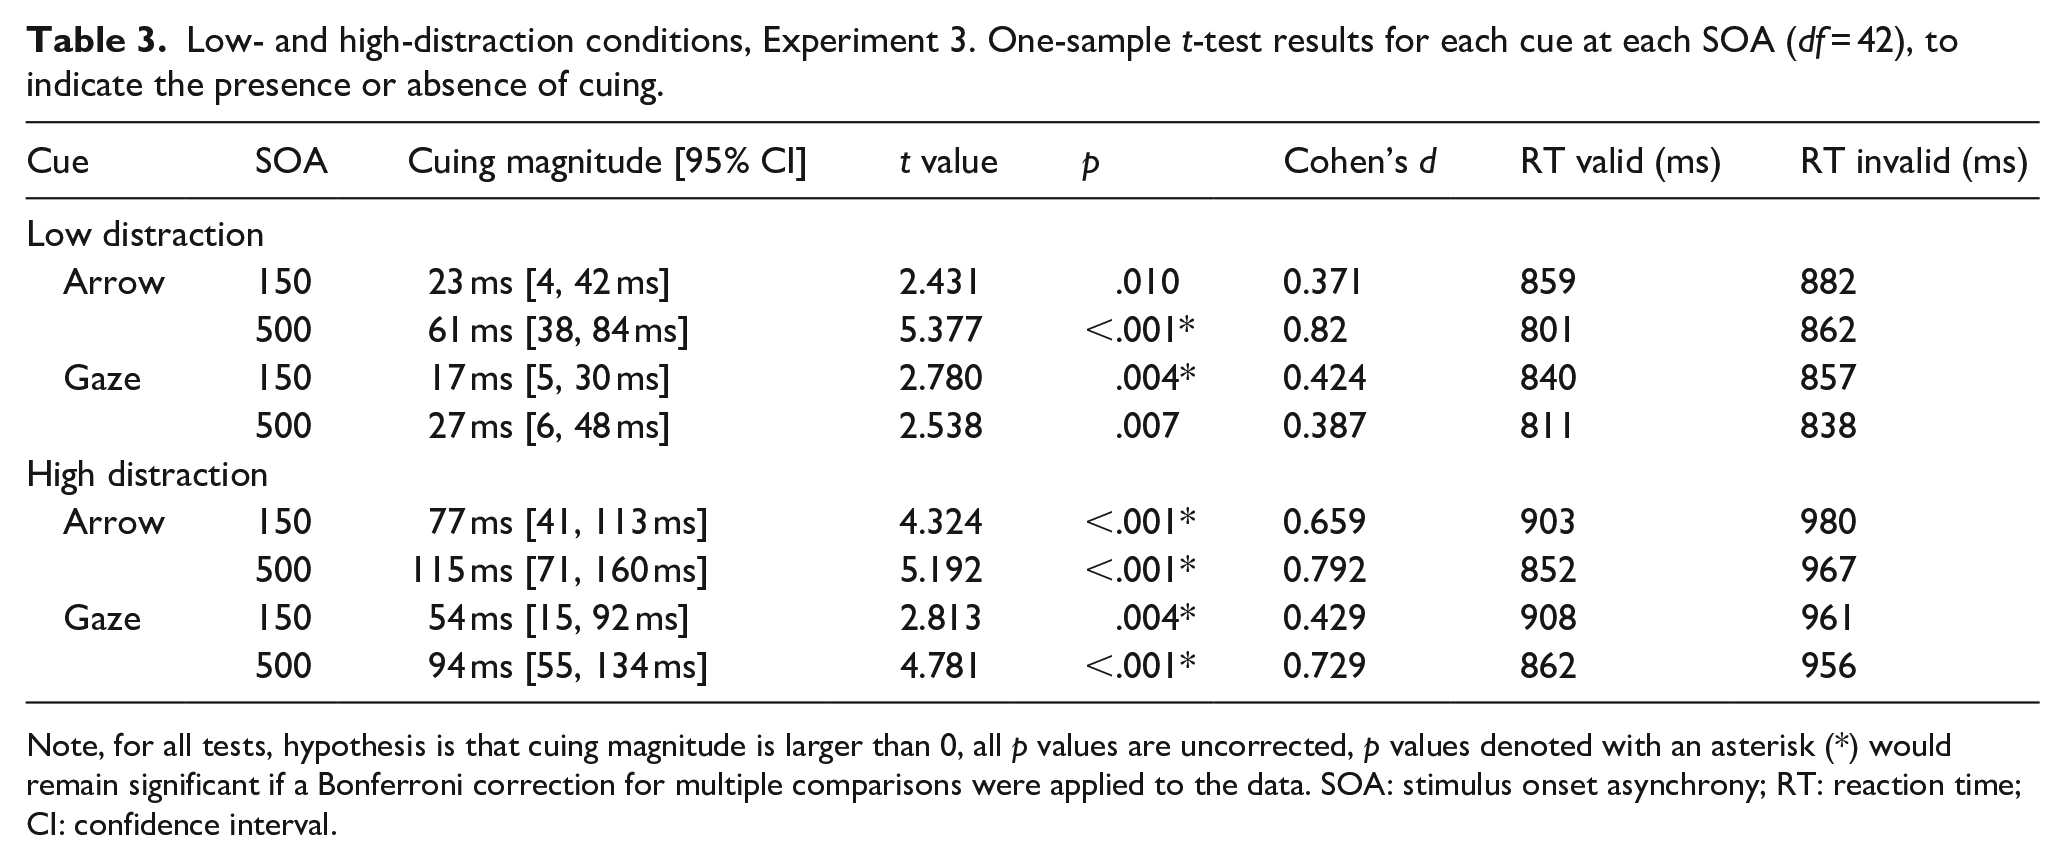
Note, for all tests, hypothesis is that cuing magnitude is larger than 0, all p values are uncorrected, p values denoted with an asterisk (*) would remain significant if a Bonferroni correction for multiple comparisons were applied to the data. SOA: stimulus onset asynchrony; RT: reaction time; CI: confidence interval.
A repeated-measures ANOVA on cue magnitude data with cue type (gaze, arrow), distraction load (low, high) and SOA (150, 500) as within factors showed a significant main effect of cue type, F(1, 42) = 5.041, p = .030,
We also analysed raw RTs from the no-shift trials block, to confirm that the high-distraction condition was more attention-demanding than the low-distraction condition in the absence of any directional cuing. All participants had at least 95% accuracy in the task. A repeated-measures ANOVA was conducted on median RTs data with cue type (gaze, arrow—note here the arrow is not an arrow but simply a line as the arrowhead does not show), and distraction load (low, high) as within factors. There was a significant main effect of distraction load, F(1, 42) = 109.440, p < .001,
Experiment 3 versus Experiments 1 and 2
We conducted a mixed ANOVA comparing cuing magnitudes with each of our four task/distraction conditions across the three experiments as a between factor (Experiment 1 no distraction; Experiment 2 high distraction; Experiment 3 low distraction; Experiment 3 high distraction) and SOA (150 and 500 ms) as a within factor (see Figure 6). Data were combined from arrow and gaze cues due to there being non-significant cue type by distraction or SOA interactions in Experiment 3 or when Experiments 1 and 2 were compared, and excluding the line cue not used in Experiment 3. This showed a significant main effect of distraction, F(3, 159) = 15.116, p < .001,
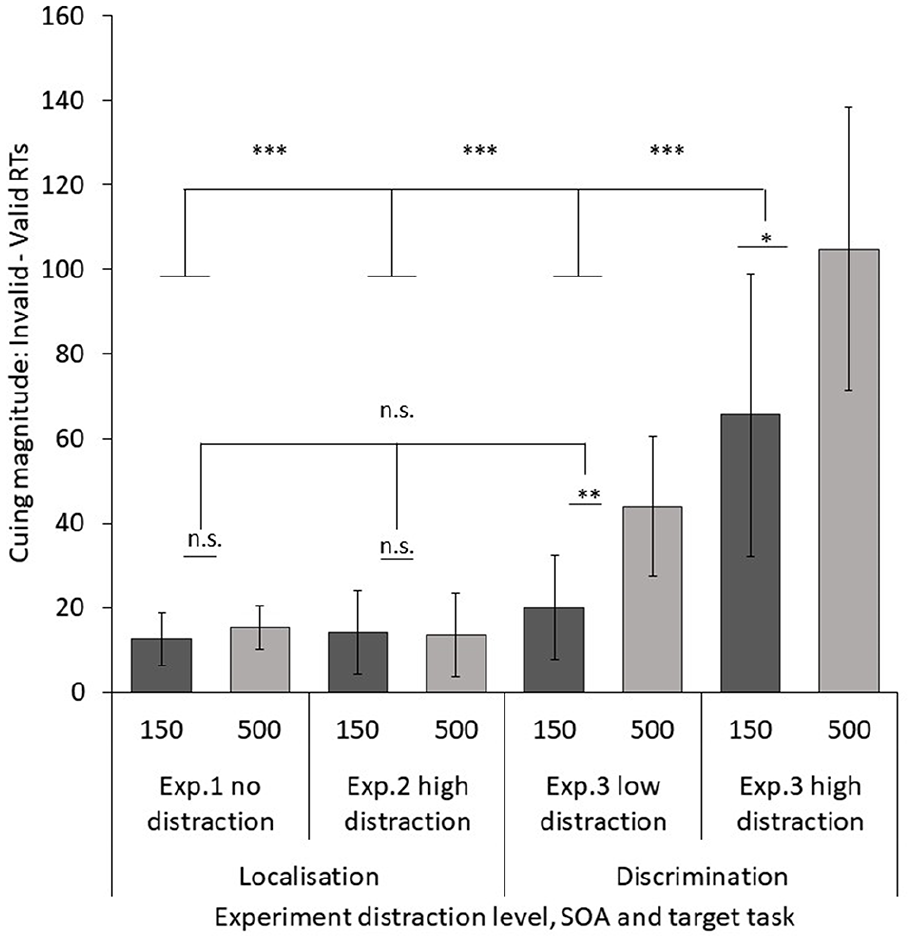
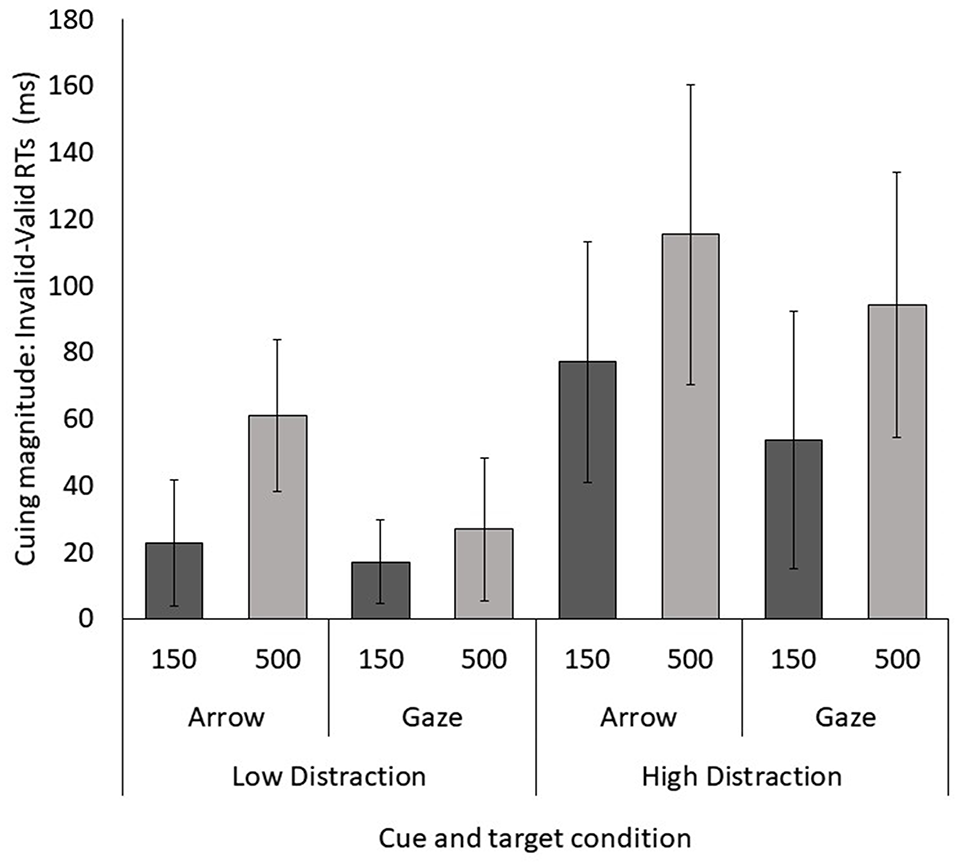
Comparable cuing magnitudes (150 and 500 ms SOAs) for each of our four task/distraction conditions (arrow and gaze cue only). Experiment 1, simple asterisk localisation task, no distraction present; Experiment 2, complex localisation task with target-relevant distraction; Experiment 3, discrimination task, low distraction condition, non-target-relevant distracter presented, high-distraction condition, target-relevant distracter presented.
A comparison of raw overall RTs (150 ms condition and 500 ms conditions only) between Experiment 2 and the low-distraction condition of Experiment 3 shows that the discrimination task in Experiment 3 yielded longer RTs overall to respond to the target information than the localisation task in Experiment 2, t(78) = 12.143, p < .001, Cohen’s d = 2.768. This indicates that the discrimination task was more difficult than the embedded target localisation task even under low distraction.
In summary, these findings demonstrate that there is a difference in how the cues are processed in these tasks, with the effect of both gaze and arrow cues being larger when a discrimination task is employed within the context of higher perceptual distraction. This lends support to an attentional resource account: participants may have found it more difficult to ignore the central cue when the task was harder and attentional resources were depleted.
General discussion
In this study, we aimed to investigate whether depleting attentional resources by adding varying degrees of perceptual distraction and target task demands served to modify the magnitude of known non-predictive gaze and non-biological cuing effects. To manipluate perceptual distraction, no distracting information was present in the target display in Experiment 1 (traditional unilateral cuing paradigm); in Experiment 2, there were target-relevant distracters on the other side of the target (bilateral display), and in Experiment 3, we presented low- versus high-distraction information in a bilateral display to allow a direct within-subjects comparison of distraction load. To manipulate target task demands, we used a target localisation task that was either simple (Experiment 1) or intermediate (Experiment 2) in difficulty, and a higher-level discrimination task in Experiment 3 that was expected to be more demanding than localisation. More specifially, in Experiment 1, we used a traditional unilateral localisation task where target-relevant information (an asterisk) only appeared to one side of the cue, to establish the basic effects of the specific cues when no distracters are present. In Experiment 2, we created a bilateral paradigm in which participants had to locate an oddball upright or inverted T shape embedded in three other Ts of the alternate orientation. This oddball T only appeared in the display on one side of the cue while the display on the other side comprised a homogeneous set of Ts, and participants responded left or right as quickly as possible. Unlike in traditional cuing experiments where target-relevant information only appears on one side and the other side of space is empty, here the participants had to filter out the distracter information as the target was not easily detectable and could appear on either side. In addition, on a small proportion of trials, the target was completely absent from the display. In Experiment 3, we again used a bilateral paradigm but here participants had to discriminate the orientation of a T shape, displayed among distractor shapes. We compared a low-distraction condition in which an irrelevant space filler grid was shown in the non-target location, with a high-distraction condition in which distractor information was task relevant and visually similar to the target task information. The basic task in the low- and high-distraction conditions was the same, as was the information displayed in the target location, which allowed direct comparison between cuing effects under low- versus high-distraction conditions. We used a variety of SOAs from 150 to 1,000 ms, to assess whether distraction effects were modulated by early (reflexive) versus later (volitional) orienting responses (Müller & Rabbitt, 1989).
In previous work, Xu and Tanaka (2015) found that the addition of task-irrelevant distracters in the opposite location to the target display increased the magnitude of gaze and arrow cuing effects. While they reasonsed that this was due to the absence of interference on cuing from abrupt target onset in the non-distraction condition, we hypothesised that such spatial cuing effects may be mediated by the availability of attentional resource. When distracters deplete attentional resources (as evidenced in slower RTs overall in their distracter vs. no-distracter conditions), cuing effects may be magnified if the ability to ignore a non-predictive (unhelpful) cue is impaired. Our results support this attentional resource account of spatial cuing. We found that the magnitude of cuing (both gaze and non-biological) increased as the combined demands of distraction and target task difficulty increased across experiments. Specifically, when we compared no-distraction and distraction conditions between Experiments 1 and 2, we found no effect of distraction on cuing magnitude regardless of cue type (as per Friesen et al., 2005). Although RTs were overall slower in the distraction task with more difficult localisation task, indicating that this was more attention-demanding, we can also conclude that increased task difficulty did not modulate cuing magnitude either. Critically, however, in Experiment 3, we found that cuing effects were significantly larger in the high-distraction versus low-distraction condition. The effect of distraction was not modulated by cue type or SOA. This suggests that, during a discrimination task, when attentional resources are depleted by greater distraction, it is more difficult to ignore the central cue. Furthermore, cuing effects were significantly larger in the high-distraction condition of Experiment 3 compared with both Experiments 1 and 2, suggesting an additive effect on attentional demands from combining a deeper level processing discrimination task with high levels of perceptual distraction.
Our findings align with Xu and Tanaka (2015) who found larger cuing effects under distraction versus no distraction. However, such perceptual distraction effects on cuing run contrary to Bobak and Langton (2015) who found that gaze cuing was conversely disrupted by a high cognitive load. In Bobak and Langton, the cognitive load task was separate to the target task, and involved WM (random number generation task), which would have unarguably depleted attentional resources. So why did they eliminate cuing effects with a concurrent WM task, while we found that increased perceptual distraction enhances cuing effects? Why do two different methods of reducing the availability of attentional resources yield opposite effects on spatial orienting effects to non-predictive central cues, and how can this be reconciled with an attentional resource account of cued spatial orienting?
To address this question, we consider what impact the presence of additional perceptual information load in the cuing display may have on the distribution of attentional resources across the physical display space. The spotlight and zoomlens metaphors of attention distribution may be a useful analogy with which to conceptualise the dynamic and flexible nature of spatially cued attention. Attention is considered to be limited in capacity but flexible in how it can be allocated across time and space. The spotlight theory posits that attention can be thought of as a moveable focal point, with information within the spotlight being preferentially processed (Posner & Cohen, 1984). Within an endogeneous cuing paradigm such as the one used here and commonly elsewhere, a salient central cue such as a gaze shift or arrow signal may move the attentional spotlight in the direction indicated prior to target onset, resulting in a faster response to items appearing in the cued versus uncued location. The zoomlens theory of attention allocation is an extension of the spotlight theory, and proposes that the size of the spotlight can be changed depending upon the task, with narrow, sharp focus versus broad, lower resolution dependent upon the size of the lens (Eriksen & Yeh, 1985).
It is unclear exactly how attention is distributed within a traditional unilateral cuing display. However, it is possible that cuing effects are the result of the rapid narrowing of attentional focus, which becomes unilaterally biased towards the cued location thus enabling more precise and rapid target processing of information in validly versus invalidly cued locations. In contrast, the use of a bilateral display in which a target appears on one side of the cue and non-target (distracting) information appears on the other side (Experiments 2 and 3 here) may change the way in which attention is distributed across the display. To resolve conflict and competition between target and non-target information, according to the zoomlens model, we could theorise that the attentional lens may be particularly broad, and spread across a wider spatial area, to better appraise both locations, thus reducing the amount of attentional resource available in the centre of the display where the cue appears. If attention is required to filter out and inhibit irrelevant information (Conway & Engle, 1994; Engle et al., 1995; Nakagawa, 1991), then the ability to ignore a non-predictive central cue might be weakened, and lead to increased cuing effects as found here. We replicate Xu and Tanaka’s (2015) distraction effects to find larger cuing effects when non-target information on the other side of the cue is particularly distracting, specifically when combined with a more difficult target discrimination task (compared with a localisation task). These findings thus provide support for an attentional resource and inhibition account of central cuing, where depleting attentional resource weakens our ability to inhibit/ignore a non-predictive cue and increases cuing effects, although we cannot specifically ascertain from our results whether this is due to a broadening of the attentional lens per se. The fact that distraction effects were not significantly modulated by SOA also indicates that the extent of cue processing was similar under rapid reflexive versus later volitional cuing conditions.
But the question still remains as to why a concurrent WM task conversely eliminated cuing effects. Why did reduced attentional resource under high WM load abolish the influence of a central cue? Notably, in addition to eliminating gaze cuing under high WM load, Bobak and Langton (2015) also found weaker orienting responses to a peripheral cue under WM load (target or non-target location placeholder changed colour), and reduced cuing effects under two different task demand conditions (simple localisation and letter identification). They suggest that what was disrupted under suitably taxing high WM load is the maintenance of an internal, top-down controlled “goal” state which dictates that gaze should be followed. But this cannot explain why their peripheral, non-gaze cue was also weakened under high WM load. This is purely speculative, but what may be happening in their WM load condition is a more global reduction in attentional resource away from the cuing display as a whole, which may have led to impaired cuing effects. In our paradigm, attentional resources have to be directed towards the task display in all no-, low-, and high-distraction conditions (perhaps even more so in the bilateral displays), and what is altered may be the allocation of local attentional resource across the display, as per the zoomlens model of attention. When attention is clearly focussed on the cue–target display with no unrelated cognitive distractions, perceptual distraction within the display clearly results in greater cuing effects. But whether, why, and how global versus local attentional resource mechanisms may affect spatial cuing responses differently requires much further thought and investigation.
The findings of Bonmassar et al. (2019) may also help interpret our pattern of results. They investigated the influence of task demands on the effect of non-predictive gaze and arrow cues on both eye movements and RTs within an easy versus hard shape discrimination task. Like in our Experiment 2 and the high-distraction condition of Experiment 3 here, they presented a target-relevant distractor in the non-target location. They found that participants made fewer eye movements in the easy task condition, with half of the participants being able to complete the task without making eye movements (tasks instructions asked them not to move their eyes). In the difficult discrimination task however, all of the participants were found to make eye movements to complete the task. In addition, they found a larger cuing effect in the hard versus easy task. Eye movements are an indicator of overt attention, and in their easy task, the eye movements made appeared to have occurred to aid target discrimination rather than in response to cue direction. However, this pattern changed in the hard task where eye movements appeared to follow the direction of the cues, irrespective of validity and cue type. Thus, Bonmassar et al.’s findings lend further support for an attentional resource and inhibition account of spatial cuing—when task demands are high, it is more difficult to inhibit an attentional response to the central cue, resulting in a stronger cuing effect. Applying this directly to our findings, the stronger overall cuing effect seen in the more difficult discrimination task in Experiment 3 is likely due to participants being less able to inhibit their attention from following the cue signal and thus perhaps checking the cued location for the target before searching the uncued location, as is seen with the eye movements in Bonmassar et al. (2019). Our finding of larger cuing magnitudes at 500 versus 150 ms SOA in both low and high-distracter conditions in Experiment 3 (but not in the localisation tasks in Experiments 1 and 2) further lends support for this, suggesting that directional cues are utilised to a greater degree when task demands are high, perhaps to try to help ease the cognitive burden. Such strategic cue responses at 500 ms SOA may involve a greater bias towards which side of the display to search first, despite the cue’s non-predictive nature.
It is also worth reflecting on the effects of cue type on spatial orienting across the three experiments. The bilateral design of Experiments 2 and 3 serves two further purposes. First, it helps further our understanding of how cues orient attention in a more realistic environment where potentially relevant information can appear in multiple locations. Second, it removes abrupt target onset (see Xu & Tanaka, 2015), allowing us to more directly associate target response times to the influence of the central cue rather than attentional capture by lateralised target onset.
In the unilateral, no-distraction task of Experiment 1, we replicated the finding that gaze and arrow cues have very similar overall effects on attention orienting despite the large perceptual differences between them (Brignani et al., 2009; Green et al., 2013; Guzzon et al., 2010; Ristic et al., 2002; Xu & Tanaka, 2015). The overall magnitude of the cuing effects were statistically equivalent, although the arrow cue showed more sustained orienting responses over time. The moving line oriented attention in a similar manner to gaze cues, but diminished more rapidly. In Experiments 2 and 3 here, where a more difficult embedded target task was used and where task-relevant or task-irrelevant distracter information was present in the non-target location, we found significantly larger cuing effects from the arrow cue than the gaze cue. This difference between the effects on attention from gaze and arrow cues is unusual and to our knowledge is the first demonstration of significantly weaker orienting in response to gaze versus arrow cues. Neither Bonmassar et al. (2019) nor Xu and Tanaka (2015) found a difference in cuing magnitude between gaze and arrow cues in their bilateral distracter conditions, so it is not simply the removal of sudden target onset (by presenting information on the other side of the cue) that could account for our finding. For Experiment 2, it is notable that there is no significant facilitatory influence of the gaze cue at the 500 ms SOA and the 750 ms SOA, yet there is at the 150, 300, and 1,000 ms SOAs. This creates a U-shaped effect not seen in Experiment 1, where instead the influence of the cue rose to its peak at the 300 ms SOA and then declined over the 500, 750, and 1,000 ms SOAs while remaining significantly facilitatory. No such pattern occurred for the arrow cue in Experiment 2, and there was a strong effect of the gaze cue at the 500 ms SOA for both conditions of Experiment 3. We currently have no explanation for these data, and further testing and replication is required to determine whether this is a spurious finding or a robust one related somehow to the experimental design parameters.
Despite the unexplainable gaze cue effects seen in Experiment 2, it is still clear from our data that there are differences in how the gaze and arrow cues influenced attention over time, with the arrow cue effect being stronger and more sustained. Considering the specific role of gaze and arrow signals in a real-world environment may help explain the different ways in which they influence attention across these experiments. An arrow is put in place to direct attention and action, it does not have another role, and although not all arrows may be important to a task, they always hold the same basic meaning, that is, there is something of importance in that direction. This simplicity means that the cue requires little interpretation other than that of the direction indicated. Eye gaze on the contrary can be interpreted in a number of ways. For example, it can be a signal to look at something important, a signal of a person’s own distinct personal interests and intentions, or it can signal a lack of interest in the looked away from item. This may therefore decrease the level of gaze cuing as compared with the simpler arrow cue in a more complex and perceptually cluttered environment, such as the one we created by using an embedded target task. In Experiments 1 and 2, cuing effects were also equivalent for gaze and line cues, further indicating that there was nothing particularly special or unique about orienting to social gaze cues.
It is also possible that the cues used in the study could explain these effects. Specifically, it is possible that the gaze cues used are less engaging than the arrow cues used, possibly due to the relative simplicity and high contrast of the arrow cues compared with the complexity and lower contrast of the faces, resulting in them being poorer cues of attention. Interestingly, we have used these same gaze and arrow cue stimuli in experiments investigating the influence of attentional cuing on WM (Gregory & Jackson, 2017, 2018). In these studies we found that valid gaze cues enhanced WM for simple items compared with invalid gaze cues when non-predictive (50% valid), while the arrow cues did not have any influence on WM, indicating a socially specific attention orienting response in this task context. It is therefore unlikely that the reason for these disparate effects here is that these gaze cue stimuli are generally poor cues of attention, or easier to ignore than the arrows per se. Instead, it is possible that the arrow cues have a stronger influence on more basic attention orienting in our distraction paradigms perhaps due to the cue–target conflict account of the cuing effect (Green et al., 2013; Green & Woldorff, 2012). This account posits that cuing is stronger when the cue and target are on screen together, with responses being slowed when the cued location differs from the target location (as opposed to responses being facilitated by the cue pointing to the target location). It is possible that the simple shape of the arrow cue causes a larger cue–target conflict in this study than the more complex gaze cue. It is therefore important for our findings to be replicated using other types of gaze cue (e.g., eyes only) in future studies.
In conclusion, this study aimed to investigate how varying target task difficulty and the level of perceptual distraction influences the strength of gaze and non-biological cuing effects. Our finding of increased cuing (regardless of cue type) under conditions of high task demands combined with high perceptual distraction suggests that depleting attentional resources in this manner makes it more difficult to suppress pre-potent orienting responses to known uninformative directional cues. It would be useful for future research to examine how the availability of attentional resources, via differential task demands and perceptual/cognitive distraction, influences spatial orienting to known predictive cues (e.g., 75% valid, 25% invalid) that are informative and useful in nature, and known counter-predictive cues (e.g., 25% valid, 75% invalid) that are really unhelpful. To effectively utilise known predictive and counter-predictive cues, top-down control over cue processing and task response is required. There has been surprisingly little systematic investigation of the role of known predictability on gaze and non-gaze cuing effects, but some work indicates that humans are able to exert a degree of volitional control over counter-predictive gaze cues at longer SOAs, within the traditional unilateral cuing paradigm (Driver et al., 1999; Friesen et al., 2004). In an ageing study where participants were informed whether a gaze cue was non-predictive (50% valid) or predictive (66% valid), Slessor et al. (2014) found no difference in cueing magnitude as a function of cue predictability, although their use of a short SOA of 220 ms may explain this if more time is required to exert strategic control. Finally, we found that distraction effects were not modulated by cue type here. Rendering the cues predictive or counter-predictive may also reveal whether there are particular effects of gaze versus non-biological cues on spatial orienting under perceptually distracting conditions, when the cue requires more active engagement from the observer. Thus, more systematic investigation of the impact of attentional resource availability on goal-directed attentive utilisation of predictive cues and active suppression of counter-predictive cues will help further our understanding of the nature of spatial attention orienting mechanisms.
Footnotes
Declaration of conflicting interests
The author(s) declared no potential conflicts of interest with respect to the research, authorship, and/or publication of this article.
Funding
The author(s) received no financial support for the research, authorship, and/or publication of this article.