
Abstract
People often categorize the same object variably over time. Such intraindividual behavioral variability is difficult to identify because it can be confused with a bias and can originate in different categorization steps. The current work discusses possible sources of behavioral variability in categorization, focusing on perceptual and cognitive processes, and reports a simulation with a similarity-based categorization model to disentangle these sources. The simulation showed that noise during perceptual or cognitive processes led to considerable misestimations of a response determinism parameter. Category responses could not identify the source of the behavioral variability because different forms of noise led to similar response patterns. However, continuous model predictions could identify the noise: Noisy feature perception led to variable predictions for central stimuli on the category boundary, noisy feature attention increased the prediction variability for stimuli differing from each category on another feature, and noisy similarity computation increased the variability for stimuli with moderate predictions. Measuring category beliefs in a continuous way (e.g., through category probability judgments) may therefore help to disentangle perceptual and process-related sources of behavioral variability. Ultimately, this can inform interventions aimed at improving human categorizations (e.g., diagnosis training) by indicating which steps of the categorization mechanism to target.
The human mind often reacts differently to the same object over time. People may assign objects sometimes to one category and sometimes to another. For instance, people may categorize tomatoes as fruits or vegetables, turquoise as green or blue, and a consonant with intermediate voice-onset time as voiced or voiceless. Individuals’ behavior can vary over time not only in categorizations (Ashby & Maddox, 1998; Beck et al., 2012; Stewart et al., 2002; Wyart & Koechlin, 2016) but also in other inferential choices (Gaissmaier & Schooler, 2008), preferential choices (Rieskamp et al., 2006), and quantitative judgments (Albrecht et al., 2020). Such behavioral variability can have various cognitive underpinnings, and an increase in behavioral variability (e.g., because of an experimental manipulation) could easily be interpreted as a change in cognitive strategy—yet people may have simply become less precise (Olschewski et al., 2018; Seitz, von Helversen, et al., 2023). To avoid such misinterpretations, one needs to break down behavioral variability and pinpoint its potential origins in the cognitive system. This article provides an overview of sources of behavioral variability in categorization and presents a simulation-based way to disentangle these sources in a cognitive categorization model.
Categorizing objects is fundamental for cognition. Much psychological research has sought to understand human categorizations, theorizing that people categorize objects by applying rules or similarity-based processes (introduced in detail below; for an overview, see Ashby & Maddox, 2005; Palmeri et al., 2004; Richler & Palmeri, 2014; Serre, 2016). Over the years, many cognitive models have formalized these theories, and, broadly speaking, they successfully describe human category learning across a wide range of tasks. These tasks involve objects with features that are separable or integral (e.g., Nosofsky, 1986, 1987) and discrete or continuous (e.g., Cohen et al., 2001), categories that are artificial or naturalistic (e.g., Nosofsky et al., 2018) and include numerous or few exemplars (e.g., Maddox & Ashby, 1993), and environments in which categories do or do not overlap (e.g., Ell & Ashby, 2006) and are linearly or nonlinearly separable (e.g., Shepard et al., 1961). Although these models account for category learning, they often do not address the variability that people may show when transferring their category knowledge to new objects—across trials, a model makes the same prediction for the same object.
Yet behavioral variability is an important component of human categorization. During categorization, people perceive an object, process it to compute the evidence for different categories, and finally select a category response (Fig. 1; see also Wills & Pothos, 2012). Each of these steps can be a source of behavioral variability and thus of deviations from constant model predictions: During perceptual intake, people may perceive an object variably and differently from what serves as model input (e.g., Ashby & Lee, 1993). During cognitive processing, people may (compared with a model) compute category evidence in an imprecise and variable way (e.g., Wyart & Koechlin, 2016). Finally, during response selection, people may select a category other than the one that appears correct, which can be a pure error or the result of contextual factors limiting response precision (e.g., Seitz, von Helversen, et al., 2023). For each step of the categorization mechanism, the current work examines factors that may cause behavioral variability. We also present a simulation that disentangled these sources of behavioral variability in a similarity-based categorization model. Ultimately, our approach may not only inform categorization models but also help determine which step of the categorization mechanism one needs to target in interventions aimed at reducing behavioral variability in human categorizations.
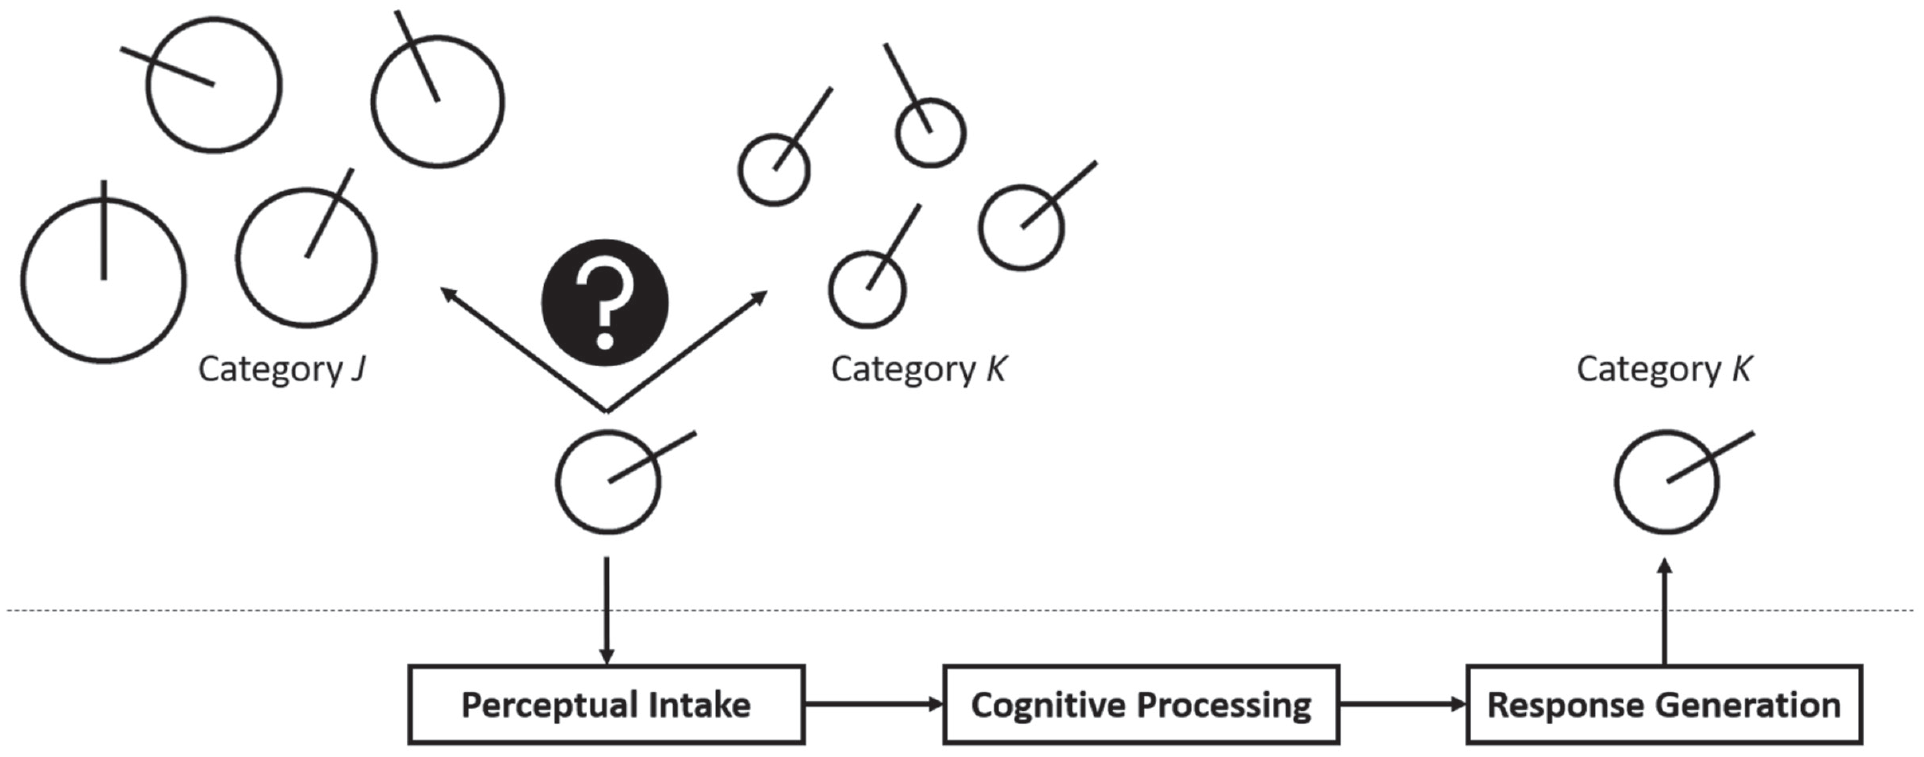
Visualization of the categorization mechanism. In this example, objects are geometric figures with two features: a circle varying in size and a line varying in orientation. People first perceive the to-be-categorized object, then compute the evidence that it belongs to different categories, and finally select a category response. Each of these steps may be a source of behavioral variability.
The Importance and Difficulty of Identifying Behavioral Variability
Behavioral variability in categorization is ubiquitous but often undesirable. A physician who diagnoses the presence of skin cancer on the basis of medical imaging should not exhibit behavioral variability but consistently make the correct diagnosis. For interventions such as diagnosis training to be successful, it is important to know where the behavioral variability originates. However, this can prove difficult, notably because variability can be confused with biases in categorization data. Here, we focus on binary categorizations (analogous principles hold for multiclass classification) and define variability as the variance of a person’s category responses for a stimulus and bias as the difference between the person’s mean category response for this stimulus and the stimulus’ true category label. Crucially, the mean and variance are interdependent: As the response variance increases, the mean response shifts toward a random response (.5 for either category in the binary case). Figure 2 illustrates the relation between bias and variability: Relative to the upper baseline case, the mean response, represented as a diamond, is shifted further away from the correct category label in the case of more bias and closer to random choice in the case of more variability. As the arrows in Figure 2 show, these response shifts can go into the same direction, highlighting the interdependence of bias and variability.
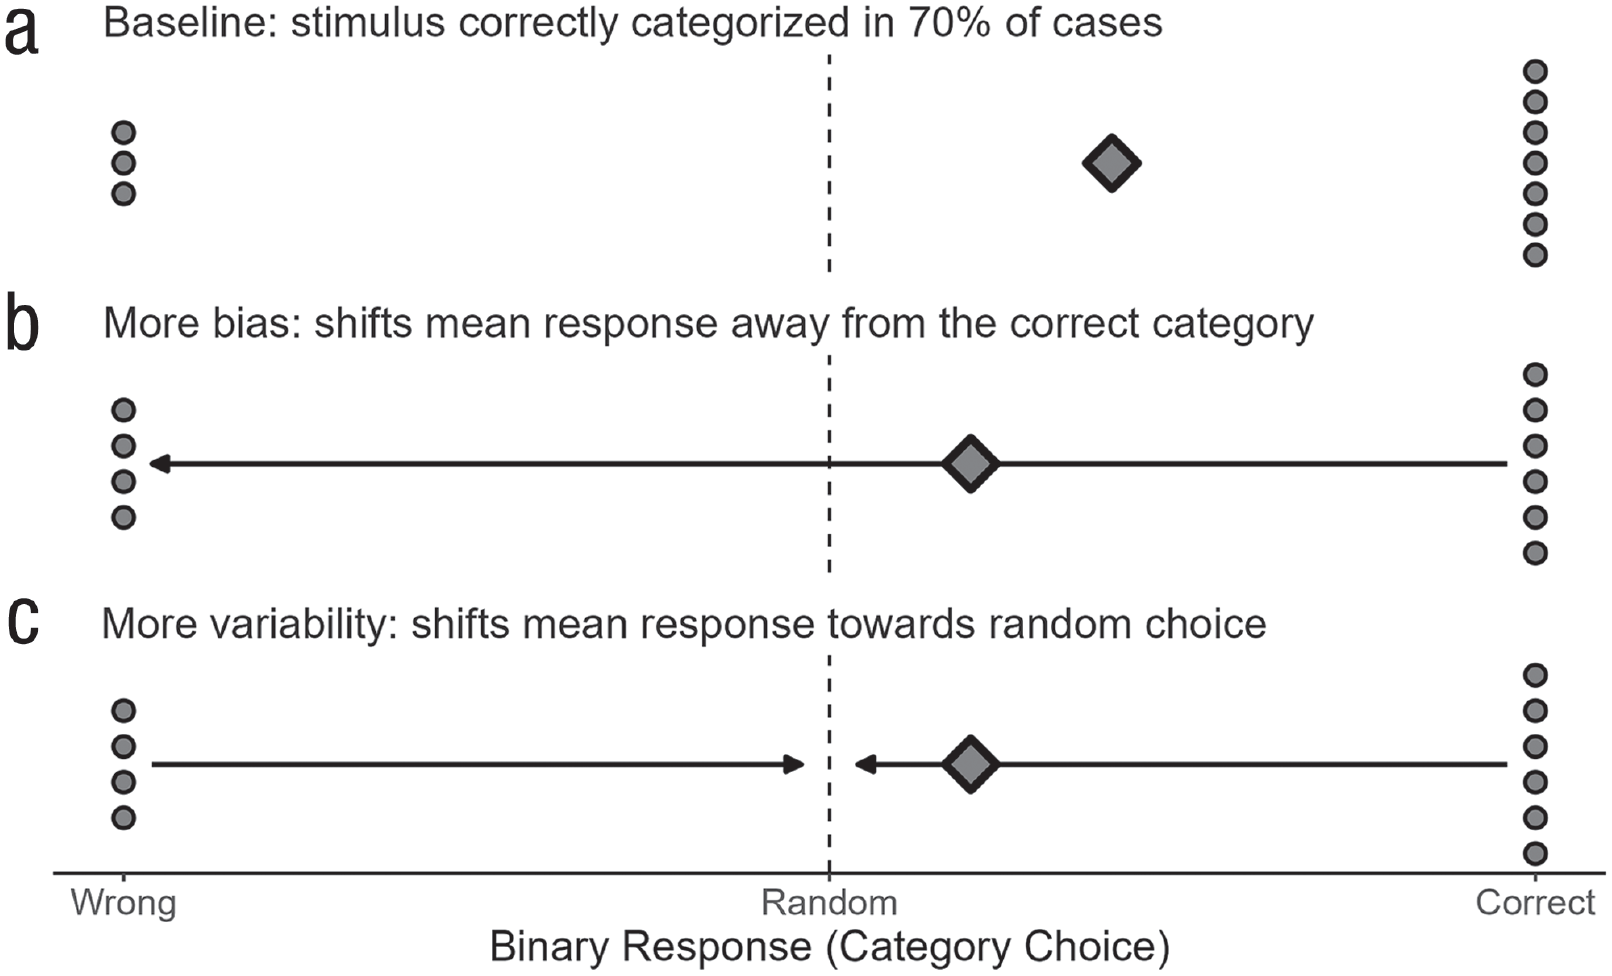
Interdependence of bias and variability in (binary) categorization data. The points show a person’s repeated category responses for one object; the diamond represents the mean response. More bias increases the difference between the mean response and the correct category; more behavioral variability shifts the mean response toward random choice.
From a psychological perspective, however, identifying behavioral variability seems possible only if one can distinguish it from a bias. Assigning an object sometimes to the wrong category can have various psychological reasons. For instance, noise in the form of random fluctuations during perceptual and cognitive processes might sometimes make the wrong category appear as the correct one. Alternatively, one might use a suboptimal (biased) categorization strategy that provides only limited evidence for the correct category. In both cases, a probabilistic response pattern emerges—the psychological conditions giving rise to it, however, are completely different.
The remainder of the article is structured as follows: We first provide an overview of major categorization theories and their sources of behavioral variability during perceptual intake and cognitive processing. We then present a simulation that formalized various such sources in a cognitive categorization model. One key result of the simulation was that continuous data helped to identify the source of behavioral variability. In the final section, we discuss how continuous data can be integrated into a categorization experiment and how this can also help to distinguish behavioral variability from behavioral biases.
Perceptual Categorization Theories and Behavioral Variability
This section introduces the main theories from the literature on perceptual categorization (Palmeri et al., 2004), which categorize objects on the basis of similarity (Medin & Schaffer, 1978; Nosofsky, 1986) or rules (e.g., Ashby & Gott, 1988; Nosofsky et al., 1994).
Similarity-based categorization theories assume that people assign an object to the most similar category (Nosofsky, 1986; Smith & Minda, 1998). This means people compute the object’s similarity to representatives of each category, which can be individual exemplars or abstracted prototypes (Nosofsky & Zaki, 2002). The more similar an object is to the representatives of one category (relative to alternative categories), the more likely it belongs to that category. Thus, similar objects are grouped into the same category—an assumption that has received substantial support from categorization experiments (Minda & Smith, 2002; Nosofsky, 1984, 1986, 1987, 1989; Nosofsky & Palmeri, 1997; Nosofsky & Zaki, 2002; Seitz, Jarecki, Rieskamp, 2023; Seitz, von Helversen, et al., 2023; Smith & Minda, 1998, 2000, 2002). More recent research has successfully applied similarity-based models to natural-object domains (Battleday et al., 2020; Meagher & Nosofsky, 2023; Nosofsky et al., 2022; Sanders & Nosofsky, 2020), providing further evidence that people categorize objects on the basis of their similarity to category representatives.
Rules, in turn, describe the conditions for category membership. Some rules specify the features needed for belonging to a category (Nosofsky et al., 1994); other rules specify the boundaries between categories and associate each resulting region of the feature space with a category response (Ashby & Gott, 1988). The two kinds of rules can be seen as complementary—one focuses on the content of the categories, and the other focuses on their borders (Kruschke, 2008). Rules can vary in complexity from being based on a single feature to combining several features in an intricate way. Some of these more complex rules can still be easily verbalized (e.g,. a conjunctive rule that combines two unidimensional rules with a logical AND), whereas others are almost impossible to verbalize (e.g., a diagonal decision rule in feature space). Categorization experiments have demonstrated that people can learn a variety of rules (Ashby & Gott, 1988; Ashby & Maddox, 1990, 1992; Ashby & Perrin, 1988; Maddox & Ashby, 1993; Maddox et al., 2004; Nosofsky & Palmeri, 1998; Nosofsky et al., 1994), and often these rules approximate optimal behavior that maximizes accuracy.
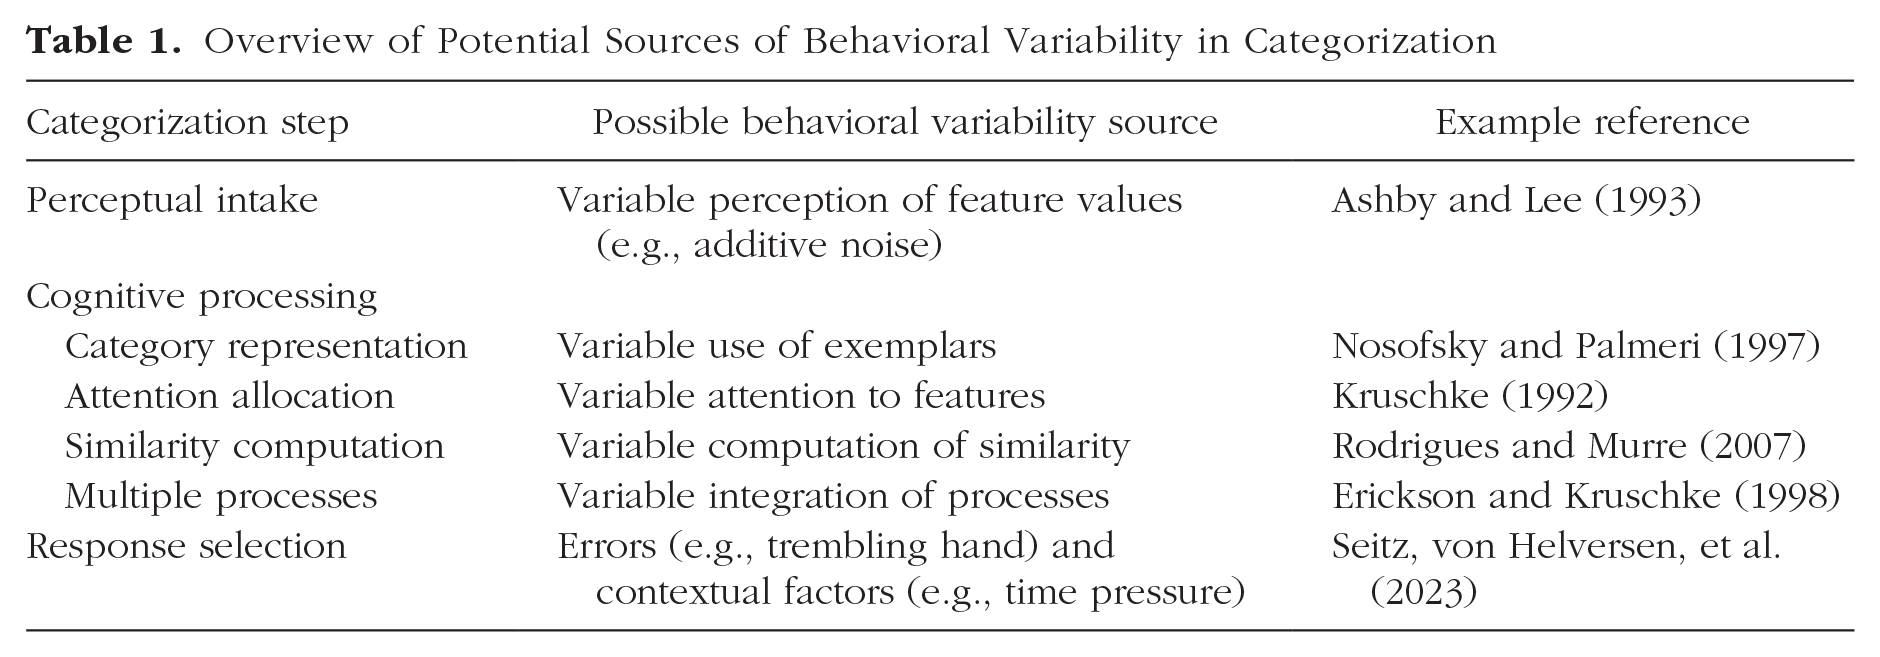
Although categorization models based on similarity or rule processes coincide in terms of perceptual intake (representing objects as vectors of feature values), they often differ in terms of response selection (deterministic or probabilistic). Deterministic models always select the most probable category according to the cognitive process used; probabilistic models, in turn, select responses in proportion to the probabilistic category beliefs (Maddox & Bohil, 2004). Response selection is usually formalized with a choice rule (Jarecki & Seitz, 2020; Nosofsky & Zaki, 2002; for an alternative, see Cavagnaro & Regenwetter, 2023). Whereas rules typically assume a deterministic choice rule (Ashby & Gott, 1988; Nosofsky et al., 1994) or a fixed error rate (trembling hand error; Scheibehenne et al., 2013), similarity-based categorization models use probabilistic choice rules that produce more or less variable behavior (Medin & Schaffer, 1978; Nosofsky, 1986; but see Ashby & Maddox, 1993; Maddox & Ashby, 1993). Similarity-based categorization models thus provide a particularly useful tool for analyzing behavioral variability; we now discuss potential sources of behavioral variability in similarity-based categorization models, focusing on perceptual intake and cognitive processing (for an overview, see Table 1).
Overview of Potential Sources of Behavioral Variability in Categorization
Perceptual intake
Categorization variability can originate in perceptual processes, namely when people imprecisely perceive the feature values of a to-be-classified object (Alfonso-Reese, 2001; Ashby, 1992; Ashby & Lee, 1993; Maddox, 2001; Maddox & Bogdanov, 2000; Peterson et al., 2019). In Figure 1, for example, the object may be assigned to Category B in trials in which the object’s circle size was correctly perceived or underestimated and to Category A in other trials in which the circle size was overestimated. In other words, a noisy perception of the feature “circle size” leads to a variable categorization of the to-be-classified object. This applies in particular to objects close to the category boundary, where misperception on a (diagnostic) feature can actually change categorizations; responses to objects far away from the boundary should remain largely unaffected by perceptual noise. Note that the perceptual imprecision above stems from noise across trials—on average, the features are correctly perceived. Alternatively, people can have a biased perception and systematically misperceive features in a certain direction. Such a perceptual bias leads to a shift in the category predictions, which at the response level, however, can also manifest itself as a change in behavioral variability because bias and variance are related in categorization data. In sum, a perceptual representation that differs from the physical features of the objects (in the form of a bias or noise) can lead to behavioral variability in categorizations.
Perceptual imprecision is supported by empirical evidence (Alfonso-Reese, 2001; Nosofsky, 1986; Petzschner et al., 2015) and can be caused by the object (e.g., physical noise such as the probabilistic emission of photons by a light source of constant intensity) or the organism (e.g., sensory noise such as a variation in pupil size; Ashby & Lee, 1993). When asked to adjust the features of a stimulus until they match those of a fixed reference stimulus, participants typically adjust the features insufficiently (Alfonso-Reese, 2001). The adjusted stimuli vary around the true reference stimulus, and interestingly for some features more than for others, suggesting that perceptual imprecision may be feature-specific. Perceptual imprecision is known for a wide range of features, including the size of lines (Stevens, 1960), rectangles (Krantz & Tversky, 1975), and circular stimuli (Nosofsky, 1986), angles (Petzschner & Glasauer, 2011), and color brightness (Nosofsky & Palmeri, 1996). In addition, people’s perception depends on a feature’s range of values (Petzschner & Glasauer, 2011) and is typically biased toward the mean of the presented feature values, with larger and more variable deviations for larger feature values (Petzschner et al., 2015).
Perceptual imprecision can affect cognitive inferences such as identifications and categorizations (Ashby, 2000; Maddox, 2001). Alfonso-Reese et al. (2002) found that categorization tasks, for which the maximally achievable accuracy decreases sharply with perceptual noise, are more difficult to learn than tasks that are unaffected by perceptual noise. Particularly difficult to learn are categories that are close to each other in space and have strongly correlated features (Ashby et al., 2020; Edmunds et al., 2015; Nosofsky et al., 2005), presumably because they are heavily affected by perceptual noise (Alfonso-Reese et al., 2002). Other research suggests that increasing expertise in a categorization task can make objects’ perceptual representations more distinct (Goldstone, 1998; Goldstone et al., 2001; Palmeri et al., 2004). In particular for locations close to category boundaries, perceptual expertise allows for a high categorization accuracy by minimizing the probability that an object’s percept lies on the wrong side of a decision boundary.
Although cognitive models of categorization often take an object’s features directly as input, there are methods for incorporating perceptual imprecision. Multidimensional scaling can reveal perceptual biases by modeling people’s perceptual feature space (e.g., Shepard, 1962a, 1962b). In addition to completing a categorization task, participants provide similarity relations for the same objects (e.g., pairwise similarity judgments or confusion errors during object identification; Nosofsky, 1986, 1989; Sanders & Nosofsky, 2020). Multidimensional scaling locates the objects in a feature space according to the provided similarity relations: Similar objects end up close to each other, and dissimilar objects end up further apart. Importantly, the inferred locations in space do not reflect the physical objects but instead represent their perceptual representations, which can then be used to model the categorization data. Note that for real-world objects psychologically interpreting the features that result from multidimensional scaling can be complicated because they need not correspond to the features of the physical space (Hebart et al., 2020; Izydorczyk & Bröder, 2023). Other research has addressed perceptual noise by modeling the perceived feature values of an object by a multivariate normal distribution, which contains a variance term for each feature (Ennis et al., 1988; Ennis & Johnson, 1993). This idea was central to the development of general recognition theory, which models the decision boundaries between categories for objects with a noisy percept (Ashby & Perrin, 1988; see also Ashby, 1992).
Cognitive processing
Behavioral variability can also originate during cognitive processing (Newell & Bröder, 2008). On the one hand, the human mind may perform a single process in a variable way (e.g., when computing the similarity to the category representatives). On the other hand, the human mind often combines multiple processes, and variability may arise if different weight is given to the individual processes across trials. We now elaborate on these factors, focusing on processes relying on the similarity to category representatives.
Category representations
There is a long-standing debate about whether the human mind represents categories by their individual members (exemplars; Nosofsky, 2011) or summary abstractions (prototypes; Minda & Smith, 2011). The exemplar theory claims that people store objects as exemplars in memory and assign a new object to the category to whose exemplars it is most similar. The prototype theory, in turn, summarizes each category by a prototype that corresponds to the category’s central tendency (the mean value for each feature) and assigns a new object to the category with the most similar prototype. In both theories, the probability of choosing a category increases with an object’s similarity to this category relative to its similarity to other categories (Nosofsky & Zaki, 2002), and this relationship is usually formalized by a variant of Luce’s (1959) choice rule. In its simplest form, the choice rule computes the probability that object i belongs to category J as the similarity
Recent research suggests that the human mind uses the two kinds of representations very flexibly. For instance, it has been suggested that prototypes and exemplars form the ends of a continuum that also contains intermediate stages in which multiple prototypes per category are formed (Verbeemen et al., 2007; Vanpaemel & Storms, 2008). The idea of an exemplar-prototype continuum also fits nicely with the finding that people sometimes shift from one representation to the other with increasing experience (e.g., Homa et al., 1981). Furthermore, the exemplar retrieval from memory does not have to be deterministic and include all exemplars (an integrative retrieval) but can also rely on a few probabilistically selected exemplars (a competitive retrieval; cf. Albrecht et al., 2020). Models implementing such a competitive retrieval (e.g., Nosofsky & Palmeri, 1997) in general formalize the probability that an exemplar is retrieved to be proportional to its similarity to the to-be-classified object. Because the competitive retrieval is probabilistic, however, different exemplars may be retrieved for the same object in different trials, which can result in behavioral variability.
Although competitive and integrative retrievals clearly differ from each other conceptually, they often make similar predictions. As Albrecht et al. (2020) noted, a competitive retrieval that samples only one exemplar makes the same average categorization predictions as an integrative retrieval. Simply put, the response prediction that results from averaging across all exemplars equals the average response prediction resulting from retrieving only one exemplar. More formally, consider a model that assigns any object
Similarity computation
Behavioral variability can also originate when computing an object’s similarity to the category representatives. There are several approaches to similarity computation (for an overview, see Goldstone & Son, 2012; Roads & Love, 2023)—particularly well studied is the geometric approach, which assumes that two objects’ similarity is based on their distance in feature space (cf. Nosofsky, 1986). Specifically, an object’s feature values determine its coordinates in space, and the larger the distance

where
In the similarity framework of Equation 1, behavioral variability can for instance emerge during attention allocation, namely when the human mind distributes its attention to the object features differently across trials. Attention may fluctuate over time so that more attention is paid to one feature in some trials and to another feature in other trials (for a related idea on a probabilistic inclusion of features into the similarity computation process, see Lamberts, 1995, 1998; Lamberts & Brockdorff, 1997). If an object with two features differs equally from two categories but on a different feature, it is assigned to one category if one feature receives a lot of attention and to the other category if the other feature receives a lot of attention. Previous research has shown that attention can be exemplar-specific (Rodrigues & Murre, 2007; Sakamoto et al., 2004) and region-specific (Nosofsky & Hu, 2023) and that it may be reallocated as features are added or removed (Seitz, 2023). Furthermore, posterior distributions of the attention weights in Bayesian parameter estimations suggest that people do not distribute attention to the features in a perfectly constant way across trials (however, these results need to be handled with care because the data are aggregated across participants; M. Lee & Wetzels, 2010; Vanpaemel, 2009). Like in the distinction between noise and biases during feature perception, random attention fluctuations also need to be distinguished from directed shifts in attention: During category learning, attention can be selectively shifted to features that determine category membership, thereby maximizing categorization accuracy (called “selective attention”; Kruschke, 1992; Nosofsky, 1986, 1989). Adaptations in the distribution of attention can thus be expected as a sign of learning—but in the absence of learning, noisy attention may lead to behavioral variability.
Behavioral variability might also arise at a more general level during similarity computation. For instance, the human mind may possess various ways to compute similarity (Seitz, Jarecki, & Rieskamp, 2023; Tversky, 1977) and even combine different ways to compute similarity (Navarro & Lee, 2002). In a similar way, the distance sensitivity parameter
Multiple cognitive processes
Behavioral variability can arise not only within a cognitive process but also when several processes are combined into a categorization strategy. Rules and similarity are often considered two distinct systems of category learning (cf. Ashby et al., 1998). Yet it is often not easy to distinguish between the two processes: A unidimensional rule makes similar predictions as a similarity-based process that strongly weights the feature that determines category membership according to the rule (Nosofsky et al., 1989). Accordingly, it is sometimes also claimed that rules and similarity represent the ends of a continuum (Newell et al., 2011; Pothos, 2005; Verguts & Fias, 2009). Irrespective of the theoretical viewpoint, if the human mind relies on both processes to perform categorizations, behavioral variability can emerge.
Decision-making theory has proposed two ways of how rules and similarity-based processes interact: shifting between the two processes (e.g., using a rule in one trial and similarity in another trial) and blending both processes within trials (e.g., averaging the predictions of both processes to form a hybrid response; see Bröder et al., 2017; Herzog & von Helversen, 2018). Empirical evidence shows that people shift between rules and similarity-based processes depending, among other things, on the task (Hoffmann et al., 2016; Mata et al., 2012; Trippas & Pachur, 2019; von Helversen et al., 2010, 2013). For example, people may rely on explicit rules to solve tasks determined by a single feature (rule-based tasks) but on implicit similarity processes in tasks that require the integration of information from multiple features (information-integration tasks; see Ashby & Ell, 2001; Ashby et al., 1998, 2020). Shifting between processes may also occur within a task across trials (see Rouder & Ratcliff, 2006; Thibaut et al., 2018). In a rule-plus-exception task, people generally use a (unidimensional) rule and store exceptions to this rule that can influence the classification of similar stimuli (Erickson & Kruschke, 2002; Nosofsky et al., 1994; Nosofsky & Palmeri, 1998). Finally, people can blend the two processes within trials (Albrecht et al., 2020; Bröder et al., 2017; Erickson & Kruschke, 1998). For instance, even in clear rule-based tasks, the classification of transfer stimuli still often also depends on their similarity to previously experienced exemplars (Allen & Brooks, 1991; Hahn et al., 2010; Lacroix et al., 2005; Thibaut & Gelaes, 2006).
Many more recent categorization models have combined rule and similarity-based processes (Anderson & Betz, 2001; Erickson & Kruschke, 1998; Love et al., 2004; Schlegelmilch et al., 2021). For instance, Erickson and Kruschke (1998) described a blending model that predicts categorizations on the basis of a weighted average between a similarity module and a rule module. Anderson and Betz (2001), in turn, assumed that in any categorization trial people will select between a similarity-based and a rule-based process. The process with the greatest utility will be selected with the highest probability, but occasionally people may choose the process with lower utility. Accordingly, people may apply different categorization processes across the repetitions of the same stimulus, which can lead to behavioral variability. Schlegelmilch et al. (2021) assumed a probabilistic learning of rules based on similarity processes. Behavioral variability is caused by differences in the strength of belief in the success of a rule. In other words, this model explains changes in behavioral variability across learning as the search for an appropriate strategy (high variability) that, once found, is executed consistently (low variability). Furthermore, the model learns partial rules that are applied only in specific contexts in which they are found to be successful.
Response selection and contextual factors
Generally, people aim to maximize categorization accuracy. To this end, they should consistently choose the category to which the object most likely belongs, formally denoted by the arguments of the maxima choice rule. Deviations from such an idealistic classifier are quickly imagined as unsystematic errors in response selection. However, this need not be the case: Particularly at the beginning of a categorization task, people match their response proportions to their probabilistic category beliefs and shift to deterministic responding only after gaining experience and finding a successful categorization strategy (Ashby & Maddox, 1992; Maddox & Bohil, 2004). Furthermore, behavioral variability can result from contextual factors that affect response precision or also the perceptual and cognitive processes previously discussed.
For instance, limiting people’s cognitive capacities (e.g., through time pressure) makes their categorizations more variable without, however, affecting the modal responses (Lamberts, 1995; Seitz, von Helversen, et al., 2023). A cognitive model can capture this with changes in the value of a parameter that reflects overall response variability in a probabilistic choice rule (Seitz, von Helversen, et al., 2023). People thus seem to keep using the same categorization strategy even under time pressure, but execute it with less precision (in addition to perceptual and attentional changes; e.g., Lamberts & Brockdorff, 1997; Wills et al., 2015). These findings are in line with evidence from studies on preferential choices that have found that cognitive-capacity limitations primarily affect people’s response variability and not the underlying preference itself (Olschewski et al., 2018; Olschewski & Rieskamp, 2021).
Similarly, the same object may be classified differently depending on the previously presented object, inducing sequence effects (Stewart et al., 2002; Yang & Wu, 2014). Interestingly, this seemingly random response behavior can be formalized by a simple cognitive strategy according to which the probability of choosing the same category as in the previous trial is based on the similarity between the stimuli of the two trials (Stewart et al., 2002). Such sequence effects might have their origin in perceptual intake because the perception of a stimulus is influenced by stimuli presented on previous trials (Jones et al., 2006). Relatedly, people sometimes try to detect patterns concerning category membership in the sequence of presented objects and to this end select categories proportionally to their evidence (Gaissmaier & Schooler, 2008).
Finally, behavioral variability may be larger in more difficult categorization tasks, such as tasks with a large category overlap (addressed in the subsequent simulations). Category overlap makes a categorization task probabilistic (the feedback a category learner receives is not consistent across the repetitions of a stimulus) and thereby promotes probabilistic category responses as well (Jarecki et al., 2018; Little & Lewandowsky, 2009b). Indeed, people have been found to respond by matching their category responses to the actual category probabilities (probability matching; e.g., Little & Lewandowsky, 2009a). Moreover, exemplar-specific rewards for correct answers can affect behavioral variability (Maddox & Bohil, 1998), for example, by altering the distance sensitivity (Schlegelmilch & von Helversen, 2020), further highlighting the importance of contextual factors.
Summary
This section gave an overview of potential sources of behavioral variability in categorization. During perceptual intake, the translation of physical into perceptual feature values can be noisy (Ashby & Lee, 1993). This may lead to behavioral variability, for example, because the object’s percept crosses a category boundary in some trials. Similarly, cognitive processing may be subject to variability either within a single process (e.g., during attention allocation or similarity computation; Nosofsky, 1984; Seitz, Jarecki, & Rieskamp, 2023) or when combining multiple processes (e.g., combining similarity-based and rule-based processes; Erickson & Kruschke, 1998). Finally, behavioral variability can also arise from errors in response selection and contextual factors, such as time pressure, that limit the precision with which one can perform a categorization process.
Model Simulation
To disentangle the different sources of behavioral variability in categorizations, we ran simulations with an exemplar model (Nosofsky, 1986). The model categorizes objects on the basis of a variant of Luce’s choice rule; we implemented the softmax choice rule. Given two categories

where

The distance norm
We ran simulations for two frequently used category structures—rule-based and information-integration structures (e.g., Ashby et al., 1998; Ell & Ashby, 2006; Maddox et al., 2003, 2004). In rule-based structures, category membership is determined by a single feature, and the optimal decision boundary is perpendicular to that feature. In information-integration structures, in turn, category membership is determined by multiple features conjointly, and the optimal decision boundary lies at an oblique angle to the features in space. Our simulations were based on the binary categorization tasks of Ell and Ashby (2006), who used rule-based and information-integration structures for objects with two features with various degrees of overlap between the two categories. The category overlap describes the extent to which a categorization task is probabilistic, in the sense that a feature value combination may be associated with multiple categories, and is therefore a useful proxy for the task difficulty. Ell and Ashby implemented five category overlap conditions (see their Table 1)—our simulations adopted the three intermediate conditions, which we labeled “low,” “medium,” and “high” overlap. As in Ell and Ashby, each category is represented by a bivariate normal distribution, defined by the two features’ means, variances, and covariance. Our simulations abstracted away from the visualization of the features and pertain to any kind of objects with two features. 3 We rescaled the feature values by a factor of .1 to ensure they lie in a typical range for exemplar models. The resulting values for the two categories (labeled “left” and “right” on the basis of their mean value on Feature 1) are shown in Table 2 and visualized in Figure 3.
Bivariate Normal Distribution Parameters Used to Create the Learning Stimuli for the Rule-Based and Information-Integration Tasks at Different Levels of Category Overlap

Note: The parameter values are based on the medium-low, medium, and medium-high conditions from Ell and Ashby (2006); for simplicity, we call the conditions “low,” “medium,” and “high,” respectively. Variances and covariances apply to both categories.
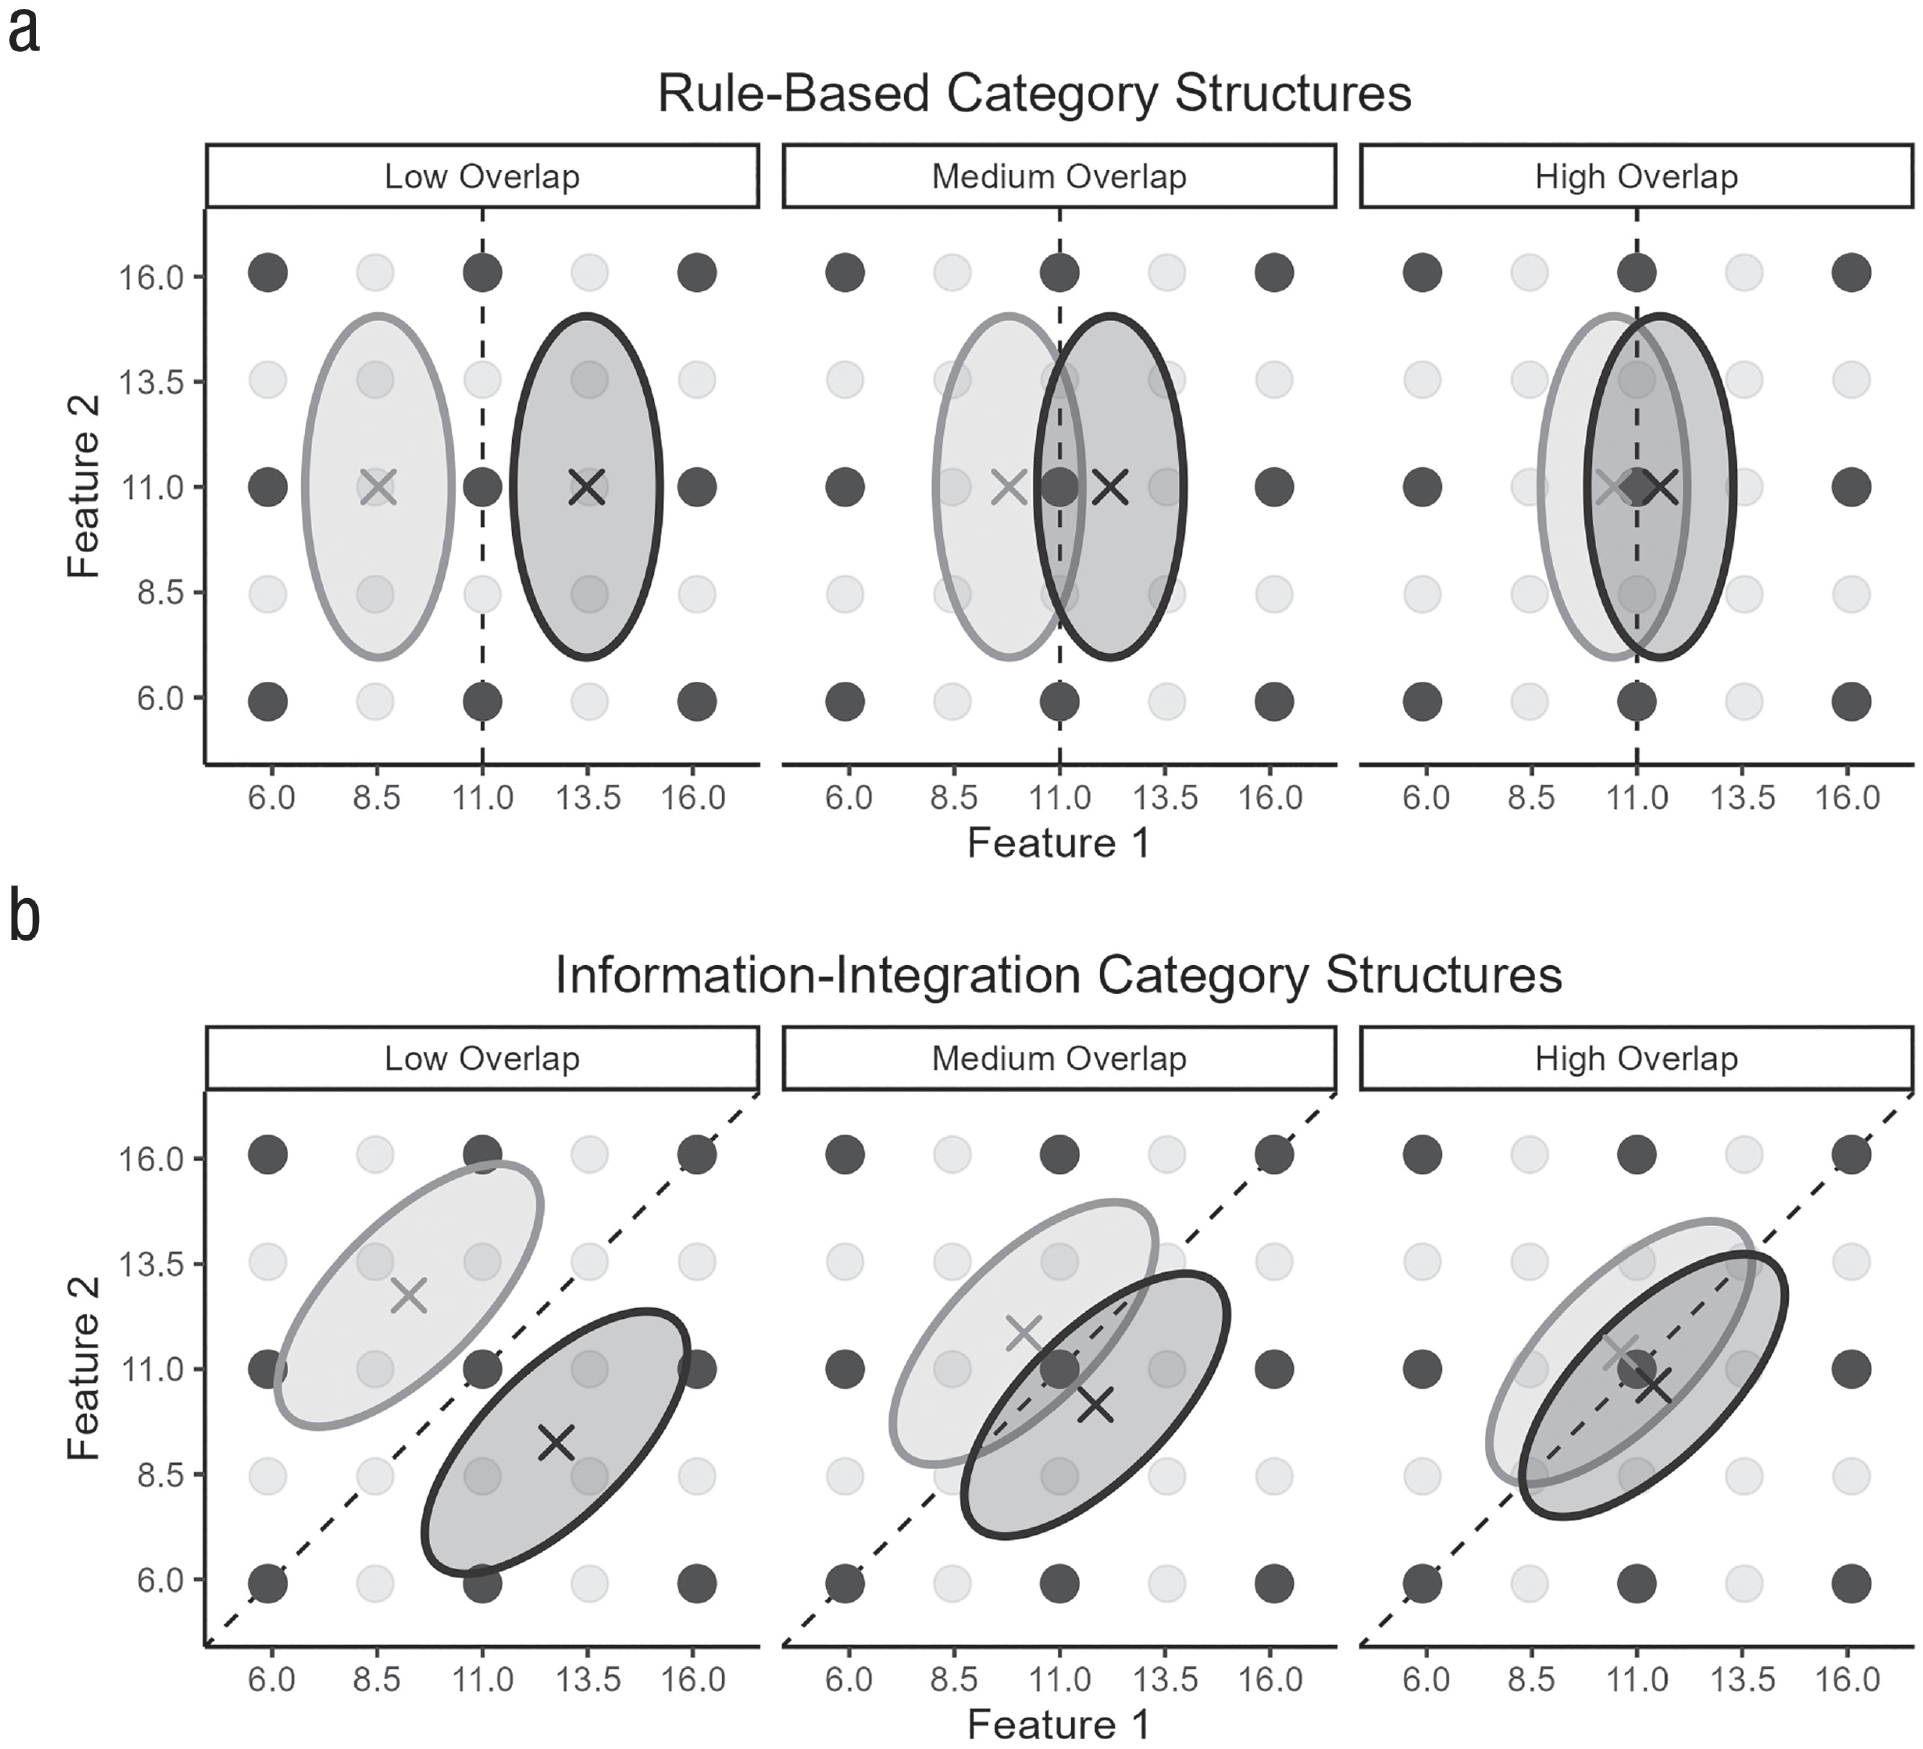
Visualization of the (a) rule-based category structures and (b) information-integration category structures with a low, medium, or high category overlap. Each category is represented by the mean feature values (x) and the 95% density ellipse (left category in light gray; right category in dark gray). The 25 dots show the transfer stimuli that were fixed throughout the simulations (for clarity, Figs. 5 and 6 show the results only for the nine highlighted stimuli). Dashed lines show the category boundary maximizing accuracy.
For each of the six category structures, 100 exemplars per category were sampled according to the category distributions specified in Table 2. Parameter values were also randomly sampled for the exemplar model from uniform distributions (i.e., the attention weight

with the standard deviations
For each of the six category structures, 500 simulation iterations were run, and at each iteration, new exemplars and parameter values were sampled. Given the exemplars and parameter values, the simulation applied one of the five forms of noise (i.e., no noise, noisy perception, noisy attention, noisy sensitivity, or noisy similarity) when making predictions for the transfer stimuli per Equation 2. We analyzed how trial-specific noise affected (a) the parameter recovery when the exemplar model was fit to binary category responses
Parameter recovery
The model parameters were well recovered from the binary category responses in the noise-free case. Figure 4 shows the true and estimated values for the attention weight
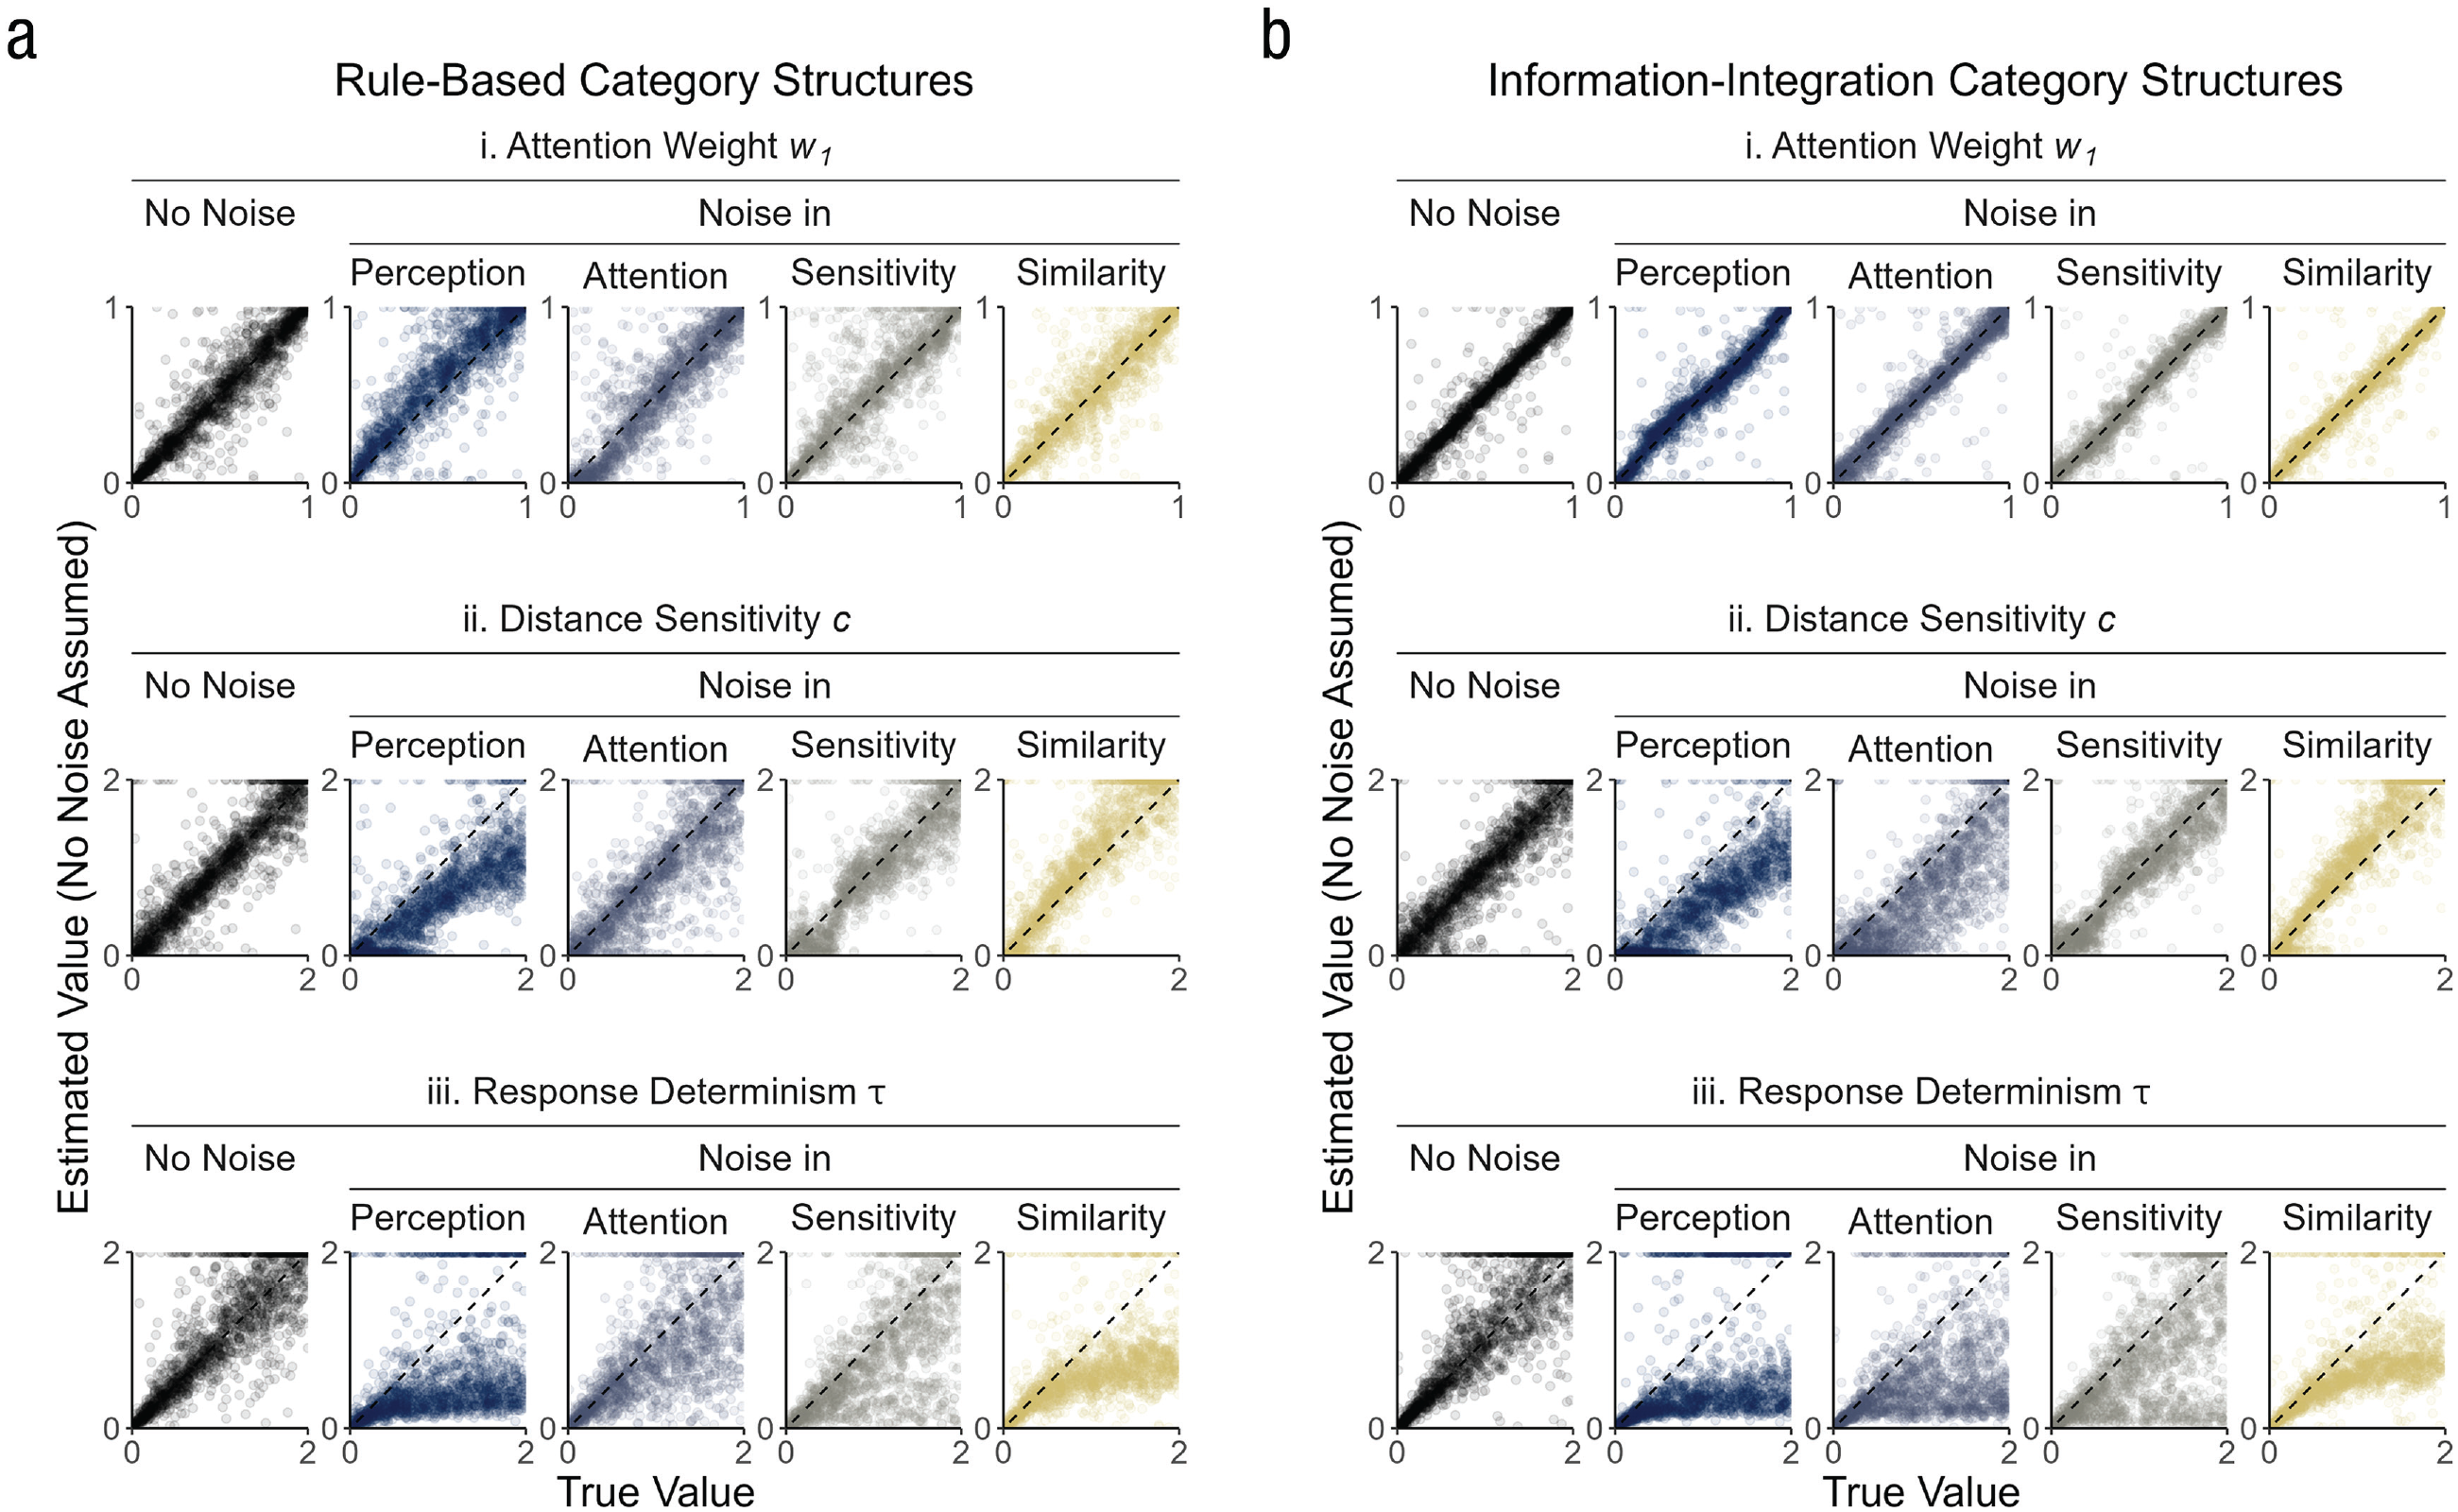
Parameter recovery for the attention weight
Adding noise considerably worsened the parameter recovery. Although the estimated values for the attention weight parameter
These results show that the different parameters reflected the variability in the data to different degrees. The attention weight parameter
Binary category responses
If noise deteriorates the parameter recovery, it must also affect the binary category responses from which the parameters are estimated. Determining the source of the variability from the category responses, however, is difficult. Figure 5 shows that the response proportions for the individual transfer stimuli were on average very similar across the different forms of noise (for the results in the individual overlap conditions, see Fig. A1). In other words, regardless of what form of noise was administered, the model chose categories fairly deterministically for the transfer stimuli close to a category (the three transfer stimuli on the far left and far right of Fig. 5) and randomly for the transfer stimuli on the category boundary (the three stimuli in the middle of Fig. 5).
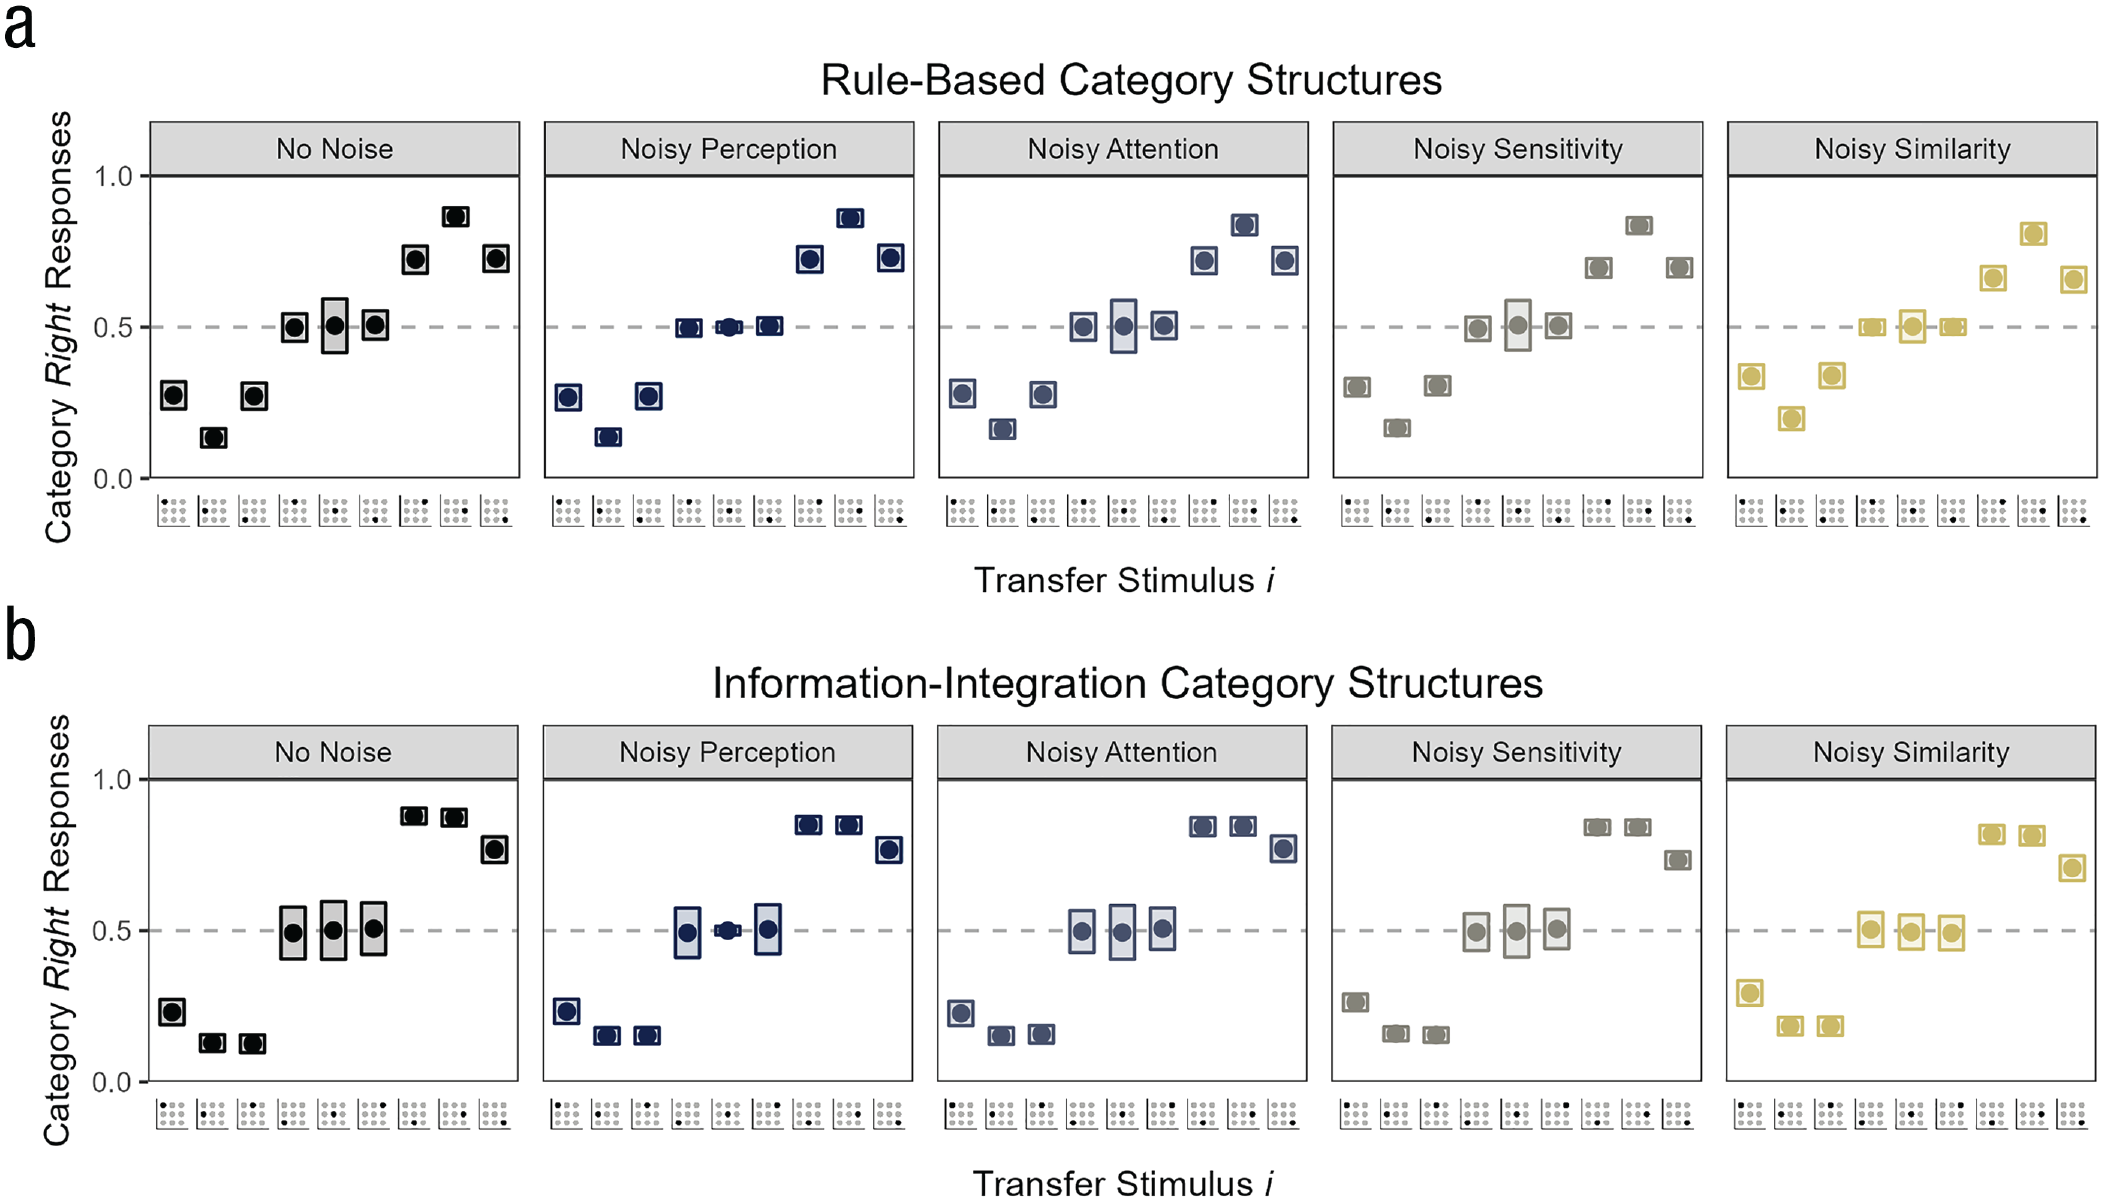
Simulated binary category responses under different forms of noise for the (a) rule-based category structures and (b) information-integration category structures. For each transfer stimulus on the x-axis (shown are the nine stimuli highlighted in Fig. 3), the y-axis shows the mean and the variance of the response proportions for the right category across simulation iterations.
The response proportions also varied across the iterations of the simulation in a similar way for the different forms of noise. The rectangles in Figure 5 show that the response proportions varied notably only for the stimuli on the category boundary, and this variance was similar for the conditions with no noise, noisy attention, noisy sensitivity, and noisy similarity (e.g., for the central transfer stimulus, the mean variance across category structures was
Continuous category predictions
One way to gain deeper insights into the source of the variability in a categorization experiment might be to include some form of continuous data that has a finer degree of resolution than the binary category responses discussed above. This builds a bridge to the related, extensive literature on quantitative judgment (Hoffmann et al., 2013, 2014; Juslin et al., 2003, 2008; Karlsson et al., 2007; Scheibehenne et al., 2015; von Helversen et al., 2014) that has already shown that a continuous criterion can be helpful in explaining various aspects of response distributions (e.g., Albrecht et al., 2020; Collsiöö et al., 2023; Sundh et al., 2021). For instance, Albrecht et al. (2020) rigorously compared different quantitative judgment models for their ability to predict response distributions, including similarity-based models with a competitive or integrative exemplar retrieval, a rule-based model, and two blending models. Interestingly, the competitive exemplar retrieval can predict multimodal response distributions within stimuli, because in each trial in which the stimulus is presented different exemplars may be retrieved. In contrast, the deterministic integrative retrieval can predict only unimodal response distributions. In their experiments, individual participants displayed multimodal response distributions in line with the predictions from a blending model combining a competitive exemplar retrieval with a rule-based process. The multimodality stemmed from the competitive exemplar retrieval; blending by itself leads to unimodal response distributions (compared with trial-wise shifting, which also can lead to multimodal response distributions).
Looking at continuous category predictions could have similar benefits in our simulation, and probabilistic categorization models are good candidates to test whether different forms of noise affect the continuous predictions differently. Figure 6 shows the exemplar model’s continuous category predictions per Equation 2 for our simulation (for the results in the individual overlap conditions, see Fig. A2). Similar to the category responses, the mean predictions for the different transfer stimuli were very similar across the noise conditions (i.e., close to .5 for the stimuli on the category boundary and relatively deterministic for the remaining transfer stimuli). This makes sense given that the category responses were directly sampled from the continuous predictions. In contrast, the variability of the predictions within simulation iterations (the rectangles in Fig. 6) revealed the source of the trial-specific noise. Compared with the condition without noise (in which the within-iteration variability was of course zero), the four forms of noise increased the prediction variability in distinct ways.
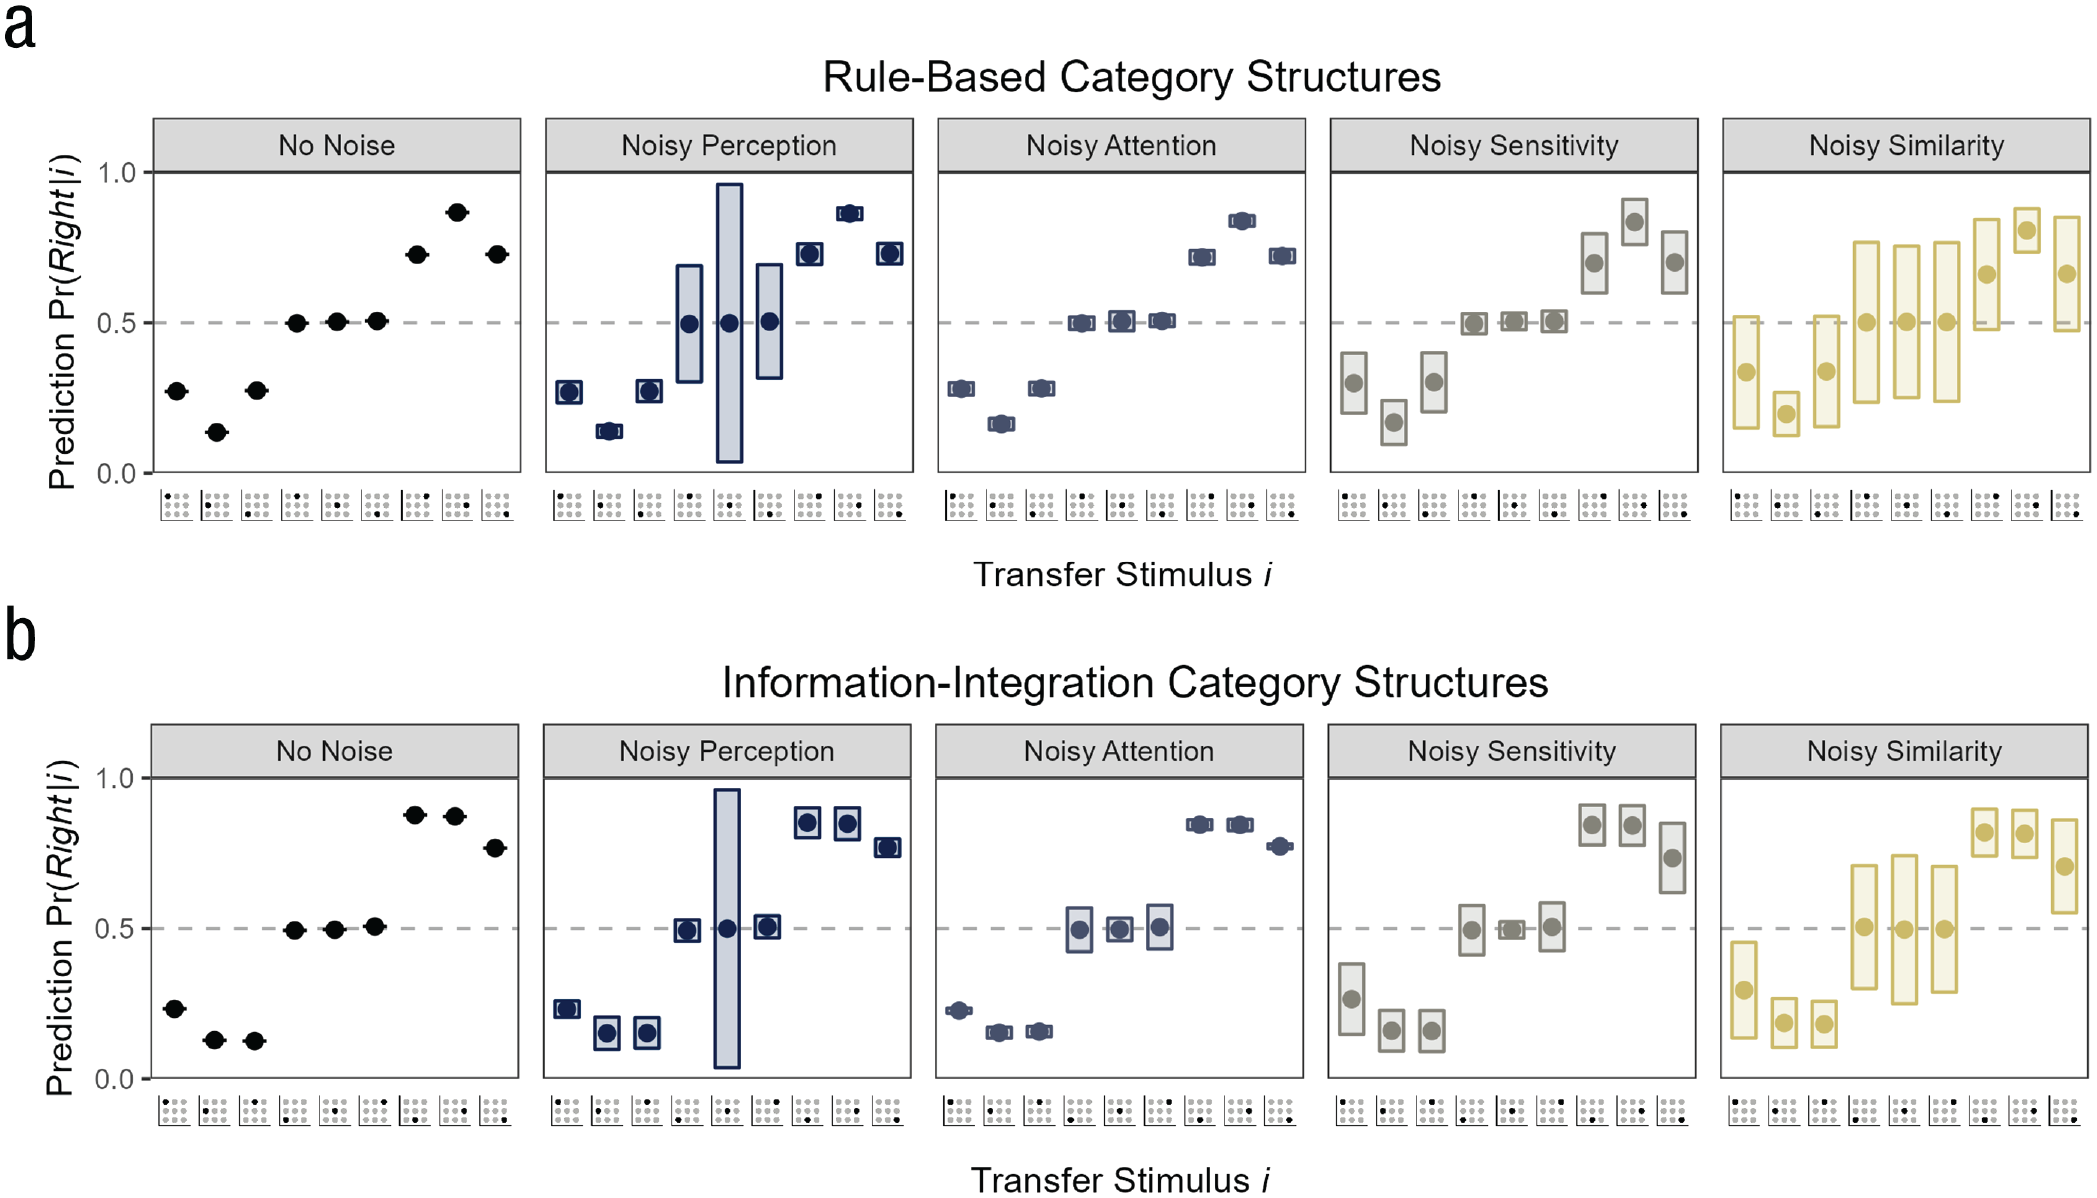
Simulated continuous category predictions under different noise forms for the (a) rule-based category structures and (b) information-integration category structures. For each transfer stimulus on the x-axis, the y-axis shows the mean prediction
Noisy perception resulted in variable predictions for the transfer stimuli on the category boundary, and in particular for the central transfer stimulus (as shown in Figure 6, the median standard deviation was .
Unlike noisy perception and noisy attention, noisy sensitivity and noisy similarities made the predictions for most transfer stimuli more variable (see Fig. 6), likely because the two noise sources affect a later, more general step in the similarity computation. In the case of noisy sensitivity, the transfer stimuli with
Summary
Our simulation suggests three main results. First, noise during perceptual and cognitive processes can substantially bias the parameter estimates of a model that does not take into account the noise during fitting on the binary category responses (for an analogous parameter recovery on the continuous category responses, see Appendix C). We observed an underestimation of the response determinism parameter
Integrating Continuous Data Into a Categorization Experiment
Our simulation suggests that integrating continuous data into categorization experiments might be helpful in identifying the source of behavioral variability and characterizing the cognitive process more accurately. However, where could one get continuous data in a categorization task that by definition requires discrete responses? One idea is a graded categorization task that measures the probability of belonging to a category or the inclusion of other similar continuous response measures (e.g., J. C. Lee et al., 2019; Lovibond et al., 2020). For example, after categorizing a stimulus, participants could assess how confident they are in their response (Balakrishnan & Ratcliff, 1996; Estes, 2004; Sieck & Yates, 2001). Such confidence judgments might reflect the continuous predictions that are output by a probabilistic categorization model: Higher confidence judgments may correspond to more deterministic predictions in favor of the chosen category (for a discussion, see Estes, 2004). Alternatively, one might not even need to expand the categorization task, but instead look at participants’ response times (for examples on modeling people’s response times in categorization, see Lamberts, 2000; Nosofsky & Little, 2010; Nosofsky & Palmeri, 1997). A shorter response time may reflect a higher confidence in one’s response and thus correspond to a deterministic category belief.
To exemplify how category probability judgments, confidence judgments, and response times might help identify the source of behavioral variability, reconsider the central transfer stimulus from our model simulation. In the case of a noisy feature perception, the stimulus was sometimes highly likely to belong to one category and sometimes highly likely to belong to the other category, resulting in a substantial prediction variability across trials. This pattern may have been reflected in consistently high category probability and confidence judgments and fast response times (after all, the prediction in each trial was deterministic), but sometimes one category was chosen and sometimes the other. In contrast, noisy attention did not lead to any noteworthy predictive variability because no category was favored over the other under any attention distribution. This would correspond to the same category response proportions as before (i.e., close to 50% for each category) but to consistently low confidence judgments and slow response times (one is unsure about the categorization in every trial). Analogous demonstrations held for the other transfer stimuli, highlighting the potential benefits of including continuous data in categorization.
Zooming out, integrating continuous data can also help in disentangling behavioral variability from a directional bias (i.e., a systematic difference of a person’s mean response from the true category label). Recall the introductory categorization example showing that increases in bias and variability lead to qualitatively similar response shifts (a shift away from perfect categorization and toward random choice). This was because in categorization data, the mean and the variability of the responses are interdependent. In contrast, in continuous responses, bias and variability are independent of each other and can readily be distinguished (see Fig. 7): More bias increases the difference between the mean response and the true category label; more variability increases the dispersion of the responses. Furthermore, a continuous measure also distinguishes between different response distributions for a given bias, such as unimodal distributions with a smaller or larger variability (see Fig. 7) or even multimodal distributions (see Albrecht et al., 2020). This may be particularly useful in probabilistic categorization tasks in which continuous responses such as category probability judgments could discriminate between a bias (the mean response deviates from the true category probability) and variability (the responses vary around the true category probability in a unimodal or multimodal way).
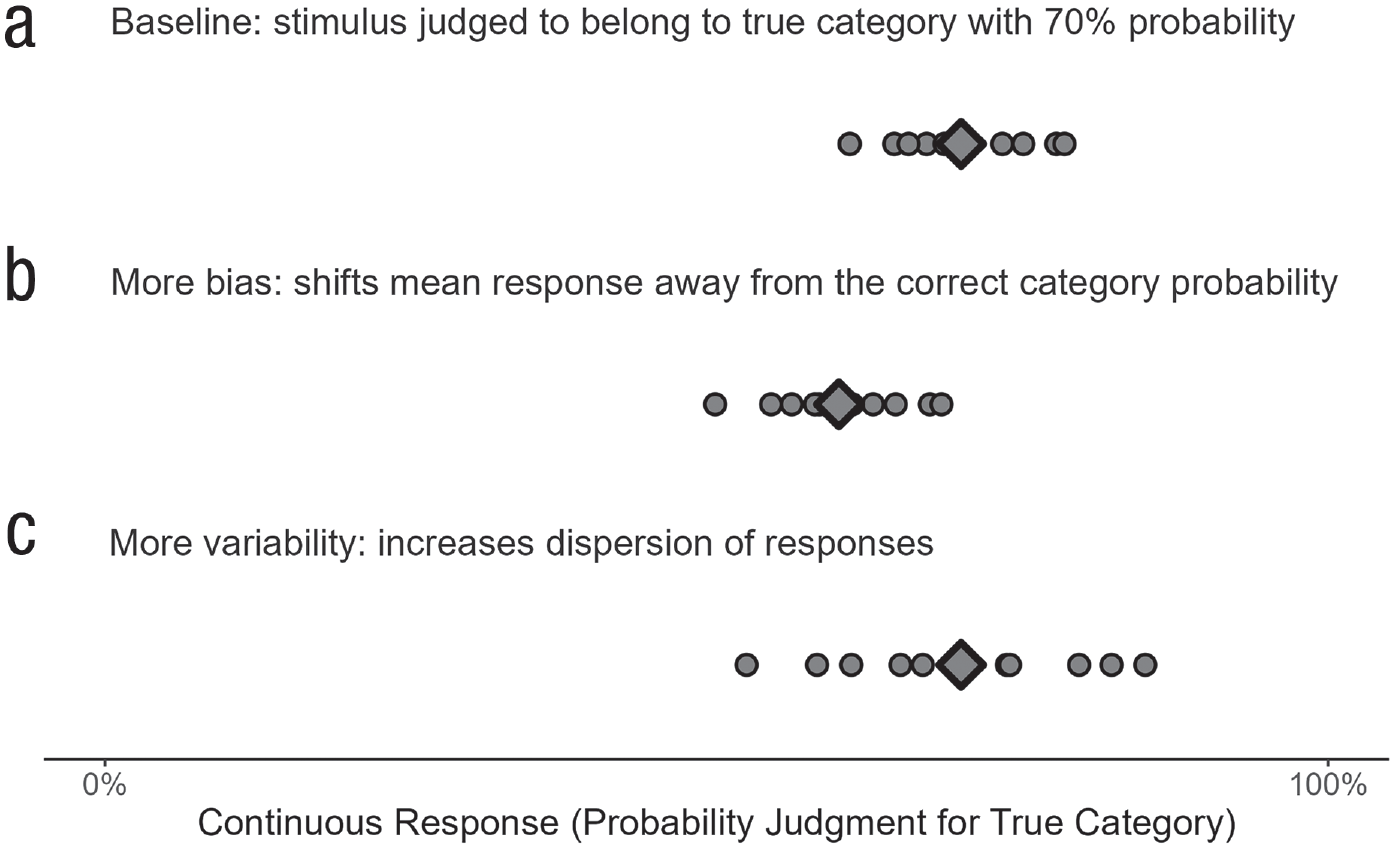
Independence of bias and variability in continuous data. The points show 10 continuous responses (probability judgments for category membership) of a person to the same object; the diamond is the mean response. More bias increases the difference between the mean response and the true category probability and is thus independent of behavioral variability.
Whereas our approach of including continuous data to pinpoint the source of behavioral variability seems fruitful from a theoretical side, it also faces some practical challenges. First, many stimulus repetitions may be needed to get reliable estimates of the variability on the measure that aims to reflect continuous category predictions. Statistically, the variance of the estimates of behavioral variability decreases with the number of repetitions of a transfer stimulus and tends toward 0 as
Second, designing an experiment such that it is able to elicit the source of behavioral variability is not an easy undertaking. As Figure 6 shows, the transfer stimuli differed in their ability to disentangle different forms of noise. For instance, one promising candidate for uncovering perceptual noise is the central transfer stimulus on the category boundary. However, this transfer stimulus might provide less insights for other endeavors such as model comparisons because most if not all sensible models will categorize this stimulus randomly. A solution might be to include this stimulus as a filler stimulus that can check for perceptual noise alongside other more critical stimuli used for model comparison.
Finally and maybe most importantly, it seems probable that at any point in time, multiple forms of noise operate simultaneously. It is unclear how our simulation, which investigated different forms of noise in isolation, would scale up when multiple forms of noise are present at the same time and perhaps even correlated. Future research could look at more complicated combinations of noise and integrate these in a larger simulation encompassing other categorization models and category structures.
Conclusion
Behavioral variability is ubiquitous in human categorization—the same object is sometimes assigned to one category and sometimes to another. In many situations, however, consistent, error-free categorization is preferred, and interventions such as training aim to decrease the variability with which aspiring experts in a domain perform categorizations. Our article aimed to show that looking at behavioral variability can reveal something about the underlying categorization mechanism. Specifically, this article reviewed different sources of behavioral variability in categorizations, focusing on perceptual intake and cognitive processing. In simulations, we showed that it was not possible to determine the source of the variability simply by using category responses. However, the different forms of noise had distinct profiles when analyzing continuous predictions. Assessing people’s category beliefs in a continuous way may therefore help disentangle perceptual and process-related sources of behavioral variability. Ultimately, this can inform not only cognitive models but also applied interventions by indicating exactly which stage of the categorization mechanism to target to reduce behavioral variability.
Footnotes
Appendix A
Appendix B
Appendix C
Transparency
Action Editor: Joakim Sundh
Editor: Interim Editorial Panel
1.
2.
The simulation results are virtually identical if the similarity function uses a city-block distance (
3.
Ell and Ashby used sine-wave gratings as stimuli with the features “spatial frequency” and “orientation.”
4.
The parameters have a natural lower bound at 0, and the attention weight