
Abstract
Conducting research with human subjects can be difficult because of limited sample sizes and small empirical effects. We demonstrate that this problem can yield patterns of results that are practically indistinguishable from flipping a coin to determine the direction of treatment effects. We use this idea of random conclusions to establish a baseline for interpreting effect-size estimates, in turn producing more stringent thresholds for hypothesis testing and for statistical-power calculations. An examination of recent meta-analyses in psychology, neuroscience, and medicine confirms that, even if all considered effects are real, results involving small effects are indeed indistinguishable from random conclusions.
Introduction
Human-subjects research often involves noisy measures and limited sample sizes. Accordingly, small effects and low statistical power are typical in many areas of behavioral and medical science (Marek et al., 2022; Szucs & Ioannidis, 2017). Some argue that this situation is tenable because the ongoing identification of small effects amounts to a steady accumulation of knowledge (Götz et al., 2022). We argue to the contrary. Specifically, we show that the study of small effects frequently produces results that are indistinguishable from flipping a coin to determine the direction of an experimental treatment’s effect. We use this idea to develop a benchmark based on minimum acceptable estimation accuracy. This benchmark yields an intuitive interpretation of effect-size estimates—one based in accurate estimation. We show that calibrating existing tests to our benchmark yields far stricter thresholds for hypothesis testing and for statistical-power calculations. Our work is intended to spark a larger discussion within the scientific community on acceptable estimation accuracy, the interpretation of effects, and statistical standards.
Although there are many exceptions, behavioral scientists almost universally test null hypotheses, which are often formulated as two or more means being exactly equal to one another. Much ink has been spilled noting the shortcomings of this approach (e.g., Krantz, 1999; Nickerson, 2000; van de Schoot et al., 2011). Cohen (1994) famously criticized the null hypothesis through his “nil” hypothesis critique, describing it as a conceptual tool that is ill-suited for answering substantive research questions. He noted that for continuous dependent variables, it is simply impossible for two population means to be truly equal to one another. This means that the null hypothesis acts as a straw man to be knocked down at a given sample size. By his critique, all effects exist in a trivial sense; it just may be that some are so small that they do not warrant attention. A more meaningful line of investigation is determining whether effects are accurately estimated and characterized.
What constitutes acceptable estimation accuracy? This question is challenging to answer and fraught with subjectivity. A confidence interval (CI) deemed acceptably narrow by one scientist may be unacceptably wide to another. We seek to answer this question by the use of a reference—a foil—with undeniable negative qualities. To better understand the accuracy of standard methods, we will compare them against a foil estimation process that is, by construction, incapable of accurately estimating effects. Such a foil is useful for handling questions of subjectivity. If a community of scientists agree that this foil is unacceptably inaccurate, then any estimation process that cannot be distinguished from it is also unacceptably inaccurate.
Our foil must be tailored to the types of questions that behavioral scientists ask and to how they make decisions about data. Behavioral scientists often formulate directional hypotheses about treatment effects. Is the population mean of Group A larger than that of Group B? A strong foil would offer zero information about the correct direction of effects. A foil could randomize the direction of any observed effect; for example, which group mean is larger than another would be decided via a coin flip. Such a foil creates a worst-case scenario for evaluating any directional hypothesis. In addition, behavioral scientists typically use the outcome of a statistical test to conclude whether a treatment effect is detected. In keeping with our estimation focus, an ideal foil would remove effect detection from the comparison. One way to handle this is for the foil to correctly detect whether an effect exists at similar, or identical, rates as standard methods. A scientist using this foil would correctly reject a relevant null hypothesis just as often as someone using standard estimation methods. This would make the foil especially useful for evaluating published findings in the literature.
Scientists using such a foil would arrive at random conclusions regarding their data. All else being equal, they would detect effects as often as scientists using standard methods, but would be incapable of accurately estimating and characterizing them. The logic is straightforward: If one accepts that arriving at random conclusions is unscientific and inaccurate, then it becomes incumbent on the scientific community to use statistical procedures that would be distinguishable from such a foil. 1 In the present work, we focus on the canonical case of using sample means to estimate population means for two independent groups. Our proposed foil consists of an estimation process that randomizes the direction of treatment effects while still correctly rejecting a null hypothesis as often as standard methods.
Our analyses reveal that distinguishing sample means from such a foil requires far larger sample sizes than typically employed in the behavioral sciences, especially when studying the kinds of small effects that are commonplace in the psychological literature. We also show that our foil comparison naturally relates to many existing tests and methods, including those based on traditional null hypotheses. We leverage these connections to provide new calibrations for existing techniques. For power analyses, we show that typical power thresholds of .80 are not sufficient to rule out unacceptable estimation accuracy. Linking our argument to hypothesis testing, we show that far stricter thresholds
Ultimately, all scientific decisions regarding data are made by human beings. A key aim of any statistical methodology is to provide characterizations of data that researchers can understand. What we provide in the current work is simply a perspective, one grounded in a common experimental design with linkages to many other familiar statistical quantities and methods. It is through this framing that we aim to push forward the conversation on estimation accuracy and replication efforts. To further understand our approach and provide precise definitions, consider the following scenario.
A Tale of Two Labs
Consider two hypothetical laboratories, Lab 1 and Lab 2, studying an effect—for instance, the efficacy of a drug. Both labs use a treatment condition (Group A) and a control condition (Group B) and compare the sample means from each group,
Unfortunately, Lab 2 has a glitch in their data-analysis software—it randomly assigns, with equal likelihood, the labels of “treatment” and “control” to those means. That is, if Lab 2 conducted a study for which the actual sample means for the two conditions were
If Lab 2’s error came to light, retraction of any study that relied on this software would be demanded, and a drug approved on the basis of such results would (rightfully) be recalled. But Lab 2 provides an interesting comparison with Lab 1, especially when considering issues of replication and reliability. Lab 2 will correctly reject the null hypothesis,
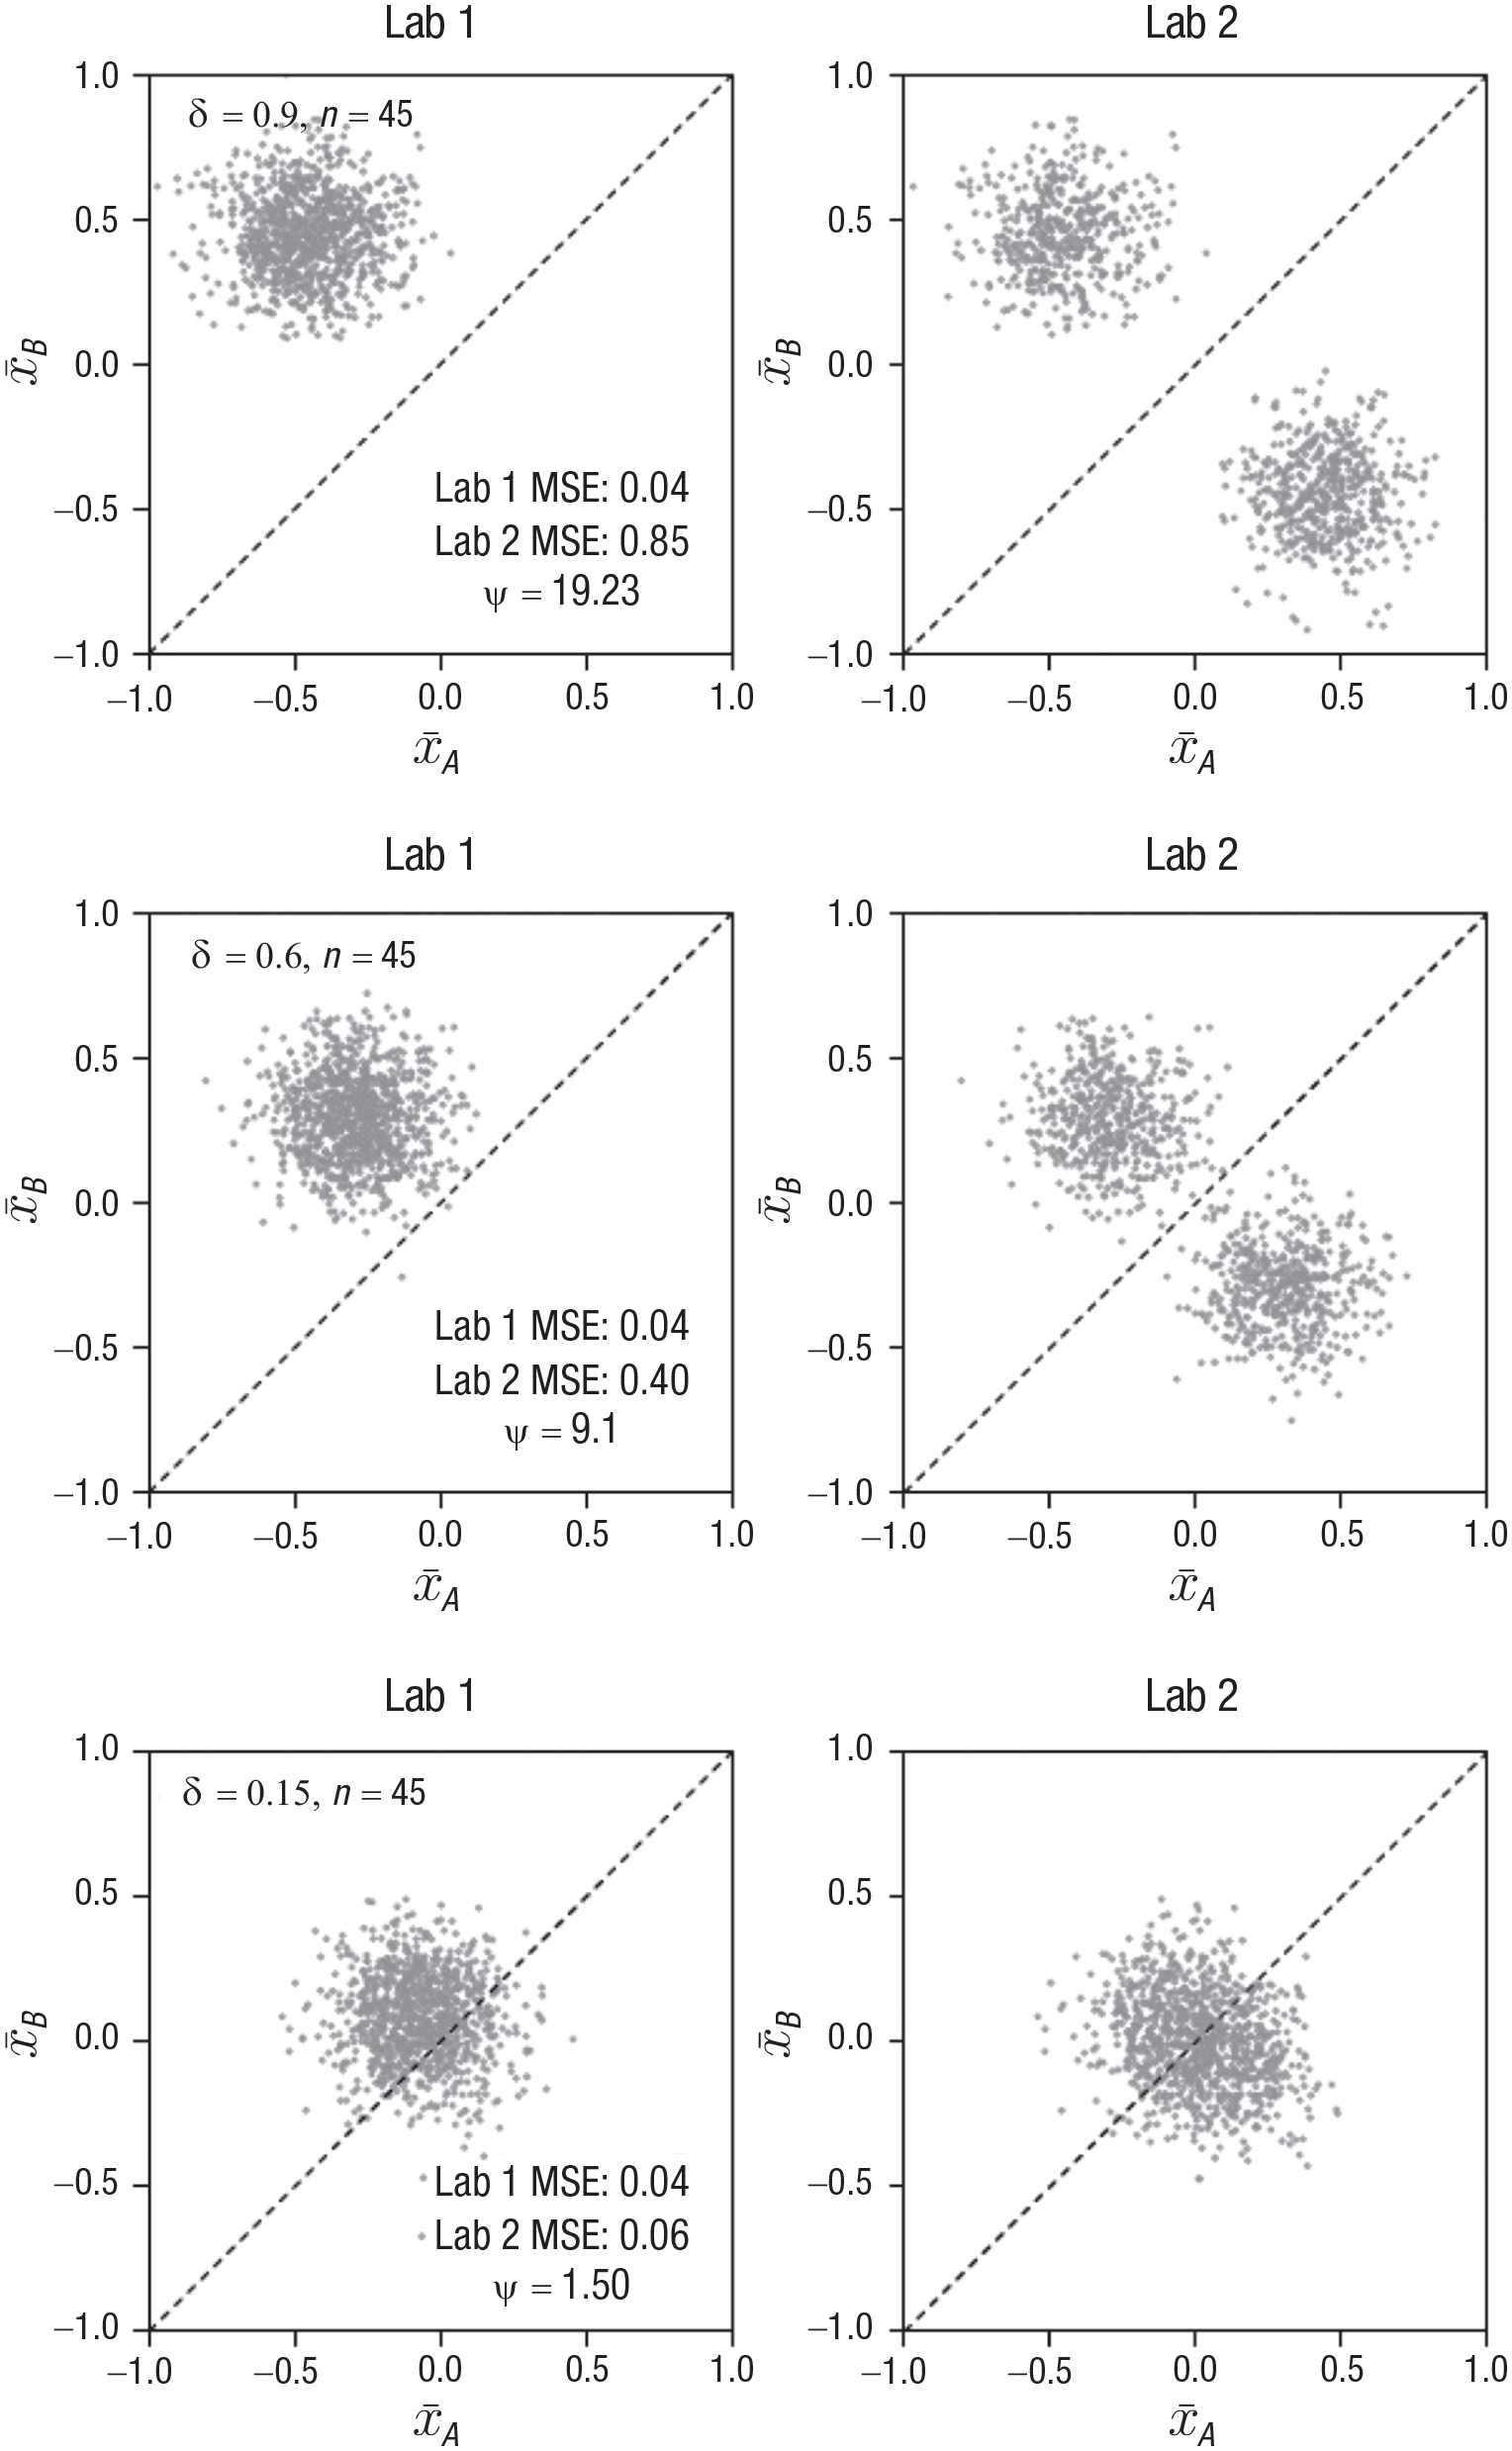
Lab 1 and Lab 2 are identical with the exception that Lab 2 is using an RCE, which, by any measure, is not science because the direction of effects (including published effects) is determined via a coin flip. Intuitively, we would like to believe that results from the two labs would be readily distinguishable. Unfortunately, in many areas of behavioral science, even if all effects exist, Lab 2’s results will often be strikingly similar to Lab 1’s, and the gain from removing their results from the literature may be marginal at best. This situation is illustrated in Figure 1, which presents scenarios for effect sizes that are conventionally considered large, medium, and small (yet interpretable; Cohen, 1988; Sawilowsky, 2009). For simplicity, these scenarios assume that outcomes in both conditions are normally distributed with unit variance. The left and right columns of Figure 1 illustrate the sampling distributions of mean estimates in each of the labs. Each dot represents a pair of means from a single study. How well these means estimate the population means
Distribution of sample mean estimates
In the top row of Figure 1, the effect size is large. Lab 2’s bimodal distribution of estimates clearly evidences the software error, and the resulting MSE is 19 times larger than Lab 1’s. We use ψ to denote the ratio
Effect size and sample size combinations like those in the bottom row of Figure 1 raise an important question: If Lab 2’s results are subject to retraction, how should we interpret Lab 1’s results? Put differently, if one’s results look unscientific, perhaps they are unscientific. A computer glitch on the scale of Lab 2’s results is, one hopes, an unlikely occurrence, but the comparison is useful in illustrating what a worst-case estimator could look like and why it would be problematic if it were indistinguishable from current practice. Within the behavioral sciences, many of the hypotheses being tested, if not the vast majority, are directional in nature. The RCE completely randomizes the direction of effects, removing any information about direction from the data. Yet the RCE is special in that it still detects effects at the same rate as sample means via a nondirectional t test, which is, once again, ubiquitous practice in the behavioral sciences. In this way, our RCE comparison provides an interesting new perspective on published literature in the field, which often hinges upon the successful reporting of a significant test. We are not seriously suggesting that such a computer glitch exists, but we do think it highly problematic if a large corpus of work within the behavioral sciences is indistinguishable from such an error. 3
General Formulation
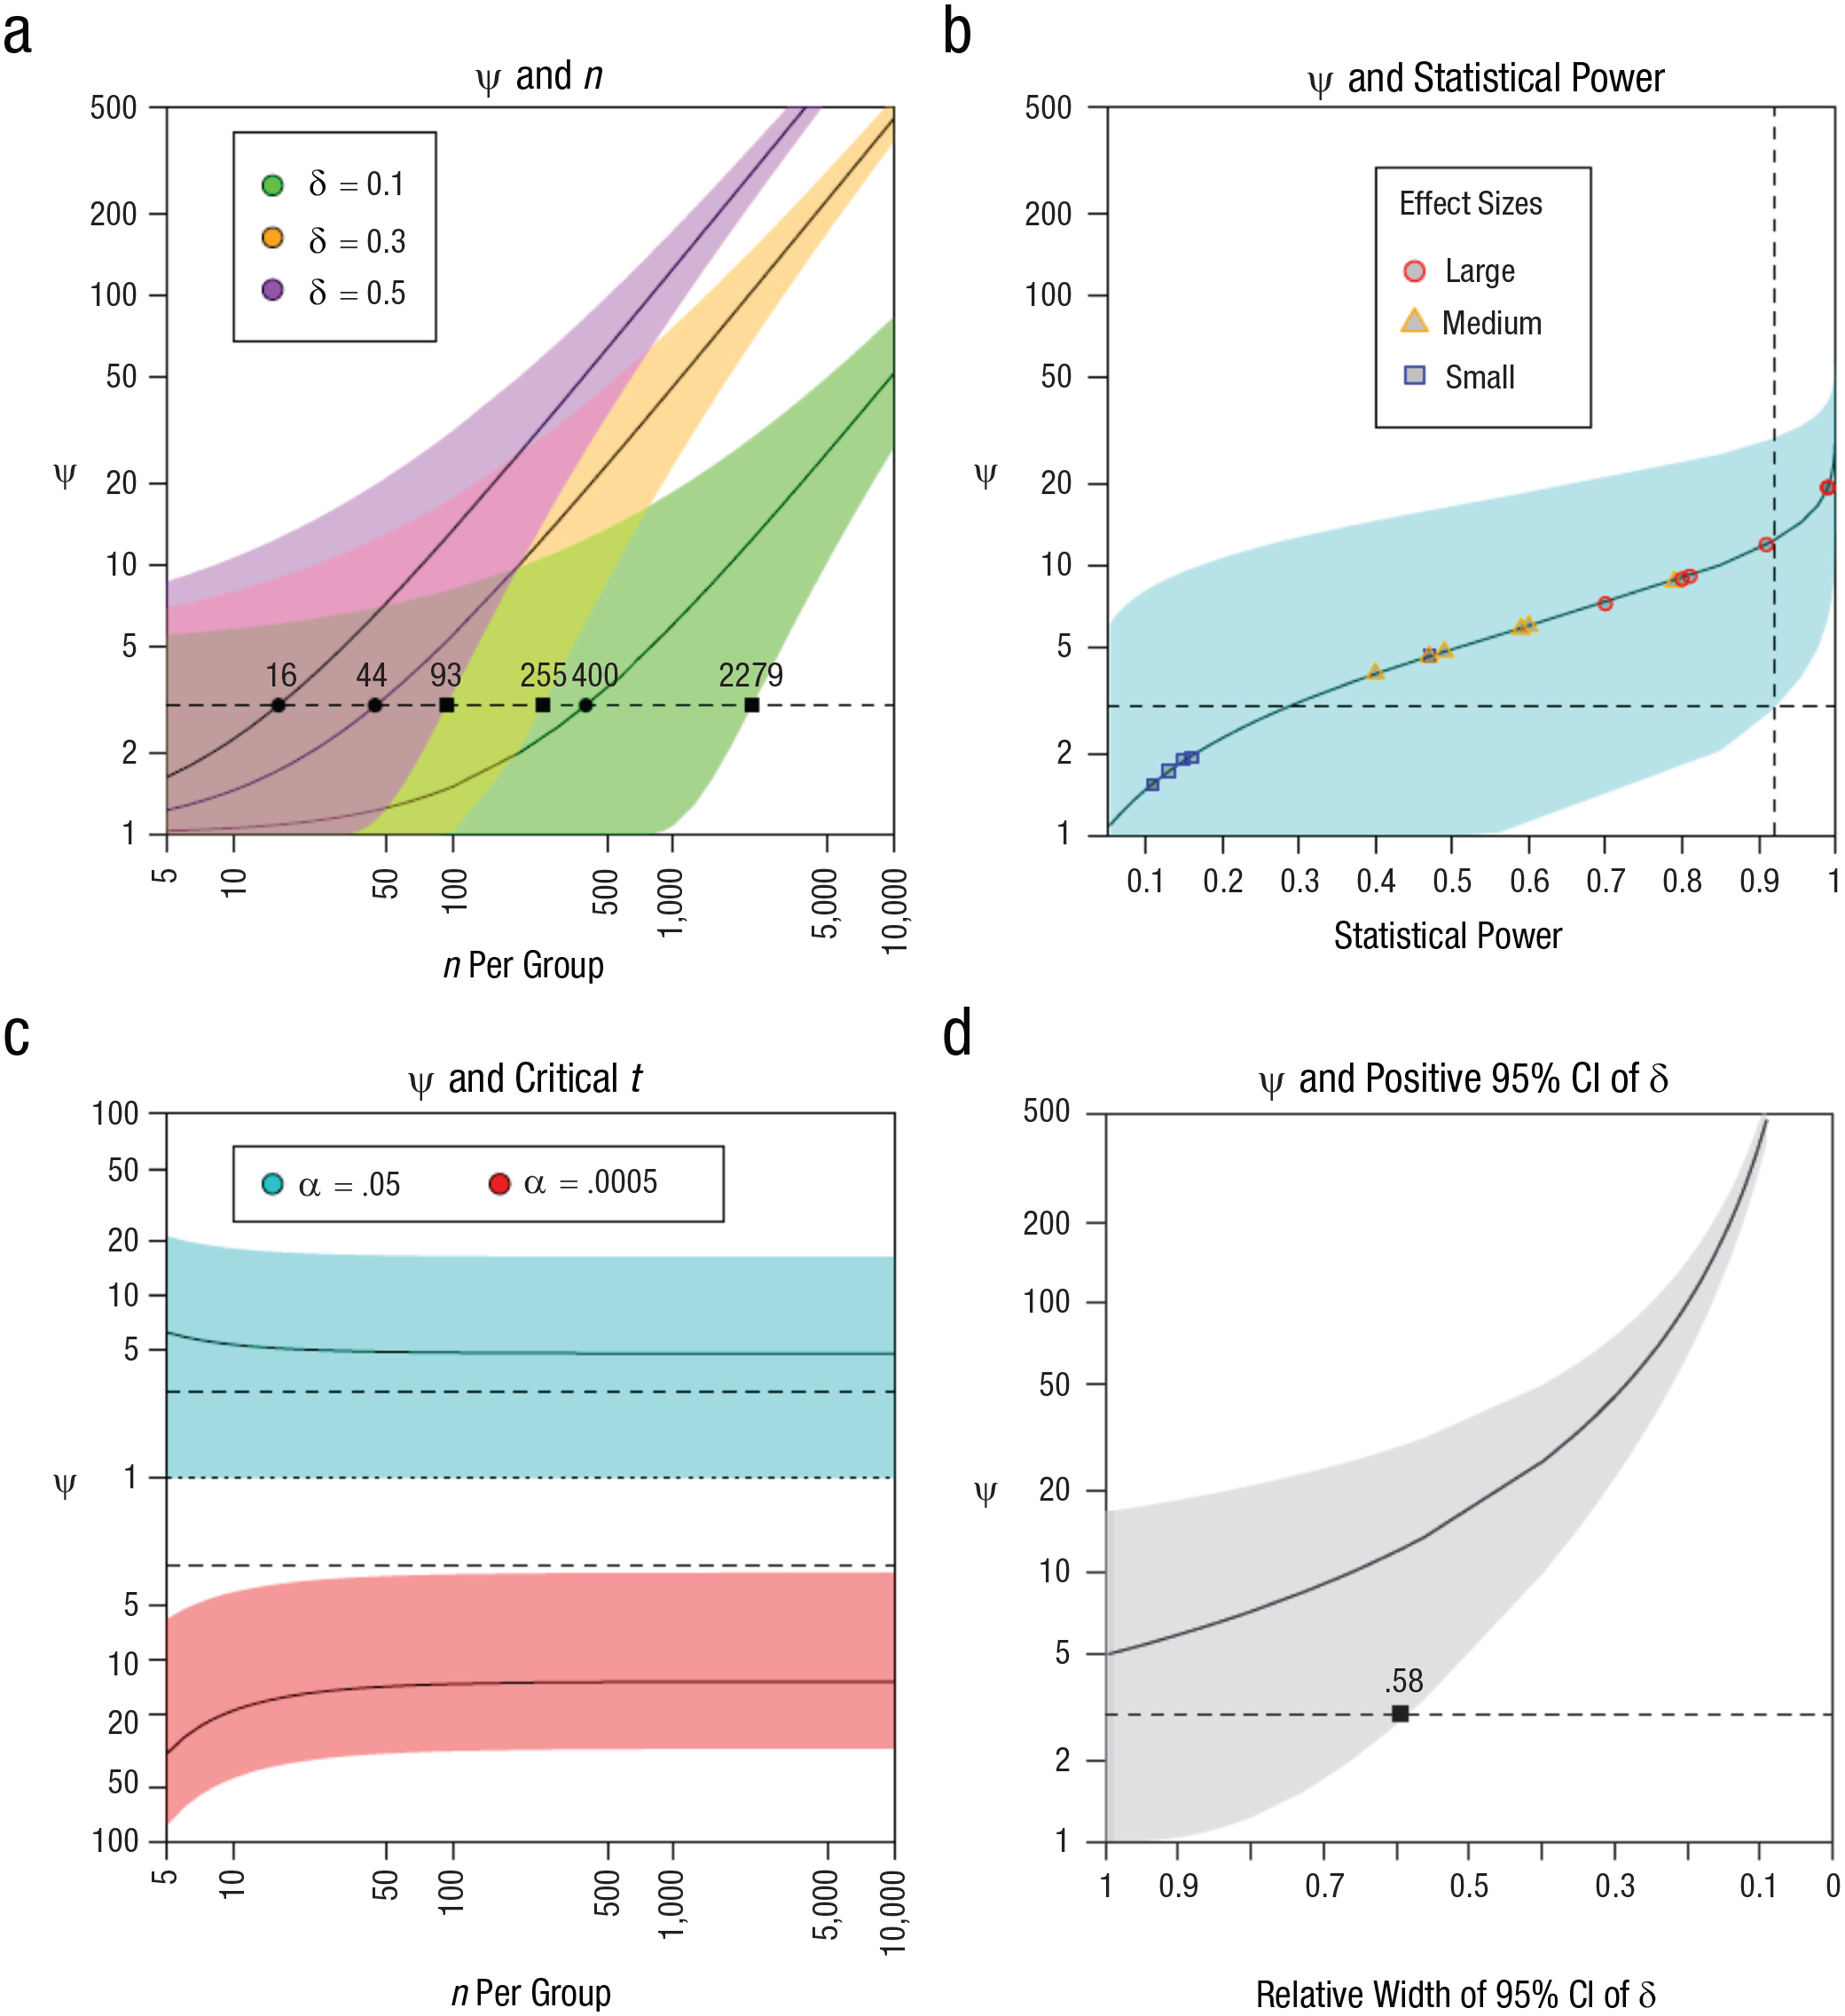
If the goal is to be distinguishable from a veritable Lab 2, as instantiated by the RCE, we can use ψ as an index to set standards for hypothesis testing and sample-size planning. As shown in the Appendix, ψ simplifies to

where n is the sample size per group. Equation 1 is straightforward to interpret: For given values of δ and n, sample means are ψ times as accurate (in terms of MSE) as the RCE. Although ψ is distribution-free and interpretable outside of any testing framework, it functionally relates to a two-sample t test and the resulting p values. See the Appendix for connections between ψ and other metrics, including out-of-sample
Determining a minimum acceptable ψ for a given scientific discipline is perhaps best decided on a case-by-case basis, taking into consideration specific research goals (S. F. Anderson & Maxwell, 2016; Navarro, 2019). Here, we demonstrate the consequences of a threshold of 3 for the interpretation of results and sample-size planning. Although somewhat arbitrary and perhaps modest, this threshold is motivated by the logic illustrated in Figure 1. When
Table A1 in the Appendix characterizes ψ in terms of the information about the direction of effect that is gained by using sample means versus the RCE. For example, for
Applications to CIs and Hypothesis Testing
Applying Equation 1 to the bounds of a 95% CI over δ provides researchers a simple, transparent method to gauge how accurately a range of plausible effects is being estimated. For example, consider a study with a sample size of 50 that yields an effect size point estimate d of 0.5 and a 95% CI equal to
Figure 2 contextualizes ψ within familiar statistical quantities:
Panel (a) - ensuring that ψ is greater than 3 often requires a large n, especially when dealing with smaller effect sizes (e.g.,
Panel (b) - the requirements for acceptability can also be framed in terms of statistical power. Regardless of δ, under the standard alpha (
Panel (c) - it is well known that a larger n results in smaller observed effects becoming statistically significant. However, the ψ associated with said effects can still be unacceptable. For example, critical effects with
Panel (d) - some researchers consider an effect to be robust or reliable when the 95% CI of δ does not cross zero (Cumming, 2013). But when we transform a strictly positive or negative interval onto a range of plausible ψ values, we see that they will include unacceptable values (for a threshold of 3) unless the width is less than
Examining Prior Meta-Analyses
We examined several recent meta-analyses to get a snapshot of how common poor ψ values are in various subfields (Gaeta & Brydges, 2020; Nuijten et al., 2020; Siegel et al., 2021; Szucs & Ioannidis, 2017). Table 1 shows a remarkable consistency across subfields, with the estimated median power to detect a small effect (
Median Power to Detect Small (
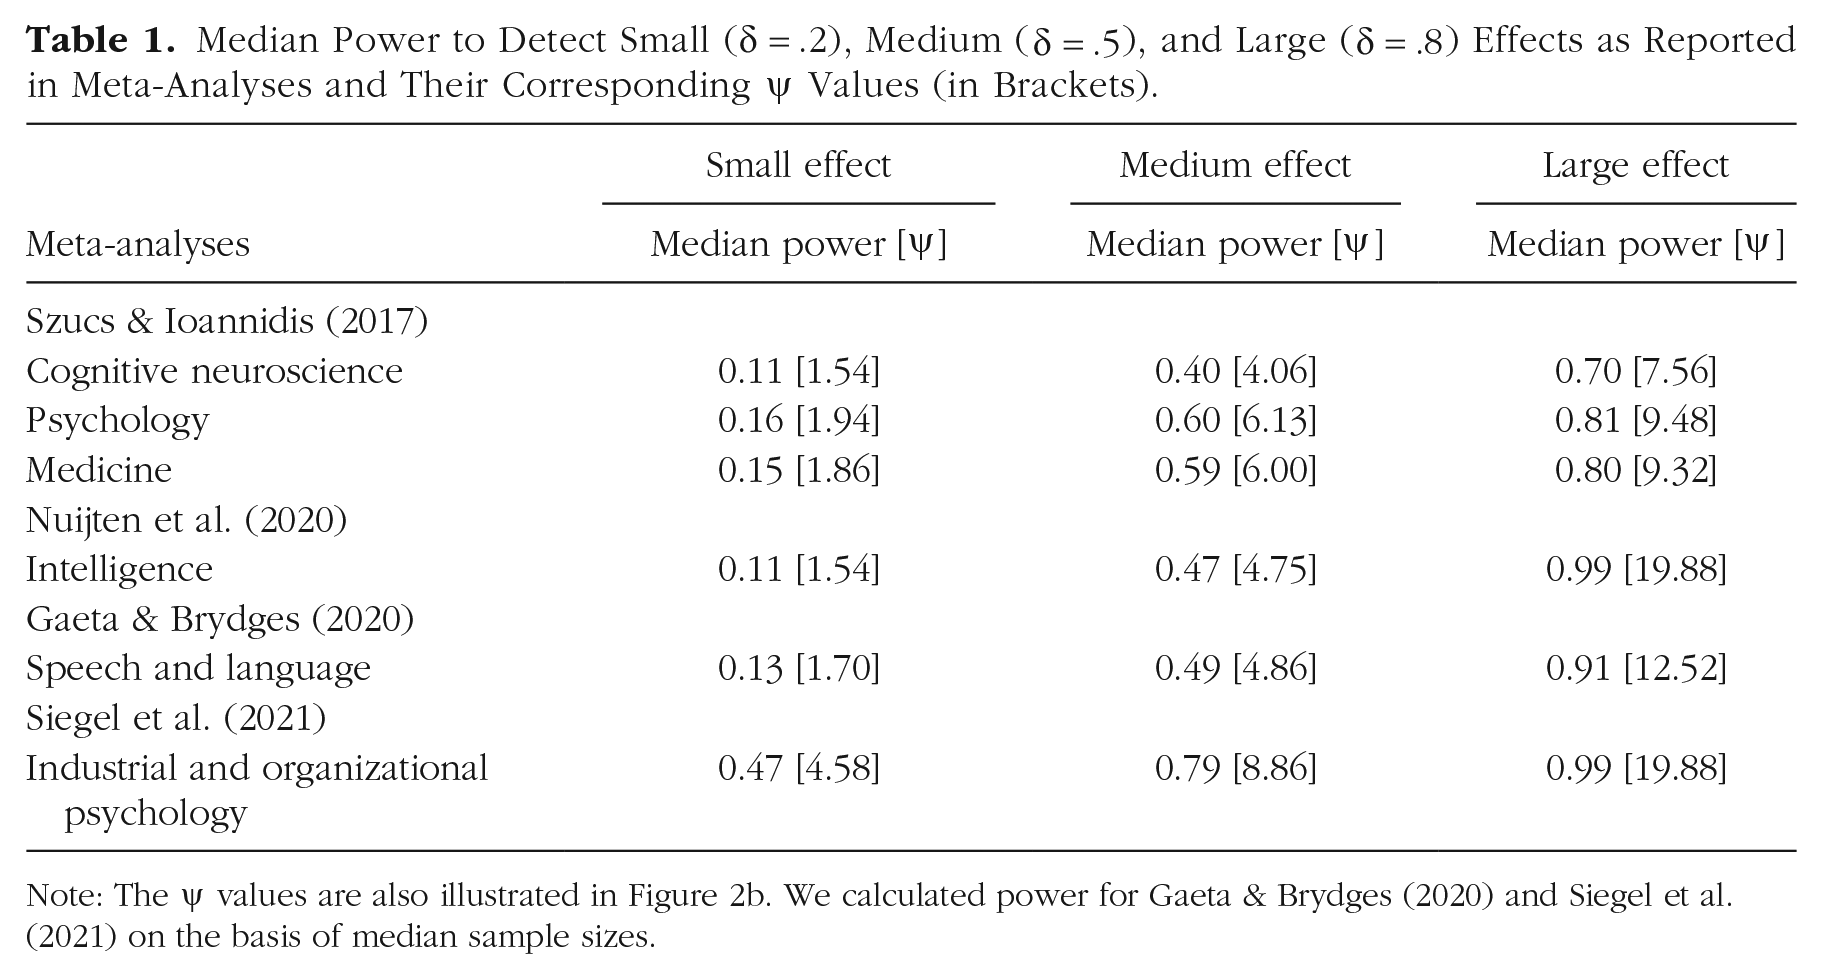
Note: The ψ values are also illustrated in Figure 2b. We calculated power for Gaeta & Brydges (2020) and Siegel et al. (2021) on the basis of median sample sizes.
Extensions
Our Lab 1 and Lab 2 framing provides a concrete way for scientists to grapple with inherently difficult questions about acceptable estimation accuracy and replication within the behavioral sciences. This framing could be extended to other estimators, testing frameworks, and experimental designs. In the current application, we focused on sample means and the usage of the independent two-sample t test. We did so because of the ubiquity of this experimental design and testing framework within the behavioral sciences. Our RCE formulation could be used to calibrate power and hypothesis-testing thresholds for statistical tests other than the standard t test, such as Welch’s test, which allows for differences in group variance (Welch, 1947). Future work could explore how different configurations of group variances impact the RCE sample-mean comparison and what testing and power thresholds provide acceptable estimation accuracy.
The RCE is defined by the randomization of group labels on the estimates of interest, but these are not required to be population means. In keeping with our two-group design, an RCE could be defined as the randomization of group labels to estimates of population medians, which may be an interesting application for heavily skewed distributions. One could then examine alternative power and hypothesis-testing calibrations for tests such as the Wilcoxon-Mann-Whitney U test. It should be noted, however, that the Wilcoxon-Mann-Whitney U test is appropriate only for evaluating whether two population medians are different under relatively strict assumptions—that is, that both populations are identically distributed and differ only by a shift in location (Divine et al., 2018).
The RCE and two-labs perspective could be extended to other experimental designs. In defining a general RCE comparison, we want to preserve two distinct features of our current formulation. First, a generalized RCE should randomize the conclusions of scientific interest. Applications could include a one-way analysis of variance, in which group mean labels are randomized, thus randomizing which means are larger than others while preserving Type I and Type II error rates for the omnibus F test. Generalizations could also include multiple regression: Certain aspects of the estimation process could be randomized, such as whether one standardized regression coefficient is larger than, or has the same sign, as another. 4 Second, a generalized RCE should also yield statistically significant results at rates similar to the standard estimation method being evaluated. This gives a generalized Lab 2 comparison additional bite, because the generalized RCE is not just randomizing the direction of results; it is also leading to random decisions regarding data. This second point is not intended to avoid important questions relating to preregistration practices (Nosek et al., 2019; Szollosi et al., 2020) but rather to place a finer point on an RCE comparison.
Given a suitable RCE and a standard method of estimation (e.g., ordinary least squares), we define a generalized ψ as the ratio of the respective mean-squared-error values. Although MSE has several nice properties, other accuracy metrics could also be substituted. Under this definition, ψ retains its simple interpretation: An estimator is ψ times as accurate as a generalized RCE. Future work could develop these comparisons and relate them to existing techniques, such as CIs, statistical power, and hypothesis testing.
Recommendations
Report ψ intervals
When reporting CIs over Cohen’s d values, we recommend also reporting the requisite ψ interval using that study’s sample size. A CI communicates a range of plausible effect sizes, whereas the CI over ψ communicates how well the effect is being estimated relative to an easily understood benchmark. If the ψ CI includes values less than 3, it is worth reporting that the data do not rule out unacceptable levels of estimation accuracy. Although we have illustrated some consequences of using 3 as a threshold for ψ, other values could be used depending upon the context. 5 The key takeaway is that ψ intervals translate effect-size estimates into a comprehensible measure of estimation accuracy. Reporting ψ intervals also provides researchers a degree of nuance when reporting results, allowing them to claim (or not) the detection of an effect, up to the usual Type I error rate under a specified α level, while also being transparent about estimation accuracy. To be clear, no additional inference is taking place: Transforming a CI over δ values into one over ψ values is expressing the same information again from an estimation perspective. Making use of such a perspective can be done regardless of one’s statistical-inferential inclinations (e.g., Bayesian vs. frequentist). It is worth noting once again that ψ is distribution-free, in that its interpretation as the ratio of MSE values between sample means and the RCE does not depend upon any particular distributional form (see the Appendix for details).
Power statistical tests for estimation
When conducting a priori power analyses, we recommend that the sample size be selected according to effective estimation of the effect, rather than simple detection. We demonstrated that power of .92, when using an
Bayesian estimation
One takeaway from our arguments is that there simply is not much information contained in small samples and small effects. Bringing more information to the analysis can take many forms, with Bayesian methodology being an obvious approach. Informative priors can be used to improve estimation accuracy of mean estimates (Gelman et al., 1995), and such priors can be incorporated into the t test itself (see, notably, Rouder et al., 2009; Gronau et al., 2019; and Ly & Wagenmakers, 2021). Bayesian formulations are well suited for integrating informative hypotheses with cognitive models (Lee & Vanpaemel, 2018; Vanpaemel & Lee, 2012), which can help avoid some of the estimation issues we raise here. This approach is especially important for researchers who face limited sample sizes by the very nature of their investigations. Of course, the accuracy of Bayesian approaches under limited sample sizes will be prior dependent (e.g., McNeish, 2016). The Appendix also provides two examples of how prior beliefs can be incorporated into the computation of ψ.
Computational modeling and formal theory
Throughout, we have treated the accurate estimation of an effect as a primary goal. There is much to say about whether conceptualizing and testing theories in this way is optimal from a meta-science perspective. Indeed, Scheel (2022) argued that many psychological hypotheses are imprecisely specified, leading to questionable attempts at replication and measurement. Improved theory and quantitative modeling can lead to more compelling tests (e.g., model selection; for a recent review, see Myung & Pitt, 2018), avoiding simple effect-based characterizations (van Rooij & Baggio, 2021); see also Guest and Martin (2021) and Proulx and Morey (2021). Lee et al. (2019) and Devezer et al. (2019) provide thoughtful analysis and argumentation for how formalism can be used to improve scientific practices.
A more stringent threshold (α = .0005) for two-group between-subjects hypothesis testing
Using α = .0005 sets a more stringent threshold than recent high-profile recommendations for methods reform (Benjamin et al., 2018). It’s hardly our goal to further contribute to file-drawer problems by arguing that some studies should not be published if ψ is less than 3. Indeed, we believe that all studies should be reported and that p values (likewise, ψ values) should not serve as gatekeepers to the literature. Yet for researchers who want to provide a characterization that goes beyond mere detection (e.g., “the two groups differ”) and ensure that their estimates are distinguishable from random conclusions, a more prohibitive α level is arguably required. Rather than a tool for censorship, ψ can be perceived as a useful way to adjust the strength of one’s claims to the expected accuracy of the estimation process.
The importance of experimental design
The fact that small effects are commonly observed does not mean that they are inevitable—one should always keep in mind the artificial and constructive nature of effects (e.g., Guala & Mittone, 2005; Woodward, 1989). In the behavioral sciences, effects are often small because of the use of minimal experimental manipulations that make the conditions being compared virtually identical, apart from a minor change (for a discussion, see Prentice & Miller, 1992). Researchers can rely on ψ to gauge the ability of a given experimental design to elicit a target phenomenon with sufficient accuracy, which in some cases can lead to the development of alternative experimental approaches. We do emphasize that notions of effect size are just one of many factors that impact experimental outcomes; see Buzbas et al. (2023) for a formal treatment of experimental design and its relation to replication rates.
Discussion
In reaction, one might argue that estimation accuracy should not be much of a concern if we care only about correctly detecting effects. We find this argument untenable for four reasons: First, knowledge about effect sizes plays a crucial role when using basic research findings to develop effective real-world interventions (Schober et al., 2018). Second, developing a theoretic account of the phenomena being studied typically requires more than just nominal or ordinal information (Meehl, 1978). Third, this reaction is at odds with the widespread use of statistical models that are predicated on quantitative comparisons of effects (Kellen et al., 2021), or the popularity of inferential frameworks that call for a quantitative reasoning of effects (Vanpaemel, 2010). Fourth, even in the context of coarse-grained theoretical accounts and ordinal predictions, knowledge about effect sizes is still relevant in the sense that it can inform us on matters of theoretical scope (i.e., how many people conform to a given theory’s predictions; Davis-Stober & Regenwetter, 2019; Heck, 2021). That being said, we are not claiming that a focus on detection is by itself problematic, or that there are no legitimate contexts in which it takes center stage; we are asserting only that a mature scientific characterization calls for more than that, namely accurate estimates.
Alternatively, one could try to downplay the importance of estimation accuracy by arguing that talk of effects is by itself problematic, in the sense that effects are of secondary importance relative to the explanation of psychological capacities (van Rooij & Baggio, 2021). We take issue with pursuing such a line of reasoning here, as it mistakenly implies that giving psychological theorizing the attention that it is owed somehow eliminates effects from researchers’ discourses. As a counterexample, consider the recent discussion on benchmark effects in short-term and working memory, a research domain that stands out for its highly sophisticated theoretical accounts (Oberauer et al., 2018). By contrast, the empirical exigencies of theory testing and development give estimation accuracy center stage (Meehl, 1978).
One could also argue that there is nothing new to see here, given that ψ is so closely related to already-established quantities. For instance, it is easy to see that ψ is a quadratic function of the t statistic (for details, see the Appendix). Rather than an all-new, all-different quantity to be reconciled with all the other ones in researchers’ toolboxes, what ψ offers is a reframing of an old problem. It is an attractive feature, not a shortcoming, 6 that ψ is closely related to known quantities or tests, or that the pursuit of estimation accuracy ends up recovering similar methodological proposals with distinct motivations (e.g., Benjamin et al., 2018). It is also worth noting once again that although we assumed Gaussian distributions when deriving our ψ value recommendations, the definition of the RCE and the subsequent interpretation of ψ as a ratio of MSE values is distribution-free.
Regardless of one’s scientific view, random conclusions are indefensible. It follows that researchers’ empirical findings should, at a minimum, be distinguishable from a foil whose conclusions are determined by a coin flip. But as we have demonstrated, this is easier said than done: Many published research studies, despite honest efforts, have barely improved upon the estimation accuracy of the infamous Lab 2. As it turns out, one can easily fail to reliably outperform Lab 2, even if effects are real, studies are based in strong theory, and no questionable research practices are at play. The RCE approach and the ψ index that can be derived from it provide a new perspective on methodological reform (Devezer et al., 2019; Munafò et al., 2017; Shrout & Rodgers, 2018). Everything begins with a simple statement: The estimation accuracy of our methods should be distinguishable from a random-conclusions foil. In the pursuit of this modest goal, we find that the default p value threshold of .05 does not rule out unacceptable conditions (see the bottom row of Fig. 1), leading us to more stringent criteria that also address known concerns with measurement error, statistical power, and replicability (Gelman & Carlin, 2014; Loken & Gelman, 2017; Maxwell et al., 2015; but see also Bak-Coleman et al., 2022). Based on these results, we believe that ψ and the RCE approach more generally constitute an important tool in improving psychological science.