
Abstract
Objective:
Pre-pregnancy obesity and suboptimal gestational weight gain are on the rise globally and are independently associated with several maternal and neonatal complications. A healthy lifestyle, including regular physical activity, may improve health and reduce these complications, but many women are less active and willing to engage in physical activity with advancing gestation. Therefore, the inclusion of a wider range of physical activity such as domestic chore, occupational activity and active commuting may help pregnant women to meet the physical activity recommendations of 150 min/week. Very little is known about these issues in Italy, a country with strong traditional roles regarding pregnancy and motherhood, including “la famiglia” (the family). Primary objective describes health and lifestyle behavior of pregnant Italian women. Secondary objective reports total physical activity level, recreational exercise and context of these activities from pre-pregnancy and throughout gestation in regard to gestational weight gain management.
Study design:
Cross-sectional study performed in one public hospital and four antenatal clinics in Italy. Participants (n = 513) completed a validated self-administered questionnaire, the Physical Activity Pregnancy Questionnaire, in gestation week 36.01 (standard deviation 2.0). Pre-pregnancy body weight (kg) was self-reported, whereas maternal weight (kg) was measured at gestation week 36. In line with current American College of Obstetricians and Gynecologists guidelines (2020), participants were categorized into regular physical activity (⩾150 min/week) or non-regular physical activity (<150 min/week).
Results:
Mean pre-pregnancy body-mass index was 22.8 kg/m2 (standard deviation 3.9), with 14.4% of women entering motherhood overweight and 5.3% obese. Mean gestational weight gain was 11.9 kg (standard deviation 4.1). Among those with a body-mass index ⩾25, 46.5% gained above the Institute of Medicine recommendations. With respect to recreational exercise/sport, 4.7% were active according to guidelines, whereas 82.7% accumulated ⩾150 min/week when combining exercise/sport with daily-life physical activity (commuting and occupational). Exercising ⩾150 min/week and working 100% in third trimester were associated with gestational weight gain within Institute of Medicine recommendations (p = 0.06 and p = 0.03).
Conclusion:
Italian pregnant women have a low exercise level, still over 80% achieved a total physical activity level ⩾150 min/week when adding occupational and commuting activities. Nearly 50% of overweight and obese women exceeded the recommended gestational weight gain during pregnancy.
Introduction
Overweight and obesity are significant global health problems. 1 Estimates suggest that by 2025 more than 21% of women will be obese. 2 The latest European Perinatal Health Report has shown that between 8% and 26% of women enter pregnancy with a body-mass index (BMI) ⩾30 kg/m2 and between 19% and 30% with a BMI 25.0–29.9 kg/m2. 3 The prevalence of a high pre-pregnancy BMI is concerning considering that maternal obesity is not only associated with adverse maternal and neonatal outcomes 4 but also with potential long-term health of offspring and neurodevelopment disorders.5,6
Pregnancy is a period when women are at risk of gaining excessive weight, increasing medical complications such as gestational diabetes mellitus, gestational hypertension, pre-eclampsia, macrosomia, operative vaginal delivery and cesarean section.7–9 Furthermore, gestational weight gain (GWG) below the Institute of Medicine (IOM) guidelines has been associated with a variety of adverse maternal and neonatal outcomes, such as preterm birth and delivery of low-birth-weight infants. 10 According to a recent systematic review, about 47% had a GWG greater than the IOM guidelines and 23% below. 11 Though pregnancy-related weight gain has been a public health and policy concern across the world, there is limited knowledge on obesity, GWG and health behavior of fertile and pregnant Italian women.12,13 Hence, this study aims to fill an important gap in the literature by describing patterns of pre-pregnancy weight, prenatal physical activity (PA) and GWG in the Italian context. Addressing how the nature of PA and pre-pregnancy BMI are changing among pregnant women is an important contribution to the pregnancy weight literature.
It is generally recommended that healthy pregnant women should accumulate at least 150 min of moderate-intensity PA weekly.7,14 Following these recommendations reduces the risk for excessive GWG, post-partum weight retention, and prevents gestational diabetes, gestational hypertension, macrosomia and newborn’s large-for-gestational age.7,15–19 Despite this evidence, pregnant women reduce their PA with advancing gestation due to pregnancy-related symptoms and limitations (e.g. nausea, fatigue, lack of energy, back and pelvic girdle pain, urinary incontinence and swelling), mother-fetus safety concerns (fear of harming the baby or themselves, miscarriage), lack of motivation (low self-efficacy, no pre-pregnancy habit of exercise, environment) and lack of advices and social support (lack of knowledge on exercise, lack of healthcare providers guidance and counseling, advice to avoid exercise).20–22 There are, however, little data on whether daily-life activities, such as active commuting and household tasks, may compensate for the low levels of exercise during pregnancy.12,23,24
Unlike other European countries, Italy has strong traditional role regarding pregnancy and motherhood, including the role of “la famiglia” (the family), which often forms the basis of social circles and lifestyle. 25 This cultural pattern is also found in Spanish households where men are the primary income earners and women are responsible for domestic duties and for raising children. 26 Consequently, pregnant women are considered vulnerable individuals whose lifestyle is strongly influenced by this perception (e.g. they should rest, they should stop exercising and keep the fetus safe). As far as we have ascertained, previous studies on Italian pregnant women have aimed at either assessing changes in PA volume across pregnancy, using questionnaires not specifically designed for a pregnant population, 12 or analyzing the role of pre-pregnancy BMI and GWG on pregnancy outcomes without taking into consideration PA patterns.13,27 In our study, we assessed PA using Physical Activity Pregnancy Questionnaire (PAPQ), 21 a validated trimester-specific questionnaire accounting for the full range of PA, including commuting, occupation, domestic chores and recreational exercise/sport. 28 Primary objective describes health and lifestyle behavior of pregnant Italian women. Secondary objective reports total PA level, recreational exercise and context of these activities from pre-pregnancy and throughout gestation in regard to GWG management.
Materials and methods
Pregnant Italian Women (PIW) is a cross-sectional study conducted in Rome and Modena, Italy, recruiting participants from one public hospital (Fatebenefratelli San Giovanni Calibita-Isola Tiberina) and four antenatal clinics. The Ethical Committee of the University of Rome Foro-Italico, Italy, approved the project and the complete data collection (CARD 2018/12). The STROBE guidelines were followed.
Participants and enrollment
Eligible women were recruited in 2018 during routine appointment with the medical staff at gestation week 30–32. Enrollment was limited to healthy Italian speaking women, age ⩾18 years, gestation week ⩾32, with a singleton pregnancy and no reported risks for adverse pregnancy outcomes or fetus pathologies. 7 Hence, women with gestational diabetes mellitus and pre-eclampsia were excluded. In this study, nulliparous was defined as a woman expecting her first child and multiparous as a woman who had given birth to one or more children.
Totally, 665 participants expressed interest to participate in the study; however, 87 were lost or withdrew before study enrolment, and 65 did not meet the eligibility criteria. Hence, 513 women signed an informed consent form and completed all measurements, including the PAPQ.
Measurements and outcomes
Maternal weight (kg) was collected by two gynecologists (SD and ET) at gestation week 32–33. Weighing was done in light clothing and without shoes using a digital beam scale to the nearest 0.1 kg. Calculation of pre-pregnancy BMI (kg/m2) was based on self-reported weight and height. GWG was defined as the difference between self-reported pre-pregnancy bodyweight and measured bodyweight. Participants were divided into GWG categories, using pre-pregnancy BMI groupings recommended by the IOM. 29
The original PAPQ was translated into Italian by the first author (MBB) and it was used to obtain information on demographics, health and lifestyle variables, including pregnancy complaints and reports of being sick-listed, as well as sedentary behavior and daily life PA (at work, commuting, household and recreational exercise/sport). 21 A pre-test of the Italian version of the questionnaire was done among pregnant friends and colleagues (n = 10). The main goal was to identify any possible problem with the format and wording of the translated version. PAPQ required 10–15 min and included 53 questions specifically designed for the pregnant population, which has shown to provide a close estimate of total PA level, concurrent with data from a motion monitor (ActiReg®; PreMed AS, Oslo, Norway). 28
The PAPQ was handed out in paper from gestation week 32 and had to be returned at last consultation (gestation week 40). However, 86.9% completed it during their consultation at gestation week 36. For the purpose of the study aims, six out of the eight sections of the PAPQ were used. General information and health aspects covered age, height, pre-pregnancy body weight, cohabitation, level of education, parity, smoking and eating habits pre- and during pregnancy. Participants’ perception of daily diet was assessed retrospectively (pre-pregnancy) and cross-sectionally (at gestation week 36.01), with the following question: How would you describe your eating habits, including making healthy nutritional choices?. The response options ranked from 1 to 5 (very bad to excellent) and women were divided into two categories: healthy (excellent and good diet) and unhealthy eating habits (average, bad and very bad diet). Healthy or unhealthy eating habits were not specifically defined in the questionnaire, but we assumed that for Italian women, healthy eating habits would be the Mediterranean diet, which is high in vegetables, fruits, legumes, nuts, beans, cereals, grains, fish and unsaturated fats such as olive oil.
Daily life PA was assessed through specific questions for each domain: (1) Domestic chores, taking kids to/from school, gardening and domestic chores; (2) Occupational activities, walking or standing at work, heavy lifting and bending; (3) Commuting activities (walking excluding working hours), such as walking to and from work/shopping, daily walking and cycling ⩾30 min (multiple responses available); and (4) Sedentary activity, hours spent on TV–watching, using computer or other electronic devices or reading, for both weekdays and weekend.
Nine questions, including type of activity, intensity, duration and frequency were used to obtain information on recreational exercise/sport. 21 Frequency (moderate intensity leisure-time PA ⩾ 20 min) was assessed by six response-alternatives: once per week or less, 2–3 times per week, 4–5 times per week, 6 times per week and every day or more than once every day. Based on that, prevalence of pregnant women accumulating ⩾150 min a week of recreational exercise/sport was calculated. Moreover, we combined recreational exercise/sport with daily PA (commuting and occupational activities) to report on total PA level of ⩾150 min weekly.7,14
Information on daily PA and recreational exercise, pre-pregnancy, first and second trimesters was obtained retrospectively, while information about third trimester was assessed at present-day (mean gestational week: 36.08, SD: 2.0).
Statistical analysis
Statistical analyses were conducted with SPSS Software V. 24 for Windows. Data are presented as n (%) or means with standard deviation (SD). All data were explored for normality and determined by skewness, histograms and significance level (Kolmogorov–Smirnov Test for Normality). Even though some of our data were not normally distributed, we had statistical advice to compare differences using parametric tests due to the large sample size. Participant’s background, health and lifestyle variables are presented as frequencies, percentages or means with SD. For group comparisons, categorical variables were analyzed using Pearson’s Chi-square test, and continuous variables were analyzed using the independent sample t-test.
According to pre-pregnancy BMI groupings recommended by the IOM, we divided the participants into four GWG categories: 12.5–18.0 kg for underweight women (pre-pregnancy BMI < 18.5), 11.5–16.0 kg for normal weight women (pre-pregnancy BMI 18.5–24.9), 7.0–11.5 kg for overweight women (pre-pregnancy BMI 25.0–29.9) and 5.0–9.0 kg weight gain for obese women (pre-pregnancy BMI ⩾ 30). Whether a woman had gained weight below, within or above the guidelines was calculated using mean recommended weight gain in first trimester (1.5 kg), adding the mean recommended number of grams per week multiplied by the number of weeks the woman was pregnant above the first trimester. 29
Moreover, whether participants exercised according to American College of Obstetricians and Gynecologists (ACOG) recommendations was calculated using the duration of moderate intensity-level recreational exercise, multiplied by the weekly frequency. Based on this calculation, participants were classified as regular exercisers (⩾150 min per week) or not regular exercisers (<150 min per week).
Binary logistic regression was performed to explore the associations between maternal characteristics (parity, age and healthy eating habits) and GWG above the IOM guidelines.
Results
Background variables, health and lifestyle behavior of the study population
Participants answered the PAPQ in mean gestation week 36.01 (SD 2.0).
Table 1 summarized background variables, health and lifestyle behavior of the study population. Mean GWG and proportions of women classified as gaining below, within and above the IOM recommendations for GWG 29 are shown in Table 2. Mean GWG was not associated with any health complaints (back pain: 11.6 kg, SD 4.1 vs 12.2 kg, SD 4.1, p = 0.119; pelvic girdle pain: 11.8 kg, SD 3.9 vs 12.2 kg, SD 4.3, p = 0.307; urinary incontinence: 12.0 kg, SD 4.0 vs 11.7 kg, SD 4.4, p = 0.513). In women affected by overweight, GWG above the IOM guidelines was associated with low back pain (p = 0.045) and unhealthy eating habits (p > 0.001). Other maternal characteristics (parity and age) were not associated with GWG above IOM guidelines.
Background, health and lifestyle variables of the study population (n = 513).

SD: standard deviation; BMI: body mass index; GWG: gestational weight gain.
Mean GWG and proportions of women classified as gaining below, within and above IOM recommendations for GWG (n = 513).

SD: standard deviation; BMI: body mass index; GWG: gestational weight gain; IOM: Institute of Medicine.
Total PA level
Regardless of the women’s pre-pregnancy BMI, in third trimester, 82.7% accumulated ⩾150 min/week of PA, covering recreational exercise/sport, commuting and occupational activities. Table 3 shows mean GWG, BMI and IOM grouping between ⩾150 min of total PA and <150 min weekly.
Comparison of mean GWG, BMI and IOM grouping between ⩾150 min/week and <150 min/week of recreational exercise and total PA (n = 513).
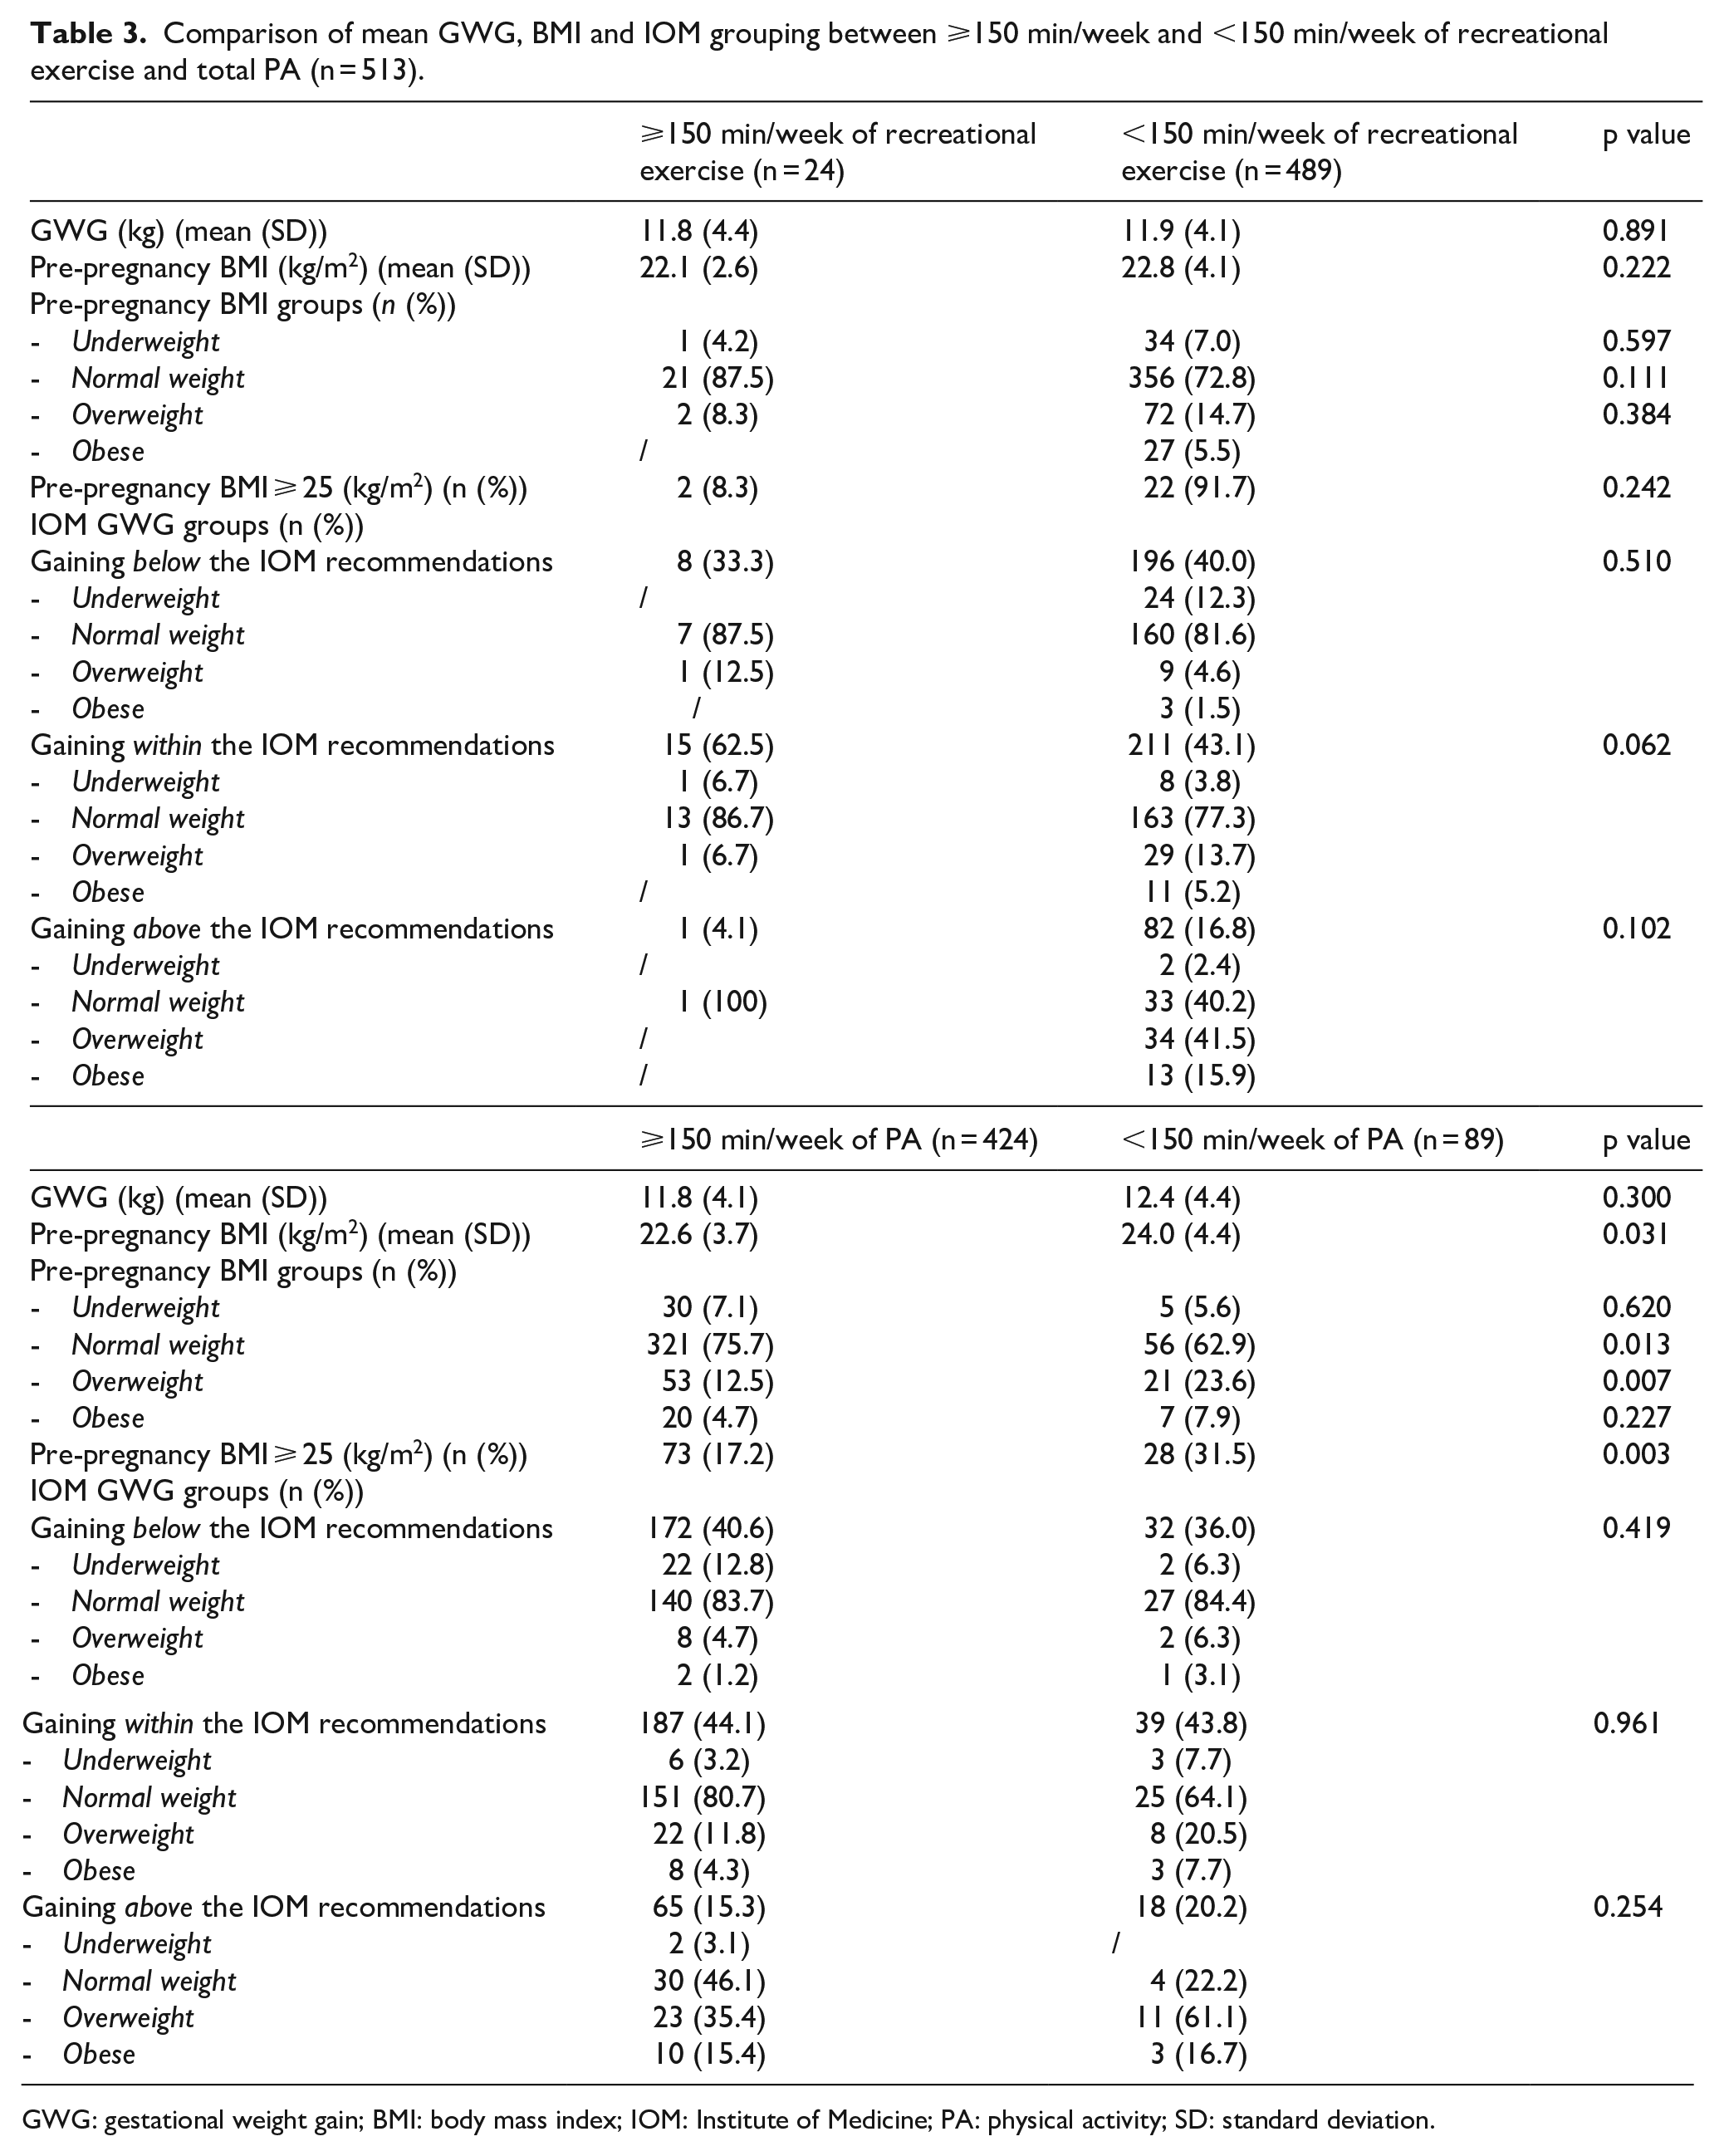
GWG: gestational weight gain; BMI: body mass index; IOM: Institute of Medicine; PA: physical activity; SD: standard deviation.
Recreational exercise/sport
A reduction in frequency, duration and intensity of exercise throughout pregnancy was observed (Table 4). When combining these three variables, 4.7% were active according to the ACOG guidelines, 7 during third trimester. Among these, only one woman gained above the IOM recommendations, and a higher proportion gained within (p = 0.062) compared with those exercising <150 min per week. The most common exercise modes are summarized in Table 5. Swimming, aerobic exercise for pregnancy and relaxation exercise increased in third trimester. Differences in the proportions of women engaging in these three activities were observed between pre-pregnancy and the third trimester (swimming: 22.6% vs 49.2%, p < 0.001; aerobic exercise for pregnant women: 0.4% vs 21.9%, p < 0.001; relaxation exercise: 7.4% vs 14.8%, p = 0.023). Moreover, between first and third trimester, we found differences in the proportions of women engaging in swimming (28.3% vs 49.2%, p < 0.001) and aerobic exercise for pregnant women (7.2% vs 21.9%, p < 0.001).
Recreational exercise frequency, duration and intensity before and during pregnancy, estimated with PAPQ (n = 513).

PAPQ: Physical Activity Pregnancy Questionnaire.
Proportions of women engaging in recreational exercise (⩾1 time a week) and the eight most frequently reported activities pre-pregnancy, first, second and third trimesters a (n = 513).

Results are presented as numbers (and percentages).
Participants could select multiple activities and a maximum of three for each trimester.
Commuting activity
Walking ⩾30 min daily was reported by 43.5% and commuting activity ⩾150 min weekly by 80.7%, in the third trimester. No difference was observed in mean GWG between women engaging in ⩾150 min of active commuting and those engaging in <150 min weekly (11.8 kg, SD 4.1 and 12.4 kg, SD 4.2, p = 0.213) nor in proportions gaining weight above, within or below the IOM recommendations (above: 15.2% vs 20.2%, p = 0.290; within: 42.0% vs 50.5%, p = 0.127 and below: 40.8% vs 33.3%, p = 0.171).
Occupational activity
Proportions of women working 100% dropped from pre-pregnancy throughout pregnancy (pre-pregnancy: 69.4%, first trimester: 51.1%, second trimester: 38.2% and third trimester: 9.2%, p < 0.01). Half (52.4%) worked in a sitting position, and 12.9% described their work as physically demanding. Women working 100% during third trimester showed lower mean GWG compared to those unemployed or sick-listed (11.1 kg, SD 3.6 vs 12.6 kg, SD 4.4; p = 0.027).
Domestic chores
Daily moderate-intensity household activities were overall stable, with a small reduction from pre-pregnancy to all the three trimesters (pre-pregnancy: 34.5%, first trimester: 21.6%, second trimester: 22.2%, third trimester: 18.9%; p < 0.001). No difference was found in mean GWG between women engaging in daily moderate-intensity household activities and their counterparts (12.2 kg, SD 4.0 vs 12.7 kg, SD 3.8; p = 0.505).
Sedentary activities and sitting time
Nearly 45% reported daily sedentary activities ⩾4 h, associated with nulliparity and low education (<4 years university/college; p < 0.001). No difference was shown in mean GWG between daily sitting time ⩾4 h and <4 h (12.2 kg, SD 4.2 vs 11.7 kg, SD 4.0; p = 0.213).
Discussion
About 20% entered pregnancy overweight or obese, and half of these (47%) gained weight above the IOM recommendations. Low exercise level was found among participants, and in third trimester only 5% exercised according to the ACOG recommendations.7,14 Among those who exercised ⩾150 min weekly, a higher proportion gained GWG within the IOM recommendation. 29 When combining recreational exercise with daily PA, 83% were physically active for ⩾150 min weekly. No difference was found in mean GWG or in GWG according to the IOM grouping between women reporting ⩾150 min of total PA and their counterparts. Women working 100% throughout gestation showed a lower GWG. GWG was not associated with health complains; however, in overweight women, GWG above the IOM recommendations was associated with low back pain.
Health and lifestyle behavior
Most participants reported healthy eating habits, and few (7%) drank alcohol once a month or more. Compared with Mårdby, 30 the numbers of women consuming alcohol are much higher (18%). Hence, it is not unlikely that the latter was underreported. Besides, perception of daily diet was assessed by one question only, which may not accurately capture the women’s nutritional status. Similar to our findings, others have also reported a rapid decline in the daily smokers from pre-pregnancy to late gestation. 31 National statistics show that around 70% quit smoking once they entered pregnancy. 32
In line with a European and two Italian studies, most women were classified as normal weight prior to the current pregnancy.12,27,33 However, we should consider that we have obtained pre-pregnancy weight retrospectively in the third trimester and recall could have affected our results. Recent studies confirmed that measured weight in early pregnancy provides a more accurate assessment of pre-pregnancy weight than recalled weight and avoids misclassification, underreporting of pre-pregnancy and delivery weight or over-reporting of GWG.34,35
No difference in mean GWG was found between BMI classes. Still, because the IOM gives different recommendations for BMI groups and not all pregnant women may be aware of them, more than half of the participants did not meet the current guidelines. Our findings are therefore consistent with previous studies, which indicate that high pre-pregnancy BMI is a strong predictor of GWG above the IOM guidelines.36,37
Total PA level, recreational exercise and GWG management
Like others, we found a substantial decrease in proportions of women reporting recreational exercise from pre-pregnancy and throughout gestation was observed.21,38,39 In third trimester, 5% were defined as exercisers according to the ACOG recommendations, which is lower than what other studies have reported.12,40–42 These findings could be explained by the fact that, according to the annual statistical report, 43 also pre-pregnancy a low proportion (21.7%) of Italian women are exercising regularly, and around 40% are physically inactive. Nevertheless, in this group achieving regular exercise, more women gained weight within the IOM recommendations, and only one had GWG above guidelines. This finding is supported by recent RCTs and meta-analyses.19,44
Considering common barriers to PA,20,45–47 active commuting may be a valid way to promote PA during pregnancy.48,49 As others have found, walking was the most common form of PA during pregnancy,12,21,50 and 81% reported active commuting ⩾150 min per week. Contrary to Skreden et al., 24 this was not associated with GWG.
With reference to Haakstad et al., 21 we assessed PA level accounting for active commuting, domestic chores and occupational activities together with recreational exercise. As a result of that, we were able to combine these data and calculate the proportion of women accumulating ⩾150 min per week of moderate-intensity PA. Total PA (⩾150 min/week) was associated with a healthy pre-pregnancy BMI, but contrary to Bacchi and coworkers, 12 this was not associated with average GWG nor proportions with a high GWG. Previous studies assessing PA level and including daily life activities report inconsistent findings on the impact on GWG.12,22,51
We found that 39.0% of women were on sick leave and that less than 10% worked 100% in the third trimester. We do not know the reason for the high sick-leave and can only speculate that this may be due to the “flexible maternity leave” arrangement available in Italy as well as the increase of advanced maternal age and at-risk pregnancies. 52 Indeed, in Italy, pregnant workers are required to take 5 months maternity leave, which can also start from 2 months before delivery. If pregnancy is considered at risk or the workplace puts woman or her unborn child in danger, she may ask her employer for extra time off before the due date. 53 Considering that enrollment in this study was limited to gestation week ⩾32, we may have included those pregnant women who benefited from the early maternity leave (2 months before delivery).
Partly in line with previous studies,51,54,55 working 100% was associated with lower GWG. However, due to the low proportions of pregnant women working full-time during the third trimester (9.2%), we may have underestimated results on pregnancy outcomes such as greater probability of normal gestational weight gain.
Strengths and limitations
Strengths of this study are a high response rate (86%), measurement of GWG (weeks 30–32) and the use of the validated PAPQ, specifically designed for the pregnant population, which has shown to provide a close estimate of total PA level. 28 While most studies focused on formal PA during pregnancy, we have extended the ACOG guidelines to a wider range of daily life PA including domestic chores, active commuting and occupational activities, in addition to recreational exercise. After all, PA is a broad term that is defined as any bodily movement produced by contraction of skeletal muscles that results in increased energy expenditure above a basal level. 7 Given the potential health-related benefits of PA but also the physiological tendency to decrease PA level throughout pregnancy, more work is needed to better support, inform and encourage pregnant women to be active.
Limitations are the retrospective and self-reported nature of some questions. Also, we did not use a validated instrument to assess perception of daily diet.
The study population was similar in several maternal characteristics (marital status, educational level, mean maternal age and parity) to other non-participants giving birth in Rome, Italy. This improved the generalizability of our findings.
Conclusion
A high percentage of overweight and obese women exceeded the IOM recommendations. Recreational exercise level was strikingly low in third trimester, still over 80% achieved a total PA level ⩾150 min/week when adding occupational and commuting activities. Considering the low exercise level and high proportions gaining outside the IOM recommendations, further interventions aimed at helping Italian women to increase exercise level and control GWG during pregnancy are recommended.
Footnotes
Acknowledgements
We thank Professor in Biostatistics, Morten Vang Fagerland (Head of Section for Biostatistics and Epidemiology at Oslo University Hospital) for guidance with the statistical analysis and Professor Fabio Facchinetti, (Director of the school of midwifery and the “Birth Center” of the Mother-Infant Dept. of the University Hospital of Modena and Reggio Emilia) for his support during the recruitment process in Modena.
We are thankful to Professor Morten Vang Fagerland for guidance with the statistical analysis and to Professor Fabio Facchinetti for his support during the recruitment process in Modena
Elin Elisabeth Hecker (e-mail:
Contributorship
L.A.H.H. and K.B. developed and validated the Physical Activity Pregnancy Questionnaire (PAPQ) used for the present study. M.B.B. was responsible for participant follow-up and data collection and plotted all data together with ET and SD. All authors read and approved the final manuscript.
Declaration of conflicting interests
The author(s) declared no potential conflicts of interest with respect to the research, authorship and/or publication of this article.
Funding
The author(s) received no financial support for the research, authorship and/or publication of this article.