
Abstract
Background:
Physical activity is essential to maintain the health of the mother and fetus during pregnancy; however, most pregnant women do not achieve the recommended amount. Studies have identified that social determinants of health (SDOH) may play a role in a woman’s ability to participate in physical activity throughout pregnancy; however, there is little exploration of pregnant women from diverse backgrounds. Differences across SDOH influence health-related quality of life (HRQOL) and health perception, and each variable’s relationship to physical activity during pregnancy requires further investigation.
Objectives:
Our first objective was to examine the relationship between SDOH and HRQOL variables in pregnant women. Our second objective was to compare participant physical activity levels by HRQOL, health perception, and SDOH categories in pregnant women.
Design:
Secondary analysis.
Methods:
Survey data from the National Institute of Health All of Us Research Program were utilized for this study. Demographics, SDOH, and HRQOL variables were extracted for analyses along with digital Fitbit data. HRQOL variables were analyzed for association with SDOH and demographic variables using separate one-way ANOVA. SDOH, demographic variables, and HRQOL variables were then analyzed for association with participant Fitbit data using separate one-way ANOVA. For significant associations, Tukey pairwise comparisons were performed.
Results:
We found significant differences in health perception and quality of life across groups of SDOH and demographic variables including supportive relationships, income level, education level, and marital status. Women who reported higher HRQOL perceptions had significantly higher step counts and more very active minutes than those who reported lower HRQOL perceptions.
Conclusions:
SDOH are related to how pregnant women perceive their health and quality of life. Pregnant women with better health and quality-of-life perceptions are more likely to participate in more very active physical activity.
Plain language summary
Introduction
Physical activity is an essential component of maintaining the health of the mother and fetus during pregnancy. 1 The benefits of participating in physical activity during pregnancy include decreased risk of preeclampsia, improvement in pregnancy-related pain, decreased gestational weight gain,1,2 and decreased levels of depression and anxiety in expectant mothers. 1 Consistent participation in physical activity throughout pregnancy also reduces the risk of macrosomia, or excessive weight at birth, which is a condition that increases the likelihood of operative deliveries, birth trauma, and postpartum hemorrhage. 3 Inversely, lack of physical activity during pregnancy is linked to adverse health outcomes for expectant mothers and their babies, including gestational hypertension, premature birth, 4 and decreased infant cardiac function. 5
It is estimated that only 52% of pregnant women achieve the recommended amount of physical activity throughout their pregnancy. 4 Recent studies have determined that social determinants of health (SDOH) influence a woman’s ability to participate in physical activity throughout pregnancy. 6 SDOH are factors and conditions within an individual’s environment that influence health, functioning, and overall quality of life and are grouped into five domains: economic stability, education access and quality, healthcare access and quality, neighborhood and built environment (e.g., neighborhood safety and access to public transportation), and social and community context (e.g., social relationships and support). 7 It is imperative to explore these factors across a population-based sample of pregnant women to understand the relationship between SDOH and physical activity during pregnancy. The National Institutes of Health All of Us Research Program is a large online database comprised of survey information, electronic health records, biological samples, physical measurements, and wearable Fitbit data from a group of individuals who are diverse in gender identity, sexual orientation, socioeconomic status, education, disability, and health status. A national sample from this database will provide the opportunity to analyze demographic information, SDOH variables, and wearable Fitbit data from a diverse group of pregnant women.
Differences across SDOH, including marital status, education level, occupational status, and household income, influence physical activity level 8 and self-reported health-related quality of life (HRQOL). 9 HRQOL is a multifaceted concept that defines an individual’s negative or subjective assessment of their life, including physical and mental health perceptions and their relevance, which is the most common subjective factor affecting the health of pregnant women. 10 Previous literature has identified a linear relationship between physical activity and self-reported HRQOL 11 ; however, this has not been explored specifically in a pregnant population, nor as a potential predictor variable for physical activity. It is important to understand the relationships between SDOH, HRQOL, and physical activity in pregnant women for clinicians to optimally support maternal and fetal health. Therefore, the first objective of this study was to examine the relationship between HRQOL and SDOH in pregnant women. We hypothesized that women with higher income, higher education, and current employment would report better HRQOL. Our second objective was to compare participant physical activity levels by HRQOL, health perception, and SDOH categories in pregnant women. We hypothesized that participants who reported better HRQOL, higher income, higher education, and current employment would participate in more objective physical activity.
Methods
The reporting of this study conforms to the STROBE statement. Ethics approval and written consent requirements to conduct this study were waived by the University of Kentucky Institutional Review Board.
Participants
Data from the National Institute of Health All of Us Research Program were used for this study (https://www.researchallofus.org/data-tools/survey-explorer/). All of Us surveys were developed from multiple sources and were tested for readability and accessibility using interviews and quantitative testing by people from various educational backgrounds and geographic location. 12 Surveys were administered to participants through an online patient portal once between May 2017 and April 2024. Digital Fitbit data were also collected during this window. For inclusion, women who were pregnant in any trimester, over the age of 18 with at least one daily activity Fitbit summary, were included in the cohort selected for this analysis.
Instrumentation
Demographic survey
The Basics survey is a demographic survey that determines many demographic and SDOH variables, including country of birth, race, gender identity, biological sex, sexual orientation, highest level of education, military affiliation, marital status, number of people in household, health insurance coverage, disability status, employment status, annual household income, ownership of home, years lived at current address, and financial stress. For this study, we extracted self-reported race (White and Non-White (Black or African American, Hispanic, Asian, Multiple Races, Other)), highest level of education (college graduate or advanced degree, high school diploma/General Educational Development (GED) or some college), marital status (married, not married), employment status (currently employed, currently unemployed), and annual household income (> $200,000, $50,000 to $200,000, < $10,000 to $50,000). Health insurance status was considered as a variable but was removed due to limited variability within the variable as there were a lack of uninsured participants.
SDOH survey
The SDOH survey was also collected from all participants of the All of Us database. This survey assessed various personal factors associated with participants’ SDOH such as neighborhood safety, neighborhood walkability and accessibility, supportive relationships, relationships with others, discrimination, food and housing security, stress, religious beliefs, and preferred language. The variables extracted from this survey for this study included: (1) access to public transit measured by the rating of “It is within a 10–15 minute walk to a transit stop from my home” on a 4-point Likert scale (1 = strongly agree, 2 = somewhat agree, 3 = somewhat disagree, 4 = strongly agree), (2) neighborhood crime measured by the rating of “There is a lot of crime in my neighborhood” on a 4-point Likert scale (1 = strongly agree, 2 = agree, 3 = disagree, 4 = strongly disagree), and (3) supportive relationships measured by the rating of “I can find companionship when I want it” on a 4-point Likert scale (1 = often, 2 = sometimes, 3 = rarely, 4 = never). These variables were chosen since they are known to influence health behaviors. 13
Overall health survey
The Overall Health survey is a questionnaire that is used to assess participant perception of health status. For this study, the variables utilized to assess participant HRQOL were extracted from this survey and included (1) health perception measured by the rating of “In general, would you say your health is: 1 = excellent, 2 = very good, 3 = good, 4 = fair, and 5 = poor” and (2) quality-of-life perception measured by the rating of “In general, would you say your quality of life is: 1 = excellent, 2 = very good, 3 = good, 4 = fair, and 5 = poor.”
Fitbit digital health data
The Fitbit is a personal wearable digital health device, typically worn on the wrist, that tracks and records heart rate and daily physical activity data. Participants of this study contributed their daily activity summaries to the All of Us database. For this investigation, the average of each participant’s daily activity summaries was calculated for the following categories: lightly active minutes, which Fitbit defines as any activity <3 metabolic equivalents of task (MET), very active minutes (>6 METs), and steps. Participant Fitbit data collected outside of the pregnancy term were not considered for data analysis.
Statistical analysis
Descriptive statistics (mean + standard deviation, median (interquartile ranges)) were calculated for all continuous variables. Counts (frequencies) were calculated for all dichotomous and ordinal variables. Any categories with data counts under 20 were binned within other categories as per the All of Us Data and Statistics Dissemination Policy or reported as non-reportable (NR). For the purposes of this study, the following categories were binned: race (Black or African American, Hispanic, Asian, multiple races, other binned as non-White), neighborhood crime (strongly agree binned with agree), access to public transit (somewhat agree binned with somewhat disagree), marital status (living with partner, divorced, separated, widowed, and never married binned as not married), and income ($150,000 to $200,000, $100,000 to $150,000, $75,000 to $100,000, $50,000 to $75,000 binned as $50,000 to $200,000, and $35,000 to $50,000, $25,000 to $35,000, $10,000 to $35,000, and < $10,000 binned as < $10,000 to $50,000). HRQOL variables were treated as continuous variables and analyzed for association with SDOH and demographic variables using separate one-way ANOVA. For those variables that were significantly associated, Tukey pairwise comparisons were performed to determine between which groups the significance occurred. SDOH, demographic variables, and HRQOL variables were then analyzed for association with participant daily activity Fitbit data using separate one-way ANOVA. For those variables that were significantly associated, Tukey pairwise comparisons were performed to determine between which groups the significance occurred. All analysis was performed using R 4.3.1 (R Foundation for Statistical Computing, Vienna, Austria). Across all analyses, a p-value less than 0.05 was considered statistically significant. Participants with survey data that were missing or selected as “skip” were not included in the specific statistical analyses.
Results
A total of 293 participants met the inclusion criteria and were included in this analysis. These participants were 84% White and 9% non-White (Black, Hispanic, Asian, multiracial, other racial identity, and unspecified race). All participants specified their gender identity as “woman,” so gender identity was not included as a variable in the analysis due to homogeneity. The counts (frequencies) for all demographic and SDOH variables are in Table 1.
Demographic and SDOH variables for all participants (n = 293).

SDOH: social determinants of health; NR: non-reportable; GED: General Educational Development.
Denotes variable categories that were binned due to data counts under 20.
The relationship between SDOH, demographic variables, and health perception
We found significant differences in health perception across categories (Table 2). Those participants who reported that they could find companionship “often” reported a better health perception than those who reported that they could find companionship “sometimes” (p < 0.001) or “rarely” (p = 0.04). Those participants who reported an income level of > $200,000 a year reported a better health perception rating than those who made < $10,000 to $50,000 (p = 0.001). Those who reported a yearly income of $50,000 to $200,000 reported better health perceptions than those in the < $10,000 to $50,000 category (p < 0.001). The participants who reported being college graduates or earning advanced degrees reported better health perceptions than those who had only completed high school/GED or some college (p < 0.001; Table 2). Finally, those who reported that they were married had better health perceptions than those who reported they were not married (p = 0.004). There were no significant differences found between groups for neighborhood crime level, access to public transit, race, insurance status, or employment status with health perception.
Mean and standard deviation health perception rating by demographics.

SD: standard deviation; GED: General Educational Development.
Denotes variable categories that were binned due to data counts under 20.
Bold values denote statistically significant values within the table.
The relationship between SDOH, demographic variables, and quality-of-life perception
There are significant differences in quality-of-life perception across categories of SDOH and demographic variables (Table 3). Those participants who reported that they could find companionship “often” reported a better quality-of-life perception than those who reported that they could find companionship “sometimes” (p < 0.001), “rarely” (p = 0.002), and “never” (p = 0.03, Table 3). Participants that reported an income level of > $200,000 per year reported a better quality-of-life perception rating than those who reported an income of < $10,000 to $50,000 per year (p = 0.001). Additionally, those who reported an income of $50,000 to $200,000 per year reported better quality-of-life perception ratings than those who reported an income of < $10,000 to $50,000 (p = 0.001). Participants that reported being college graduates or earning advanced degrees reported better quality-of-life perceptions than those who had only completed high school/GED or some college (p < 0.001). Finally, those who reported that they were married had better quality-of-life perceptions than those who reported they were not married (p < 0.001). There were no significant differences found between groups for neighborhood crime level, access to public transit, race, insurance status, or employment status with quality-of-life perception.
Mean and standard deviation quality-of-life perception rating by demographics and social determinant of health variables.

SD: standard deviation; GED: General Educational Development.
Denotes variable categories that were binned due to data counts under 20.
Bold values denote statistically significant values within the table.
Differences in physical activity summaries across SDOH
There were no significant differences found between lightly active minutes and categories of SDOH, demographic, or perceived HRQOL variables (health perception or quality-of-life perception; Table 4).
Fitbit daily activity summary for all participants (mean (SD); n = 293).
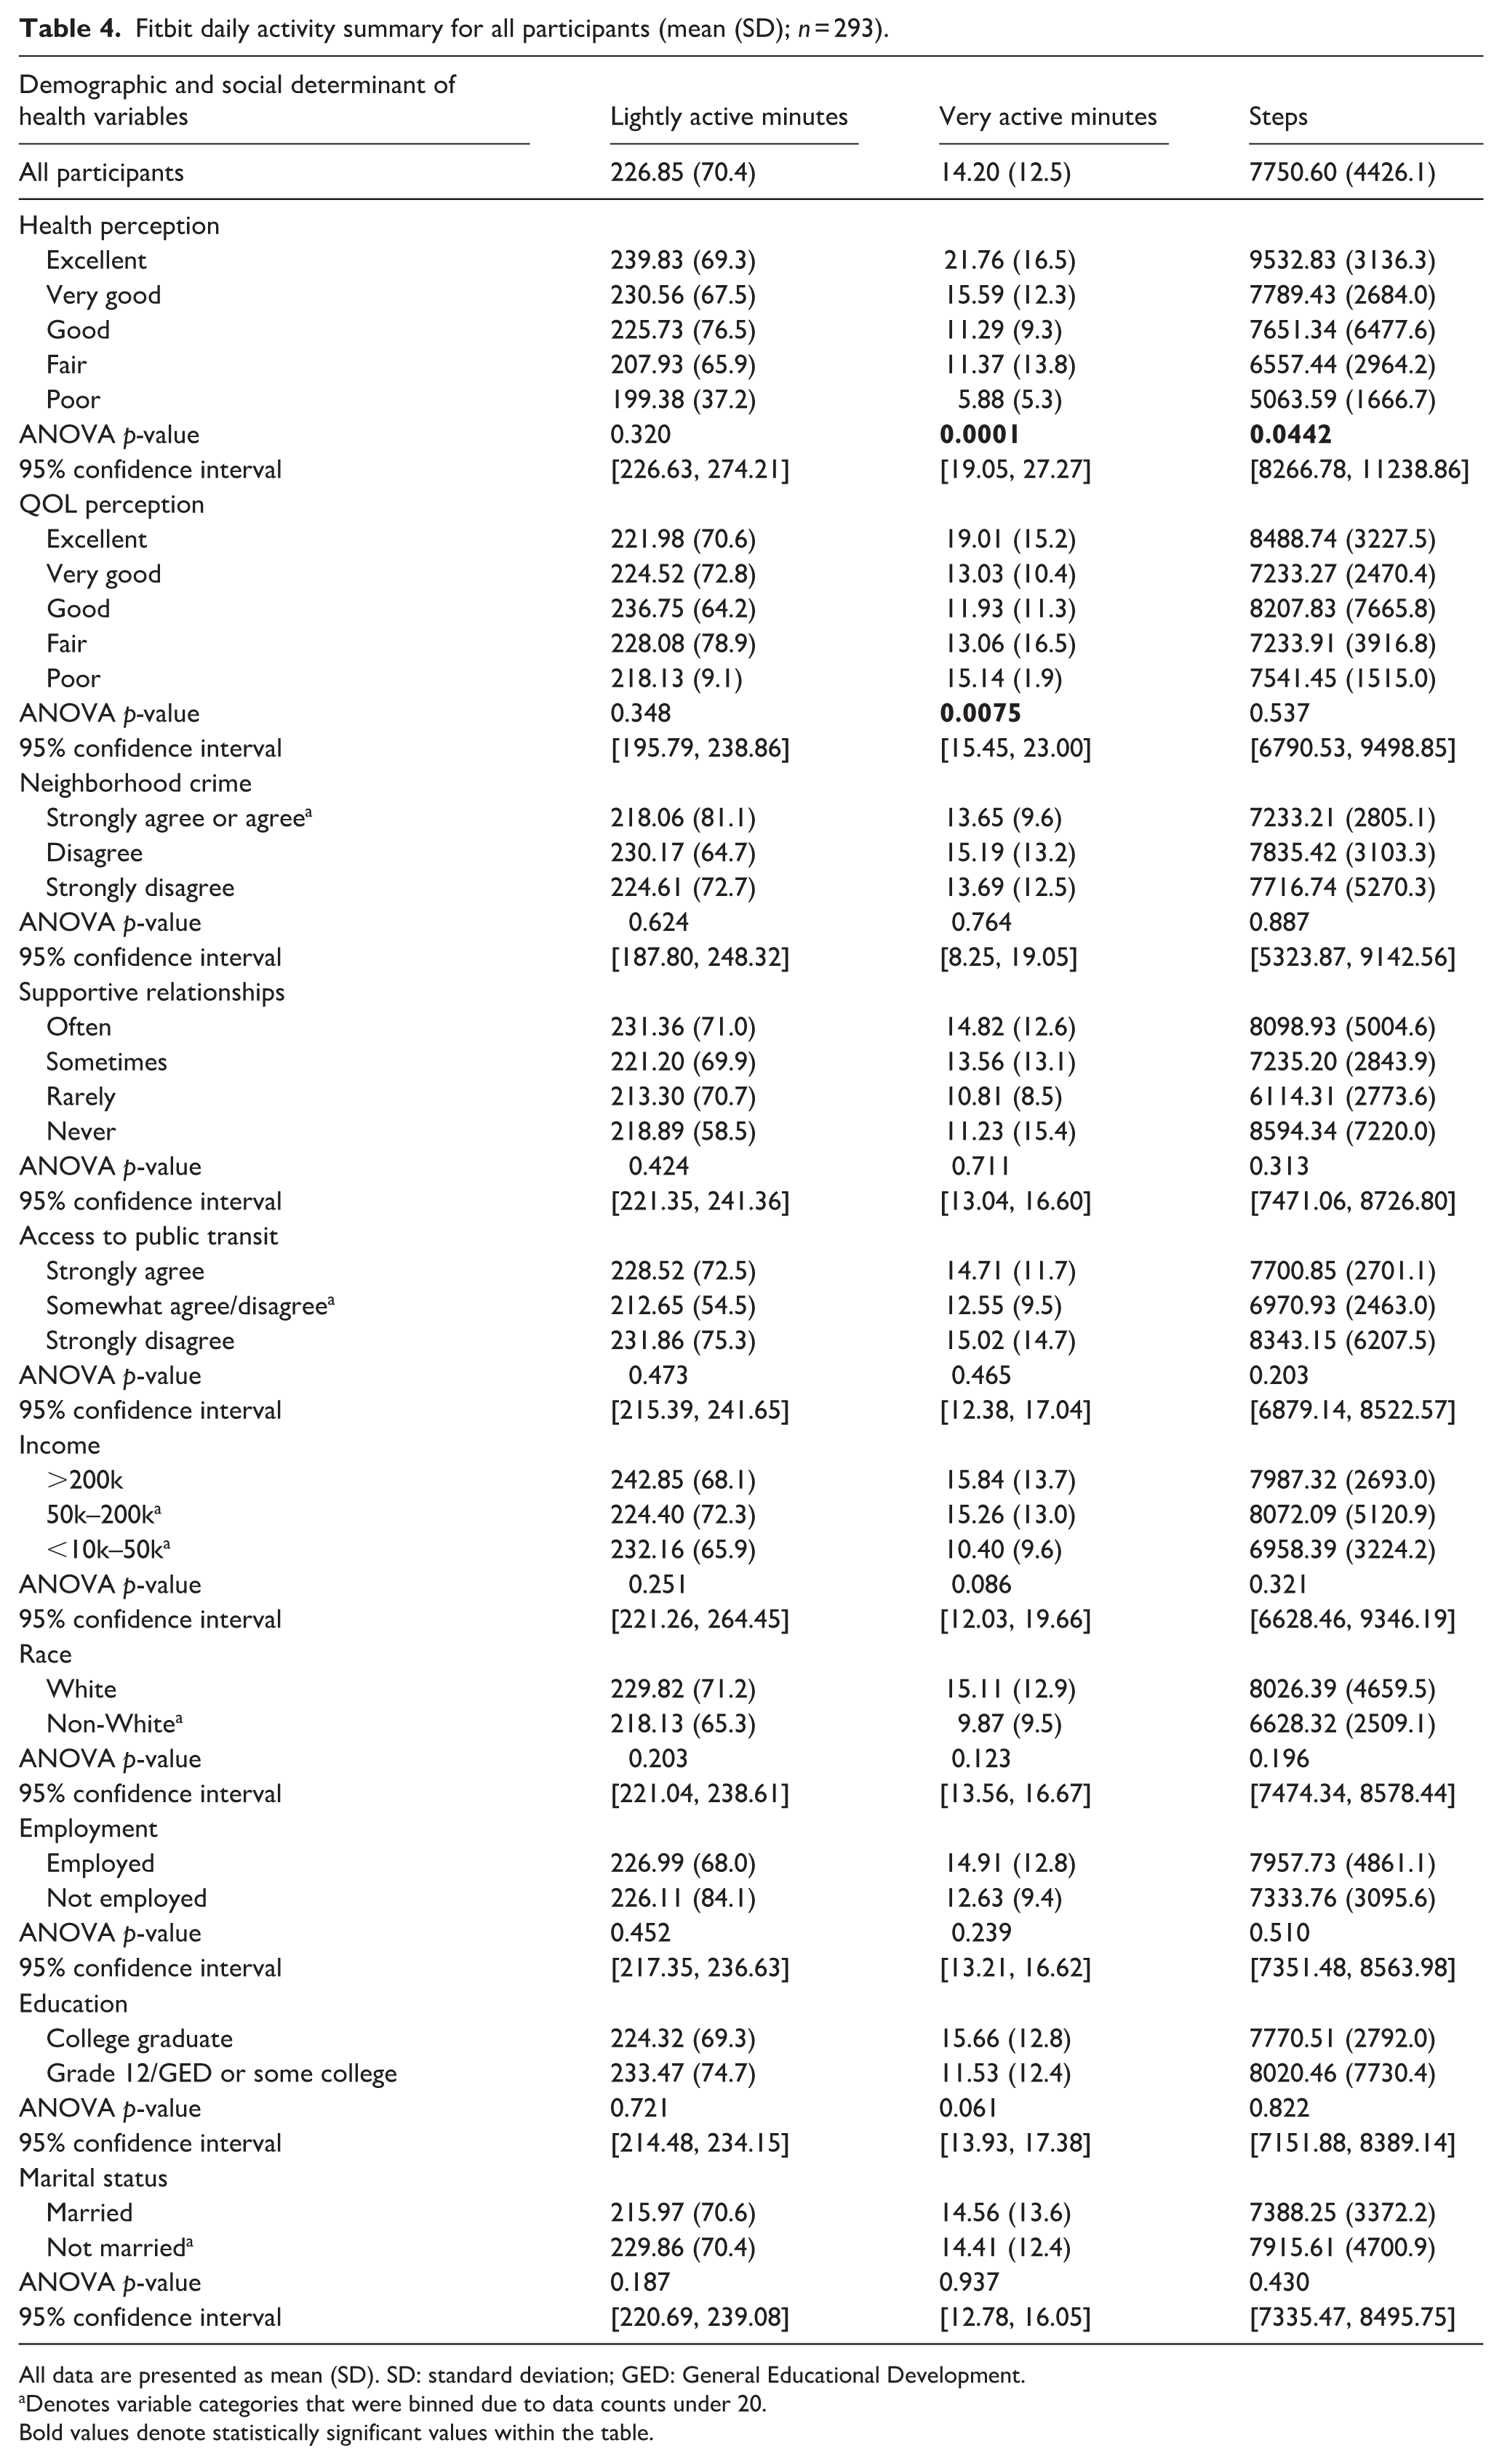
All data are presented as mean (SD). SD: standard deviation; GED: General Educational Development.
Denotes variable categories that were binned due to data counts under 20.
Bold values denote statistically significant values within the table.
We found a significant difference in mean very active minutes across categories (Table 4). Those participants who rated their health perception as “excellent” participated in more very active minutes per week than those who reported their health perception as “good” (p < 0.01) or “fair” (p = 0.0046; Table 4). Those participants who rated their quality-of-life perception as “excellent” participated in more very active minutes per week than those who reported “very good” (p = 0.0095) or “good” (p = 0.0082; Table 4). No other differences across groups were found between very active minutes and SDOH or demographic variables.
For mean steps, those participants who rated their health perception as “excellent” participated in more very active minutes per week than those who reported their health perception as “fair” (p = 0.046; Table 4). No other differences across categories were found between means steps and SDOH, demographic, and quality of life variables.
Discussion
The purpose of this analysis was to examine the relationship between health perception, quality of life, SDOH, and demographic variables. A secondary purpose was to determine if SDOH, demographic variables, health perception, and quality of life were associated with objectively measured physical activity in pregnant women. We found significant differences in health perception across categories of SDOH and demographic variables including supportive relationship, income level, education level, and marital status groups. In addition, we determined there were differences in quality-of-life perception across categories of SDOH and demographic variables, including supportive relationships, income level, education level, and marital status groups. No differences were found between categories of neighborhood crime, access to public transit, race, or employment status for health perception or quality-of-life perception. For physical activity, no significant differences were found across categories between lightly active minutes and SDOH, demographic, or perceived HRQOL variables. However, women who reported higher health and quality-of-life perceptions had significantly higher step counts and very active minutes than those who reported lower health and quality-of-life perceptions.
Supportive relationships and marital status
Women who reported more frequent access to supportive relationships reported better health perceptions and quality-of-life perceptions. Access to supportive friends, family, and partners may provide opportunities for companionship and co-participation in physical activity and encouragement of other healthy behaviors, which can contribute to increased activity, overall health perception, and quality of life. 14 A recent study surveying women in the postpartum period found that perceived social support, specifically from family and partners, had a significant relationship with the amount of physical activity women achieved in the post-partum period. 14 Women who reported a higher amount of assistance with chores and co-participation in physical activity achieved 50% more moderate to vigorous physical activity than women who reported lower perceived support in these areas. 14 Additionally, those who identified that they were married reported a better health perception and quality-of-life perception than those who were not married. Marriage may provide opportunities for co-participation in physical activity, assistance with chores so that women can participate in physical activity, 14 and other healthy behaviors, which can contribute to overall health and quality of life. Previous literature has shown that pregnant women with physically active partners engage in physical activity more often than those who do not. 15 Therefore, pregnant women with physically active partners may have access to additional support and companionship throughout pregnancy to help support healthy behaviors, and this increases health perception and quality of life.
Income
The participants who reported higher household incomes reported better quality-of-life perceptions. Previous literature has shown an association between income and risk of disease, where those of lower income status have an increased risk of developing disease throughout the lifespan. 16 Since income is a non-modifiable factor that can influence overall health, clinicians and providers can identify pregnant women whose income status may be a barrier and provide additional support to improve health outcomes such as health perception and quality-of-life perception. A recent study conducted focus groups to explore perceived barriers to physical activity in pregnant women who were participants of the Special Supplemental Nutrition Program for Women, Infants, and Children (WIC). 17 Women participating in the WIC program receive support with supplemental food, nutrition education, and healthcare referrals based on lower income status and need lifestyle interventions to improve health outcomes. 17 The pregnant women in this study identified that a community-based program for pregnant women, supplemental educational materials about exercise, and increased social support from family and friends would help to increase their physical activity during pregnancy. 17 Providing pregnant women of lower income with these community-based resources may improve physical activity during pregnancy, which may improve health perception and quality-of-life perception.
Education
There were significant differences in health perception and quality-of-life perception among education-level groups, where those participants who were college graduates or had earned advanced degrees reported better health perceptions and quality-of-life perceptions. While education level may be a non-modifiable variable, clinicians can educate their patients about the importance of physical activity during pregnancy to improve overall well-being and quality of life. Recent intervention studies have been successful in improving physical activity and dietary habits in pregnant women using educational counseling sessions.18–21 The interventions included providing educational materials on physical activity, healthy dietary habits and weight gain, and behavioral change during pregnancy to pregnant women, as well as providing multiple one-on-one counseling sessions throughout the pregnancy.18–21 A few of the studies also provided text message reminders to exercise and follow a healthy diet.18,19 Additional studies have found success in improving healthy lifestyle habits during pregnancy by utilizing technology such as educational digital video discs (DVDs) and smartphone apps to deliver educational materials.21–24 Regardless of the mode of delivery, whether access to an educational pamphlet, counseling sessions, text reminders, DVDs, or smartphone apps, women who were provided educational information about physical activity and healthy diet during pregnancy experienced greater improvement in lifestyle compared to their control group counterparts. Clinicians should utilize educational intervention methods to improve the quality of life of pregnant women, as this can be an effective solution to the barrier of education level and background.
Physical activity summaries and HRQOL variables
Those women who reported their health perception as “excellent” had more very active minutes and step counts than those who reported their health perception as very good, good, fair, or poor. Existing literature suggests that a higher level of physical activity is associated with a higher self-reported health perception in the general population. 25 A recent correlational study analyzed the relationship between self-reported health perception and physical activity level using survey data. 25 The participants were mostly female, previously active, had children, and perceived their economic situation as “good.” 25 The study found that participants who were female, married, high school education or higher, lived in urban areas, and perceived their economic situation as “good” reported higher levels of health perception, 25 which supports the findings from the social determinants and health perception analyses in this study. Overall, a higher health perception was associated with higher levels of physical activity, suggesting that participation in physical activity may improve health perception. 25 A recent randomized controlled trial enrolled pregnant women in a lifestyle intervention that focused on improving overall health through physical activity and healthy eating habits. 23 Women attended weekly trainer-led group exercise sessions, participated in home exercise three to five times weekly, and attended two dietary counseling sessions during the intervention. 23 Participants in the intervention group experienced less gestational weight gain, excess weight gain, and lower infant birth weight compared to the control group. 23 Participants in the intervention group also participated in more physical activity during their pregnancy, as well as consumed less cholesterol and fat-dense foods than the control group. 23 Lifestyle interventions such as the previously mentioned study 23 demonstrate the success of improving health outcomes through physical activity, which can help to improve overall health in pregnant women and positively influence how they perceive their health.
Participants who spent more minutes being very active were more likely to report a better health perception compared to those who spent less time being very active. In addition, participants who spent more minutes being very active were more likely to report better quality-of-life perception, and participants who spent less time being very active were more likely to report poorer quality-of-life perception. While it is known that increasing physical activity levels can lead to many health benefits and overall improved health, the findings from this analysis suggest that physical activity can play a significant role in how one views their overall health and quality of life. By increasing the dose of physical activity, regardless of difficulty, pregnant women may not only see and feel physical improvements in their health but also perceive improvements in their overall health and quality of life.
Clinical implications
Pregnancy can be a challenging time for women, especially for those who are first-time, or single mothers. With so many physical, mental, and emotional changes occurring, it may be difficult for expectant mothers to prioritize their health and well-being. The findings from this study present beneficial information for pregnant women, as well as their providers and support network, on what may influence overall health perception and quality-of-life perception during pregnancy, as these are key factors that can influence health outcomes. Understanding how social determinants such as supportive relationships/social support, access to public transit, income, race, education level, and marital status can influence health perception and quality of life is essential for healthcare providers to provide competent and patient-centered care to pregnant women. It is also important for both pregnant women and their providers to understand how social determinants influence physical activity participation, as well as the relationship between physical activity, health perception, and quality-of-life perception. The findings from this study suggest that those who engaged in more physical activity reported better health perception and quality-of-life perception. Therefore, this information can be used by providers to utilize physical activity as a tool to improve health perception and quality of life in pregnant women, as well as identify barriers to meeting recommended exercise guidelines.
Limitations
There were a few limitations to this study. First, a power analysis was not performed for the purposes of this secondary analysis. This analysis was done on existing data that is a part of the All of Us database. While the All of Us database provided access to a diverse dataset of over 500,000 participants, very few of those participants were pregnant women who met the criteria for this study. Of the pregnant women who did meet inclusion criteria, there was a lack of diversity within the cohort. Most participants were White, college-educated, married women with a higher household income. While the findings presented in this study can be beneficial to understanding how social determinants and health perceptions influence physical activity in a pregnant population, these findings cannot be generalizable to women of color, women without college degrees, women who are unmarried, or women who have a lower household income, as these women were not adequately represented in this cohort. In addition to this, the variables in this study may not fully capture all of the SDOH that influence HRQOL. Though the variables used in this study are factors that have been known to influence HRQOL, individuals may be impacted by additional social determinants, such as cultural practices, environmental factors, and additional psychosocial factors that can influence how they perceive their health and quality of life. An additional limitation is that there was variability in the use of Fitbit devices among participants. Participants met inclusion criteria for the study as long as they had at least 1 day of Fitbit data, meaning that some participants’ daily activity summaries may be based off of multiple days of data, whereas other participants may have only had 1 day of data. Additionally, there is variability among Fitbit devices and potential underestimation or overestimation of step count and physical activity intensity. This could potentially affect the accuracy and representativeness of how much physical activity pregnant women are achieving day-to-day. Another limitation of this study is that bias is introduced with the self-reported surveys. Participants may not accurately report variables such as income or education, may overestimate their quality of life or health perception, or additionally may omit to answer such questions, which leads to missing data and decreases the power of statistical analyses.
Future research
Future research should aim to expand on this study by further investigating prospectively the relationships between SDOH, health perception, quality-of-life perception, and physical activity participation, as our study’s cross-sectional design limits the ability to infer causality and examine relationships between variables. Future studies need to include pregnant women of diverse backgrounds, especially women of color, women without college degrees, unmarried women, women of lower income status, and women in rural and urban locations, as these women are underrepresented in pregnancy and physical activity research. Future research should also aim to identify different interventions to improve health perception and quality of life in pregnant women. It may be beneficial to explore different types of physical activity interventions and how different categories of physical activity may impact health perceptions and quality-of-life perceptions for various demographic and socioeconomic groups.
Conclusion
SDOH, including neighborhood crime level, supportive relationships, income, education level, and marital status, are related to how pregnant women perceive their overall health and quality of life. The association between health perception, quality-of-life perception, and physical activity suggests that pregnant women with better perceptions of health and quality of life participate more frequently in very active physical activity and walking than those who do not. These relationships should be further investigated to improve health outcomes for pregnant women.
Footnotes
Acknowledgements
We gratefully acknowledge All of Us participants for their contributions, without whom this research would not have been possible. We also thank the National Institutes of Health’s All of Us research program for making available the participant data examined in this study.
Ethical considerations and consent to participate
Ethics approval and written consent requirements to conduct this study were waived by The University of Kentucky Institutional Review Board. Individual-level data are publicly available through the All of Us Researcher Workbench, a cloud-based platform that facilitates equitable data usage and access while ensuring responsible conduct of research and protecting participant privacy through a passport data access model. Access in the Researcher Workbench is governed by a data passport model based on the researcher’s authenticated identity, institutional affiliation, and completion of all required trainings. Approved researchers are able to conduct a study, provided that they comply with all Data Use Policies and declare their research purpose at the start of the investigation. All information provided by the researchers is regularly audited and made accessible to the public in the All of Us Research Projects Directory.
Consent for publication
Consent for publication was not applicable to this study.
Author contributions
Funding
The authors received no financial support for the research, authorship, and/or publication of this article.
Declaration of conflicting interests
The authors declared no potential conflicts of interest with respect to the research, authorship, and/or publication of this article.