
Abstract
Background:
Preeclampsia, a complex and unpredictable pregnancy complication, poses significant challenges in predicting maternal outcomes, often leading to heightened anxiety among patients, families, and clinicians. This study introduces an innovative approach to enhance the prediction of complications in early-onset preeclampsia, leveraging advanced machine learning techniques inspired by bio-algorithms.
Objective:
Our goal is to enhance the clinical management of preeclampsia by improving risk stratification and offering a more personalized approach to patient care.
Design:
A single-center, observational, retrospective cohort study with 246 singleton pregnancies diagnosed with early-onset preeclampsia between January 2007 and December 2020 was conducted at 12 de Octubre Hospital. Exclusions included pregnancies with congenital anomalies, lack of angiogenesis biomarker determination or loss of follow-up, resulting in a cohort of 234 patients.
Methods:
We employed innovative genetic algorithm strategies, integrating two distinct supervised machine learning models. These aim to accurately forecast key maternal risks associated with preeclampsia and determine the optimal timing for delivery. This approach culminates in a unique ensemble framework, comprising a primary model for assessing the risk of adverse outcomes and two specialized sub-models focusing on Hemolysis, Elevated Liver enzymes, and Low Platelets-abruption and temporal factors.
Results:
Our findings are promising. The mono-objective genetic algorithm strategy yielded predictive f-scores of 68.3%, 83.1% ± 7.2%, and 71.5% ± 3.5% in the “Risk of Adverse Outcomes,” “Hemolysis, Elevated Liver enzymes, and Low Platelets-Abruption,” and “Time to Delivery” models, respectively. The multi-objective strategy, utilizing minimal yet powerful variable combinations, achieved predictive accuracies of 61.5%, 80.0% ± 6.2%, and 69.3% ± 7.2% with just five, four, and six features in the respective models. These results highlight the potential of our approach in enhancing clinical decision-making.
Conclusion:
This study introduces a novel approach to risk stratification in early-onset preeclampsia, integrating baseline and delivery data within a machine learning framework. Our results demonstrate that refined risk prediction with a minimal number of variables can complement existing clinical tools. Further validation in larger cohorts is needed to confirm its potential impact on decision-making and maternal outcomes.
Plain language summary
Preeclampsia is a pregnancy complication that can be challenging to predict and manage, causing significant concern for patients, their families, and clinicians. In this study, we present a novel approach to enhance the prediction of maternal complications in women with early-onset preeclampsia, utilizing advanced machine learning techniques inspired by biological algorithms. Our goal is to revolutionize the management of preeclampsia by offering more personalized and precise care. To achieve this, we conducted a retrospective study at Hospital 12 de Octubre, using data from 234 pregnant women diagnosed with early-onset preeclampsia. By using innovative genetic algorithm strategies, we developed models to predict key maternal complications and determine the optimal timing for delivery. While further research is needed to refine these models, our results show promise for improving clinical decision-making in the management of preeclampsia.
Introduction
Preeclampsia (PE) is a hypertensive pregnancy disorder that affects 3%–5% of all pregnant women. It is responsible for more than 70,000 deaths in pregnant mothers and 500,000 fetal deaths each year, 1 making it the third leading cause of maternal mortality in the world. According to the International Society for the Study of Hypertension in Pregnancy, it is defined as the de novo onset of hypertension from 20 weeks of gestation, together with the presence of proteinuria (>300 mg/day) or other features of organ dysfunction such as renal failure, liver damage, neurological damage, and fetal growth restriction (FGR).2,3
In clinical practice, two subtypes of PE have been defined, depending on whether the disease is diagnosed before or after 34 weeks of gestation, differentiated into early- and late-onset PE (loPE), respectively.4,5 In cases of early-onset PE (eoPE), the risk of maternal morbidity and mortality is significantly increased, with more severe complications. Fortunately, cases of eoPE have a lower incidence compared to loPE (0.3% versus 2.7%, respectively). 6 However, due to its higher prevalence, the absolute number of maternal complications derived from loPE is similar to that observed in eoPE. 7
PE is thought to arise with a failure of trophoblastic invasion during the first half of pregnancy, leading to hypoxic and dysfunctional placenta. 7 This triggers the release of anti-angiogenic factors like sFlt-1, which disrupt the balance with pro-angiogenic factors such as PlGF, resulting in vasoconstriction and increased blood pressure.7 –9 The ensuing endothelial dysfunction and inflammation contribute to systemic damage including proteinuria, hypertension, and other severe clinical manifestations of PE such as neurological damage, Hemolysis, Elevated Liver enzymes, and Low Platelets (HELLP) syndrome, pulmonary edema, and renal failure. In addition, placental damage may cause placental abruption or FGR.2,7,8
Despite the increased knowledge of the underlying mechanism of PE, it is still not fully understood; its diagnosis remains a challenge as it is based on non-specific clinical signs and symptoms, which are usually observed when the disease is already advanced.8,9 This often leads to delayed diagnosis and limits the ability to predict complications, ultimately increasing maternal and fetal morbidity and mortality. 9 Some adverse events such as placental abruption and HELLP syndrome are especially difficult to anticipate when the expectant management of eoPE is attempted. 10 Consequently, an improved method for the prediction of the associated adverse maternal/fetal outcomes is required.
Since delivery is the only effective treatment, clinicians often face the challenge of determining the optimal timing for intervention. As iatrogenic delivery implies a cost to the baby due to prematurity, expectant management is generally recommended in the absence of threatened or established complications, but this approach may not be fully safe for the mother. 9 Another dilemma of clinical interest is the decision on the timing of fetal maturation with corticosteroids. Given the heterogeneous nature of eoPE, it is not uncommon for them to be prescribed too early and for cycles to be repeated or, less frequently, not to be given in time. 11
In this context, artificial intelligence offers the opportunity to develop reliable predictive tools which could help to reach a more optimized care and management. 12 The present research aimed to study the potential of supervised machine learning (ML) techniques in the field of PE by developing an eoPE maternal complication’s prediction ensemble model (Figure 1) that could be used as a tool to stratify eoPE women according to their risk of developing adverse outcomes. In pregnant women with eoPE, the “Risk of Adverse Outcomes” (R) main model is applied; then, in those with high risk of complications, two prediction sub-models are applied. The first is a “Time to Delivery” (T) model for the prediction of the need to deliver within 7 days, and the second is the “HELLP-Abruption” (HA) model for the prediction of HELLP syndrome and abruptio placentae adverse maternal events that are difficult to anticipate. For these, sFlt-1/PlGF biomarkers together with other clinical, analytical, and ultrasound data have been integrated; we have focused on bio-inspired algorithms that reduce the dimensionality of the problem by selecting the main prognostic variables and improve the prediction of the models. 13

Scheme of the maternal complication’s prediction ensemble model used in woman diagnosed with early-onset preeclampsia. The “Risk of Adverse Outcome” model is applied to them as an initial screening method; in those predicted as developing maternal complications, two sub-models (“HELLP-Abruption” and “Time to Delivery”) would be applied as an increased surveillance method.
Materials and methods
Sample
The used data has been provided by the Hospital 12 de Octubre after conducting a single-center, observational, retrospective, and cohort study with 246 patients in singleton pregnancies diagnosed with eoPE in which expectant management was attempted between January 2007 and December 2020. Inclusion criteria were singleton pregnancies with a diagnosis of PE before 34 + 0 weeks and attempted expectant management. Therefore, patients who presented with preterm and complicated PE were not included in the cohort. Patients with chromosomal abnormalities, major malformations, or deliveries occurring outside the center—making data collection impossible—were excluded. Seven women were excluded for coexistence with congenital anomalies and only five due to the lack of determination of angiogenesis biomarkers at diagnosis (n = 4), or loss of follow-up (n = 1); thus, 234 patients were part of the cohort. Given the retrospective nature and the low prevalence of eoPE, we used the largest available sample at our center. As conventional power analysis is not fully applicable to ML, we assessed sample adequacy using learning curves.
The study received approval from the local Ethics Committee (n = 21/113). Given its retrospective, non-interventional design and the use of anonymized data, the need for informed consent was exempted.
Outcome definition
The outcome feature varies depending on which model from the three pointed out in Figure 1 is used, but in all cases it consisted of a dichotomous categorical variable.
There are six risks that are of particular clinical interest in the management of eoPE: pulmonary edema, HELLP syndrome, abruptio placentae, refractory hypertension, renal failure, and neurological events. Thus, for the R model, the outcome was defined as developing “maternal complication” (no matter which of the six is) or not.
For the HA sub-model, the outcome was defined as developing “placental abruption” and/or “HELLP syndrome” or not. For the HELLP syndrome, both complete and incomplete cases were included. Complete HELLP was defined by the presence of hemolysis (bilirubin ⩾1.2 mg/dL, LDH ⩾600 IU, or peripheral blood smear diagnosis), elevated transaminases (serum GOT ⩾70 IU/L), and platelet count <100,000/mm3. Incomplete HELLP was diagnosed if two of the three previous criteria were present. For abruptio placentae, it was considered if partial or complete placental separation from its normal uterine implantation site before the second stage of labor was completed with fetal expulsion. It was objectified by demonstration of an organized retroplacental hematoma occupying at least 20% of the area of insertion.
For the T sub-model, the outcome was defined as “delivery induced within the first 7 days from the date of PE diagnosis” or “delivery induced from the seventh day onwards.”
Data pre-processing
A total of 48 non-outcome features, out of which 24 were numerical and 24 categorical, were included in the dataset. They can be grouped according to the time at which they were measured into pre-gestational variables (Table 1-SM) and PE episode variables (Table 2-SM). The former were collected from the medical records, while the latter were obtained from the different ultrasound scans and analytical tests performed at diagnosis.
The modification of raw data in order to make it appropriate for use in a ML model is known as data pre-processing; as shown in Figure 2, it has been the second step in our ML pipeline, after data collection and it is an essential procedure to guarantee the data quality. 14

Machine learning pipeline followed throughout the research. After data collection, different pre-processing steps were performed. Then, the data was split into train (80%) and test (20%) sets. The GA, which performs a process of feature selection and classification tasks, was used with the train set. Finally, the best-performing solutions over a five-repetitions of five-stratified folds cross-validation were used to predict the outcomes for the test data.
We have worked with a well-structured dataset that contained a low percentage of missing values (Tables 1 and 2-SM). They were imputed using the MissForest technique that performs an iterative imputation by training a Random Forest model followed by a prediction of the missing values in an iterative process. It is a method that does not require parametric adjustment, is suitable for both categorical and numerical data, and is able to reduce imputation error by up to 50% compared to other imputation tools. 15 To apply it, the Iterative Imputer tool of scikit-learn was used with the Random Forest classifier. 16 After the missing value imputation, it was verified that the statistics did not vary and that the values remained consistent within the normal ranges.
The follow-up variables, which include ultrasound and laboratory tests, were directly discarded due to their high percentage of missing values: this information was not available in all patients and was not uniformly collected since the time of evolution after diagnosis is very changeable. The complete list of the discarded features can be shown in Table 3-SM.
Dichotomous categorical variables were represented by the numbers 0 and 1, corresponding to answers “no” and “yes,” respectively. Additionally, polytomous categorical variables were categorized and represented by a one hot vector and numerical and ordinal nominal variables were normalized using the Standard Scaler tool of the scikit-learn library, which transforms the data into a distribution with a mean of 0 and a standard deviation of 1, according to the formula show in the equation (1)

From the clinical point of view, it was of great interest to study the potential of pre-gestational variables separately, as these are easier to obtain and manage; thus, for each of the three models (R, HA, and T) we have worked with two different sets: on the one hand, pre-gestational (“baseline”) variables, defined as Baseline set, in which the 24 features described in Table 1-SM were included; and on the other hand, a set including the previous ones plus the PE episode (“diagnostic”) variables, called Baseline + Diagnostic set which includes the 48 features described in Tables 1 and 2-SM. This has allowed us to cover different resource availability scenarios.
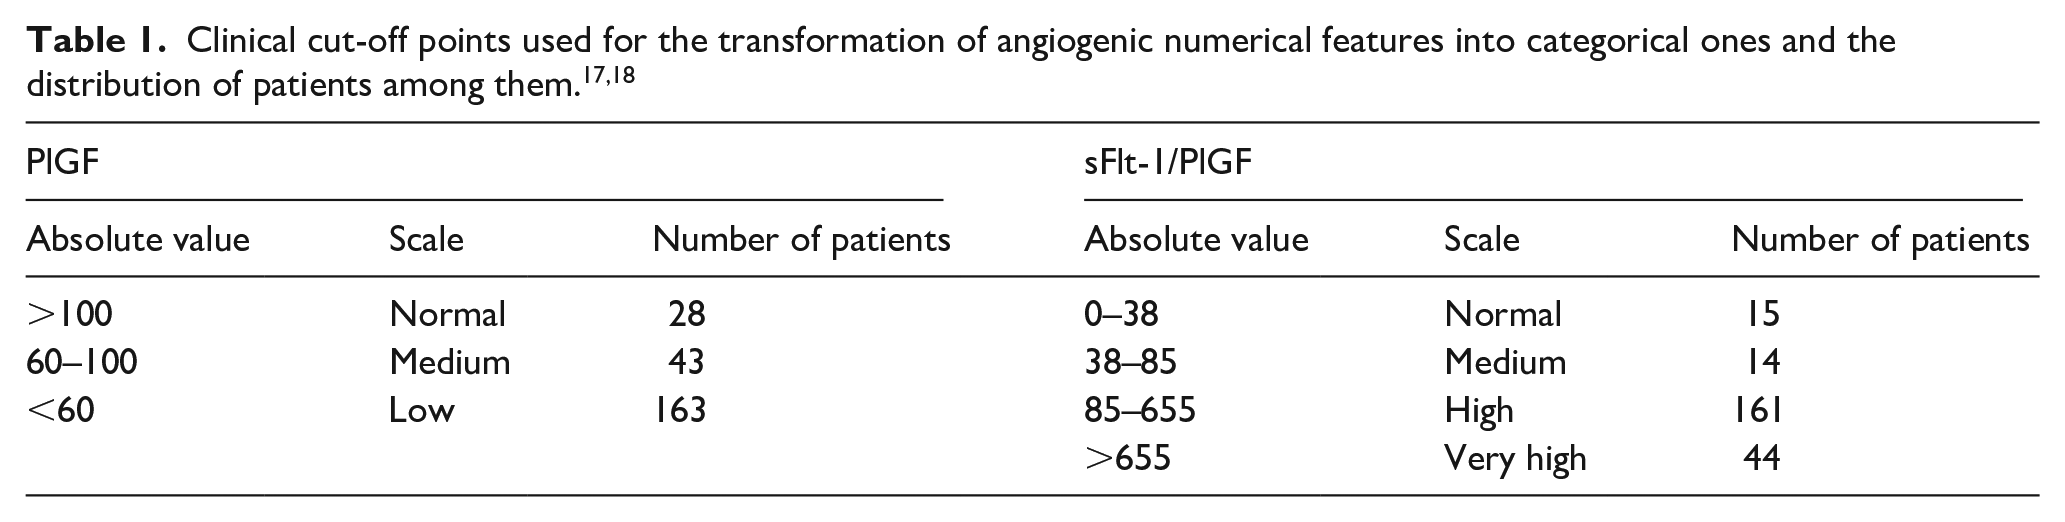
Angiogenic markers do not follow a normal distribution and are commonly measured using the sFlt-1/PlGF ratio or PlGF alone, as isolated sFlt-1 is rarely used. Due to the high variability in their absolute values, which could adversely impact the performance of ML models, we created the “ratioScale” and “PlGFscale” features based on the clinical cut-off points detailed in Table 1.
For a better data interpretation and with the aim of structuring and understanding the information contained in the data, a descriptive analysis was performed using the Statistical Packages for the Social Sciences version 20.0 (IBM SPSS Inc., Chicago, IL, USA). Continuous variables were expressed in mean (SD), and categorical variables were expressed in percentage (%). Univariate comparisons between the cases in which women developed a maternal complication and those that did not were performed using the t-test or Mann–Whitney U-test for continuous variables and the chi-square or Fisher’s exact test for categorical variables (Tables 4 and 5-SM). Two-sided p < 0.05 was considered statistically significant.
The same analysis was performed stratifying the population between the cases in which women developed HELLP syndrome and/or abruption placentae maternal complications and those that did not (Tables 6 and 7-SM). Finally, a stratification of the population based on the need for delivery within 7 days was performed (Tables 8 and 9-SM).
Ensemble model
The number of patients developing each of the six maternal complications mentioned in the “Outcome definition” sub-section was not high enough to create an “individual risk model”; thus, we have developed a model in which the goal is to predict the absence/presence of risk, no matter which of the six is (R model).
Out of the 234 patients included in the cohort, 102 developed any of the six complications. It is important to remark that they were not already present at the time of PE diagnosis in any patient and their development implied cessation of expectant management and immediate delivery.
As shown in Figure 2, the R model would be useful as an initial screening method to better select the appropriate candidates for expectant management; those patients predicted as “developing complication” will pass to a phase of greater surveillance, and two sub-models will be applied to them:
HA model: it predicts the absence/presence of HELLP syndrome, abruptio placentae, or both. For the first time in literature, we have joined two of the most acute risks. They are currently considered almost unpredictable in the clinical practice, so it was interesting to join them.19,20
T model: it predicts the time at which the risk appears (which coincides with the delivery time) within 7 days of PE diagnosis. This allows a greater margin for decision-making, including transfer to a tertiary center or the administration of corticosteroids. 21
Therefore, just the data of the 102 patients who developed any of the complications were considered for the creation of these two sub-models. Out of these 102 patients, 57 developed HELLP syndrome and/or abruptio placentae complications and in 67 patients delivery was induced within the first 7 days after the PE diagnosis due to complication onset. In order to obtain those days, the difference between the delivery date and the PE diagnosis date was computed for each patient. A threshold of 7 days was selected not only because this is considered as the window of the effect of antenatal corticosteroids for fetal maturation, 22 but also taking into account a fair distribution of patients among the two classes (Figure 3).

Histogram that illustrates the number of days between preeclampsia diagnosis and delivery for each patient. For 67 patients, delivery was induced within the first 7 days after diagnosis (blue), while for 35 patients, it was induced after the seventh day (red).
As shown in Table 2, there is no significant class imbalance in the R and HA models; however, class imbalance was accounted for in the analysis of the T model. All three models used the same predictive features outlined in Tables 1 and 2-SM. Since these features were stratified into Baseline and Baseline + Diagnostic sets, we worked with six distinct datasets for the genetic algorithm (GA): R-Baseline, R-Baseline + Diagnostic, HA-Baseline, HA-Baseline + Diagnostic, T-Baseline, and T-Baseline + Diagnostic.
Description of the main model (Risk of Adverse Outcomes) and the two sub-models (HELLP-Abruption and Time to Delivery).

HELLP: hemolysis, elevated liver enzymes, and low platelets; PE: preeclampsia.
Genetic algorithm
In our study, we faced the challenge of dealing with complex, high-dimensional data, some of which was potentially redundant or irrelevant, hindering our ML models. To address this, we implemented feature selection techniques to identify and utilize only the most relevant data, improving the models’ efficiency.
However, pinpointing the ideal combination of data features is not straightforward. To tackle this, we utilized a GA, an innovative method inspired by the natural evolutionary process. It works by simulating the way nature evolves and adapts over time.
The GA operates as follows:
Initial population creation: We start by randomly generating a group of “chromosomes,” each representing a different combination of data features. These chromosomes are like sets of variables or “genes,” and we represent them using binary strings (as illustrated in Figure 4).
Evolution process: The chromosomes undergo a process of evolution. We evaluate each chromosome using a “fitness function,” which helps us determine how well it performs in solving our problem. We then rank these chromosomes based on their fitness scores.
Selection and generation: The top-performing chromosomes, as determined by the fitness function, are selected to pass their characteristics to the next generation. This selection is influenced by a parameter known as “elitism.” Some of these selected chromosomes are kept as they are, while others undergo “overcrossing” and “mutation.” Overcrossing is like mixing two chromosomes to create new ones, and mutation involves making small changes to a chromosome’s genes. 23
Classifier integration: The GA is linked to a classifier, which acts as an estimator in our fitness function. We used several types of classifiers due to their effectiveness in classification tasks: • Support vector machine: it creates a hyperplane in a multi-dimensional space to separate different classes. The hyperplane is positioned to maximize its distance from the nearest data points, known as support vectors. We adjusted parameters like “C,” “kernel,” “gamma,” and “class weight.” • K-nearest neighbors (KNN): it is a method that calculates the likelihood of a data point belonging to a certain class based on its proximity to other points. It looks at the KNN and classifies the data point based on the majority class among these neighbors. We fine-tuned parameters like “algorithm,” “metric,” “n jobs,” “n neighbors,” and “weights.” • Logistic regression (LR): it is a linear method where predictions are transformed using a logistic function. It’s typically used for binary classification problems, aiming to find a relationship between features and the likelihood of outcomes. We adjusted parameters such as “C,” “max iter,” “solver,” and “class weight.” • Decision trees (DT): it is a method that uses decision rules derived from data to classify points. It starts with a root node and splits into branches based on different attributes, forming a tree structure. We optimized the tree by adjusting parameters like “criterion,” “min samples leaf,” “min samples split,” “splitter,” “max depth,” and “class weight.”

Overview of the main steps in the GA process: (1) Initial population creation. (2) Fitness function evaluation to assess each individual’s ability to compete with others. (3) Selection of the fittest individuals, allowing them to pass their genes to the next generation. (4) Offspring creation through the exchange of genes between parents until the crossover point is reached. (5) Mutation occurs in certain new offspring to maintain diversity within the population and prevent premature convergence. This process repeats iteratively until a generation with the fittest individuals is achieved.
Table 3 describes the most important GA parameters that have been adjusted during the process.
Description of the key parameters adjusted during the GA process.

GA: genetic algorithm.
Our approach using GAs and various classifiers allows us to efficiently sift through complex data, selecting only the most relevant features for our ML models. This process enhances our ability to make accurate predictions and draw meaningful conclusions from our study.
In our research, we utilized the GA from the PyWinEa Python library. 24 Our focus was on two distinct strategies, which we will discuss in the results section.
The first strategy involved exploring various combinations of variables to maximize the F1 score of our classifiers. The F1 score is a crucial metric that balances the rates of true positives, false positives, true negatives, and false negatives in model performance. In mono-objective GA (OGA), we compare different solutions based on their F1 scores, with higher scores indicating better solutions. 25
The second strategy recognizes that relying on a single metric like the F1 score isn’t always sufficient, as real-world problems often have multiple, sometimes conflicting, objectives. Here, we used the non-dominated sorting GA-II from the PyWinEA package. This approach helps us find a range of optimal solutions (known as the Pareto front) where no single solution is considered superior to others in all aspects. 25 For multi-OGA, we considered both the F1 score and a feature score (which is based on equation (2) and focuses on reducing the number of variables for simplicity and efficiency) as our fitness functions

From a clinical perspective, these strategies are invaluable. They allow us to create models that are not only efficient (high F1 score) but also practical in terms of interpretability and data collection time (low number of features). This balance is crucial to avoiding overburdening clinical workflows.
We applied these GA strategies to various datasets (R-Baseline, R-Baseline + Diagnostic, HA-Baseline, HA-Baseline + Diagnostic, T-Baseline, and T-Baseline + Diagnostic), using specific parameters detailed in Table 4. To optimize the models, we used cross-validation (cv). Specifically, we employed repeated stratified K-fold cv with five repetitions and five folds to ensure a balanced representation of classes and a more accurate estimate of the model’s performance. 26
Fixed parameter values for the GA process.

cv: cross-validation; GA: genetic algorithm.
For the R model, we split the data into 80% for training and 20% for testing, applying the GA only to the training data to select features and determine the classification model. We then tested this model on the unseen 20% test data to evaluate its real-world performance. In contrast, due to limited sample sizes, we applied the GA to the entire dataset for the HA and T sub-models without splitting it. Table 5 shows the total number of patients used in each of the three models and their distribution in the training and test sets. This split was done randomly but consistently for both the Baseline and Baseline + Diagnostic sets to ensure comparable results.
Number of patients used in the train/test sets and their distribution among the two classes (0/1), for Risk of Adverse Outcomes, HELLP-Abruption, and Time to Delivery models.

HELLP: hemolysis, elevated liver enzymes, and low platelets.
Results
In this section, we reviewed the top-performing results from each of the three proposed models using both mono-OGA and multi-OGA approaches, applied to the Baseline and Baseline + Diagnostic datasets. To prevent overfitting, we used five repetitions of stratified five-fold cv. Consequently, the cv values (“train” and “validation”) for each evaluated metric, shown in the following tables, represent the mean results from each of the 25 folds. Additionally, for the multi-OGA solutions, we ensured that the models achieved high classification performance while using an optimal number of features and considering clinical relevance.
For evaluating the results obtained from the HA and T sub-models, it is important to note that the total sample size decreased to 102, as only the 102 patients who developed a maternal complication out of the 234 patients could be considered. This reduction in sample size means that an 80%–20% train–test split would not provide enough samples for a fair analysis. Therefore, we performed the cv procedure on 100% of the patients to analyze the potential of the models if we had more samples in the future, focusing on evaluating their generalization capacity.
Performance metrics for the best results of the R model across the training, validation, and test phases are presented in Table 6, while those for the HA and T sub-models across the training and validation phases are shown in Table 7. The complete results for all models are available in Tables 10–14-SM.
Results of the Risk of Adverse Outcomes model using both the Baseline and Baseline + Diagnostic sets, evaluated with mono-OGA and multi-OGA strategies. For each genetic algorithm approach, the corresponding set of selected features is listed. Cross-validation results from the training phase are reported as mean (standard deviation). Features highlighted in blue (within the Baseline + Diagnostic set) represent pre-gestational characteristics.

Mono-OGA: mono-objective genetic algorithm; multi-OGA: multi-objective genetic algorithm; PE: preeclampsia.
Results of the HELLP-Abruption and Time to Delivery models using both the Baseline and Baseline + Diagnostic sets, evaluated with mono-OGA and multi-OGA strategies. For each genetic algorithm approach, the corresponding set of selected features is listed. Cross-validation results from the training phase are reported as mean (standard deviation). Features highlighted in blue (within the Baseline + Diagnostic set) represent pre-gestational characteristics.

Mono-OGA: mono-objective genetic algorithm; multi-OGA: multi-objective genetic algorithm; PE: preeclampsia.
Risk of Adverse Outcomes model
For the Baseline set, the LR classifier was identified as the best-performing algorithm during cv achieving an F1 score of 0.622 ± 0.061. In the multi-OGA solution, the number of features was reduced from 10 to 4, resulting in a slight decrease in the F1 score to 0.615 ± 0.055. When applied to the test set, this model achieved the highest F1 score of 0.571. Notably, it attained a recall value of 0.700 using only four features: mode of conception, having no previous children or the last one born more than 10 years ago, number of previous abortions, and aspirin intake.
For the Baseline + Diagnostic set, the KNN classifier performed well during cv, with an F1 score of 0.713 ± 0.077. In the best multi-OGA solution, the number of features was reduced from 25 to 5, resulting in an F1 score of 0.655 ± 0.082 (Table 6). When applied to the test set, the model using all 25 features achieved the highest F1 score of 0.683, along with strong recall and specificity values of 0.700 and 0.741, respectively. The reduced-feature multi-OGA model reached an F1 score of 0.615 on the test set. Two additional solutions derived from the multi-OGA approach (Solutions 1 and 3 in Table 11-SM) achieved F1 scores of 0.672 ± 0.083 (training) and 0.600 (test), and 0.614 ± 0.086 (training) and 0.545 (test), respectively.
HELLP-Abruption and Time to Delivery sub-models
In the HA model, the KNN classifier was the best-performing algorithm for the Baseline set, achieving an F1 score of 0.791 ± 0.049. After applying the multi-OGA, the solution maintained the F1 score while reducing the features from 8 to 5 (Table 7). The high recall values indicate that the algorithm effectively classified a high percentage of women who developed HELLP syndrome and/or abruptio placentae using exclusively pre-gestational features. The multi-OGA approach yielded two additional solutions (Solutions 2 and 3 in Table 12-SM). Solution 2 showed a slight decrease in F1 score to 0.786 ± 0.065 using four features, while Solution 3 further reduced the number of features to three, resulting in an F1 score of 0.777 ± 0.036.
For the Baseline + Diagnostic set, the LR classifier was identified as the best-performing algorithm, achieving an F1 score of 0.831 ± 0.072. The top-performing multi-OGA solution reached an F1 score of 0.806 ± 0.066 using six features (Table 7). Additionally, five other solutions were obtained using this strategy (Solutions 1, 3, 4, 5, and 6 in Table 13-SM): the first one achieved an F1 score of 0.806 ± 0.066 with six features; the third solution reduced the features from 14 to 5, with the F1 score decreasing to 0.805 ± 0.063; the fourth solution used 4 features and achieved an F1 score of 0.800 ± 0.062; the fifth solution reduced the features from 14 to 3, with an F1 score of 0.798 ± 0.062; the final solution used only “PLGF5” and “PlGFscale” features, achieving an F1 score of 0.785 ± 0.060. High recall values were maintained, and accuracy and precision metrics improved slightly compared to the HA-Baseline set.
In the T model, the DT classifier was the top-performing algorithm for the Baseline set. However, even with this algorithm, the results were not optimal, and the F-scores in any case exceeded 0.55. For the Baseline + Diagnostic set, the LR classifier was the best-performing algorithm with an F1 score of 0.715 ± 0.035. Two solutions were obtained after applying the multi-OGA. The best solution reduced the features from 13 to 6, resulting in an F1 score of 0.696 ± 0.072 (Table 7). In the remaining solution, the feature set was reduced from 13 to 7, with a corresponding F1 score of 0.693 ± 0.083 (Solution 2 in Table 14-SM). In the T model, diagnostic variables are essential to achieve F-scores above 0.69. However, the recall values in each solution are not particularly high, which limits the overall F-scores. The models were clearly impacted by class imbalance, as they were trained with 67 positive instances and 35 negative ones, making them better at predicting the former.
Discussion
Managing eoPE presents a significant clinical challenge, as it requires balancing maternal and fetal risks to determine the optimal timing for delivery. Expectant management and close monitoring until 34 weeks are standard as long as eoPE remains uncomplicated. This approach has not changed since the 1990s 27 while perinatal outcomes have improved considerably, 28 and this should be reflected in the balance of risks and benefits of continuing pregnancy in women with eoPE. In addition, techniques for developing predictive models of complications have developed considerably with the advent of ML. Therefore, there is a need for improved risk stratification tools that integrate multiple clinical parameters to enhance decision-making.
Several predictive models have been developed to assist in PE management, the most recognized being the Preeclampsia Integrated Estimate of Risk model. 29 Although widely validated, it predicts only short-term complications (within 48 h) and relies on markers that reflect existing organ damage, limiting its anticipatory value.29,30 Other models, such as those by Jhee et al. 31 and Marić et al., 32 have focused on specific pregnancy windows (e.g. first trimester or after 24 weeks) and have excluded patients with early severe forms of the disease, thereby limiting their applicability in real-world eoPE scenarios. In contrast, our study demonstrates that ML models based on GAs can refine risk assessment by leveraging a comprehensive set of variables, including baseline characteristics, angiogenic biomarkers, and Doppler parameters. Unlike previous approaches, our model draws on a dataset that covers multiple stages of pregnancy, incorporating trimester-specific information along with key biomarkers such as sFlt-1 and PlGF. These markers are not only closely associated with the severity of the disease but also offer valuable insight into the timeframe within which pregnancy can be safely prolonged.
A model based on information available at the time of admission would be more clinically useful; however, our results clearly demonstrate that predictors improve significantly when features related to the eoPE episode are included as input data (Baseline + Diagnostic set). This makes sense, as baseline variables provide information on general predispositions and risk factors, but they don’t directly represent the current condition of the disease.
Traditional predictors like hypertension degree and proteinuria are unreliable for disease progression. 33 Recent clinical practice incorporating angiogenic profiles has shown promise, especially with elevated sFlt-1/PlGF ratios. 9 However, combining these with additional markers and ML models could enhance predictive performance. Our ML-based approach systematically integrates known risk factors, uterine artery Doppler indices, and angiogenic markers to improve their prognostic value. By analyzing these variables together, rather than in isolation, our models can identify complex interactions that may not be apparent with conventional risk assessment methods. Notably, our models achieve high predictive accuracy while using a minimal number of variables, making them particularly practical for real-world clinical settings. For instance, the primary R model (mono-OGA solution from Table 9-SM) demonstrated a sensitivity/specificity of 0.700/0.741 and a mean ROC AUC of 0.76 ± 0.08 with 25 input features. Meanwhile, the multi-OGA strategy reduced the model to just five variables while maintaining a specificity of 0.741, albeit with a sensitivity decrease to 0.600. Of note, two of these five parameters are from the fetomaternal Doppler study (middle cerebral artery and uterine artery), which seems to reinforce the importance of this evaluation for diagnosing eoPE. The other three parameters refer to the maternal predisposition to present early symptoms of the disease (previous PE, gestational age at eoPE onset and number of antihypertensive drugs required) and all of them being clinically coherent.
For the prediction of severe maternal complications, the HA sub-model (mono-OGA solution from Table 11-SM) used 14 features, 8 of which are pre-gestational, and reached a mean ROC AUC of 0.80 ± 0.10, with sensitivity/specificity values of 0.883 ± 0.096 and 0.693 ± 0.161 in the validation set, respectively. The multi-OGA provides a minimal-variable solution, ensuring that the model remains accessible and implementable in different clinical contexts. This model is mainly supported by the use of three features related to angiogenic markers along with pre-gestational renal disease (Solution 4 in Table 11-SM). The model yielded a sensitivity of 0.913 ± 0.074 (although the trade-off is a decrease in specificity to 0.529 ± 0.184).
The timing of delivery in eoPE remains one of the most complex clinical decisions, particularly in cases where maternal and fetal indications conflict. T-BD sub-model for the prediction of delivery in the next week (mono-OGA solution from Table 12-SM) achieved a mean ROC AUC of 0.82 ± 0.04 and sensitivity/specificity values of 0.688 ± 0.091 and 0.881 ± 0.058 in the validation set, respectively, using 13 features (five of which are pre-gestational). The multi-OGA solution identifies six key factors that influence imminent delivery, such as uterine artery Doppler indices, fetal growth, angiogenic markers, and maternal clinical conditions. The model yielded sensitivity and specificity values of 0.649 ± 0.095 and 0.890 ± 0.044, respectively (Solution 2 in Table 12-SM). A previous study by Perry et al. 34 also demonstrates the importance of using angiogenic markers for predicting delivery <1 week before week 35 (AUC 0.82) and how the addition of clinical variables further improves the prediction (AUC 0.88). These results are slightly better than those found by our model, but the population in Perry’s study is composed of a more heterogeneous spectrum of pregnant women that start from a lower risk than ours as it also includes cases of chronic and gestational hypertension. This may favor discrimination with respect to our study which explains its better results in terms of diagnostic accuracy. Another interesting observation from our study and that of Perry et al. 34 is the prominence of maternal factors. Thus, in the multi-OGA solutions, particularly in the HA sub-model, chronic hypertension, diabetes mellitus, previous PE, and BMI were among the most influential features, despite eoPE being traditionally considered a primarily placental-driven disorder. This challenges the conventional early (placental-related condition) versus late PE (maternal-related condition) paradigm and underscores the complex interplay between maternal susceptibility and placental dysfunction. The presence of these maternal factors suggests that underlying metabolic and cardiovascular conditions contribute significantly to the pathophysiology of eoPE, even in cases where placental insufficiency is dominant.
From a clinical standpoint, the adoption of ML-based models must balance predictive accuracy with usability. While our mono-OGA solutions demonstrated strong performance, managing a lot of variables in clinical practice may be challenging. We propose minimal-variable solutions could be prioritized for first-aid applications (i.e. emergency), while more complex models could be reserved for specialized management with enough time availability (i.e. tertiary care centers).
Overall, our findings support the integration of ML models into the clinical workflow for eoPE management. Our approach can be used as an additional information to anticipate severe and acute PE complications. This knowledge may lead to reconsidering expectant management when a high risk of complications is detected, especially if the gestational age is not very preterm and the patient is in a tertiary care center.
Limitations
This study does have limitations, including a small sample size, particularly for the HA and T sub-models. In assessing sample adequacy, the R and HA models demonstrated stable performance with low variance (Figures 4 and 5-SM). However, the T model, when using the mono-OGA strategy, exhibited signs of overfitting (Figure 6-SM), which was addressed by reducing model complexity through feature selection with the multi-OGA approach (Figures 7 and 8-SM). Additionally, the T sub-model was impacted by an imbalance between positive and negative cases, contributing to lower recall values and, consequently, reduced F1 scores. Finally, the single-center nature of the study may limit the reproducibility of results. However, there are notable strengths, such as the use of bio-inspired algorithms that ensure models are focused on relevant features, and the implementation of multi-objective GAs, which streamline data collection by reducing the number of required input variables and providing various feature scenarios that facilitate clinical application. The single-center approach also offers the advantage of uniform study management. Further multi-center studies are needed to validate our results, including randomized trials comparing conventional approaches with those using this model to make clinical decisions on delivery timing. As more data is gathered to train the models, their generalization performance will likely improve, making them more accurate representations of reality.
Conclusion
We have conducted a retrospective cohort study and applied ML methodologies to predict outcomes for patients who have experienced eoPE. To enhance the selection of candidates for expectant management, we developed a risk prediction model and two sub-models designed to increase surveillance for women predicted to develop complications.
Our findings indicate that, while we are not proposing a standalone diagnostic test, the results show promise as supplementary information. This can provide clinicians with additional insights to reassess risks more comprehensively than traditional methods allow. The study also raises questions about the validity and safety of the current approach to expectant management of eoPE for all mothers and fetuses, suggesting a potential need for individualized risk assessment. 21
Balancing the risks and benefits is crucial, considering both fetal prematurity and potential maternal complications. Recognizing which subgroups of pregnant women are at higher risk of complications after a PE diagnosis could allow healthcare professionals to make more accurate prognoses, decide on timely deliveries, and adjust therapeutic approaches to minimize adverse effects.
Supplemental Material
sj-docx-1-whe-10.1177_17455057251348978 – Supplemental material for Predictive modeling of complications arising from early-onset preeclampsia in pregnant women
Supplemental material, sj-docx-1-whe-10.1177_17455057251348978 for Predictive modeling of complications arising from early-onset preeclampsia in pregnant women by Paula Domínguez del Olmo, Ignacio Herraiz, Cecilia Villalaín, Alberto Galindo and Jose Luis Ayala in Women’s Health
Footnotes
Acknowledgements
The authors acknowledge all the patients and their caregivers who have made this study possible.
Ethical considerations
The study was approved by the local Research Ethic Committee (no. 21/113).
Consent to participate
Given its retrospective, non-interventional design and the use of anonymized data, the need for informed consent was exempted.
Author contributions
Funding
The author(s) disclosed receipt of the following financial support for the research, authorship, and/or publication of this article: This work was funded by project PI19/01579, from the Instituto de Salud Carlos III (Spanish Ministry of Economy, Industry and Competitiveness) through the projects RD21/0012/0024-RD24/0013/0013 and co-funded by the European Regional Development Fund, which finance the actions of the Recovery and Resilience Mechanism (MRR).
Declaration of conflicting interests
The author(s) declared no potential conflicts of interest with respect to the research, authorship, and/or publication of this article.
Data availability statement
This link (![]() ) contains all the information regarding the data, which are available upon request for research purposes. The data can be shared if requested. All data have been obtained in the context of a clinical study and comply with ethical committee guidelines. The data are available to researchers through a 1:1 agreement.
) contains all the information regarding the data, which are available upon request for research purposes. The data can be shared if requested. All data have been obtained in the context of a clinical study and comply with ethical committee guidelines. The data are available to researchers through a 1:1 agreement.
Supplemental material
Supplemental material for this article is available online.
References
Supplementary Material
Please find the following supplemental material available below.
For Open Access articles published under a Creative Commons License, all supplemental material carries the same license as the article it is associated with.
For non-Open Access articles published, all supplemental material carries a non-exclusive license, and permission requests for re-use of supplemental material or any part of supplemental material shall be sent directly to the copyright owner as specified in the copyright notice associated with the article.