
Abstract
Background:
Estrogen deficiency during menopause, aging, reproductive history, and factors increasing intra-abdominal pressure may lead to structural and functional failure in the pelvic floor. Lifestyle choices, such as eating behavior, may contribute to pelvic floor disorders.
Objectives:
The objective of the study was to investigate associations of eating behavior with symptoms of pelvic floor disorders, that is, stress urinary incontinence, urgency urinary incontinence, fecal incontinence, and constipation or defecation difficulties among middle-aged women.
Design:
A cross-sectional, observational study was performed using a population sample of 1098 Finnish women aged 47–55 years.
Methods:
Eating behavior, food consumption frequency, demographical, gynecological, and physical activity variables were assessed using self-report questionnaires. Logistic regression models were used to assess the associations of eating behavior, food frequency, and symptoms of pelvic floor disorders. Models were adjusted with demographical, gynecological, and physical activity variables.
Results:
In adjusted models, middle-aged women with disordered eating style were more likely to experience the symptoms of stress urinary incontinence (odds ratio (OR) 1.5, p = 0.002), and constipation or defecation difficulties (OR 1.4, p = 0.041). Adding body mass index into the models abolished associations. Of the studied food items, more frequent consumption of ready-made, highly processed foods (OR 1.5, p = 0.001), and fast foods (OR 1.5, p = 0.005) were independently associated with symptoms of stress urinary incontinence regardless of eating style, whereas consuming ready-made foods (OR 1.4, p = 0.048) was associated with symptoms of urgency urinary incontinence. Daily consumption of fruits (OR 0.8, p = 0.034) was independently associated with symptoms of stress urinary incontinence. Furthermore, we observed that daily consumption of porridge was associated with symptoms of constipation or defecation difficulties (OR 1.7, p = 0.010) independently of eating style. Alcohol consumption (OR 0.9, p = 0.015) was inversely associated with constipation and defecation difficulties. Women with overall higher quality diet had lower odds for stress urinary incontinence (OR 0.9, p = 0.002).
Conclusion:
This study provides proof-of-concept evidence to the hypothesis that eating behavior and consuming certain food items are associated with perceived pelvic floor disorders. As a preventive action, eating behavior of women with the risk of these symptoms should be assessed, and guidance toward healthy eating patterns should be provided.
Introduction
Pelvic floor disorders in women include conditions that compromise urinary and fecal continence and storage mechanisms.1 –3 Urinary incontinence alone affects 25%‒45% of women worldwide.4 –7 Estimated prevalence of fecal incontinence in community dwelling women is approximately 7%–12%,2,8,9 whereas prevalence of constipation is reported to be 14%‒16% in the adult population, being more common in women.10,11 Embarrassment and lack of knowledge may lead to underreporting the symptoms of pelvic floor disorders. Overall, the disorders negatively affect the quality of life of women of all ages 12 and cause notable burden to healthcare system. 13
Estrogen deprivation during menopause, natural aging, reproductive history, and factors increasing intra-abdominal pressure may lead to structural and functional failure in the pelvic floor.1,14 In addition, lifestyle choices such as quality of nutrition and eating behavior may have a significant effect on the mechanisms of pelvic floor disorders. 14 Some macro- and micronutrients, such as protein, 15 vitamin D, 16 and omega-3 fatty acids, 17 are important for proper skeletal muscle function. Disordered eating may result in a lack of these important nutrients; therefore, it may weaken skeletal muscles, including the pelvic floor muscles. 18 It has been hypothesized that low-energy availability is associated with the development of pelvic floor disorders, 19 while obesity is also a well-established risk factor.20 –23 When studying middle-aged women, it is also worth noting that menopausal status might be a specific factor associated with eating behavior. 24 Estrogens have an important effect on normal food intake, and therefore, they may have a functional role in disordered eating.25 –27
It is recognized in clinical practice that some dietary items may predispose or exacerbate or, in contrary, relieve the symptoms of pelvic floor disorders. Most previous studies have focused on the effect of a single diet factor, but little is known about the effects of eating behavior in a broader sense. Therefore, further studies related to the association of symptoms of pelvic floor disorders with different aspects of eating behavior are warranted. The objective of the current study is to investigate associations of eating styles with perceived symptoms of pelvic floor disorders, including stress urinary incontinence, urgency urinary incontinence, fecal incontinence, and constipation or defecation difficulties among middle-aged women. In addition to eating styles, the possible associations of the consumption of potential predisposing and protecting dietary items with pelvic floor symptoms are studied. We hypothesized that some eating styles and dietary choices, such a high caffeine intake and low fiber intake, may be associated with a higher risk for the symptoms of pelvic floor disorders, especially urinary incontinence, and constipation or defecation difficulties. In addition, eating styles that are likely to predispose to overweight may concomitantly predispose to the symptoms of pelvic floor disorders. A normal eating style with healthy dietary choices has a beneficial effect on overall health; thereby, it may be protective against the symptoms of pelvic floor disorders.
Methods
Study design and participants
The data reported in this secondary analysis are from the cross-sectional, observational study, Estrogenic Regulation of Muscle Apoptosis. 28 The study data collection was implemented between January 2015 and November 2016 and has been described in detail in Kovanen et al. 29 Briefly, out of the 6878 randomly selected women aged 47–55 years living in Central Finland, 3064 women returned written consent and prequestionnaire that included questions on symptoms of pelvic floor disorders. Exclusion criteria included conditions or use of medications affecting ovarian function, self-reported body mass index (BMI) >35 kg/m2, and medications or symptomatic diseases affecting muscle functions. From the eligible participants, 1393 gave fasting blood samples and 1102 of them answered the main questionnaire survey that included eating behavior questions. Four questionnaires were lost due to technical errors. Therefore, the final analytical sample size of the present study is 1098. This study is reported in accordance with the STROBE (Strengthening the Reporting of Observational Studies in Epidemiology) guidelines. 30
Pelvic floor disorders
Participating women were asked to provide a dichotomized response (yes/no) to a questionnaire assessing if they had experienced symptoms of pelvic floor disorders within a month preceding data collection (Supplemental Appendix 1). The questionnaire used is not validated as we chose to use a simplistic questionnaire that is commonly used in clinics in Finland. The symptoms of pelvic floor disorders included in the questionnaire were stress urinary incontinence, urgency urinary incontinence, fecal incontinence, and constipation or defecation difficulties, 31 and they were studied with the following questions: Have you had within the last month urinary incontinence during physical effort or coughing? Have you had within the last month urge or urgency-related urinary incontinence? Have you had within the last month fecal incontinence? Have you had within the last month constipation or defecation difficulties?
Eating behavior
Restrictive eating and overeating were assessed with the question 32 “Which of the following best describes you?” and participants were asked to select one of the following four options: “It’s easy for me to eat about the amount I need to”; “I quite often eat more than I actually need”; “I often try to restrict my eating,” and “At times, I’m on a strict diet, at others I overeat.” Following the original publication, 32 we named these eating styles as normal eating, overeating, restrictive eating, and alternating overeating and restricting, respectively. The crosstabulation between eating styles and symptoms of pelvic floor disorders is presented in the Supplemental Appendix 2. Due to the small sample sizes in groups that included disordered eating patterns, for the regression models, we used normal eating style as a reference class and combined the other eating styles to form a class of disordered eating.
The frequency of consuming drinks and food items was assessed with a 45-item food frequency questionnaire with 6 answering options to choose from: “never or less than once a month,” “once or twice a month,” “once a week,” “twice a week,” “almost every day,” and “once a day or more often.” 33 Possible predisposing drinks and food items were studied as follows: Consumed coffee was calculated dl/day and alcohol g/week. For the analysis, sugared beverages, low-calorie beverages, ready-made foods (highly processed foods), fast foods, and meat dishes were classified into two categories according to the frequency of consuming the items: rarely, and monthly/weekly. Rarely included “never or less than once a month” answers and monthly/weekly included all the other more frequent answering options. Potential protecting food items, high-fiber bread, porridge, fresh vegetables, and fruits, were classified into categories of monthly/weekly, and daily. Daily included “once a day or more often” answers and monthly/weekly all the other less frequent answering options. The analyzed potential predisposing and protecting drinks and food items were chosen based on the previous literature. Overall diet quality was assessed with diet quality sum score (DQS), which was calculated based on a food frequency questionnaire, as detailed previously by Juppi et al. 34 Shortly, the questionnaire included 45 typical Finnish food items and 6 answer options for each item. The DQS consisted of 11 food items characteristic of a healthy diet. 35 Each of the food items was worth 1 point, maximum score being 11 points. A higher score indicates a healthier diet. DQS was constructed based on a previously validated tool. 33 Slight modifications in the original DQS were necessary because of some minor differences in food items and wordings between the food frequency questionnaires.
Demographical, physical activity, and gynecological variables
Participants’ demographical, gynecological, and physical activity variables have been described in detail previously. 31 Shortly, age was calculated from the date of birth to the date of answering to the prequestionnaire. BMI was calculated as body mass (kg) divided by height squared (m2). Self-reported education was assessed with a structured question and reclassified into two groups: those with bachelor level or higher education and those with education lower than bachelor level. Four-level physical workload was reclassified into the following groups: mainly sedentary work, work that includes standing and walking, and heavy work that additionally includes lifting.
Physical activity at the age of 17–29 years was assessed with the question: “What kind of regular physical activity have you done at different stages of your life?” 36 Participants were asked to specify their participation by selecting one or more of the following four options: no physical activity, regular independent leisure-time physical activity, regular competitive sport and related training, and regular other supervised physical activity in a sports club, etc. Current physical activity was evaluated with a self-reported questionnaire 37 including four questions about the frequency, intensity, and duration of leisure-time physical activity bouts as well as the average time spent in active commuting. Based on the answers, a metabolic equivalent of hours per day for current physical activity was calculated.
Participants were assigned to premenopausal, early and late perimenopausal, and postmenopausal groups based on the follicle stimulating hormone concentrations and self-reported menstrual bleeding diaries using the slightly modified Stages of Reproductive Aging Workshop (STRAW+10) guidelines. 38 Self-reported data on parity and whether a participant had undergone hysterectomy were collected.
Missing data
Of the analytical sample including 1098 participants, 2 had missing data on eating styles and 4–8 on different pelvic floor symptoms (Supplemental Appendix 1). The total number of missing data values was 287 out of 29,646 datapoints (1.0%). The percentage of missing values varied from 0% to 10% between the variables. The data was missing due to invalid or missing measurements and unclear or incomplete questionnaire responses. Thus, missing data were assumed to occur at random. Multiple imputation was used to create and analyze 50 multiply imputed data sets with 50 iterations for chained equations for each. 39 The model parameters were estimated separately for each data set. Multiple imputation and pooling of the model estimates were carried out in R 40 using the standard settings of the “mice” package. 39 For comparison, we also performed a complete case analysis, resulting in no major differences in the model estimates.
Statistical analyses
The associations of eating styles with symptoms of pelvic floor disorders were analyzed with four different models (Table 3). Model 1 was a simple logistic regression model and model 2 was adjusted with age and menopausal status. Model 3 was additionally adjusted with physical workload, physical activity history, current physical activity, and parity. For the final model (model 4), BMI was added to the list of confounders. The confounders with potential effects on the predictor and outcome variable identified based on the literature were included in the models. BMI was included individually in the fourth model to study its potentially significant role in the association between eating styles and symptoms of pelvic floor disorders.
The associations of potential predisposing (Tables 4 and 5) and protecting food items (Table 6) with symptoms of pelvic floor disorders were analyzed with two different models. Model 1 was a logistic regression model adjusted with age and menopausal status and model 2 was additionally adjusted with eating style. To allow robust investigation of the role of food items in different eating style backgrounds we decided to limit our attempts to control for confounding bias to the most obvious confounders, age, and menopausal status.
Correlation analysis, residual plots and scatter plots between each continuous predictor and the logits values were used for testing the model assumptions. Statistical analyses were performed using R and IBM SPSS Statistics 22.0 (SPSS Inc., Chicago, IL, USA). The level of significance was set at p ⩽ 0.05.
Results
Supplemental Appendix 2 shows the prevalence of the symptoms of pelvic floor disorders in the total analytical sample and across the four different eating styles. Participants’ self-reported symptoms of pelvic floor disorders, gynecological variables, physical activity status as well as demographical descriptives in total analytical sample and in normal and disordered eating styles are presented in Table 1. All symptoms of pelvic floor disorders were more common in women with disordered eating style compared to women with normal eating style. Women with disordered eating style had undergone hysterectomy more often, were currently less physically active, had lower education, and had notably higher BMI than women who had reported normal eating style. Average age of the participants was 51.2 years. The frequencies of consuming different drinks and food items in total analytical sample and in normal and disordered eating styles are presented in Table 2.
Descriptive data in different eating styles (n = 1098).

SD: standard deviation; MET-h/d: metabolic equivalent hours per day; PA: physical activity.
Two women did not report their eating style.
Consumption of food items in different eating styles (n = 1098).
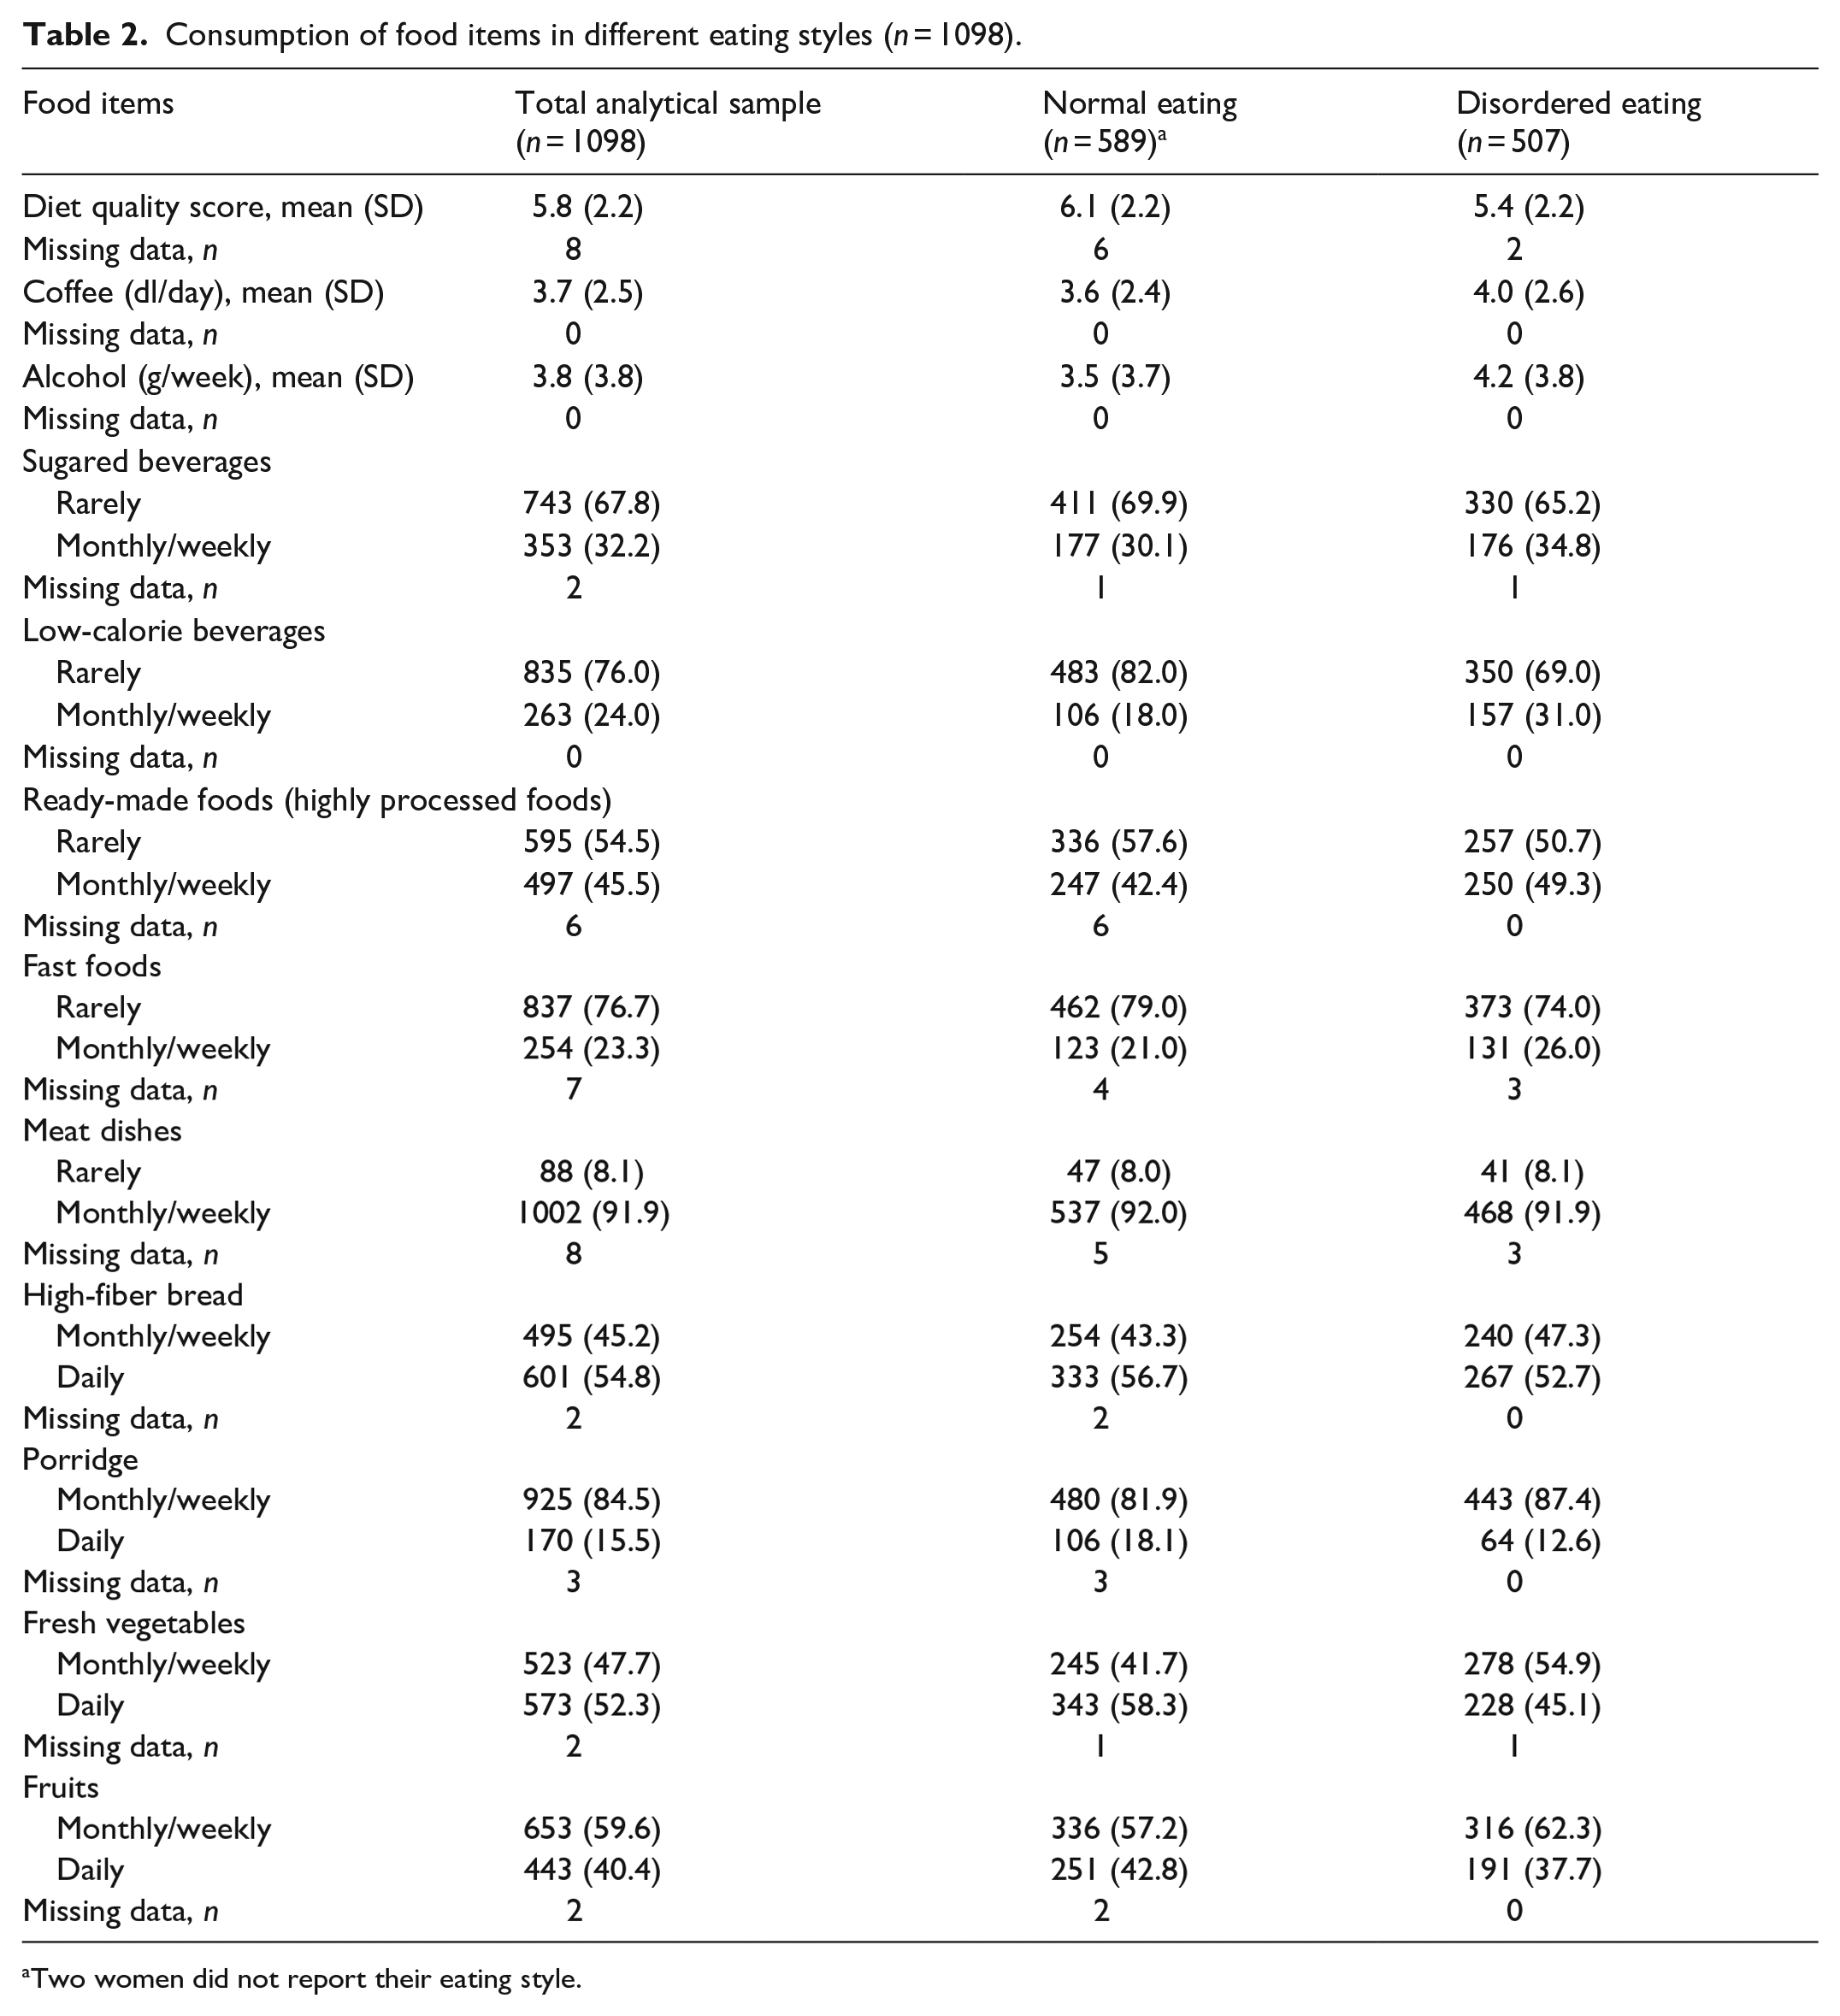
Two women did not report their eating style.
Women with disordered eating had a higher risk for stress urinary incontinence in unadjusted model 1 (odds ratio (OR) 1.54, p = 0.001) as well as in adjusted model 2 (OR 1.54, p = 0.001) and model 3 (OR 1.49, p = 0.002) (Table 3). Similarly, disordered eating was associated with constipation or defecation difficulties according to model 1 (OR 1.42, p = 0.028), model 2 (OR 1.41, p = 0.034) and model 3 (OR 1.40, p = 0.041). However, the statistical significance of the associations was abolished after additionally adjusting for BMI in Model 4.
Associations of eating styles with pelvic floor disorders (n = 1098).

Model 1: Simple logistic regression.
Model 2: Adjusted with age and menopausal status.
Model 3: Model 2+physical workload, physical activity (age 17–29), current physical activity (MET-h/d), and parity.
Model 4: Model 3+body mass index.
MET-h/d: metabolic equivalent hours per day; OR: odds ratio; 95% CI: 95% confidence interval.
Bold values indicate significant at p < 0.05.
Alcohol consumption was inversely associated with constipation and defecation difficulties in model 1 (OR 0.95, p = 0.026) and in model 2 (OR 0.94, p = 0.015) (Table 4). Higher consuming frequency of ready-made foods was associated with higher risks for stress urinary incontinence in model 1 (OR 1.53, p = <0.001) and in model 2 (OR 1.50, p = 0.001) as well as with urgency urinary incontinence in model 1 (OR 1.43, p = 0.042) and in model 2 (OR 1.42, p = 0.048) (Table 5). Similarly, eating fast foods more often was associated with higher risk for stress urinary incontinence according to both model 1 (OR 1.54, p = 0.003) and model 2 (OR 1.51, p = 0.005).
Potential predisposing drinks in different pelvic floor disorders (n = 1098).

Model 1: Adjusted with age and menopausal status.
Model 2: Model 1+adjusted with eating style.
OR: odds ratio; 95% CI: 95% confidence interval.
Bold values indicate significant at p < 0.05.
Potential predisposing food items in different pelvic floor disorders (n = 1098).

Model 1: Adjusted with age and menopausal status.
Model 2: Model 1+adjusted with eating style.
OR: odds ratio; 95% CI: 95% confidence interval.
Bold values indicate significant at p < 0.05.
Consuming fruits more often was associated with lower risk for stress urinary incontinence according to model 1 (OR 0.75, p = 0.022) and model 2 (OR 0.76, p = 0.034) (Table 6). Consuming porridge more often was associated with higher risk for constipation or defecation difficulties according to model 1 (OR 1.62, p = 0.018) and model 2 (OR 1.69, p = 0.010). Women with overall higher quality diet had lower odds for stress urinary incontinence according to model 1 (OR 0.90, p = <0.001) and model 2 (OR 0.91, p = 0.002).
Potential protecting food items and diet quality score in different pelvic floor disorders (n = 1098).
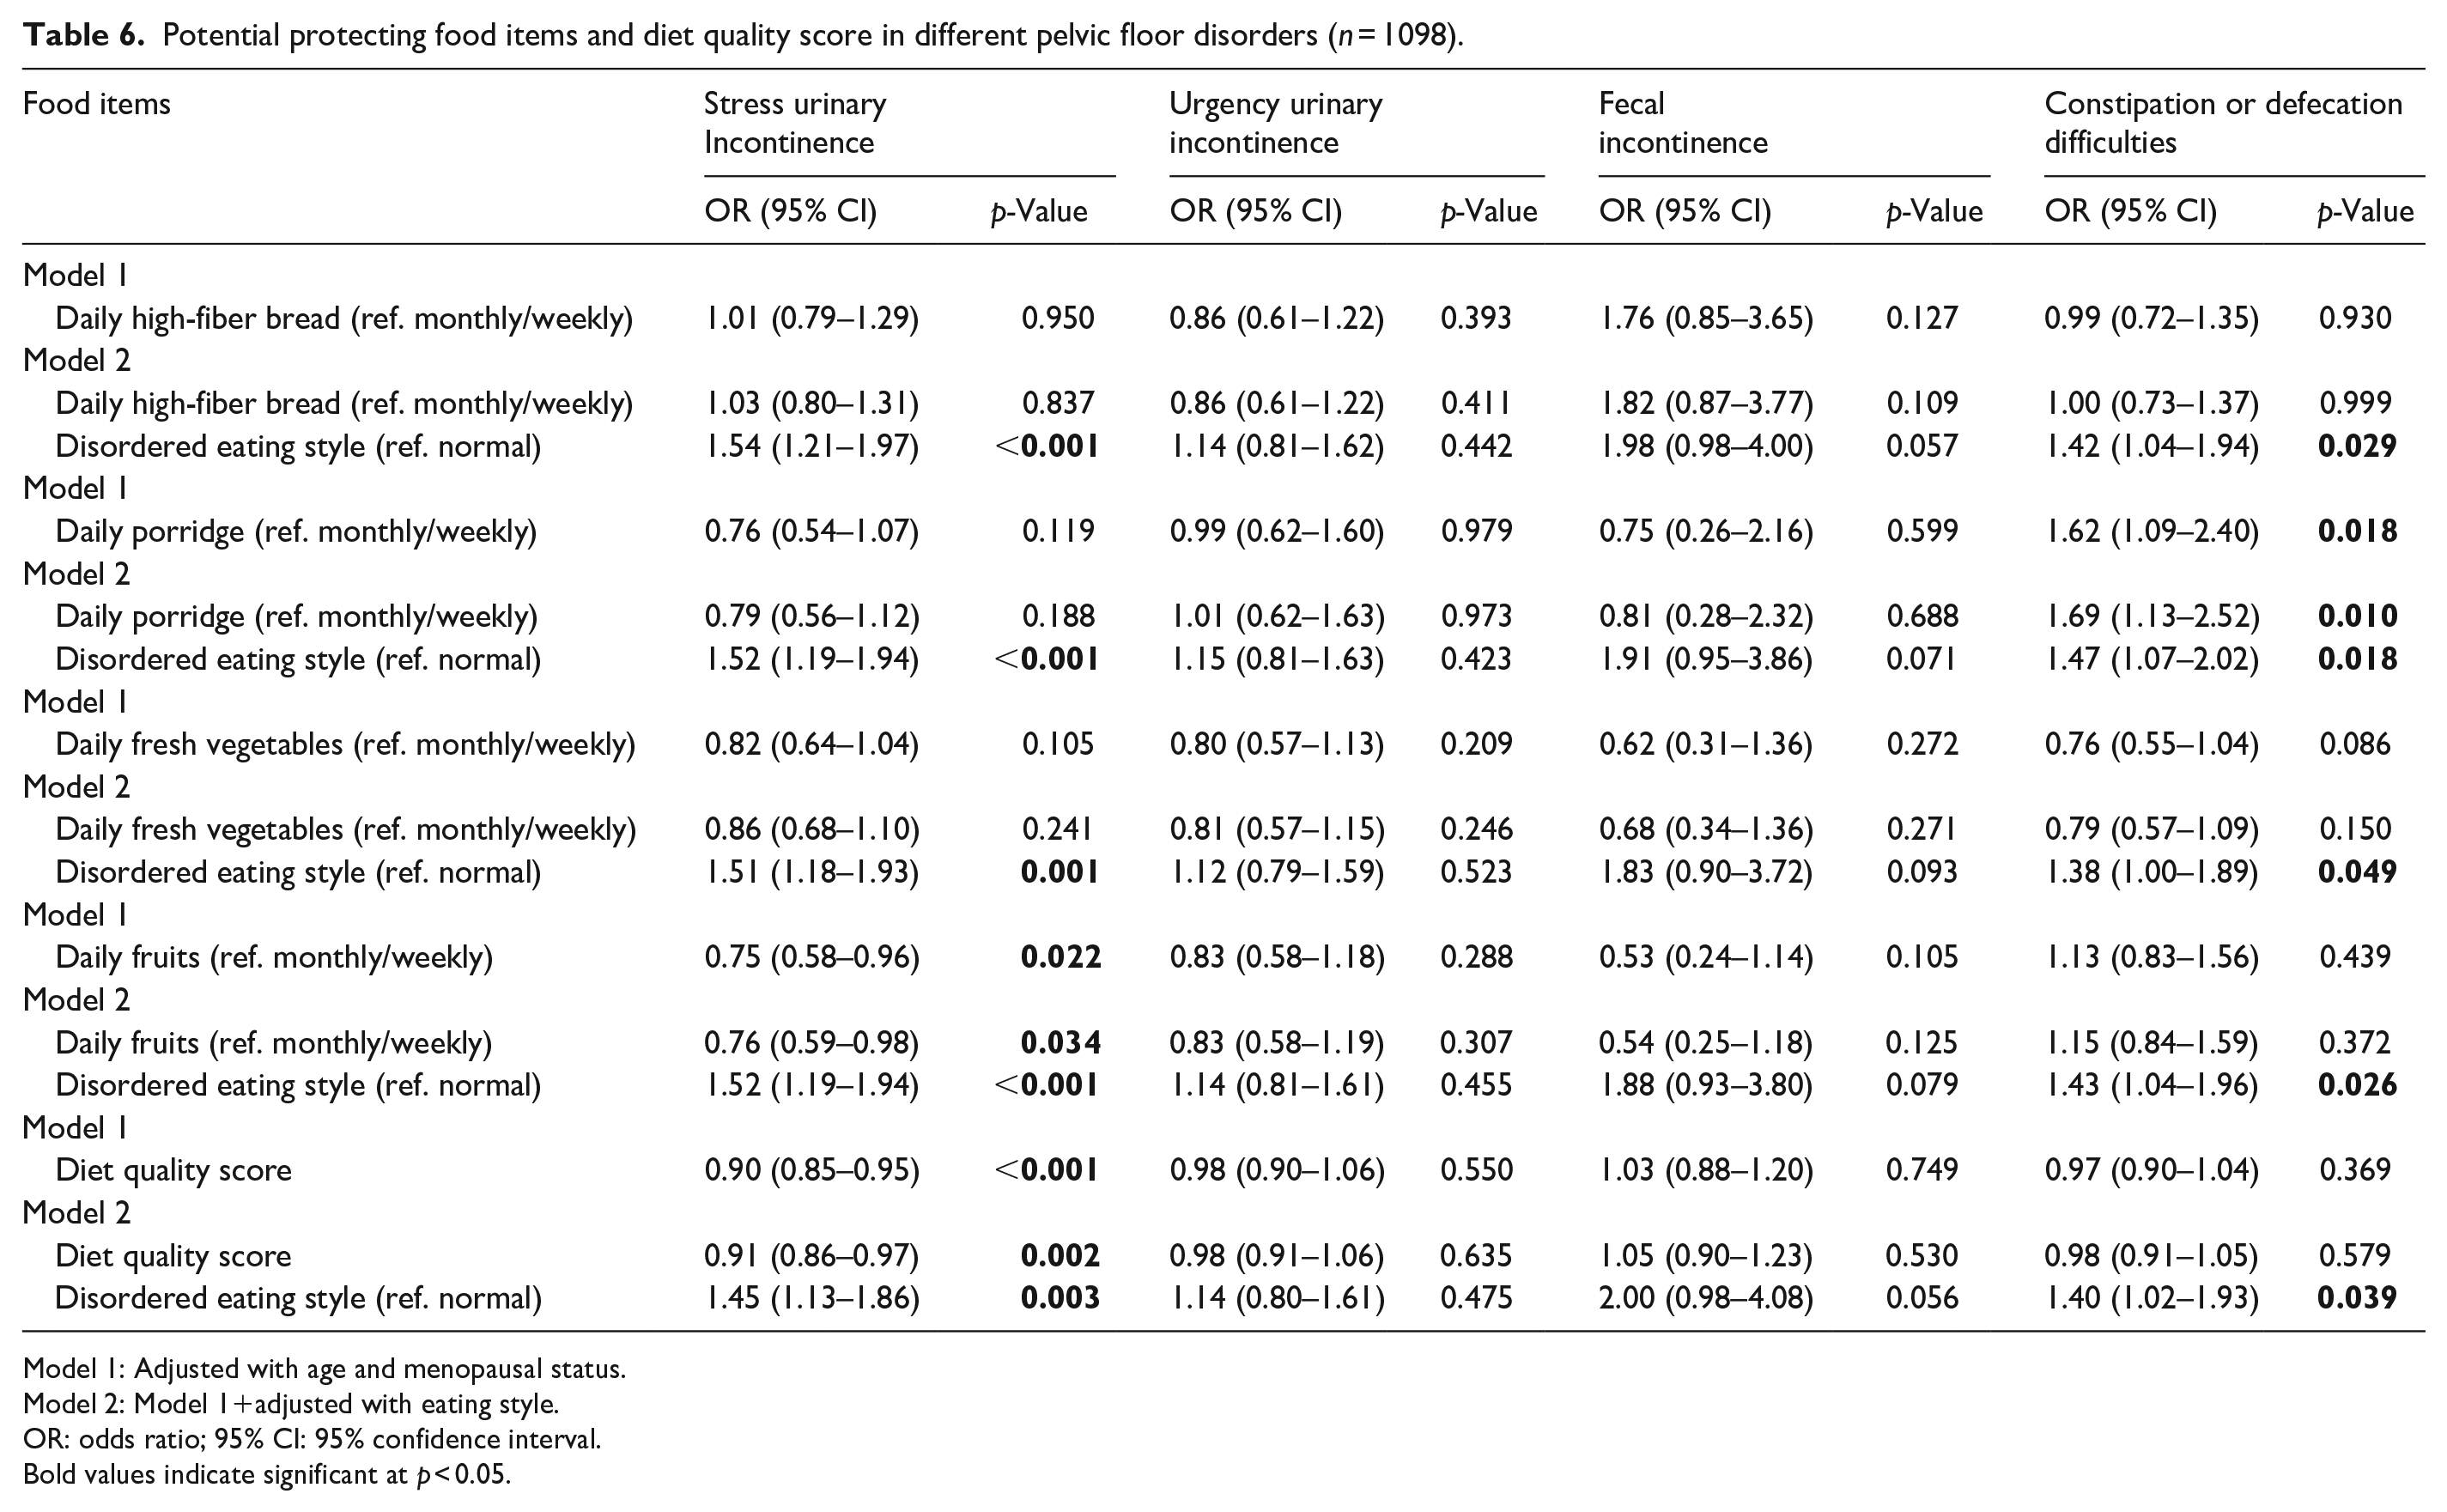
Model 1: Adjusted with age and menopausal status.
Model 2: Model 1+adjusted with eating style.
OR: odds ratio; 95% CI: 95% confidence interval.
Bold values indicate significant at p < 0.05.
Discussion
This study examined the association of eating behavior and dietary choices with symptoms of pelvic floor disorders in middle-aged women. We found that women who reported disordered eating were more likely to experience the symptoms of urinary incontinence and constipation or defecation difficulties. In addition, some drinks and dietary items were potentially predisposing or protecting regarding these conditions. Overall, women with higher quality diet had lower odds for symptoms of stress urinary incontinence.
Disordered eating, characterized by maladaptive eating attitudes and behaviors, seem to be common among middle-aged women in Western societies. 41 The causes might lie in the biological (e.g., BMI and menopausal status), psychological (e.g., aging anxiety), and sociocultural factors (e.g., perceived pressure to be thin).41,42 It has been hypothesized that menopausal transition increases vulnerability to eating-related conditions, such as eating disorders and negative body image,27,43 and, on the contrary, that disordered eating or body image concerns do not differ between menopausal phases.44,45 Mangweth-Matzek et al. 46 found that menopausal symptomology, as assessed by the Menopause Rating Scale, showed strong associations with eating and body-image measures, whereas defined menopausal stages showed no significant associations. However, there is substantial evidence that reproductive hormones play an important role in eating behavior:47 –51 In women, the control of food intake is largely regulated by estradiol, which acts as an inhibitor by decreasing meal size and advancing satiety.47 –49,52
Restrained eating or dieting refers to the intentional and sustained restriction of food intake for the purposes of weight loss or weight maintenance.53,54 Restrained eating appears to be relatively common behavior among middle-aged women. 24 In the study of Drobnjak et al., 24 10.7% of normal-weight women aged between 40 and 66 reported to engage in extreme dietary restraint. The authors described that postmenopausal women reported higher levels of restrained eating compared to premenopausal women. Another study 55 examined overweight middle-aged women and showed also increased restrained eating after menopause. The present study is in line with the previous, since postmenopausal women reported restricting their eating more than pre- and perimenopausal women. Overall, 10.6% of all participating women reported to restrict their eating.
Another form of disordered eating is overconsumption of palatable food, which can appear in the form of compulsive overeating or bingeing. 56 Generally, it involves eating more than an individual currently physiologically needs. 57 Differences in eating disorder symptoms and symptom pathways across developmental stages were examined in a large-scale study by Christian et al. 58 Findings suggested that older women, including women in midlife, may experience binge eating symptoms more than women in adolescence and early young adulthood. Another study on the subject resulted in contradictory findings: In a longitudinal study of Brown et al., 59 women were followed from young adulthood through midlife and changes in their eating disorder diagnoses and symptoms were examined. The study found significantly fewer eating disorder diagnoses and binge eating symptoms during midlife (ages 48–52) as compared to baseline (ages 18–22). In our sample of middle-aged women, 32.5% reported to overeat frequently. Postmenopausal women reported to overeat more than pre- and perimenopausal women.
We found that women who had reported to have features of disordered eating were more likely to experience the symptoms of stress urinary incontinence than women with normal eating style. The association between diet and the onset of stress urinary incontinence was assessed in the longitudinal Leicester MRC Incontinence Study 60 with over 5800 women aged 40 years plus. Higher total fat intake was significantly associated with stress urinary incontinence. In particular, saturated fatty acids (SFA) and cholesterol increased the risk for symptoms. It has also been shown that the higher total daily calorie intake is associated with urinary incontinence and increased severity. 61 Likewise, ratio of SFA intake to polyunsaturated fat acid (PUFA) intake is positively associated with urinary incontinence and its severity. In the study of Maserejian et al., 61 women had over twice the odds of urinary incontinence if their SFA:PUFA ratio was greater than 2:1. Ready-made, highly processed foods, and fast foods often contain higher levels of fat, especially saturated fat. These features of diet are linked to obesity and higher BMI as well as the risk of pelvic floor disorders.60,62,63 However, the causal relationship between eating behavior, BMI, and pelvic floor disorder is not clear warranting further studies. In our sample of women with an average BMI of 25.2, indicating slight overweight, the associations between disordered eating and pelvic floor disorders seemed to be largely explained by the BMI. After adjusting our models with BMI, the associations became smaller and not statistically significant. Albeit our study did not investigate body composition or location of body fat, the plausible explanation for the confounding role of the BMI is that a woman’s higher BMI indicates higher central body adiposity, which might bear down on pelvic tissues causing chronic strain, stretching, and weakening of the structures of the pelvic floor. 64
The analysis of potential dietary risk factors shows that consuming monthly or more often ready-made and fast foods leads to a higher risk for symptoms of stress urinary incontinence. The same applies with ready-made foods and urgency urinary incontinence. The mechanism behind this phenomenon may lead to metabolic aspects: Unhealthy Western style diet, characterized by high consumption of saturated fats and overeating, causes oxidative stress, whereas excessive fat consumption contributes to the development of low-grade systemic inflammation. 65 Oxidative stress and systemic inflammation are associated with both stress and urgency urinary incontinence.66,67 The hypothesized role of inflammatory processes in the etiology of urologic symptoms is supported by the results of the BACH survey in which Kupelian et al. 68 reported that increased serum C-reactive protein increases the odds of lower urinary tract symptoms in women. Fruits are known to contain high amounts of antioxidants, which counteract inflammatory processes in the body. 69 According to our study, eating fruits daily may protect from the symptoms of stress urinary incontinence. In addition, it is plausible that diet rich in antioxidants may as well be of higher quality in other measures since higher diet quality indicated lower risk for stress urinary incontinence. Previous studies have shown that carbonated drinks, artificial sweeteners, caffeine, and alcohol are bladder irritants.70 –72 Nevertheless, drinks such as coffee, alcohol, and different types of beverages were not associated with symptoms of urinary incontinence in our sample.
According to the present study, features of disordered eating, including restricted eating, overeating or their combination, are associated with symptoms of constipation or defecation difficulties. It has been shown that overeating individuals tend to choose food items high in fat and carbohydrates and low in fiber. 63 Inadequate dietary fiber intake is a potential risk factor for constipation, since fiber serves to enhance stool consistency and stimulates bowel movements.73,74 In the study of Dukas et al., 75 the influence of lifestyle variables, including fiber intake, on the development of constipation was evaluated by the responses of 62036 women (age 36–61 years). A total of 3327 women (5.4%) were classified as having constipation, defined as 2 or fewer bowel movements weekly. Women in the highest quintile of dietary fiber intake (20 g/day) were less likely to experience constipation than women in the lowest quintile (7 g/day). However, a review article 76 summarized that a diet poor in fiber may be a contributory factor but should not be assumed to be the cause of chronic constipation. Some patients may benefit from a fiber-rich diet, but patients with more severe constipation may get worse symptoms when fiber intake is increased. Interestingly, we found that women with a habit to consume porridge more often are at higher risk for the symptoms of constipation or defecation difficulties. We were not able to study causal effects; thus, it can only be speculated whether reverse causality exists, and women with constipation or defecation difficulties try to relieve the symptoms by eating more fibers. Overall, soluble fiber, found, for example, in oat, may be of benefit in treating chronic constipation. 74 Inadequate fluid intake is suggested to be a risk factor for constipation; however, there are inconsistencies in study results, and fluid intake may be of benefit only for dehydrated patients. 76 Previously, daily alcohol consumption (at least one drink; approximately 12 g of alcohol) has been found to be inversely associated with constipation, 75 a result in line with our study.
We did not find statistically significant associations between symptoms of fecal incontinence and eating style. However, women may modify their eating when trying to control the symptoms. In a qualitative study of Andy et al., 77 dietary modification strategies were studied with community-dwelling older women who tried to manage their fecal incontinence. Women were aware of the role of the diet and made dietary modifications including decreasing the amounts and frequency of meals, limiting certain foods (such as coffee, and spicy and fatty foods), and changing methods of food preparation (baking and boiling instead of frying). Others have also reported that certain foods are perceived to improve or exacerbate fecal incontinence symptoms, and diet is adjusted as part of self-care practices.78,79
Studies on the role of diet in the pathogenesis of fecal incontinence are scarce. However, it has been shown that macro-and micronutrient intake does not differ significantly in those with and without fecal incontinence. 78 Dietary fiber may be an exception since low fiber intake has been found to be independently associated with fecal incontinence, 80 and its adequate intake is broadly advised for bowel health.81,82 However, compared to constipation, data on the effects of fiber on fecal incontinence are limited. We studied effects of liquids, low-fiber fatty foods, and high-fiber foods with symptoms of fecal incontinence, finding no associations. Our sample included a rather small number of women experiencing fecal incontinence (34 cases, 3.1%). Therefore, our results regarding fecal incontinence cannot be considered conclusive.
Strengths and limitations
The present study had several strengths and limitations. We were able to utilize previously gained knowledge in considering potential confounding factors, that is, to control also for past and current physical activity and menopausal status of participants in addition to demographical and gynecological factors. 31 Overall, the extent of this study is exceptional, since we were able to study four different symptoms of pelvic floor disorders among the large homogenous cohort of Caucasian women. The homogeneity of the study population is simultaneously a strength as it reduces internal variability and increases statistical power and a limitation as our findings may not be reproducible in more heterogeneous populations. It can be considered as a limitation that we have not made a priori power calculations, because this is an observational cohort study.
The experienced symptoms of pelvic floor disorders were asked in an early stage of the study, which may result in underreporting, especially when the subject may be considered sensitive. We chose to use a simplistic, short pelvic floor disorder questionnaire that is fast and easy to fill in as part of a self-report questionnaire and is commonly used in clinics as part of medical examination interviews. However, the questionnaire used is not validated, which is a limitation. Since the responses were dichotomized (yes/no), we were not able to study the severity of the symptoms. We were also not able to ensure that women understood the possible symptoms in a similar manner. Women with BMI >35 kg/m2 were excluded from the study; thus, the results are not completely generalizable to individuals with severe obesity. In addition, the assessment of eating behavior based on self-reporting can be biased by social desirability, 83 that is, the tendency to assess one’s own eating styles critically, which affects women more than men. 84 This may cause respondents to overestimate healthy behaviors and underestimate the undesirable ones.85,86 The study was explorative cross-sectional observational study and cannot therefore reveal women’s long-term eating habits and whether they have a causal effect on the development of the symptoms of pelvic floor disorders or if reverse causality exists.
Conclusions
This study was exploratory in nature. Eating behavior has scantly been studied as a potential risk factor for pelvic floor disorders, and thus, we aimed to test the proof-of-concept. In our sample, women with disordered eating style, including women with overeating, restrictive eating, and alternating overeating and restricting eating styles, were more prone to experience symptoms of pelvic floor disorders compared to women with normal eating style. To our knowledge, there are no previous studies investigating the association of eating style with pelvic floor disorders in the middle-aged female population nor any other aged women. In addition, this study revealed that some dietary items may predispose or protect from the symptoms, providing information for healthcare practitioners and patients themselves. Since we found the disordered eating style and some dietary items to be associated with perceived pelvic floor disorders, our study justifies further studies with longitudinal designs to investigate causality.
Supplemental Material
sj-docx-1-whe-10.1177_17455057241305075 – Supplemental material for Association of eating behavior with symptoms of pelvic floor disorders in middle-aged women: An observational study
Supplemental material, sj-docx-1-whe-10.1177_17455057241305075 for Association of eating behavior with symptoms of pelvic floor disorders in middle-aged women: An observational study by Mari A Kuutti, Matti Hyvärinen, Hannamari Lankila, Pauliina Aukee, Enni-Maria Hietavala and Eija K Laakkonen in Women’s Health
Supplemental Material
sj-docx-2-whe-10.1177_17455057241305075 – Supplemental material for Association of eating behavior with symptoms of pelvic floor disorders in middle-aged women: An observational study
Supplemental material, sj-docx-2-whe-10.1177_17455057241305075 for Association of eating behavior with symptoms of pelvic floor disorders in middle-aged women: An observational study by Mari A Kuutti, Matti Hyvärinen, Hannamari Lankila, Pauliina Aukee, Enni-Maria Hietavala and Eija K Laakkonen in Women’s Health
Supplemental Material
sj-docx-3-whe-10.1177_17455057241305075 – Supplemental material for Association of eating behavior with symptoms of pelvic floor disorders in middle-aged women: An observational study
Supplemental material, sj-docx-3-whe-10.1177_17455057241305075 for Association of eating behavior with symptoms of pelvic floor disorders in middle-aged women: An observational study by Mari A Kuutti, Matti Hyvärinen, Hannamari Lankila, Pauliina Aukee, Enni-Maria Hietavala and Eija K Laakkonen in Women’s Health
Footnotes
Acknowledgements
The authors thank laboratory staff in the Faculty of Sport and Health Sciences for their invaluable help with the data collection, as well as the participants of the ERMA study who volunteered their time and effort.
Declarations
Supplemental material
Supplemental material for this article is available online.
References
Supplementary Material
Please find the following supplemental material available below.
For Open Access articles published under a Creative Commons License, all supplemental material carries the same license as the article it is associated with.
For non-Open Access articles published, all supplemental material carries a non-exclusive license, and permission requests for re-use of supplemental material or any part of supplemental material shall be sent directly to the copyright owner as specified in the copyright notice associated with the article.