
Abstract
Background:
More than 20% of young Japanese women fall into the category of presarcopenia (only the skeletal muscle mass is below the sarcopenia criteria), and it has recently been pointed out that thinness in young adult women may be associated with future problems related to sarcopenia (age-related muscle weakness). However, the problem of sarcopenia is related to skeletal muscle, and body mass index (BMI) cannot assess only skeletal muscle.
Objective:
Prepregnancy BMI does not assess body composition and may not adequately assess the physical health of pregnant women.
Design:
The study employed a longitudinal study design.
Methods:
The purpose of this study was to examine the possibility that health problems caused by sarcopenia may be overlooked if pregnant women are classified using prepregnancy BMI. Fifty-one first-time mothers without underlying medical conditions (underweight (BMI < 18.5 kg/m2, n = 8), normal weight (18.5 kg/m2 < BMI < 25 kg/m2, n = 39) and obese (25 kg/m2 < BMI < 30 kg/m2, n = 4) groups) were included. Skeletal muscle index (SMI = (two upper limb muscle mass + two lower limb muscle mass)/height2) and maximum voluntary isometric contraction of grip strength used in European and Asian sarcopenia diagnostic criteria were used to assess sarcopenia in mid- and late pregnancy.
Results:
For the normal-weight and underweight groups in mid- and late pregnancy, 12%–16% of participants met the diagnostic criteria for sarcopenia according to grip strength (<18 kg), 14%–26% of participants met the diagnostic criteria for sarcopenia according to the SMI (<5.7 kg/m2) and 4%–8% of participants met the diagnostic criteria for sarcopenia according to both grip strength and the SMI.
Conclusion:
Among the pregnant women who were classified as ‘normal’ based on their prepregnancy BMI, 12%–26% had sarcopenia. It is therefore suggested that pregnant women’s health problems could be more appropriately assessed by body composition rather than by BMI classification.
Introduction
In Japan, the proportion of low birth weight infants has been annually increasing since the 1980s. In recent years, it has remained at approximately 10%, and there has been no decreasing trend.1 –3 Similarly, the percentage of underweight among young adult Japanese women aged 20–29 years has also been increasing since approximately 1980, and it is now reported that approximately 20% of young adult women fall into the underweight category.4,5 It has been shown that if pregnant women are underweight, they are more likely to give birth to low birth weight babies, and their children are more likely to suffer from diseases such as diabetes in the future.6,7 In addition, pregnant women with low body weight are likely to have low skeletal muscle mass, which represents a large proportion of their body composition and plays an important role in their organism. Since low skeletal muscle mass is one of the key indicators for the diagnosis of sarcopenia (defined as age-related muscle loss),8 –10 the assessment of skeletal muscle mass, as well as body weight, is an important indicator in women’s health issues throughout life.
The World Health Organization and the Japanese Ministry of Health, Labor, and Welfare (MHLW) use body mass index (BMI), which is calculated using ‘height’ and ‘weight’, to classify underweight (thin), normal weight, overweight (preobesity), obesity, etc.11,12 In addition, the Centers for Disease Control and Prevention of the United States and the MHLW have published guidelines for appropriate weight gain during pregnancy based on prepregnancy BMI classification.13,14 Thus, prepregnancy BMI has been widely established as an evaluation method for indicating physique and has come to be used as an indicator of birth and maternal health outcomes.
On the other hand, previous studies reported that more than 20% of young Japanese women fall into the category of presarcopenia (only the skeletal muscle mass is below the sarcopenia criteria), and it has recently been pointed out that thinness in young adult women may be associated with future problems related to sarcopenia (age-related muscle weakness).15,16 However, the problem of sarcopenia is related to skeletal muscle, and BMI cannot assess only skeletal muscle. We hypothesized that prepregnancy BMI does not assess body composition and therefore cannot adequately assess the physical health of pregnant women. In addition, the BMI classification cannot assess sarcopenia risk (low skeletal muscle mass and low muscle strength) at all because BMI cannot also assess muscle function. Thus, the purpose of this study was to examine the possibility that health problems caused by sarcopenia may be overlooked if pregnant women are classified using their prepregnancy BMI. We focused on whether those who are considered prepregnancy normal by BMI have adequate skeletal muscle mass and strength.
Although methods for calculating body composition include underwater weight measurement, waist circumference measurement and the dual-energy X-ray absorptiometry (DEXA) method, these methods are not recommended for pregnant women. The DEXA and bioelectrical impedance analyser (BIA) methods are also recommended for sarcopenia diagnosis.8,9 In this study, we considered it an important method to measure skeletal muscle mass using a method recognized in analysis of sarcopenia along with body composition, and therefore decided to use the BIA method, which is less risky for pregnant women and enables sarcopenia assessment.
Methods
Design
The study employed a cross-sectional study design. Referencing the STARD 2015 guidelines, we have authored this article. 17
Participants
For this study, we requested potential first-time mothers as participants. Because the inclusion of multiparous women increases age, body composition changes with childbearing and multiparous women tend to have larger birth weights, the target participants in this study were first-time mothers. Therefore, first-time mothers were selected from hospitals and other facilities that cooperated with the project. Researchers then approached first-time mothers to determine eligibility. Overall exclusion criteria were non-Japanese, underlying medical conditions, transplants, twin births, non-full-term birth and patients with complications. First-time mothers with no underlying medical conditions, singleton pregnancies and regular check-ups without problems during pregnancy were included in the study. Fifty-one Japanese women (aged 21–42 years) were recruited for the study from obstetrics and gynaecology clinics, hospital obstetrics and gynaecology outpatient clinics and midwifery centres at 20–23 weeks’ gestation after verbally recruiting the study subjects and obtaining informed consent. Prior to obtaining informed consent, a written document explaining the purpose and safety of the study and a lifestyle questionnaire were distributed to potential participants. In this study, the subjects were not instructed in exercise habits, and all were in full-term birth at 37–40 weeks. All participants who met the criteria were included in the data analysis. This research was approved by the Ethics Committee of Seirei Christopher University (approval number: 19091), and written informed consent was obtained from all participants. The recruitment period for this study began on 31 March 2020, and the experiment ended on 31 July 2021.
Body mass index
Standing height was measured with a standing height metre in 0.5 cm increments, and body weight was measured with an electronic scale in 0.1 kg increments by a multifrequency BIA and a body composition scale (InnerScan RD-800; TANITA, Tokyo, Japan). BMI was determined as body weight/height 2 (kg/m2). The coefficient variation (CV) for this measurement from test to retest was 0.1%. Participants were divided into the following three groups according to BMI: the underweight group (BMI < 18.5 kg/m2), normal-weight group (18.5 kg/m2 < BMI < 25 kg/m2) and overweight group (25 kg/m2 < BMI < 30 kg/m2). 9
Skeletal muscle index
InBody analyser (430; Biospace, Seoul, Korea) is often used in the BIA method for body composition (skeletal muscle mass) analysis. 16 On the other hand, it was necessary to use a simpler device to measure body composition based on the BIA method, which researchers could bring to pregnant women in the mid- and late stages of pregnancy without the burden of transportation. Therefore, we decided to adopt a body composition analyser (InnerScan RD-800; TANITA), which can calculate limb skeletal muscle mass. To determine the accuracy of this instrument, we examined the relationship for skeletal muscle index (SMI) based on TANITA and InBody in 24 young adult women (mean age 24.6 years, mean height 1.58 m, mean weight 55.1 kg). The result showed that TANITA-SMI showed a strong correlation (r = 0.92, p < 0.001) with InBody-SMI (Figure 1). Therefore, we decided to use the body composition analyser by TANITA to measure skeletal muscle mass in the measurement of pregnant women. The CV for this measurement from test to retest was 0.7%.

The relationship between TANITA-SMI and InBody-SMI in 24 young adult women.
The body composition analyser was applied in accordance with the manufacturer’s guidelines; BIAs predict body composition by differences in conductivity due to the different biological properties of individual tissues. Body composition analysers are founded on a four-pole contact electrode system that provides individual segmental measurements of the impedance of the arms, trunk and legs. Participants were asked to avoid strenuous exercise the day before the measurement and to wait at least 2 h after eating before taking the measurement. Participants were assessed in a resting and upright position with their arms outstretched in front of them and their elbows extended. The body composition scales automatically calculated the amount of skeletal muscle mass and body fat in part of the body and the total body weight.
Skeletal muscle index (kg/m2) = (appendicular muscle mass; two upper limb muscle mass + two lower limb muscle mass)/height 2 .8 –10
Grip strength
A hand dynamometer (TKK 5401; Takei, Tokyo, Japan) was used to measure the maximum voluntary isometric contraction of grip strength. All participants were instructed to hold the dynamometer with their right hand in an upright position with their arm placed beside their trunk and their elbow stretched to 180°. The dynamometer handle was sized to be comfortable for each individual participant to grasp (to fit on the second joint of each finger). Every participant completed two attempts, and the highest score on an attempt was used for the analysis.16,18 The coefficient of variation of grip strength measurement from test–retest was 3.1%.
Dietary survey
For the dietary survey, the participants were asked to take before and after pictures of their meals, including the feel of the three non-event days, along with a fill-in card. The entry card included ID, date, time of day (before and after breakfast, before and after lunch, before and after dinner and before and after all snacks and preferences) and words for food remaining or added after the meal, and the data were later sent to the researcher. The dietary data were analysed by a dietitian for each nutrient intake using the dietary analysis software (Healthy Maker Pro 432; Mushroom Soft, Inc., Okayama, Japan) from the photographs of the meals.
Statistical analyses
The results are presented as the mean ± standard deviation for all variables. All data were analysed using software (SPSS Statistics Ver. 24 for windows; IBM, Tokyo, Japan). Pearson product correlations of grip strength or dietary survey and variable factors were also statistically quantified. Statistical significance was defined as p < 0.05. The sample size was estimated from a priori power analysis 19 to detect differences (power of 0.80, an α of 0.05, two-tailed and a correlation coefficient of 0.58) in relationship between SMI and grip strength for young Japanese women by reference to the result of previous study. 20 Consequently, it was determined that a minimum of eighteen participants were required.
Results
For physical characteristics before pregnancy, the participants (Age: 29.3 years, 95% confidence interval (CI) 27.4–30.2) had a mean height of 1.57 ± 0.05 m (95% CI 1.56–1.59), a mean body weight of 51.4 ± 7.9 kg (95% CI 49.2–53.6) and a mean BMI of 20.7 ± 2.9 kg/m2 (95% CI 19.9–21.5). Of the participants, 15.7% (n = 8) were classified as being underweight, 76.5% (n = 39) were classified as being normal weight and 7.8% (n = 4) were classified as being overweight.
In mid-pregnancy, there was a significant correlation (r = 0.437, p < 0.01) between grip strength and the SMI (Figure 2(a)). During this period, 8 participants met the diagnostic criteria for sarcopenia (normal weight: n = 6, underweight: n = 2; 15.7%, 95% CI 14.8–16.7) according to grip strength, 13 participants met the diagnostic criteria for sarcopenia (normal weight: n = 10, underweight: n = 3; 25.5%, 95% CI 24.6–26.4) according to the SMI and 4 participants met the diagnostic criteria for sarcopenia (normal weight: n = 2, underweight: n = 2; 7.8%, 95% CI 6.9–8.7) according to both grip strength and the SMI (Table 1).
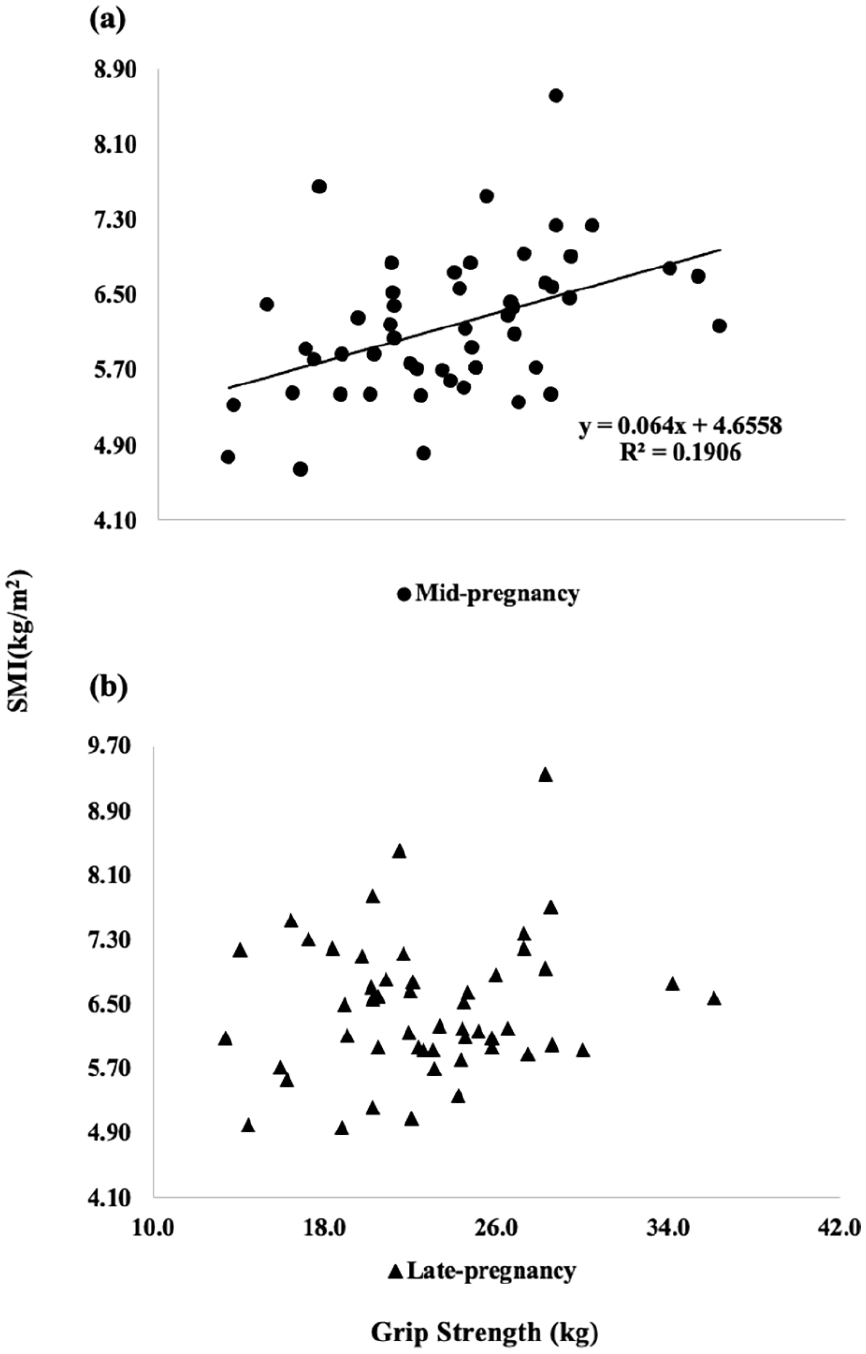
Relationships between grip strength and SMI in mid- (a) and late (b) pregnancy.
Prepregnant BMI classification and grip strength and skeletal muscle mass corresponding to sarcopenia diagnostic criteria.

Underweight group: prepregnant BMI < 18.5 kg/m2. Normal-weight group: 18.5 kg/m2 < prepregnant BMI < 25 kg/m2. BMI, body mass index; SMI, skeletal muscle index.
From mid-pregnancy (26.6 ± 1.2 weeks, 95% CI 26.3–27.0) to late pregnancy (33.2 ± 1.0 weeks, 95% CI 33.0–33.5), the participants’ body weight increased significantly by 2.54 kg (57.22–59.76 kg), the appendicular muscle mass (AMM) increased by 0.71 kg (15.29–16.00 kg) and grip strength significantly decreased by 0.82 kg (23.6–22.8 kg).
In late pregnancy, there was no significant correlation (r = 0.149, p > 0.05) between grip strength and the SMI (Figure 2(b)). During this period, six participants met the diagnostic criteria for sarcopenia (normal weight: n = 5, underweight: n = 1; 11.8%, 95% CI 11.1–12.5) according to grip strength, seven participants met the diagnostic criteria for sarcopenia (normal weight: n = 4, underweight: n = 3; 13.7%, 95% CI 13.2–14.2) according to the SMI and two participants met the diagnostic criteria for sarcopenia (normal weight: n = 1, underweight: n = 1; 3.9%, 95% CI 3.3–4.5) according to both grip strength and the SMI (Table 1).
Dietary surveys during mid- and late pregnancy showed no significant (p > 0.05) changes in energy intake (1560 kcal versus 1447 kcal), protein ratio (15.8% versus 15.7%, p > 0.05), fat ratio (31.3% versus 32.4%) and carbohydrate ratio (50.9% versus 50.6%). Energy intake during pregnancy was not significantly correlated (p > 0.05) with prepregnancy BMI, maternal weight gain, grip strength or SMI.
Discussion
This study investigated whether classification by prepregnancy BMI is appropriate to detect health problems in pregnant women. When assessed with grip strength and the SMI used in the sarcopenia diagnostic criteria (EWGSOP 8 and AWGSOP9,10), there were pregnant women who met the sarcopenia diagnostic criteria in both the mid- and late pregnancy, despite being classified as having normal weight by prepregnancy BMI. This suggested that the prepregnancy BMI classification may miss health problems in pregnant women.
It has been noted that underweight (thin) in pregnant women not only in Japan but also worldwide affect the weight and health status of the infants.21,22 In recent years, the problem of presarcopenia (low skeletal muscle mass) in the fertile generation itself has also been noted.15,16 However, when the pregnant women in mid- and late pregnancy were examined in this study, it was found that there were more individuals with low muscle strength and low skeletal muscle mass in the normal-weight BMI category than in the underweight BMI category (Table 1). This means that many physically unhealthy people are included among those who have previously been classified as healthy because they have a standard BMI. Therefore, classification using prepregnancy BMI, which has been widely used, is likely to be effective as a strategy to prevent low birthweight, but it does not adequately detect physical health problems in pregnant women.
In general, the body weight of pregnant women reaches a maximum value in the later stages of pregnancy,13,14 suggesting that the number of individuals with presarcopenia (SMI < 5.7 kg/m2) would have decreased by approximately half from mid-pregnancy (n = 13) to late pregnancy (n = 7). However, it is also surprising that presarcopenia was also present among those close to childbirth. In this study, there was a significant relationship between the duration of pregnancy from mid-term to late-term and increased AMM (r = 0.299, p < 0.05). On the other hand, pregnant women gained body weight as their pregnancies progressed, but only approximately 24% of them (approximately 0.7 kg, 95% CI 0.4–1.0) gained AMM. This suggests that in many cases, low skeletal muscle mass did not increase to normal skeletal muscle mass. Internationally, body weight and BMI values are used to judge the course of pregnancy,13,14 and guidelines provide recommendations for weight gain during pregnancy. 23 However, among the participants in this study, 100% of the underweight group and 40% of the normal-weight group still had low skeletal muscle mass (presarcopenia) (Table 1), indicating that it is extremely difficult to adequately determine low skeletal muscle problems using the prepregnancy BMI-based classification. Therefore, although BMI can be calculated from height and weight and is a very simple method for classification, the assessment of skeletal muscle mass and other parameters should be explored in the future with the use of a body composition analyser. The participants in this study had a low energy intake of approximately 1500 kcal in the second and third trimesters of pregnancy. Such low energy intake was reported in a previous study 24 as a fact found in Japanese pregnant women, and the results of this study were similar. The study also confirmed that basic dietary intake and nutritional balance are extremely important to increase skeletal muscle mass and reduce the risk of sarcopenia.
In general, grip strength is known as an indicator that reflects total body skeletal muscle mass. 25 Therefore, it is estimated that grip strength showed a significant relationship with SMI, one of the indicators of whole-body skeletal muscle mass, in the second trimester of pregnancy. On the other hand, it is known that as pregnancy progresses, changes in the weight of pregnant women, such as an increase in the weight of the foetus, become more significant. In the present study, SMI showed an increase from mid- to late pregnancy, but this increase was mainly due to lower limb skeletal muscle mass, while upper limb skeletal muscle mass did not change. This means that as the weight of pregnant women increased, an increase was induced in lower limb muscle mass, which is important for supporting the body, but had nothing to do with upper limb muscle mass or strength. Grip strength showed a slight decrease from mid- to late pregnancy. This is presumed to be since dietary calories remained free at 1560 kcal in the second trimester and 1447 kcal in the third trimester, and that physical activity decreased due to weight gain from the second trimester to the third trimester, resulting in decreased muscle strength. As a result, the relationship between muscle strength and muscle mass, which showed a significant correlation in the second trimester, became insignificant in the second trimester because lower extremity SMI showed an increase, although grip strength remained the same.
Several limitations of this study should be discussed. First, because it was not easy to recruit subjects, the pregnancies were able to be term (37–41 weeks or less, 95% CI 39.0–39.5), while the ages of the women were slightly wider (29.3 years, 95% CI 27.4–30.2). Future studies that allow evaluation without considering the effect of pregnant women’s age will be needed. Second, the energy intake of Japanese pregnant women was lower than expected. Although there were no variables in this study that directly related energy intake to the results, the effects of energy intake on skeletal muscle mass and muscle strength during pregnancy should be examined. Future studies are needed to investigate the relationship between dietary intake, skeletal muscle health and sarcopenia risk in pregnant women.
Conclusion
Non-negligible percentages of pregnant women classified as ‘normal’ by their prepregnancy BMI fell within the cutoff values in one of the sarcopenia assessments. This represents a limitation of BMI, which had been evaluated as the sole measure of health status during pregnancy. If sarcopenia is undetectable, the mother’s low skeletal muscle mass is also not detected, making it more likely that she will give birth to a low birth weight baby, which increases the likelihood of future disease, and increases her own risk of caregiving and other lifelong health problems. The results of this study indicated that pregnant women’s health problems could be more appropriately assessed by body composition rather than by BMI classification. In particular, the BIA-based body composition assessment is a safe and simple method for pregnant women and can correctly assess skeletal muscle mass, etc. Body composition classification based on the BIA method, rather than BMI classification, may help prevent the risk of perinatal complication and sarcopenia. In the future, further investigation into the relationship between sarcopenia and pregnancy outcomes, the establishment of methods for assessing maternal body composition during pregnancy and the development of evidence-based guidelines for sarcopenia screening in pregnant women will hopefully lead to the development of clinical practice and research.
Supplemental Material
sj-docx-1-whe-10.1177_17455057241297108 – Supplemental material for Can prepregnancy BMI be used to detect the risk of sarcopenia in Japanese pregnant women?
Supplemental material, sj-docx-1-whe-10.1177_17455057241297108 for Can prepregnancy BMI be used to detect the risk of sarcopenia in Japanese pregnant women? by Yoshiko Miwa, Tomohiro Yasuda, Eiko Fujimoto and Kimie Kubota in Women’s Health
Footnotes
References
Supplementary Material
Please find the following supplemental material available below.
For Open Access articles published under a Creative Commons License, all supplemental material carries the same license as the article it is associated with.
For non-Open Access articles published, all supplemental material carries a non-exclusive license, and permission requests for re-use of supplemental material or any part of supplemental material shall be sent directly to the copyright owner as specified in the copyright notice associated with the article.