
Abstract
Background:
Black Americans have a higher prevalence of stroke and stroke-related deaths than any other racial group. Racial disparities in stroke outcomes are even wider among women than men. Conventional studies have cited differences in lifestyle (i.e. smoking, alcohol consumption, etc.) and vascular risk factors between races as the source of these disparities. However, these studies fail to account for the higher prevalence of minoritized populations at the lower end of the socioeconomic distribution.
Objectives:
This study explores differences in stroke risk factors across age and socioeconomic cohorts to determine whether comorbidities can sufficiently explain disparities at all ages and income levels.
Design:
Using the 2006–2018 National Health Interview Survey data, statistical analysis evaluated differences in risk factors among a full sample cohort (aged 18–85 years; n = 131,091) and a “young” subsample cohort (aged 18–59 years; n = 6183) of women.
Methods:
Logistics and unconditional quantile regression models assessed the relationship between stroke and comorbid, demographic, and behavioral characteristics across socioeconomic classes.
Results:
Results suggest that Black women had a 1.415-fold (confidence interval = 1.259, 1.591) higher likelihood of stroke compared with White women after controlling for age, behavior, and comorbidities. Racial disparities were not statistically significant at the higher income ranges for either the full (odds ratio = 1.404, p = 0.3114) or young samples (odds ratio = 1.576, p = 0.7718). However, Blacks had significantly higher odds of stroke in the lower quartiles (lower odds ratio: 1.329, p = 0.0242; lower middle odds ratio: 1.233, p = 0.0486; and upper middle odds ratio: 1.994, p = 0.0005). Disparities were larger among young women (odds ratio = 1.449, confidence interval = 1.211, 1.734).
Conclusion:
While comorbidities were highly associated with stroke prevalence in all socioeconomic cohorts, Blacks only had higher relative odds in the lower income classes. Lack of biological or behavioral explanations for these findings suggests that unobserved or uncontrolled factors such as systemic racism, prejudicial institutions, or differential treatment may contribute to this.
Introduction
Evidence shows that low income, minority race or ethnicity, and female sex increase an individual’s risk of stroke1 –3—the third leading cause of death for women. 4 While the longer life span in women is generally used to explain sex disparities in stroke prevalence, this justification fails to rationalize the higher stroke rates among young women and those from historically oppressed populations in the United States.5 –7 While cardiovascular risk factors are considered to be the major risk factors of stroke, recent evidence suggests that the prevalence of stroke in young women is increasing faster than in men despite lower prevalence of vascular risk factors.8 –10 To date, the causal predictor of stroke disparities among young Black and Hispanic women has been largely inclusive, leaving those factors that underlie this alarming trend still unknown.
Some evidence suggests that greater neighborhood disadvantage could indirectly contribute to the rise in stroke incidence among young women,11 –13 but studies show that neighborhood socioeconomic status (SES) was not able to explain the variation in stroke risk within different racial groups in the United States. 1 Further complicating the unexplained race and sex variations in stroke prevalence, these disparities are not consistent over time. 14 Age-adjusted prevalence of first ischemic stroke is more than twice as high in Black as in White individuals and the Black/White prevalence rate ratio is the highest at midlife and decreases thereafter. 15 Race and sex-stratified analyses suggest that these racial disparities are more pronounced and significant in women. 16 However, age-related stroke research has shown inconsistent results. Smaller cohort studies indicate that a strong and persistent disparity in stroke risk exists across the age spectrum for Black women, but not for White women. 17 The primary nonclinical, nonvascular explanation for this phenomenon is SES, which has shown to be a predictor of stroke severity, mortality, and impact in multinational studies.18,19 There is evidence among high-income and low-income countries showing higher prevalence of stroke and greater stroke mortality among individuals from low compared with high socioeconomic backgrounds.18,20,21 More specifically, individuals from low socioeconomic backgrounds are more likely to exhibit severe post-stroke deficits potentially due to lack of receipt of evidence-based care known to improve stroke outcomes or unobserved differences that emerge during the post-acute community living period.21 –24
Recent findings have shown that between the ages of 45 and 65 years, 25 only half of the racial disparity in stroke risk is attributable to traditional risk (primarily high blood pressure and high cholesterol) and socioeconomic factors, suggesting a critical need to understand and explore more nontraditional risk factors that could contribute to the differential. 2 Given that half of the excess stroke risk in Blacks is not attributable to traditional risk or socioeconomic factors, researchers should explore structural, social, and other nontraditional risk factors to explain this disparate prevalence among young, historically oppressed, low-income women. 3 This study builds upon previous findings by incorporating social, demographic, clinical, lifestyle, and socioeconomic factors into a large, female-focused study evaluating the association with stroke incidence among socioeconomic and age cohorts. Using the income-to-poverty ratio (IPR) to define socioeconomic classes, inter-quantile regression examines factors that contribute to racial differences in stroke prevalence. 26
Materials and methods
Data
Data used in this study were obtained from the 2006 to 2018 National Health Interview Survey (NHIS)—an annual, nationally representative, cross-sectional interview survey of the noninstitutionalized civilian population. Information is collected from a geographically clustered sample of US households concerning the prevalence of illness and disability and services rendered for these conditions. 27 NHIS is conducted by the US Census Bureau and the National Center for Health Statistics to monitor the health of the US population by collecting data on a broad range of health topics, demographic information, and socioeconomic characteristics. 28 The NHIS employs a complex sampling strategy that partitions dwelling units in the target universe into strata and clusters. Therefore, all analyses of these data utilize parameters that account for sample clustering and stratification as well as weights that estimates are unbiased and standard errors are consistent.27,28 Additional information can be found at https://www.cdc.gov/nchs/nhis/methods.htm. NHIS content is updated every 15–20 years, most recently in 2019. Content and structural changes made to NHIS in 2019 created incomparability between survey annum, therefore only data from 2006 to 2018 are included in this study.
Sample
The NHIS sample includes women responding (“yes” or “no”) to the question “Have you EVER been told by a doctor or other health professional that you had . . . A stroke?” In total, 211,309 women were identified and 7105 reported being told by a doctor or health professional that they had a stroke, while 204,204 did not report having a stroke. Copies of the NHIS questionnaires used in each year are available on their website. 29 Since the NHIS does not include information on respondent age at the time of stroke diagnosis, respondent’s age at the time of survey response was used to identify “young” (age < 60) or “old” (age ⩾ 60). Stroke events were assumed to have occurred prior to the time of survey response. Individuals who did not respond to this question or who stated that they did not know were excluded from the study. Binary indicators for being married, having health insurance, and smoking regularly were created. Age, household size, mean hours of sleep, number of days respondents reported consuming alcohol in the past year, and BMI were included as discrete variables. In addition, respondents self-identified their race as White only, Black/African American only, Aleutian Islander/Alaskan native (AIAN) only, Asian only, or multiracial. Due to sample size constraints, AIAN, Asian, and multiracial groups were combined into a single category. Respondents separately classified their ethnicity as either Hispanic origin or ancestry (Hispanic) or non-Hispanic, which was included as a dichotomous variable as was residence in the southern United States.
NHIS collects household income at the time of the survey. To account for differences in price level across time and geographic regions, the income to poverty ratio (IPR)—a calculation based on the published poverty thresholds in the year prior to interview—was used in this analysis. IPR does not require inflationary or price adjustments; reflects the relative social and economic climate in each year and the ability of households to spend within that climate; and serves as an additional indicator of relative economic well-being contextualizing deeper economic conditions. 30 Including IPR in a regression model captures the relationship between the likelihood of stroke and the unconditional mean of IPR. However, estimation at the unconditional mean fails to capture heterogeneity in the likelihood of stroke that may exist across IPR distribution. To account for this potential heterogeneity, we must estimate the relationship at different points along the IPR distribution. There is currently no consensus for the appropriate or meaningful segmentation of the income distribution into classes or groups. 31 Studies have divided income or socioeconomic classes by relative income, median income, and specific percentiles of the income ladder. After an extensive review of various income divisions and segmentation methods, Stephen Rose 32 concluded that over time the portion of the population at various points along the income distribution and the share of income that they controlled were continually shifting. Therefore, any definition too narrow has limited use because it ignores the large inequality between the high and low end of the distribution 33 as well as within individual economic classes.34,35 Therefore, this study follows Rose’s recommendation as well as the structure proposed by Reeves 36 to utilize a four-group segmentation at uniform intervals along the distribution. These four groups—referred to as low, lower middle, upper middle, and upper based on their position along the distribution—partition IPR at 5, 9, and 14. Analysis of these four IPR segments uses the technique developed 37 to estimate the unconditional impact of covariates on stroke prevalence along the unconditional IPR distribution, 38 allowing us to draw conclusions about whether the difference in the relationships between the covariates and stroke is different at various locations along the distribution.39,40
Finally, primary and secondary comorbidities associated with stroke were identified from an extensive review of the current literature.41,42 Those identified conditions that were available in NHIS included hypertension, diabetes, asthma, chronic obstructive pulmonary disease (COPD), heart attack, other heart condition/heart disease, chronic bronchitis, kidney disease, and liver disease. Additional comorbidities, such as atrial fibrillation and arrhythmias, were not available in the NHIS. A count of each respondent’s comorbid conditions was created. While many of these included comorbidities that extend beyond those traditionally associated with stroke, this study utilized a more comprehensive list of primary and secondary conditions due to increasing scientific evidence that multimorbidity was associated with stroke risk and stroke outcomes, particularly among socially disadvantaged groups.43,44
To ensure that these data could provide robust results, the incidence of stroke among young and old women, 1% and 3%, respectively, was used to conduct a post hoc power analyses. Using an alpha of 5% and 80% power, a sample of at least 1536 would be needed to detect a statistically significant difference if one existed. Given that the sample used herein consists of 211,309 individuals, this analysis was assumed to have sufficient power.
STROBE guidelines were followed in the preparation of this article.
Statistical analyses
Empirical specification
To evaluate the relationships between stroke and the covariates outlined above, a logistic regression model was first run on the age inclusive sample, then repeated in the young cohort (age < 60). This model used a binary indicator of stroke diagnosis as the dependent variable and included age, race/ethnicity, education, IPR, BMI, hours of sleep, smoking, alcohol consumption, having health insurance, residence in the South, marital status, household size, and the total number of comorbid conditions as independent variables. Regression models included population weights to reflect the national noninstitutionalized civilian population. SAS software (version 9.4) was used for all analyses. The use of SAS survey procedures accounted for the complex sampling design of the NHIS and allowed for the accurate calculation of variance estimates using defined clustering and stratification parameters. Odds ratios and 95% confidence intervals (CI) were also calculated for each covariate. First, we estimate this logistic specification to determine the relationship between stroke diagnosis and the unconditional population mean IPR. Second, we estimate the relationship between stroke diagnosis at the four quantiles of the income distribution.
Sensitivity analysis
Since comorbidities are associated with other behavioral and lifestyle characteristics included in the regression model, only the total count of comorbid conditions were included in the regression specification rather than each individual condition. Correlation between independent variables in a regression model causes issues of multicollinearity, which reduces the precision of the estimated coefficients, thereby weakening the statistical power of the regression model and leading to unreliable estimates. However, to allow the differential association between individual comorbidities and stroke prevalence to vary, a sensitivity analysis was conducted using each comorbid condition as an individual term in the regression model, in addition to the other demographic and behavioral covariates.
Power analysis
Since the data were previously collected, a post hoc power analysis was conducted to ensure that a sufficient sample existed in the data to detect a statistically significant difference should one exist. Given a 29% prevalence of young Hispanic women and 25% prevalence of young Black women in the sample cohort, a statistically significant difference between these groups could be detected between these groups with an alpha level of 0.05 and a power of 0.8 if 3866 women were in the sample. Therefore, the study sample was deemed to have sufficient power.
Results
Table 1 provides the demographic, lifestyle, and comorbidity sample means for the full sample (211,309) of women (all ages) as well as the young female subsample (142,965). Most women in the full sample cohort reported living in households of two to three people (standard deviation (SD) = 1.47). A total of 40% of women were married and 37% resided in the southern United States; 15% of the sample was Black and 16% reported being of Hispanic descent. Only 15% reported being regular or occasional smokers and sleeping roughly 7 hours per night (SD = 1.44) and consuming alcohol (SD = 25.30) roughly 5 times per year. The mean BMI of the sample was 27.65 (SD = 6.82), which would be considered overweight by BMI standards 45 and the mean number of comorbidities is one (SD = 1.37). Only 3% of the full sample (SD = 0.18) and 1% of the young female sample (SD = 0.12) were diagnosed with stroke.
Demographic, lifestyle, and health-related variable mean values by IPR classification.

IPR: income to poverty ratio; PCT: percent; SD: standard deviation; BMI: body mass index; COPD: chronic obstructive pulmonary disease; NHIS: National Health Interview Survey.
Comorbidities included hypertension, diabetes, asthma, COPD, hyperlipidemia, heart attack, other heart condition/heart disease, chronic bronchitis, kidney disease, and liver disease. Data were weighted to reflect nationally representative population. Analysis accounted stratification and clustering of the NHIS.
Baseline comparisons using chi-square tests (Table 2) indicated significant differences in the stroke diagnosis between IPR quantiles (χ2 = 998.66, p < 0.0001). Figure 1 illustrates stroke prevalence for the full sample as well as the young and aged >60 samples by income group. In each age group, stroke prevalence was higher in the lower IPR classifications. The lower IPR classifications also showed a disproportionate number of individuals living in the southern United States (χ2 = 711.28, p < 0.0001), smoking regularly (χ2 = 3463.72, p < 0.0001), and with higher numbers of comorbidities (F = 721.45, p < 0.0001). Comparisons using ANOVA indicated that stroke survivors from lower IPR subgroups had higher mean BMI compared with the higher quantile (F = 784.2, p < 0.0001). The lower IPR groups also have a higher frequency of alcohol consumption (F = 51.50, p < 0.0001).
Distribution across income groups.

IPR: income to poverty ratio; BMI: body mass index.
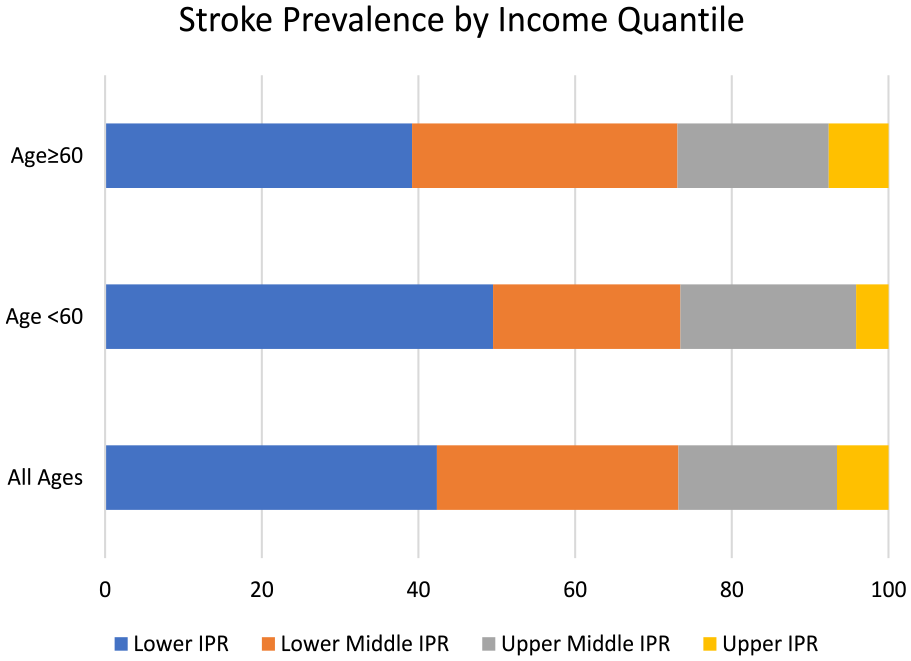
Stroke prevalence among women age ≤60 and >60 by income group.
The robustness of racial and income subgroups was tested among a cohort of “young” women (age < 60 years) as well as the full cohort allowing the relationships between comorbidities, lifestyle habits, and race to vary along the income distribution using both basic logistic and quantile regression.26,46,47 Logistic regression models assessed the contribution of these covariates simultaneously using the full sample of women and a subset of young women aged <60 years. Regression results in Table 3 indicate that higher age (OR = 1.053, CI = 1.049, 1.056), larger household size (OR = 1.048, CI = 1.004, 1.094), residing in the south (OR = 1.208, CI = 1.103, 1.322), and having health insurance (OR = 1.388, CI = 1.097, 1.755) are significantly related to the likelihood of stroke in women. Among young women, IPR is negatively related to stroke diagnosis, suggesting a lower prevalence of stroke at higher IPR (OR = 0.941, CI = 0.93, 0.951). While quite small, the coefficient for year is negative, indicating that between 2006 and 2018 there was a slight decrease in the prevalence of stroke diagnosis among women (OR = 0.961, CI = 0.949, 0.974).
Multinomial logistic regression: prevalence of stroke in women, 2006–2018.

HH: household; BMI: body mass index; AIC: Akaike information criterion.
Bold font indicates significance at the 95% confidence level. Dependent variable: Have you ever been diagnosed with stroke? (1 = Yes, 2 = No).
The comparatively large odds ratios for smoking (OR = 1.471, CI = 1.314, 1.647), comorbidities (OR = 1.523, CI = 1.481, 1.565), and race (Black) (OR = 1.415, CI = 1.259, 1.59) suggest that stroke prevalence is 1.47 times higher among smokers compared with nonsmokers, and 1.41 times higher in Blacks compared with Whites. Similarly, each additional comorbidity increases the relative stroke prevalence by 52.3%, relative to the reference group. For women aged <60 years, relative prevalence of stroke diagnosis is higher among Blacks than Whites (OR = 1.449, CI = 1.211, 1.734), smokers than nonsmokers (OR = 1.331, CI = 1.134, 1.561), and individuals with more comorbidities (OR = 1.642, CI = 1.567, 1.721). Other covariates are similar in both magnitude and direction for both the young subsample and full sample.
IPR-specific regression
To test for differential effects along the income distribution, quantile regression allowed the relationships between covariates and stroke prevalence to vary between high and low subgroups along the income (IPR) distribution. The results are listed in Table 4. Age, race, residence, smoking behavior, and comorbidities continue to be significantly associated with stroke among women in the lower, lower middle, and upper middle IPR quantiles. However, in the upper IPR quantile, racial differences are no longer significant. Age (OR = 1.081, CI = 1.032, 1.132) and comorbidities (OR = 1.511, CI = 1.234, 1.85)—logical biological attenuates to stroke—are the only significant associations among women aged <60 years. In the full sample cohort, southern residence (OR = 1.452, CI = 1.026, 2.053) and IPR (OR = 0.664, CI = 0.514, 0.859) are also positively and negatively associated, respectively.
Multinomial logistic regression: prevalence of stroke in women by IPR classification, 2006–2018.

IPR: income to poverty ratio; HH: household; BMI: body mass index; AIC: Akaike information criterion.
Bold font indicates significance at the 95% confidence level. Dependent variable: Have you ever been diagnosed with stroke? (1 = Yes, 2 = No).
Sensitivity analysis
Results from the full and young cohorts are provided in Appendix 1 Table 5. These results list each comorbidity individually rather than using the total number of comorbidities. The results for both the full and young samples are similar to those discussed above for race, age, residence in the South, and insurance status. As expected, diabetes (OR = 1.386, CI = 1.147, 1.675), high cholesterol (OR = 1.264, CI = 1.036, 1.542), and myocardial infarction (OR = 1.836, CI = 1.417, 2.38) are highly associated with stroke prevalence in both samples. The results for the full and young cohorts disaggregated by IPR are provided in Appendix 1 Table 6. The results mirror the previously discussed findings. Significant racial differences appear in the lower and lower middle IPR cohorts, but not in the upper and upper middle groups.
Discussion
This multiyear, nationally representative analysis of women with stroke yielded two primary findings. First, stroke prevalence and disease comorbidity burden were the greatest among women from the lowest IPR quantile. Second, disaggregation of the sample into IPR quantiles shows a strong racial difference in stroke prevalence among the lower IPR quantiles, but not the upper quantiles. While the factors related to the lowest IPR disparities are outside the scope of this analysis, they were not captured by the clinical or administrative data utilized here. They could reflect differences in lifestyle characteristics related to demographic factors, healthcare utilization patterns, quality of healthcare received, or responses to primary and secondary stroke prevention mechanisms. Similarly, findings may represent external factors such as healthcare providers, healthcare institutions, and other unobserved institutional inequities.
These results align with previous findings showing a higher association between the incidence of stroke risk factors and income, 48 particularly among Blacks and Hispanics. 49 Findings from the full sample cohort and the young sample cohort regression models showed a higher relative likelihood of stroke among women residing in the southern United States 50 —an area known as the “Stroke Belt” or “Stroke Alley.” 51 This region has been recognized by public health authorities for having an unusually high incidence of stroke and other forms of cardiovascular disease compared with the rest of the country. 52
Interestingly, a recent systematic review of SES and stroke prevalence did not find evidence of an association among studies completed in the United States, although differences were observed among studies completed in Sweden and Japan. 1 Those studies completed in the United States only examined the SES associations stratified by sex and/or age, which may have resulted in no observed differences. 21 The findings reported here suggest studies designed to examine the role SES has in stroke-related outcomes, and those also exploring race must carefully consider race stratified by socioeconomic level. Furthermore, these findings highlight a recent call to carefully examine the complexity of factors related to SES that impact the likelihood of stroke and stroke-related outcomes. 53 For example, Lindmark (2021) argues that both mediating and moderating factors affect SES, impacting stroke outcomes. Thus, both types of factors must be considered to understand the heterogeneity and mechanisms that drive sex-related differences. Substantial research will be required to understand these issues further.
Admittedly, this analysis does not capture all possible racial groups or factors related to stroke prevalence. Disparities could result from other measures of healthcare access such as continuity and quality of care and proximity to healthcare providers. However, the findings strongly suggest that studies examining racial disparities must consider issues related to intersectionality, rather than continuing to utilize traditional key outcome variables (sex, race, etc.) which classify individuals into discrete, categorical contributors. Intersectionality considers individuals as a by-product of their life experiences grounded in the sociodemographic backgrounds. 54 Thus, analyses guided by intersectionality frameworks compute effects from simultaneous, multilevel sociodemographic classifications rather than simply the additive effects of each category. Intersectionality considers the impact of multiple social categories based on their lived experiences rather than simply the timepoint related to the health event; in this case experiencing a stroke. 55 Understanding these relationships is critically important to measuring disparities in stroke outcomes across multiple dimensions.56,57 Disparities among low-income Black women are supported by recent findings, suggesting that racial differences in post-stroke disability align with differences in the home/community environment where disability accommodations and support are key to long-term outcomes.56,58
While neither the mean frequency of alcohol consumption nor the mean duration of sleep was statistically significant in the majority of results presented herein, despite their known association with stroke,59,60 studies have shown that these outcomes are often subject to social desirability 61 and recall bias 62 when compared with measured values.
Although the findings are interesting, this study has limitations that should be noted. First, NHIS does not provide age at stroke. Therefore, individuals were classified into old and young age cohorts using their age at the time of the interview. This classification strategy could have potentially misclassified older women who experienced a stroke below the age of 60 years. Second, NHIS neither differentiates between first stroke nor the total number of strokes, the type of stroke, times post-stroke, stroke severity, or the receipt of post-stroke rehabilitation. However, these unobserved factors could potentially confound estimates of functional limitations and other post-stroke outcomes. In addition, NHIS is cross-sectional, which precludes longitudinal assessment of stroke recovery. Third, most of the women in the sample had health insurance, thus the results are not generalizable to an uninsured population. Furthermore, insurance and income are likely not completely independent given that private insurance is often obtained through an employer and qualification for public insurance plans can be income- or employment-based. Therefore, the results should be interpreted with these potential associations in mind. Fourth, all NHIS data is self-reported. Self-reported data is subject to recall, telescoping, social desirability, and selectivity bias. Fifth, as mentioned previously, comorbidities such as atrial fibrillation and arrhythmias were not available in the NHIS, despite their documented association with stroke.63,64 However, a limited number of studies have shown that the likelihood of atrial fibrillation is higher among older, postmenopausal, 65 White 66 women, therefore it is unlikely to have biased racial and ethnic estimates. Finally, the type, quality, and relationship to a primary care caregiver has been shown to impact post-stroke outcomes, disability status, and quality of life. 67 Unfortunately, caregiver information and type are not included in the NHIS.
Conclusion
This study showed that age, comorbidities, race, IPR, and lifestyle (i.e. smoking, alcohol consumption) have been the most significant factors associated with stroke among women in the past decade. Differences in stroke prevalence related to lifestyle, comorbidity, and age characteristics can be explained by the physiological and biological processes of stroke. However, a higher prevalence of stroke among Black women, compared with White women, after controlling for heterogeneity in comorbidities cannot be easily reconciled. 68 When these relationships vary, the results show that racial differences at the upper range of the income distribution can be explained by comorbidities and lifestyle differences, while those at the lower end cannot. The disparities among low-income women could be due to unmeasured or unobserved risk factors or result from other structural or systemic disparities between racial groups. While all studies based on survey data reflect a degree of unobserved heterogeneity, it would be naïve to believe that racial inequities do not exist at the lower end of the IPR spectrum that persist beyond behavioral, physiological, or geographical rationalization. 69
Since these inequities likely result from centuries of slavery, segregation, and contemporary White oppression, which has severely limited the access of many Blacks and people of color to adequate socioeconomic resources, additional research is needed to explore these causal factors. Only through sound, scientific investigation can these inequities be identified and addressed. 54 Since institutional factors for stroke in women transcend geographic, material, physiological, and financial boundaries, they are not easily addressed. Therefore, studies targeting specific changes in healthcare policy and the healthcare environment are essential to helping all women live healthy, stroke-free lives. Furthermore, the impact of these policies and interventions should address differences by race/ethnicity, age, education, and income to adequately engender the types of changes by public health, healthcare, and social service providers capable of decreasing the prevalence and severity of stroke for those who face a disproportionate burden.
Supplemental Material
sj-docx-1-whe-10.1177_17455057231199061 – Supplemental material for Stroke in women between 2006 and 2018: Demographic, socioeconomic, and age disparities
Supplemental material, sj-docx-1-whe-10.1177_17455057231199061 for Stroke in women between 2006 and 2018: Demographic, socioeconomic, and age disparities by Molly M Jacobs and Charles Ellis in Women’s Health
Supplemental Material
sj-docx-2-whe-10.1177_17455057231199061 – Supplemental material for Stroke in women between 2006 and 2018: Demographic, socioeconomic, and age disparities
Supplemental material, sj-docx-2-whe-10.1177_17455057231199061 for Stroke in women between 2006 and 2018: Demographic, socioeconomic, and age disparities by Molly M Jacobs and Charles Ellis in Women’s Health
Footnotes
Appendix 1
Multinomial logistic regression with conditon covariates: prevalence of stroke in women by socioeconomic class 2006–2018.

| All women | Young women | |||||||||
|---|---|---|---|---|---|---|---|---|---|---|
| Estimate | p value | Odds ratio | 95% confidence limits | Estimate | p value | Odds ratio | 95% confidence limits | |||
| Lower | ||||||||||
| Intercept | −1.075 | 0.986 | −72.863 | 0.562 | ||||||
| Age |
|
0.000 | 1.021 | 1.009 | 1.033 | 0.023 | 0.114 | 1.023 | 0.995 | 1.052 |
| HH size | 0.062 | 0.281 | 1.064 | 0.95 | 1.191 | 0.036 | 0.662 | 1.037 | 0.882 | 1.218 |
| Married | 0.059 | 0.509 | 1.125 | 0.793 | 1.596 | 0.249 | 0.074 | 1.644 | 0.952 | 2.838 |
| Year | −0.001 | 0.962 | 0.999 | 0.939 | 1.062 | 0.034 | 0.584 | 1.035 | 0.915 | 1.17 |
| Black |
|
0.032 | 1.172 | 0.854 | 1.608 |
|
0.420 | 1.224 | 0.748 | 2.002 |
| Other race | 0.027 | 0.491 | 1.027 | 0.952 | 1.107 | −0.047 | 0.516 | 0.954 | 0.829 | 1.099 |
| Hispanic | −0.025 | 0.258 | 0.975 | 0.934 | 1.019 | −0.007 | 0.183 | 0.994 | 0.984 | 1.003 |
| South | −0.009 | 0.324 | 0.991 | 0.973 | 1.009 |
|
0.634 | 0.993 | 0.963 | 1.023 |
| Income/poverty | −0.126 | 0.819 | 0.882 | 0.301 | 2.586 |
|
0.462 | 0.601 | 0.155 | 2.333 |
| Smoker | 0.181 | 0.131 | 1.022 | 0.76 | 1.374 | 0.432 | 0.042 | 0.966 | 0.578 | 1.614 |
| Sleep | −0.340 | 0.058 | 0.607 | 0.353 | 1.044 | −0.899 | 0.007 | 0.255 | 0.093 | 0.705 |
| Alcohol | −0.060 | 0.582 | 0.887 | 0.578 | 1.361 | −0.085 | 0.663 | 0.843 | 0.391 | 1.819 |
| BMI |
|
0.006 | 1.429 | 1.106 | 1.847 | 0.262 | 0.043 | 1.69 | 1.017 | 2.807 |
| Insurance | −0.039 | 0.468 | 0.962 | 0.866 | 1.068 | −0.018 | 0.837 | 0.982 | 0.826 | 1.168 |
| Hypertension | 0.358 | 0.152 | 1.431 | 0.876 | 2.335 | 0.318 | 0.509 | 1.375 | 0.534 | 3.542 |
| Diabetes |
|
0.035 | 1.334 | 1.021 | 1.743 | 0.368 | 0.157 | 1.445 | 0.868 | 2.404 |
| High cholesterol | 0.037 | 0.810 | 1.037 | 0.769 | 1.399 | 0.196 | 0.519 | 1.217 | 0.67 | 2.209 |
| Coronary heart disease |
|
0.010 | 1.538 | 1.107 | 2.136 | 0.409 | 0.193 | 1.505 | 0.814 | 2.784 |
| Myocardial infarction |
|
<0.0001 | 1.99 | 1.443 | 2.745 | 1.083 | <0.0001 | 2.953 | 1.729 | 5.042 |
| Heart condition/disease | 0.159 | 0.278 | 1.172 | 0.879 | 1.563 | −0.098 | 0.727 | 0.907 | 0.523 | 1.571 |
| Asthma |
|
0.010 | 1.447 | 1.095 | 1.913 | 0.517 | 0.041 | 1.677 | 1.021 | 2.754 |
| Chronic bronchitis |
|
0.017 | 1.496 | 1.076 | 2.08 | 0.429 | 0.143 | 1.535 | 0.865 | 2.724 |
| Kidney disease |
|
<0.0001 | 2.259 | 1.586 | 3.22 | 0.867 | 0.004 | 2.38 | 1.312 | 4.316 |
| Liver disease | −0.315 | 0.239 | 0.73 | 0.432 | 1.234 | −0.553 | 0.246 | 0.575 | 0.226 | 1.465 |
| N | 3675 | 1535 | ||||||||
| AIC | 13,812,982 | 5,329,142 | ||||||||
| Likelihood ratio | 11 | 5 | ||||||||
| Lower middle | ||||||||||
| Intercept |
|
0.043 | −241.900 | 0.207 | ||||||
| Age |
|
<0.0001 | 1.043 | 1.027 | 1.058 |
|
0.025 | 1.047 | 1.006 | 1.09 |
| HH size | 0.141 | 0.073 | 1.152 | 0.987 | 1.343 | −0.079 | 0.689 | 0.924 | 0.628 | 1.36 |
| Married | −0.155 | 0.057 | 0.733 | 0.532 | 1.01 | 0.092 | 0.674 | 1.202 | 0.509 | 2.839 |
| Year | 0.067 | 0.054 | 1.069 | 0.999 | 1.143 | 0.118 | 0.216 | 1.125 | 0.933 | 1.357 |
| Black |
|
0.043 | 1.505 | 1.014 | 2.235 |
|
0.853 | 0.907 | 0.323 | 2.544 |
| Other race | 0.064 | 0.183 | 1.066 | 0.97 | 1.172 | −0.226 | 0.313 | 0.798 | 0.515 | 1.237 |
| Hispanic | −0.020 | 0.308 | 0.98 | 0.943 | 1.019 | −0.021 | 0.469 | 0.98 | 0.926 | 1.036 |
| South | 0.003 | 0.772 | 1.003 | 0.983 | 1.023 | −0.013 | 0.613 | 0.987 | 0.94 | 1.037 |
| Income/poverty | −0.335 | 0.519 | 0.716 | 0.259 | 1.98 | 1.321 | 0.211 | 3.746 | 0.472 | 29.714 |
| Smoker | −0.060 | 0.721 | 0.958 | 0.632 | 1.454 |
|
0.132 | 0.419 | 0.12 | 1.462 |
| Sleep | 0.078 | 0.730 | 1.1 | 0.57 | 2.121 | 0.515 | 0.296 | 1.401 | 0.35 | 5.614 |
| Alcohol | −0.066 | 0.669 | 0.877 | 0.48 | 1.602 | −0.154 | 0.525 | 0.736 | 0.286 | 1.894 |
| BMI | 0.114 | 0.106 | 1.255 | 0.953 | 1.653 | 0.049 | 0.789 | 1.102 | 0.542 | 2.239 |
| Insurance | 0.003 | 0.958 | 1.003 | 0.899 | 1.119 | −0.016 | 0.894 | 0.984 | 0.776 | 1.248 |
| Hypertension | −0.283 | 0.199 | 0.753 | 0.489 | 1.161 | −0.652 | 0.199 | 0.521 | 0.193 | 1.41 |
| Diabetes | 0.115 | 0.475 | 1.122 | 0.818 | 1.538 | −0.005 | 0.991 | 0.995 | 0.446 | 2.219 |
| High cholesterol |
|
0.011 | 1.568 | 1.107 | 2.221 | −0.058 | 0.890 | 0.944 | 0.413 | 2.155 |
| Coronary heart disease |
|
0.001 | 1.93 | 1.305 | 2.853 | −0.857 | 0.252 | 0.425 | 0.098 | 1.842 |
| Myocardial infarction | 0.444 | 0.057 | 1.559 | 0.987 | 2.464 | 2.004 | 0.002 | 7.416 | 2.049 | 26.835 |
| Heart condition/disease | 0.271 | 0.095 | 1.311 | 0.954 | 1.802 | −0.344 | 0.537 | 0.709 | 0.238 | 2.116 |
| Asthma | 0.153 | 0.457 | 1.165 | 0.778 | 1.746 | −0.350 | 0.488 | 0.705 | 0.262 | 1.893 |
| Chronic bronchitis | 0.118 | 0.627 | 1.125 | 0.699 | 1.809 | −0.462 | 0.382 | 0.63 | 0.223 | 1.775 |
| Kidney disease | 0.459 | 0.100 | 1.582 | 0.916 | 2.734 | 1.214 | 0.070 | 3.368 | 0.906 | 12.523 |
| Liver disease |
|
0.013 | 2.419 | 1.207 | 4.849 | 1.936 | 0.001 | 6.932 | 2.215 | 21.694 |
| N | 4456 | 1418 | ||||||||
| AIC | 15,247,995 | 3,510,065 | ||||||||
| Likelihood ratio | 11 | 4 | ||||||||
| Upper middle | ||||||||||
| Intercept | −32.053 | 0.741 | 469.100 | 0.065 | ||||||
| Age |
|
<0.0001 | 1.05 | 1.031 | 1.07 | 0.043 | 0.175 | 1.044 | 0.981 | 1.112 |
| HH size | −0.054 | 0.593 | 0.948 | 0.779 | 1.154 | −0.413 | 0.080 | 0.662 | 0.417 | 1.05 |
| Married | 0.023 | 0.821 | 1.047 | 0.704 | 1.555 | 0.167 | 0.490 | 1.397 | 0.54 | 3.613 |
| Year | 0.013 | 0.786 | 1.013 | 0.922 | 1.114 |
|
0.062 | 0.79 | 0.616 | 1.012 |
| Black | 0.214 | 0.403 | 1.238 | 0.75 | 2.043 | −0.396 | 0.467 | 0.673 | 0.232 | 1.956 |
| Other race | 0.100 | 0.066 | 1.105 | 0.993 | 1.23 | −0.037 | 0.782 | 0.964 | 0.742 | 1.252 |
| Hispanic | −0.003 | 0.406 | 0.997 | 0.991 | 1.004 | −0.069 | 0.241 | 0.933 | 0.831 | 1.048 |
| South | −0.002 | 0.893 | 0.998 | 0.963 | 1.034 | 0.001 | 0.987 | 1.001 | 0.94 | 1.065 |
| Income/poverty | −0.860 | 0.188 | 0.423 | 0.117 | 1.526 | −0.697 | 0.434 | 0.498 | 0.087 | 2.862 |
| Smoker |
|
0.008 | 2.338 | 1.339 | 4.081 | 0.808 | 0.048 | 2.264 | 0.867 | 5.911 |
| Sleep | −0.306 | 0.273 | 0.967 | 0.426 | 2.192 | −0.799 | 0.148 | 0.454 | 0.093 | 2.204 |
| Alcohol | 0.107 | 0.542 | 1.239 | 0.622 | 2.469 | 0.099 | 0.768 | 1.22 | 0.325 | 4.577 |
| BMI | 0.022 | 0.811 | 1.045 | 0.727 | 1.503 | 0.271 | 0.205 | 1.718 | 0.744 | 3.971 |
| Insurance | −0.046 | 0.539 | 0.955 | 0.825 | 1.106 | 0.048 | 0.798 | 1.049 | 0.727 | 1.513 |
| Hypertension | 0.102 | 0.725 | 1.108 | 0.627 | 1.956 | 1.472 | 0.024 | 4.356 | 1.212 | 15.657 |
| Diabetes | 0.453 | 0.056 | 1.573 | 0.988 | 2.502 | 0.425 | 0.371 | 1.529 | 0.603 | 3.88 |
| High cholesterol | 0.314 | 0.133 | 1.368 | 0.908 | 2.061 | 0.687 | 0.149 | 1.987 | 0.782 | 5.046 |
| Coronary heart disease | 0.341 | 0.219 | 1.406 | 0.817 | 2.42 | 0.277 | 0.742 | 1.32 | 0.253 | 6.873 |
| Myocardial infarction |
|
0.002 | 2.701 | 1.427 | 5.112 | 1.853 | 0.021 | 6.377 | 1.32 | 30.807 |
| Heart condition/disease | 0.180 | 0.430 | 1.197 | 0.766 | 1.871 | −0.837 | 0.241 | 0.433 | 0.107 | 1.754 |
| Asthma | 0.160 | 0.500 | 1.174 | 0.737 | 1.87 | 0.695 | 0.090 | 2.003 | 0.898 | 4.47 |
| Chronic bronchitis | 0.394 | 0.165 | 1.483 | 0.85 | 2.589 | 0.071 | 0.897 | 1.074 | 0.365 | 3.159 |
| Kidney disease |
|
0.001 | 2.879 | 1.515 | 5.472 | 1.359 | 0.035 | 3.892 | 1.104 | 13.716 |
| Liver disease | −0.254 | 0.654 | 0.776 | 0.255 | 2.357 | 0.667 | 0.526 | 1.949 | 0.248 | 15.326 |
| N | 4767 | 1897 | ||||||||
| AIC | 12,547,435 | 3,157,831 | ||||||||
| Likelihood ratio | 8 | 3 | ||||||||
| Upper | ||||||||||
| Intercept | −230.600 | 0.170 | −4432.500 | 0.291 | ||||||
| Age |
|
0.010 | 1.035 | 1.008 | 1.062 | 2.993 | 0.371 | 19.937 | 0.028 | 19.98 |
| HH size | −0.114 | 0.480 | 0.892 | 0.649 | 1.225 | 7.549 | 0.363 | 0.986 | 0.853 | 1.141 |
| Married | −0.141 | 0.421 | 0.754 | 0.379 | 1.501 |
|
0.039 | 0.004 | 0.001 | 0.749 |
| Year | 0.114 | 0.176 | 1.12 | 0.95 | 1.322 | 2.243 | 0.297 | 9.42 | 0.137 | 645.56 |
| Black | 0.030 | 0.960 | 1.031 | 0.321 | 3.31 | −0.897 | 0.802 | 0.408 | 0.002 | 460.22 |
| Other race | 0.071 | 0.460 | 1.074 | 0.888 | 1.299 | −1.969 | 0.578 | 0.14 | 0.008 | 147.91 |
| Hispanic | −0.001 | 0.795 | 0.999 | 0.989 | 1.009 | −0.321 | 0.498 | 0.725 | 0.286 | 1.842 |
| South | −0.024 | 0.357 | 0.977 | 0.928 | 1.027 | 0.233 | 0.348 | 1.263 | 0.775 | 2.056 |
| Income/poverty | 1.581 | 0.199 | 4.858 | 0.435 | 54.252 | −31.064 | 0.359 | 0.893 | 0.854 | 0.933 |
| Smoker | 0.342 | 0.350 | 1.2 | 0.513 | 2.803 | 27.482 | 0.325 | 1.079 | 0.726 | 1.603 |
| Sleep | −0.501 | 0.354 | 0.516 | 0.104 | 2.555 | −25.986 | 0.316 | 0.934 | 0.815 | 1.07 |
| Alcohol | −0.005 | 0.985 | 0.989 | 0.325 | 3.01 | −22.735 | 0.336 | 0.99 | 0.976 | 1.004 |
| BMI | 0.272 | 0.093 | 1.722 | 0.912 | 3.25 | −11.667 | 0.273 | 0.999 | 0.974 | 1.025 |
| Insurance | −0.321 | 0.195 | 0.725 | 0.446 | 1.18 | −17.533 | 0.404 | 0.711 | 0.263 | 1.918 |
| Hypertension | 0.276 | 0.511 | 1.317 | 0.578 | 3.004 |
|
0.026 | 1.259 | 0.68 | 2.332 |
| Diabetes |
|
0.002 | 2.833 | 1.477 | 5.434 |
|
0.025 | 1.449 | 0.974 | 2.156 |
| High cholesterol | −0.186 | 0.608 | 0.83 | 0.407 | 1.694 | −0.544 | 0.929 | 1.251 | 0.829 | 1.89 |
| Coronary heart disease | 0.788 | 0.132 | 2.199 | 0.787 | 6.146 | −52.751 | 0.419 | 1.098 | 0.64 | 1.884 |
| Myocardial infarction | −0.010 | 0.986 | 0.99 | 0.316 | 3.1 | 46.178 | 0.419 | 3.671 | 2.204 | 6.117 |
| Heart condition/disease | 0.419 | 0.233 | 1.521 | 0.763 | 3.031 | 11.192 | 0.463 | 0.762 | 0.482 | 1.202 |
| Asthma | 0.279 | 0.517 | 1.322 | 0.567 | 3.079 | −18.116 | 0.377 | 1.392 | 0.951 | 2.037 |
| Chronic bronchitis | −0.253 | 0.737 | 0.776 | 0.177 | 3.409 | 2.768 | 0.098 | 15.918 | 0.595 | 425.626 |
| Kidney disease | −0.230 | 0.709 | 0.795 | 0.237 | 2.663 | 21.265 | 0.599 | 6.095 | 0.001 | 9.781 |
| Liver disease | −0.927 | 0.104 | 0.396 | 0.129 | 1.21 | −8.941 | 0.150 | 0.012 | 0.021 | 25.646 |
| N | 1013 | 253 | ||||||||
| AIC | 3,748,356 | 430,988 | ||||||||
| Likelihood ratio | 3 | 2 | ||||||||
HH: household; BMI: body mass index; AIC: Akaike information criterion.
Bold font indicates significance at the 95% confidence level. Dependent variable: Have you ever been diagnosed with stroke? (1 = Yes, 2 = No).
Acknowledgements
None.
Declarations
Supplemental material
Supplemental material for this article is available online.
References
Supplementary Material
Please find the following supplemental material available below.
For Open Access articles published under a Creative Commons License, all supplemental material carries the same license as the article it is associated with.
For non-Open Access articles published, all supplemental material carries a non-exclusive license, and permission requests for re-use of supplemental material or any part of supplemental material shall be sent directly to the copyright owner as specified in the copyright notice associated with the article.