
Abstract
This study compares the transition from education to work for Norwegian graduates with a professional STEM master’s degree to that of their peers with a non-professional STEM master’s degree. We find that professional STEM graduates tend to have better labour market outcomes than other STEM graduates. However, the unemployment rate of professional STEM graduates is more sensitive to business cycle fluctuations. The findings suggest that a professional STEM degree does not protect against unemployment, in contrast to findings from studies of other professional degrees.
Introduction
Competence in science, technology, engineering and maths (STEM) is considered crucial for economic development and international competitiveness, and there is a growing concern regarding a shortage of STEM workers (e.g. Rothwell, 2014). However, despite the conjectured demand, many STEM-educated graduates are not employed in STEM occupations (Xue and Larson, 2015; Smith and White, 2019). These findings indicate a mismatch between education and work.
The number of STEM graduates has increased drastically in the last 15 years. In OECD countries, graduates in the STEM fields now account for more than a quarter of all tertiary-educated (OECD, 2017a). In Norway, the number of master’s graduates within this educational field more than doubled from 2003 to 2018 (SSB, 2018). Some scholars question whether a point of saturation has been reached, creating a mismatch between labour supply and labour demand.
Although degrees within the STEM field share many traits, there are also substantial differences. One possible explanation for the mismatch between demand and supply is that different STEM degrees may have different values for employers, leading to a STEM shortage for some job categories and degree levels and a surplus for others (Machin and McNally, 2007; Xue and Larson, 2015). It is thus critical to gain more insights into the causes of mismatches among STEM graduates (Bender and Heywood, 2011).
One key factor that separates STEM degrees is the division between professional and non-professional programmes. Some STEM master’s programmes meet the requirements for being considered a professional degree (Mastekaasa, 2008). Professional degrees differ from other master’s degrees by training students to solve specific work tasks and providing more job-specific skills. Professional degrees provide a defined job title, making it easier to identify relevant job openings (Drange, 2016).
The difference in nature between professional and non-professional STEM degrees could imply different transition patterns from education to work. On the one hand, job-specific competence may make professional degrees more attractive in the labour market if there is a strong correspondence between the curriculum and the jobs for which the education qualifies. On the other hand, high job specificity may indicate a narrower labour market, resulting in higher sensitivity to the demand for specific jobs compared to graduates with non-professional STEM degrees. This could imply that graduates from professional STEM degrees are more vulnerable to cyclic fluctuation than graduates from other STEM degrees.
Mismatch between education and work is undesirable due to potential economic losses and negative consequences for the individual, such as job turnover (Allen and Van der Velden, 2001; Wolbers, 2013) and lower job satisfaction (Belfield and Harris, 2002; Bender and Heywood, 2006). Moreover, mismatch could be even more detrimental for STEM graduates than for graduates from other fields due to the more rapid depreciation of technical skills, resulting in a higher cost of remaining relevant and a higher mismatch later in the career (Bender and Heywood, 2011). Given that the proper allocation of skills in the labour market is in the best interest of society, an important question to be raised is how prevalent mismatches are within the STEM fields and which factors influence mismatches.
In this paper, we examine variations in the labour market mismatch among professional and non-professional Norwegian STEM graduates. We compare the incidence of unemployment, overeducation and horizontal mismatch using a repeated cross-section of biennial master’s graduate surveys investigating their situation about six months past graduation. The surveys were conducted between 2005 and 2019. We expect that holding a professional STEM degree is associated with better labour market outcomes but that this advantage is reduced during times of recession. This study contributes significantly to the literature, as previous studies of STEM graduates rarely take into account cyclic variations (Humburg et al., 2017), and few, if any, compare STEM programmes that differ along the professional dimension (Barone and Oritz, 2011; Verhaest and Van der Velden, 2013).
Theoretical Considerations and Previous Research
Higher education is expected to enable graduates to gain initial employment, maintain it and obtain new employment if desired (Hillage and Pollard, 1998; OECD, 2017). The return to higher education may manifest in the chance of employment (Iyigun and Owen, 1999) and higher wages (e.g. Card, 1999).
Differences in success in transitioning to the labour market across graduates of different programmes may have multiple explanations. Human capital theory (Becker, 1993) ascribes differences in outcomes to differences in the attractiveness of the competencies acquired through education. Scholars such as Reimer et al. (2008) postulate that employers prefer graduates from fields where the education content is occupation-specific. The argument is that a matching occupation-specific degree ensures the necessary skills to solve the work task and consequently may reduce employers’ training costs (Van der Velden and Wolbers, 2007). Empirical evidence supports this claim by finding that occupation-specific competencies provide graduates with a comparative advantage in their own fields and increase the probability of having a job within the study programme’s professional domain (Heijke and Meng, 2006).
Other scholars argue that generic competencies are vital to making graduates employable, as they enable them to adapt more quickly to new circumstances and rapid changes in modern work life (Heijke and Meng, 2006; Muhamad, 2012). Furthermore, generic competencies are argued to provide a solid basis for further learning and are considered transferable between different kinds of occupations and educational domains (Heijke et al., 2003).
Signalling and screening models attribute differences in labour market outcomes across graduates to the signalling value that education provides about pre-existing productivity traits (Arrow 1973; Spence 1973). In other words, these models postulate that a higher education diploma is a mere signal of general abilities and a willingness to learn, which employers can use as a selection criterion (Garcia-Aracil et al., 2004). From this perspective, recruitment of graduates’ is not contingent on the (expected) skills acquired through education.
Research on STEM graduates’ transition to the labour market indicates that graduates from technical fields, together with graduates from the education field, have the best labour market outcome in terms of unemployment and occupational status (Reimer et al., 2008). Similarly, Norwegian graduate surveys have found that master’s graduates with a professional degree have a better transition to the labour market than other degrees (e.g. Arnesen et al., 2012; Støren et al., 2014). Moreover, Norwegian employers report a higher need for professional STEM graduates than non-professional STEM graduates (Rørstad et al., 2018; Støren et al., 2019). These findings are in accordance with a human capital argument stating that employers prefer occupation-specific degrees, as these ensure the relevant skills to solve work tasks. Employers’ preference for graduates from professional STEM programmes could also be explained by the signalling model. In Norway, professional STEM programmes have high admission requirements and are viewed as elite education (Askvik, 2015). Graduating from a professional STEM programme could therefore be a signal to the employer that graduates occupy pre-existing attributes that are valuable for productivity.
By contrast, other studies have found that generic skills are seen as crucial competencies in the modern labour market. The Norwegian employer survey reports that generic skills, such as the ability to work independently, cooperate and acquire new knowledge, are highly valued in recruiting master’s degree graduates (Støren et al., 2019). Similar results have been found in the United Kingdom (Harvey et al., 1997).
Regarding the association between graduates’ skills and labour market outcomes, Humburg et al. (2017) found that occupying generic skills (the authors used the term academic, transferable skills) protected against overeducation when there was an excess supply in the general labour market. Occupation-specific skills (the authors use the term field-specific skills), by contrast, protected against overeducation and unemployment when there was an excess supply in the field-specific labour market. According to these results, generic skills are preferred over occupation-specific skills in the general labour market, because these jobs require graduates with transferable skills.
Whether a STEM master’s education can be categorised as generating mostly professional skills could therefore have implications for graduates’ level of match between education and work and unemployment. Based on the arguments above, there is reason to believe that professional STEM master’s graduates are preferred by employers, both from a human capital perspective and from a signalling perspective. According to the human capital perspective, the advantage of a professional degree, and the associated focus on occupation-specific skills could be less pronounced during economic downturns. The signalling perspective, however, does not necessarily predict a relationship between the advantage of professional STEMs and business cycle fluctuations.
Professional STEM degrees
Different fields of education aim to prepare students for (more or less) specific education (Holland, 1985). Although educations within STEM share many common traits, professional STEM degrees are distinct from other STEM degrees. Some STEM degrees, particularly degrees within technology and engineering, are considered professional degrees by Norwegian researchers (Mastekaasa 2008; Tufte 2013), reflecting that these programmes strongly emphasise occupation-specific competencies (Smeby and Mausethagen 2017). For professional STEM degrees, the study programme strongly indicates graduates’ productivity and trainability (Van de Werfhorst, 2004).
In Norway, the term graduate engineer (‘sivilingeniør’) is a protected title reserved for those with a professional STEM master’s degree. A similar title is also used in Denmark, Sweden and Germany. Although no legal requirements exist that require graduate engineers for particular jobs, the existence of a protected title may create a closed market for graduate engineers, resulting in credentialist hiring (Bills & Brown, 2011). Other STEM degrees are non-professional, as they do not lead to a protected title and are less applied (Drange, 2016). The Eurograduate pilot survey revealed that graduates from the natural science field reported having higher problem-solving skills levels than graduates from other disciplines (European Commission, 2020), supporting the notion that these degrees are more generic.
Signalling value of STEM degrees and other traits
Previous studies have suggested that multiple characteristics may influence both field choice and labour market outcomes. Different education programmes might attract different students, and labour market prospects may vary across student pools. In Norway, admission to professional STEM master’s degrees is highly competitive, resulting in high intake grades. Completing such education may thus be recognised as a signal of graduates’ capacities and abilities (Drange, 2016).
The signalling value of grades from higher education may also be field-specific. Research suggests that, in Norway, the reward for high grades is highest in the hard applied disciplines found within the private sector that are preoccupied with non-welfare tasks (Røberg and Helland, 2017). Given that professional STEM graduates cater more to the private sector than other STEM graduates in Norway (Arnesen et al., 2015), grades may matter more for this group.
A higher education certificate may not be the only characteristic on which employers screen. Employers may rely on other distinct indicators of potential job performance, such as social background (Brown, 1995; Jackson, 2001), (relevant) work experience (Allen et al., 2009; Klein and Weiss, 2011; Weiss et al., 2014), grades and immigration status. Studies of highly educated, non-Western immigrants have shown a higher risk of unemployment and job mismatch (Støren and Wiers-Jenssen, 2010; Villund, 2008). Immigrants are underrepresented in professional STEM, which may contribute to differences in labour market outcomes (Drange, 2016). This suggests that it is important to control for other characteristics when comparing the outcomes of professional and non-professional STEM degrees.
Hypotheses
The existing literature suggests that a stronger connection between education and work in professional STEM degrees may result in professional STEM graduates being more attractive in the labour market, leading to lower unemployment. Moreover, because a professional STEM master’s degree leads to a protected title, they may experience less overeducation, as graduates holding positions that require their specific degree will know that their level of education is required for their job. Furthermore, because graduates are prepared for specific occupations by professional STEM degrees, they may experience a strong connection between education and work, being less prone to experiencing a horizontal mismatch. Given that admission to a professional STEM degree is highly competitive, signalling theory also predicts a positive signalling value of the professional STEM degree. Both human capital and the signalling perspective thus support the following hypothesis:
General macroeconomic conditions influence both unemployment rates and job mismatch (Rubb, 2014), and the advantage of a professional STEM degree may weaken in downturns. Being trained to perform specific tasks may not be unambiguously positive. This may render professional STEM graduates less able to adapt and make it more difficult to find a job in a rapidly changing labour market. Furthermore, it may create a narrower understanding of the type of work suited to their degree. In times of low demand for their specific skills, professional STEM graduates may experience more discrepancies between the jobs they are trained for and the jobs they obtain. Moreover, if fewer positions are listed that require their specific degree, professional STEM graduates may experience more overeducation. Thus, our second hypothesis is:
The Norwegian Context
Except for a large private business school, Norwegian higher education institutions are predominately state-owned (Ahola et al., 2014) with free tuition. Furthermore, the Norwegian State Educational Loan Fund provides universal monetary support to all students, ensuring broad access to higher education. Moreover, the Norwegian higher education system is without an upper tier of elite institutions that drive academically gifted or wealthy students away from middle- and lower-tier institutions. Institutional characteristics may thus play a less critical role in the labour market transition of Norwegian graduates than for graduates in countries where the institutions matter more, such as the US, the UK and Germany.
The Norwegian higher education system has traditionally been described as a dual system consisting of universities and university colleges, representing a division of responsibilities. Historically, universities mainly provided longer professional education (in areas such as medicine and law) and liberal education at the bachelor’s and master’s levels. The university colleges mainly offered shorter professional diplomas, such as degrees in nursing and business administration (Sandsør et al., 2022). However, this division became blurred in the 2000s, as multiple university colleges gained university status. The primary provider of STEM master’s degrees in Norway is a result of a merger between a distinguished specialised university in technology and a university offering programmes in natural science, medicine, humanities and social sciences.
Similar to other European countries, Norway has a bachelor’s, master’s and PhD structure with a 3+2+3-degree system. Some professional STEM degrees are five-year consecutive master’s degree programmes; however, the qualifications gained after the five-year master’s programme are similar to those gained by a three-year bachelor’s and a two-year master’s programme. 1 Although some programmes are considered professional degrees designed to develop job-oriented skills in specific subjects, Norway has a less vocationally oriented higher education system than many other countries (Van der Werfhorst, 2004).
Norway has a social democratic welfare system, resulting in a large public sector and strong labour unions (Van der Werfhorst, 2004). Despite the rapid growth in the supply of higher education graduates, unemployment rates for graduates in the period under study have been low and lower than in many other countries. The period we studied captures multiple fluctuations in the labour market. The lowest observed unemployment rate for the general public was 1.6 percent (November 2008), while the unemployment rate was 2.5 percent during the global financial crisis (November 2009) and 2.7 percent during the oil bust (November 2015). 2 However, the impact of the financial crisis was much smaller in Norway than in many other countries.
Data and Methods
The Norwegian graduate survey
This study analysed eight cross-sectional graduate surveys conducted biennially 3 between 2005 and 2019 by the Nordic Institute for Studies in Innovation, Research and Education (NIFU). The survey covers master’s degree graduates (ISCED level 7) from Norwegian higher education institutions. Each survey was conducted about six months after graduation of the relevant cohort; thus, we studied master’s graduates at the very beginning of their careers. Graduates from every public, and most of the private, Norwegian higher education institutions who lived in Norway at the time of the survey were invited to participate.
More than 21,000 master’s degree graduates responded to the survey, and the response rates for the surveys ranged between 40 and 60 percent. The early surveys were purely pen-and-pencil surveys, while the latest survey was entirely online. The survey followed a similar contact structure across the years: one invitation and three reminders, all distributed by NIFU. The second reminder was by postal mail during the entire period. The surveys were open for about two months.
Since 2013, the surveys have been conducted as population surveys, meaning that all graduates were invited to participate. Prior to 2013, a sample was drawn from fields with a high number of graduates due to the cost of conducting pen-and-paper surveys. Within the STEM field, a sample was drawn from the narrow fields of biology, physics, and chemistry; electronics, mechanics and machine engineering, and construction. Sampling weights were constructed based on the number of individuals in the population of the narrow field and the number of invited individuals.
Sample
This study includes only STEM graduates. Identification was based on the Norwegian Standard Classification of Education (NUS2000). STEM graduates belong to the broad educational field of ‘natural sciences, vocational and technical subjects’. 3 Professional degrees were separated from the other STEM degrees based on Statistics Norway’s classification variable ‘university and university college group’ (UH-gruppe). Professional STEM degrees were classified as ‘55M Master in technological subjects’. This classification is distinct from classifications of broad and narrow fields of study, as only STEM master’s degrees that meet the requirements to award the ‘graduate engineer’ title is given this code.
The dataset contained 6110 observations of STEM master’s graduates between 2005 and 2019. After excluding respondents who had missing information on one of the control variables (see Section 5.4), the sample contained 5356 observations. Furthermore, we excluded graduates outside the labour force, that is, graduates who are neither employed nor actively seeking employment, as graduates outside the labour force are not relevant to the computation of our outcome measures. Lastly, we excluded people who had missing information on overeducation and horizontal mismatch. The complete case sample consisted of 5021 STEM graduates, of whom 2041 had a professional degree.
Distribution of characteristics across professional STEM graduates and other STEM graduates.
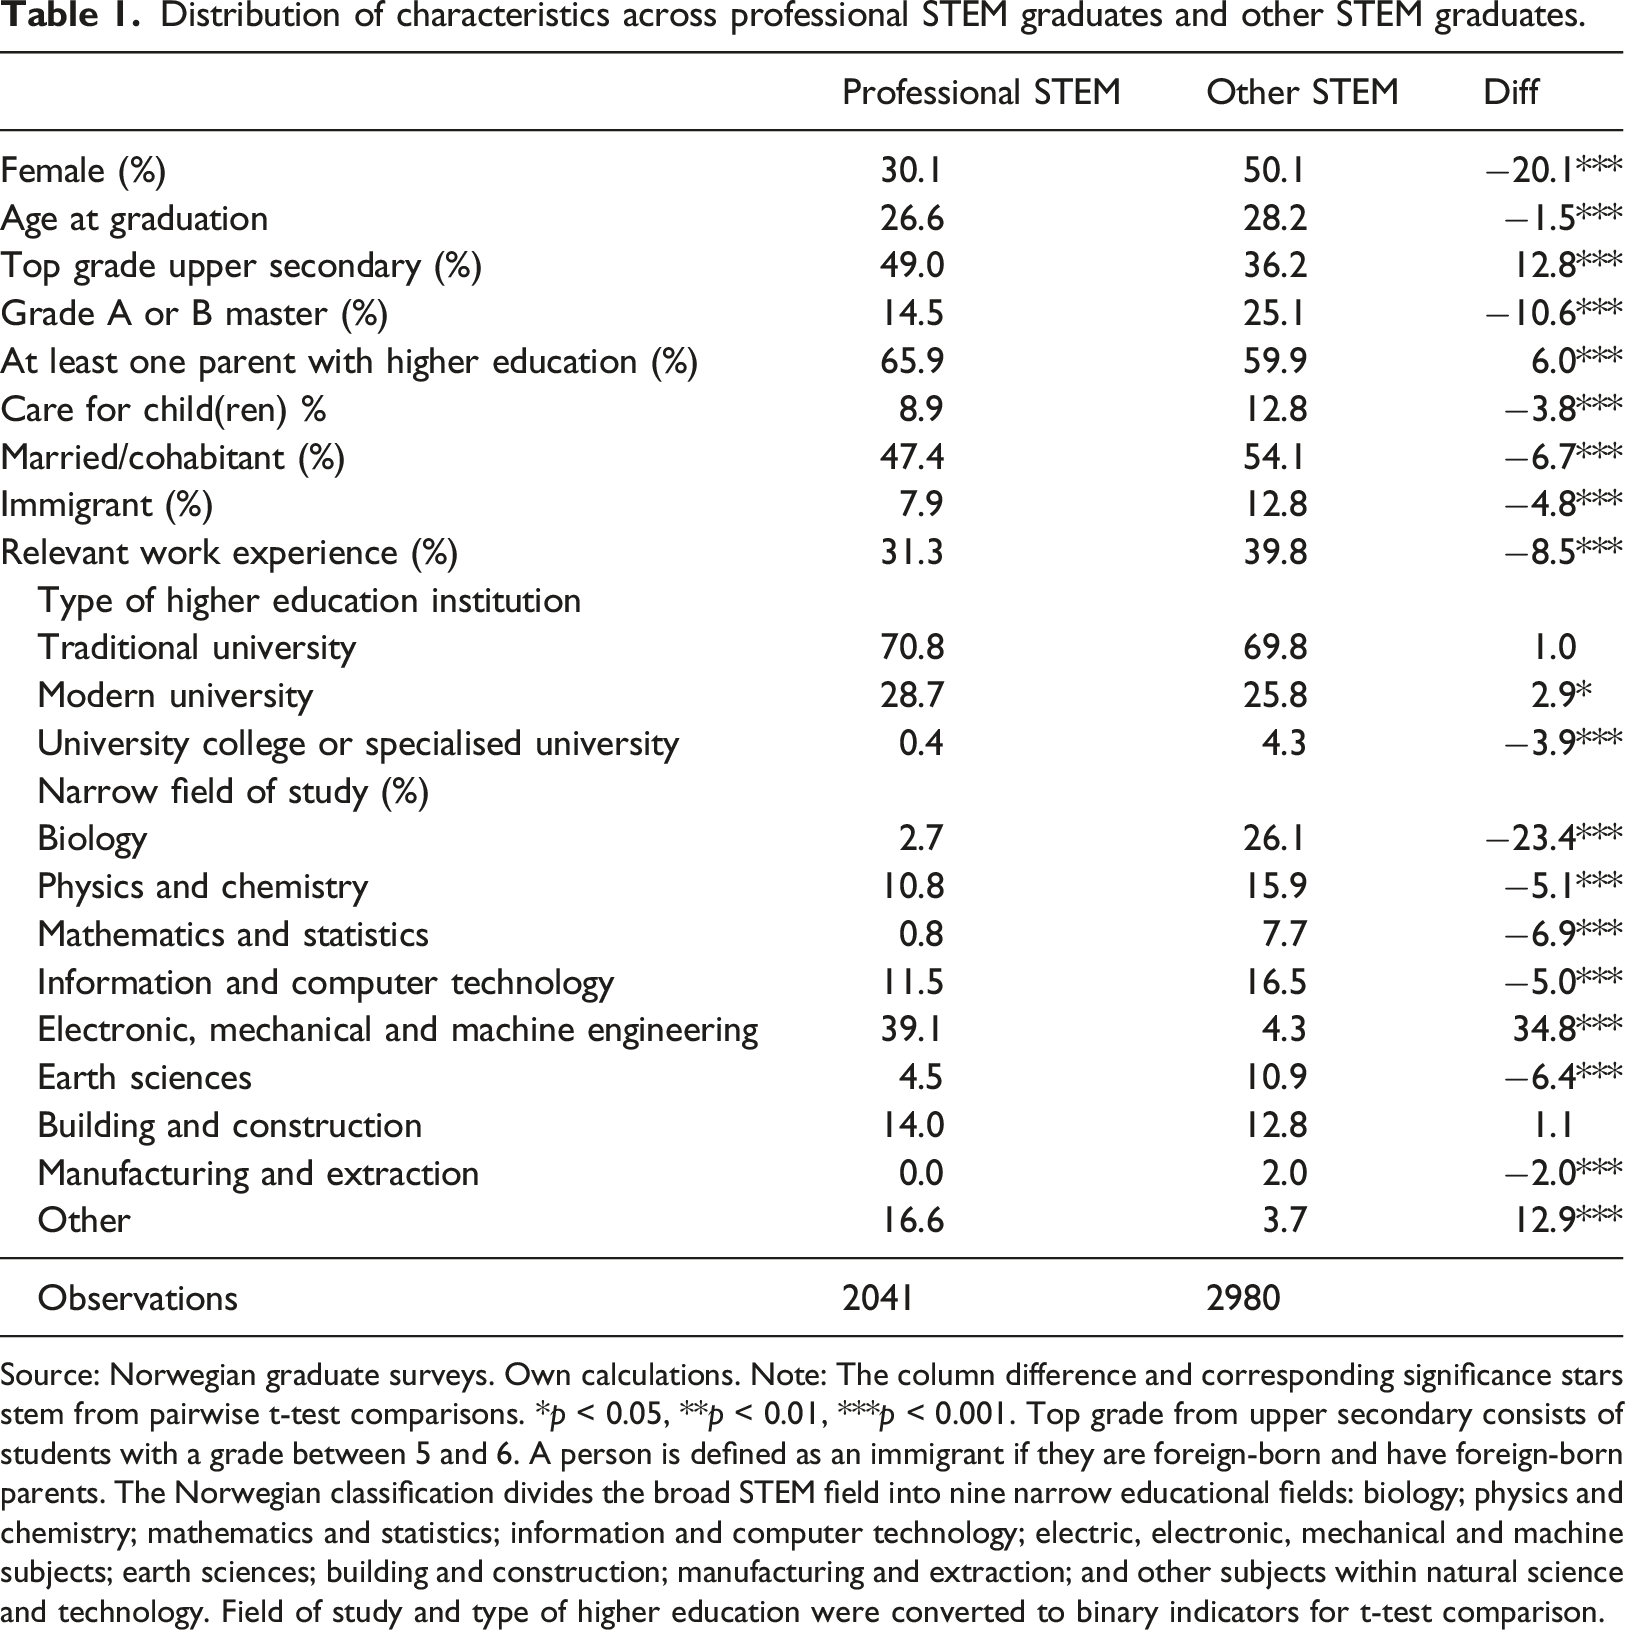
Source: Norwegian graduate surveys. Own calculations. Note: The column difference and corresponding significance stars stem from pairwise t-test comparisons. *p < 0.05, **p < 0.01, ***p < 0.001. Top grade from upper secondary consists of students with a grade between 5 and 6. A person is defined as an immigrant if they are foreign-born and have foreign-born parents. The Norwegian classification divides the broad STEM field into nine narrow educational fields: biology; physics and chemistry; mathematics and statistics; information and computer technology; electric, electronic, mechanical and machine subjects; earth sciences; building and construction; manufacturing and extraction; and other subjects within natural science and technology. Field of study and type of higher education were converted to binary indicators for t-test comparison.
As Table 1 shows, there were numerous differences in the characteristics of professional STEM graduates and other STEM graduates. Professional STEM graduates were less likely to be women, less likely to have an immigrant background and somewhat younger. The table also displays an apparent paradox regarding grades: professional graduates had higher grades from upper secondary school but lower grades from higher education than other STEM graduates. The higher grades from upper secondary education reflect the competitive admission of professional STEM degrees, whereas the lower grades from higher education may reflect differences in grading practice across fields of study and students with different intake grades. 4
Lastly, following Statistics Norway’s nomenclature for narrow fields of study, 5 we observed that the distribution across subfields somewhat reflects the division between professional degrees and non-professional degrees. Professional STEM graduates were more likely to have graduated in electronic and mechanical and machine engineering, whereas other STEM graduates, to a larger extent, were graduates of physics, chemistry, biology, and mathematics and statistics. For information and communication technology (ICT), however, there was an almost equal share considered as professional degrees and other STEM degrees. This reflects the notion that narrow field of study do not define which programmes are considered professional STEM degrees; instead, the programmes are based on specific requirements, and only some degrees within ICT meet these requirements.
Outcome variables
The analysis focused on three outcomes that captured the graduates’ transition to the labour market: unemployment, horizontal mismatch and overeducation. The analysis was restricted to graduates in the labour force, that is, graduates who were either employed or unemployed. Unemployed individuals were graduates actively seeking employment and not conducting paid work or being on paid leave (e.g. vacation, parental leave, sickness leave). The graduate unemployment rate was computed as the percentage share of unemployed individuals to the number of individuals in the labour force, which is conventional in the literature.
The overeducation and horizontal mismatch measures rely on the graduates’ perceived fit between their current job and education level and field degree captured by self-reports about the correspondence between the level and content of their work and the level and content of their education (Schweri et al., 2020). See Appendix Table A1 for the response distribution across the answer categories. A graduate is considered horizontally mismatched if (s)he reported that the content of the education they completed corresponded ‘Not at all’ to the work they had, and not horizontally mismatched if the content of the education corresponded to the job ‘to some extent’ or ‘to a great extent’. A graduate was considered overeducated if (s)he answered that the work they had did not require higher education or required higher education at a lower level than their own. 6
Given that unemployed individuals did not receive questions about the match between labour and work, horizontal mismatch and overeducation often are computed as the share of employed workers in existing literature. However, to ensure that we had the same number of observations across outcome variables and to study whether the prevalence of mismatch irrespective of the number of employed workers, we chose to compute the share overeducated and horizontally mismatched in the percentage of the labour force in this study. However, we showed in the robustness test that the findings are similar if computed as the share of employed workers.
Control variables
To account for the differences in observable characteristics of STEM graduates that may confound the comparison, we included a set of control variables in the regressions. In addition to the type of higher education institution, the control variables included age at graduation, immigration status, grades from upper secondary school, relevant work experience, marital status, child care and higher education grades. Although age, gender, educational programme and higher education institution were based on administrative records, the other controls were based on self-reports. The covariates are defined as follows: - Immigration status: An indicator variable taking the value of 1 if the graduate is an immigrant and 0 otherwise. - Grades from upper secondary school were assigned on a scale from 2 to 6 (1 = fail). The respondents reported their average grades within pre-set bins. We labelled the bin between 5 and 6 ‘top grades’ in Table 1. In regressions, one indicator variable was used for the lowest grade interval, defined as GPA below 4, and one indicator variable was used for the medium interval (GPA 4–4.9). Grades in the highest interval (GPA 5 and above) served as the reference category. - Relevant work experience: An indicator variable taking the value 1 if the graduate had relevant work experience prior to graduation and 0 otherwise. - Marital status: an indicator variable taking the value 1 if the graduate was married/cohabitating and 0 otherwise - Child care: An indicator variable taking the value 1 if the graduate is caring for at least one child below 18 years of age and 0 otherwise. - Grades from higher education: One indicator variable for grades D/E, one indicator variable for grade C, and one indicator variable for grade B. Grade A served as the reference category.
Unemployment rate for all master’s degree holders.
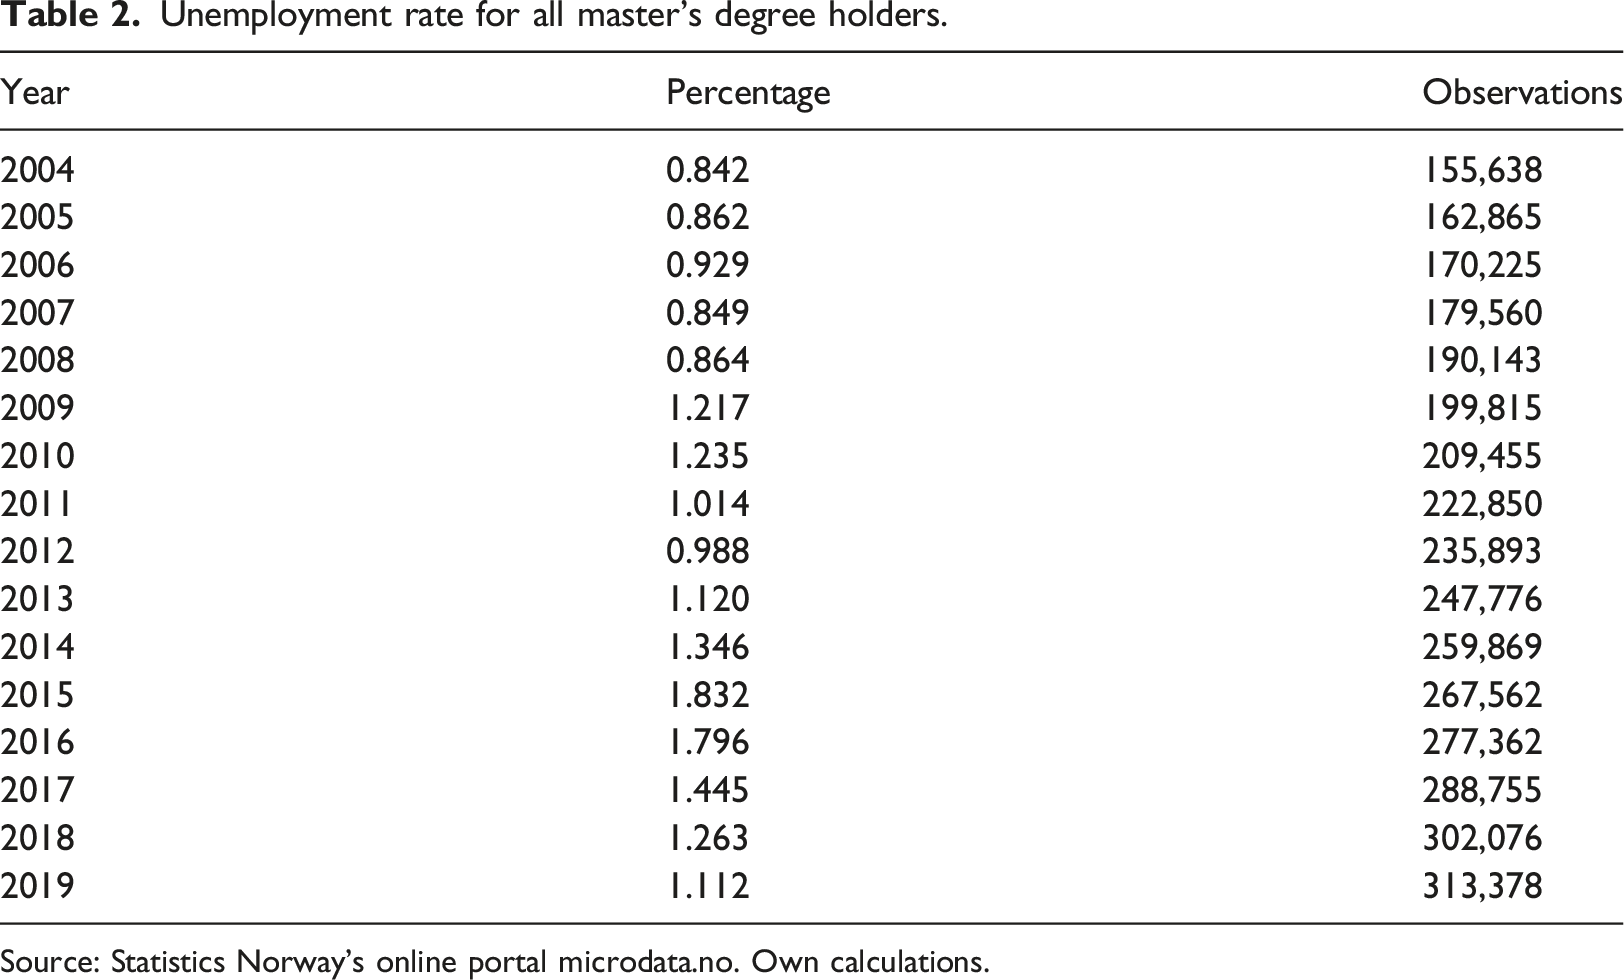
Source: Statistics Norway’s online portal microdata.no. Own calculations.
Model specifications
We ran the following linear probability regressions
The model described above is our preferred model. As a robustness check, we also report a model in which dummies for narrow fields of study are included. However, as Table 1 reports, the narrow fields of study strongly correlated with the distinction between professional STEM and other STEM degrees. Although the findings were robust to this inclusion, we think it made the model less precise; thus, we did not include dummies for narrow fields in the main specification.
To study whether professional STEM graduates were influenced differently by cyclical variations than other STEM graduates, we extended the model above
The graduates in our sample graduated between February and August of the given year, whereas unemployment rates that accounted for education level and field could only be computed as of November. It is an empirical question as to whether the entry-level labour market conditions are best reflected in the unemployment rate in the fall prior to or after graduation. To account for the possibility that the labour market conditions prior to graduation have an impact, we also ran a regression using the unemployment rate in November of the year prior to graduation, as displayed in Equation (3)
Methods
We tested the model using a linear probability model (LPM). Linear probability models are easy to interpret, comparable across models and samples, and do not reflect unobserved heterogeneity, as do logistic regressions (Mood, 2010). Moreover, given that the interest of the study is in identifying
For ease of interpretation, the coefficients from the LPM were multiplied by 100. The interpretation of γ is the percentage point increase/decrease in the probability of being unemployed, overeducated or horizontally mismatched if a respondent graduated with a professional STEM degree. Other STEM graduates constituted the comparison group. Cluster robust standard errors for graduation year and higher education institution were used to control for intra-class correlation and control for heteroskedasticity across clusters of observations.
Results
Overall difference between professional and non-professional STEM degrees
Figure 1 shows a coefficient plot based on linear regressions with the three dependent variables of unemployment, overeducation, and horizontal mismatch in separate panels and for two specifications of Equation (1). The first line only includes year fixed effects and shows that professional STEM graduates are less likely to experience unemployment, overeducation, and horizontal mismatch than other STEM graduates. The second line shows the preferred specification, which controls for individual characteristics and type of higher education institution. Graduating with a professional STEM degree decreases unemployment by 3.8 percentage points, horizontal mismatch by 7.8 percentage points, and overeducation by 4.4 percentage points compared to other STEM degrees. Difference in the probability of experiencing unemployment, overeducation and horizontal mismatch for professional STEM graduates compared to other STEM graduates. Source: Norwegian Graduate surveys. Own calculations. Note: The coefficient plot displays the coefficient and the 95 percent confidence interval for the dummy variable for being a professional STEM graduate obtained by six linear probability regressions using the three outcome variables unemployment, overeducation and horizontal mismatch. The reference group was other STEM graduates. Standard errors are clustered by graduation year and higher education institution.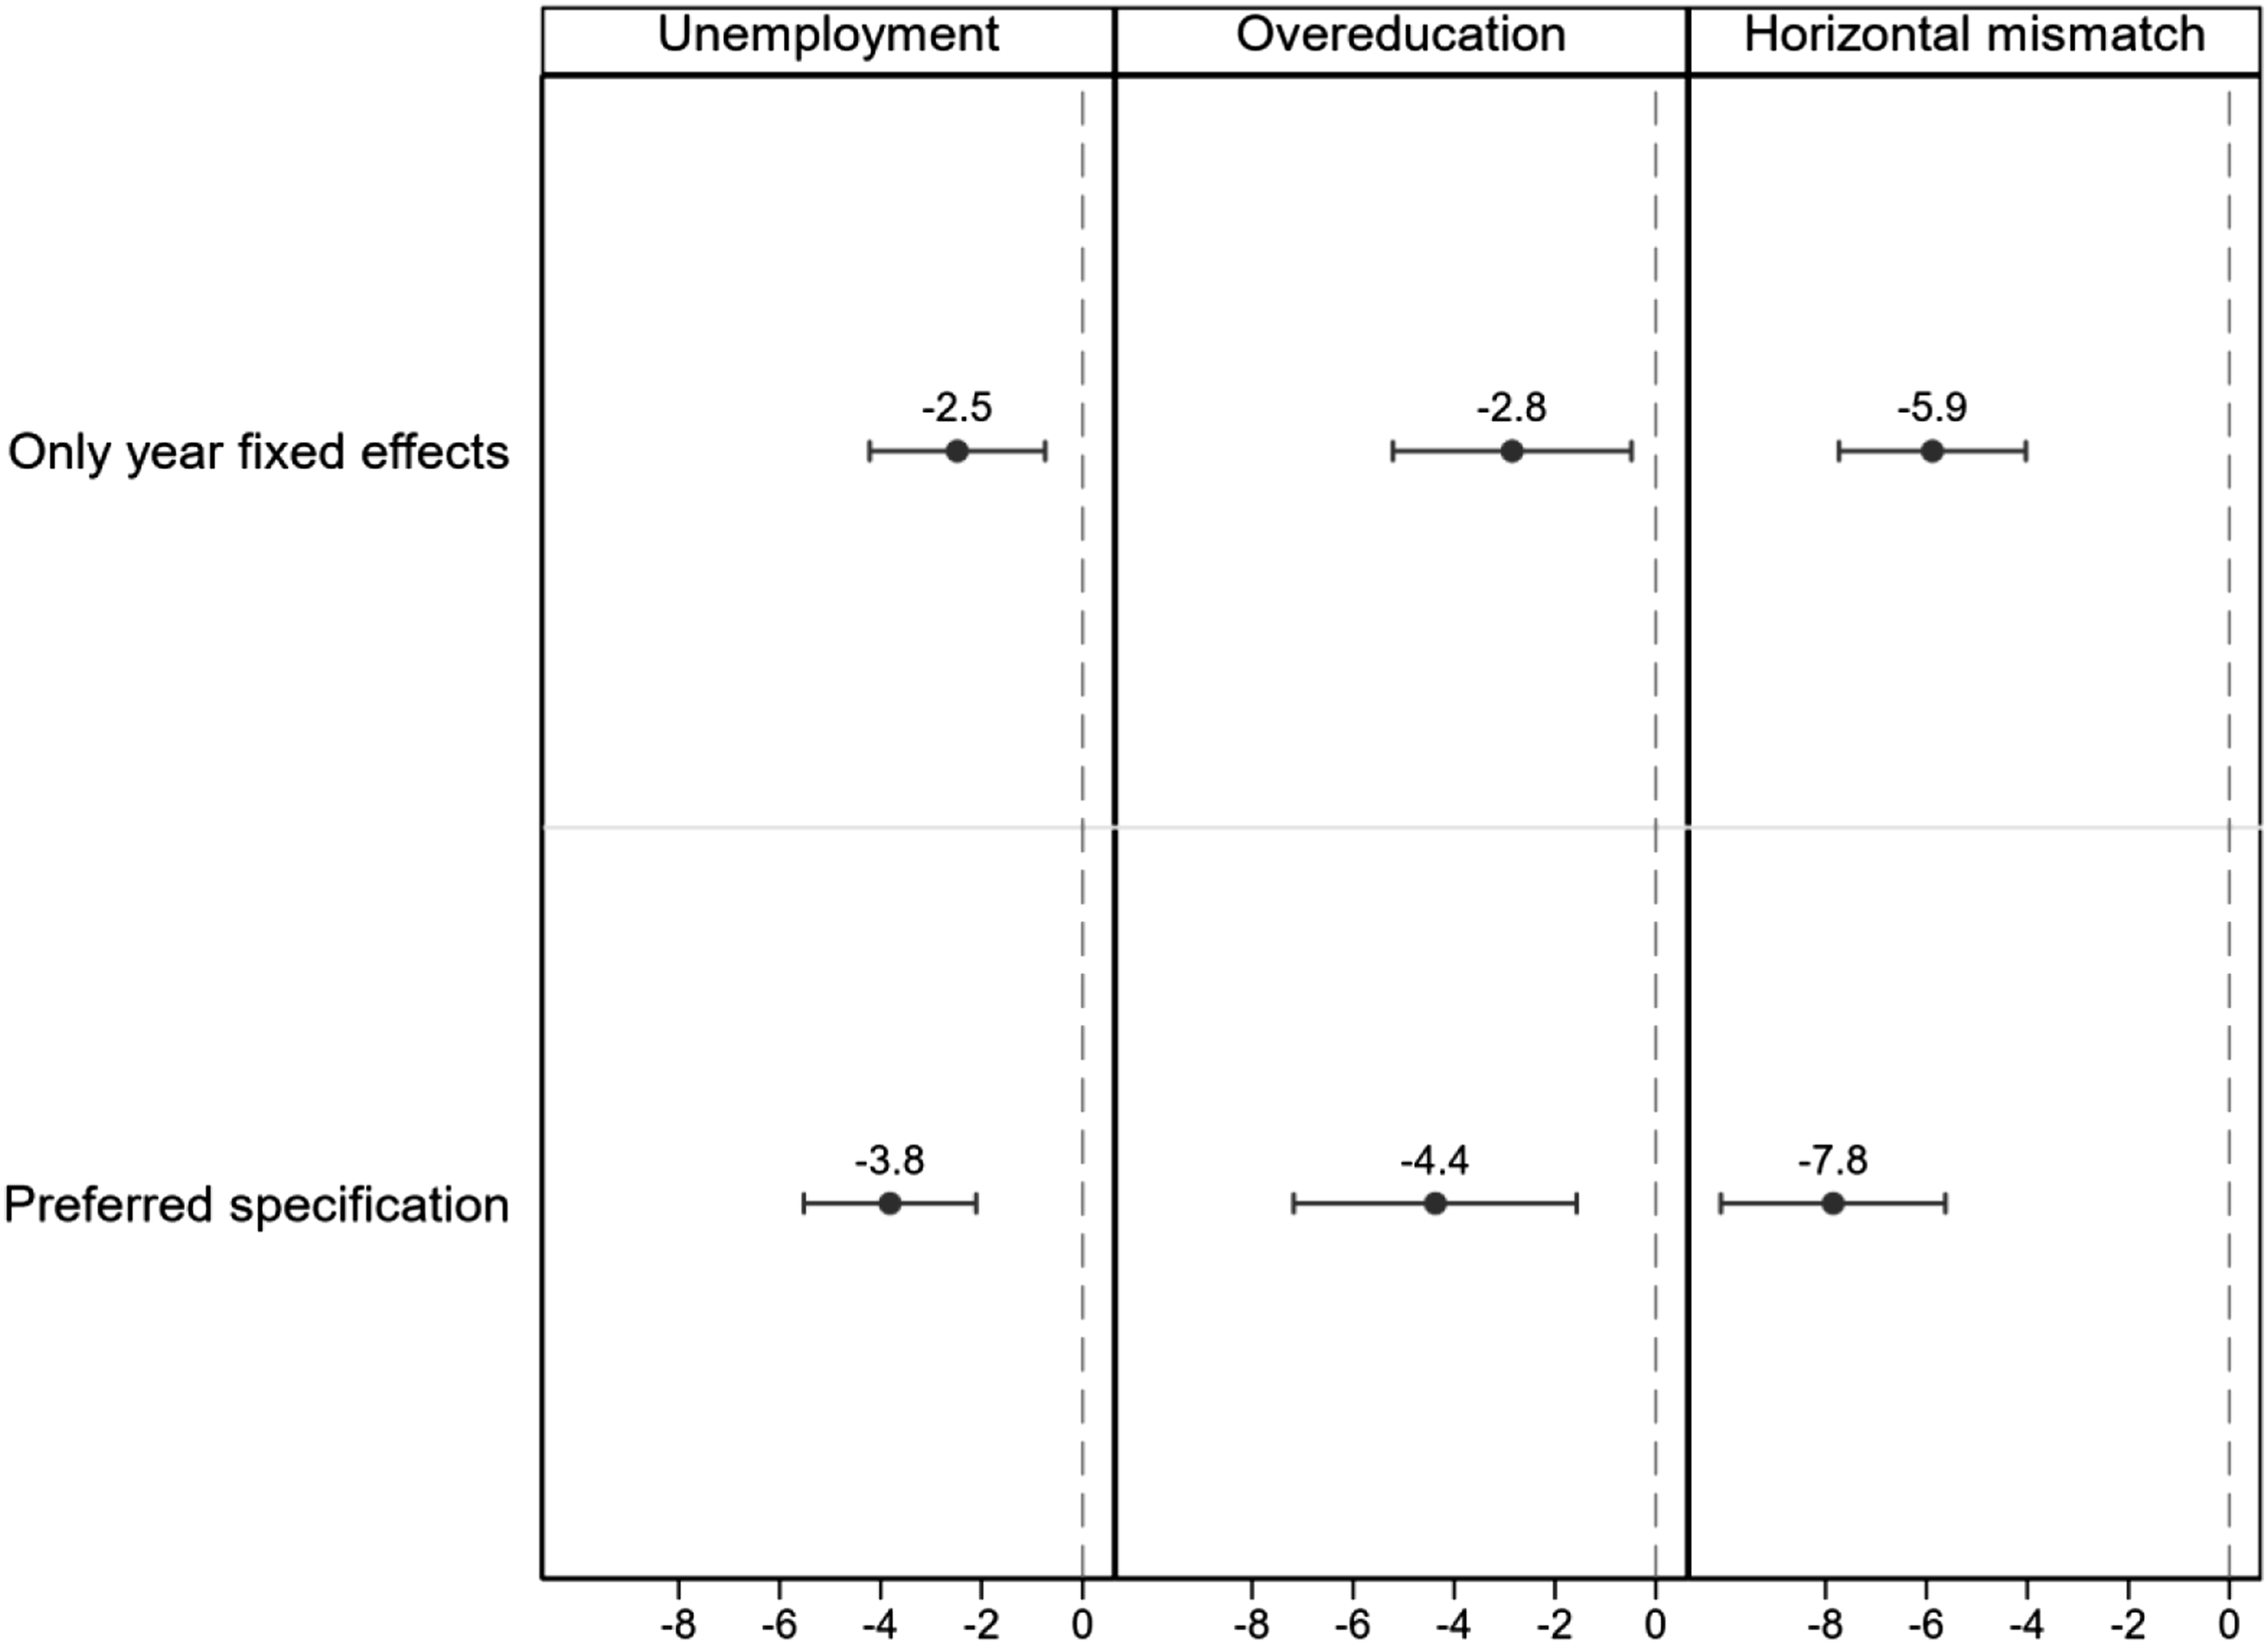
For other STEM graduates with similar characteristics, the unemployment rate was 9.2 percent, while the shares experiencing horizontal mismatch and overeducation were 11.8 percent and 26.1 percent, respectively. The results thus suggest that the professional STEM graduates’ prevalence of negative labour market outcomes was only between 34 and 83 percent of the magnitude of other STEM graduates.
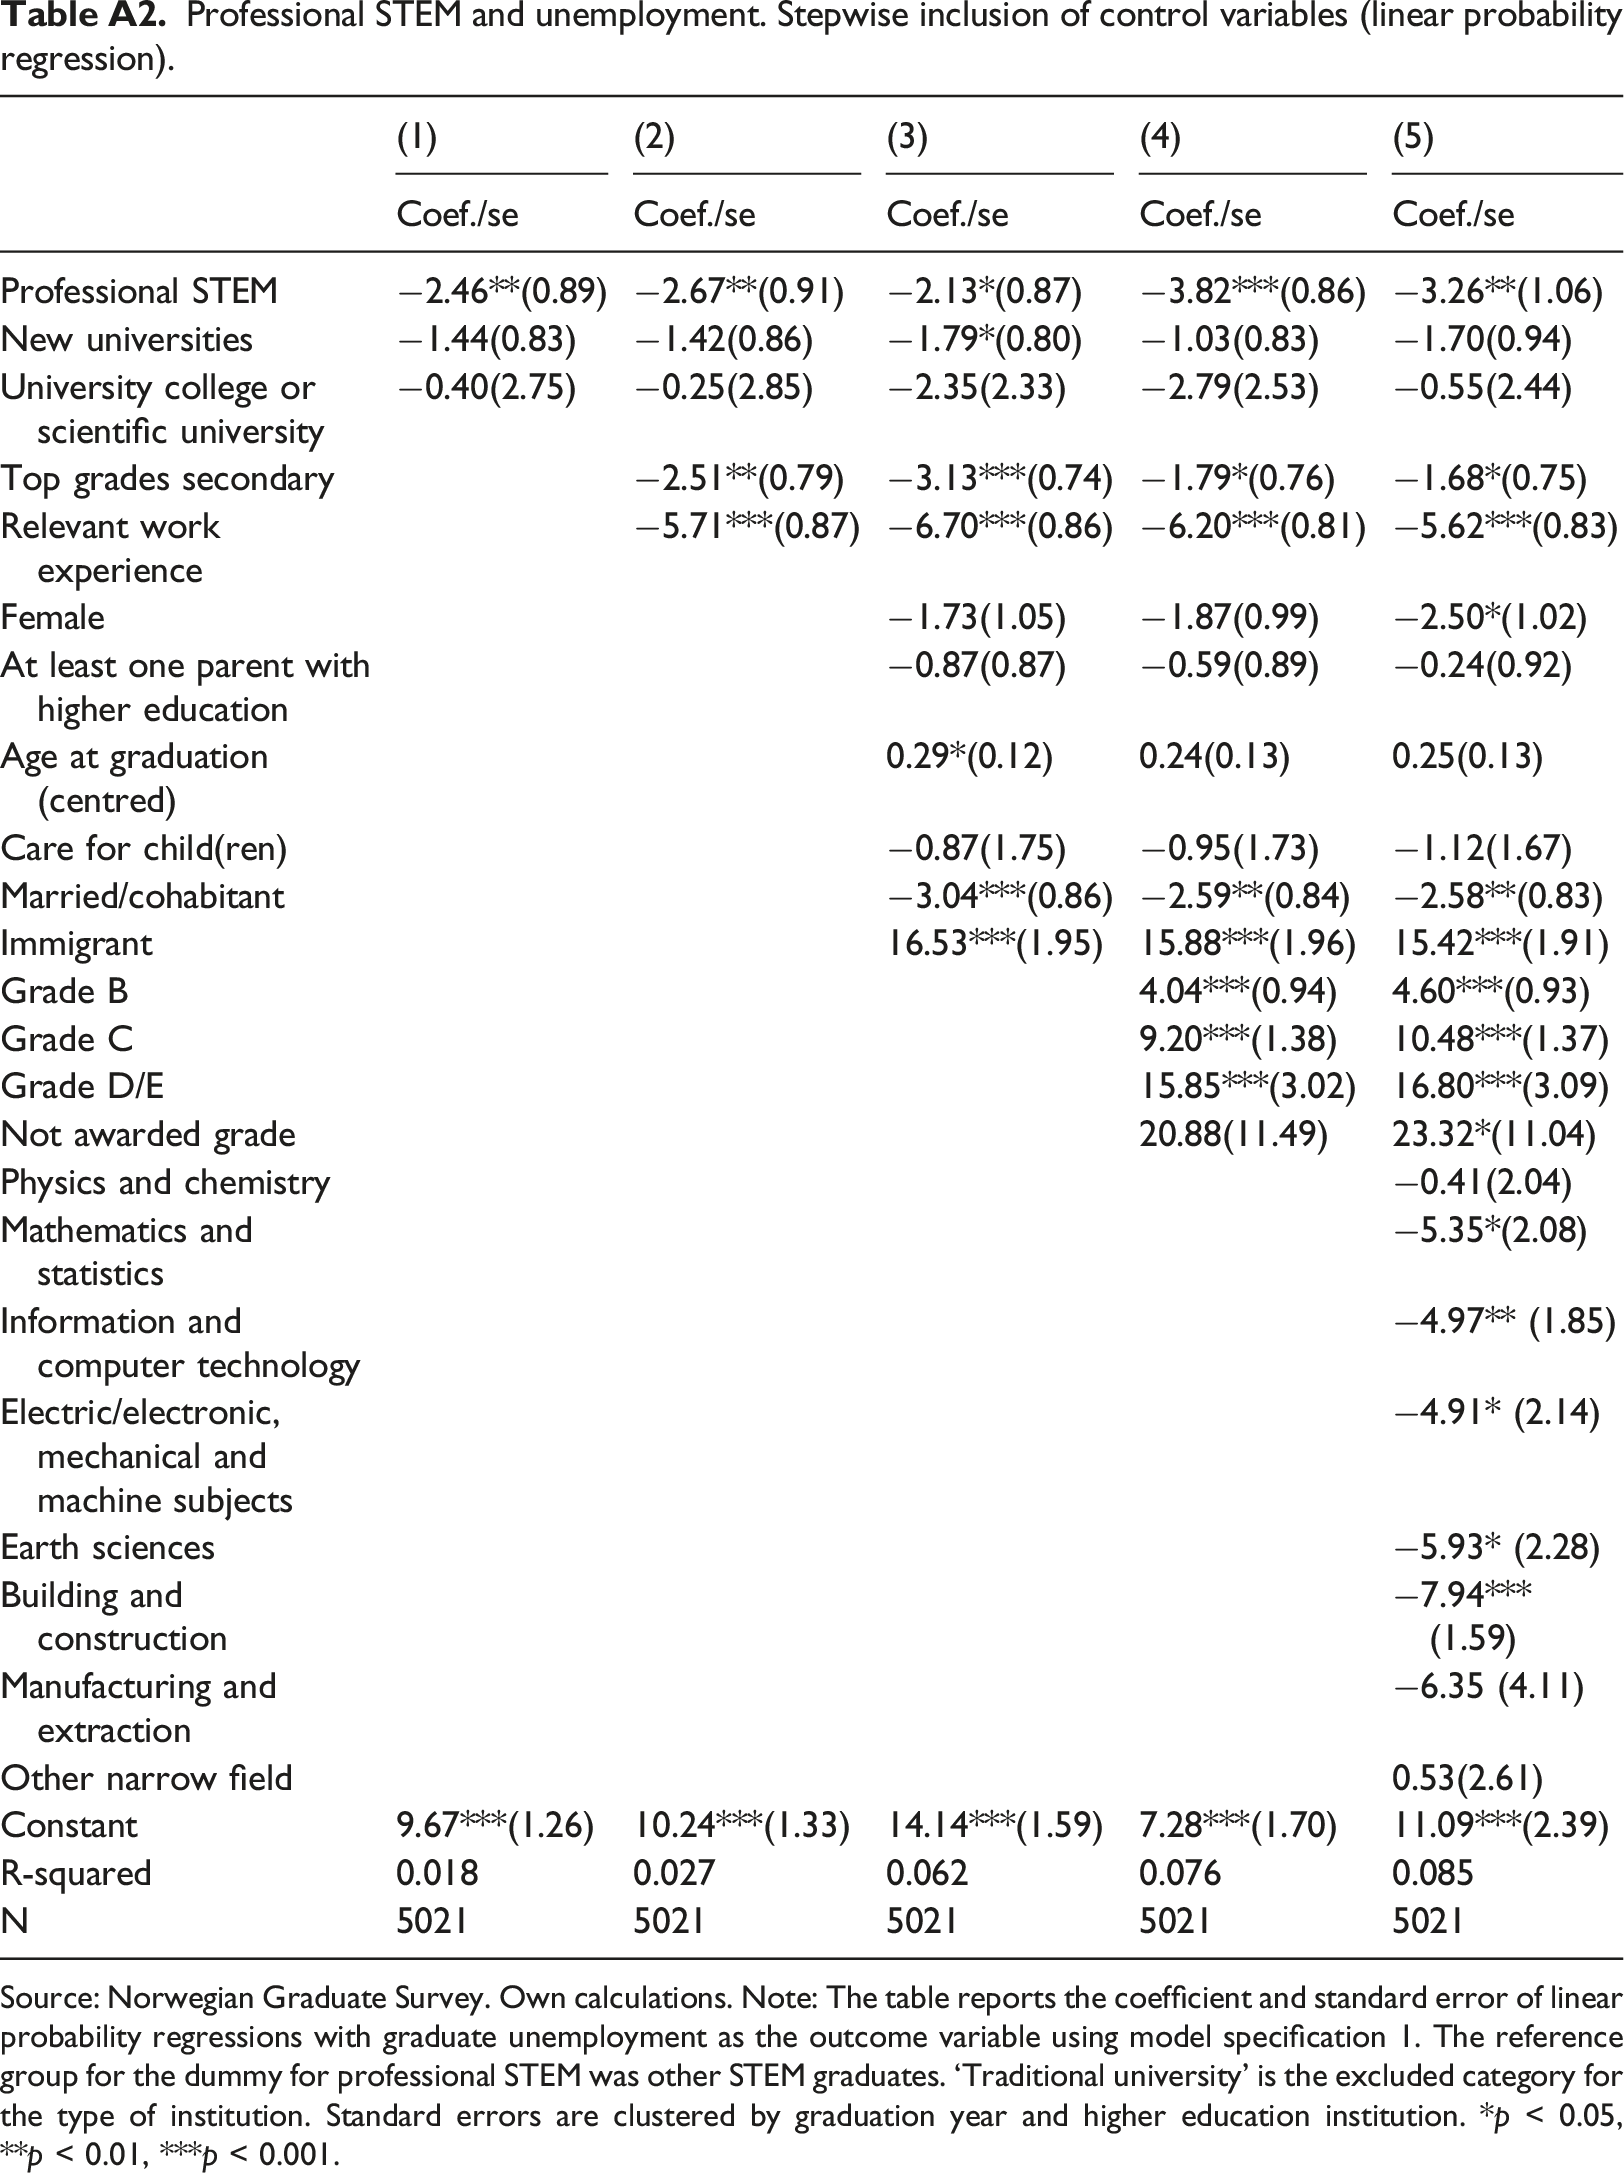
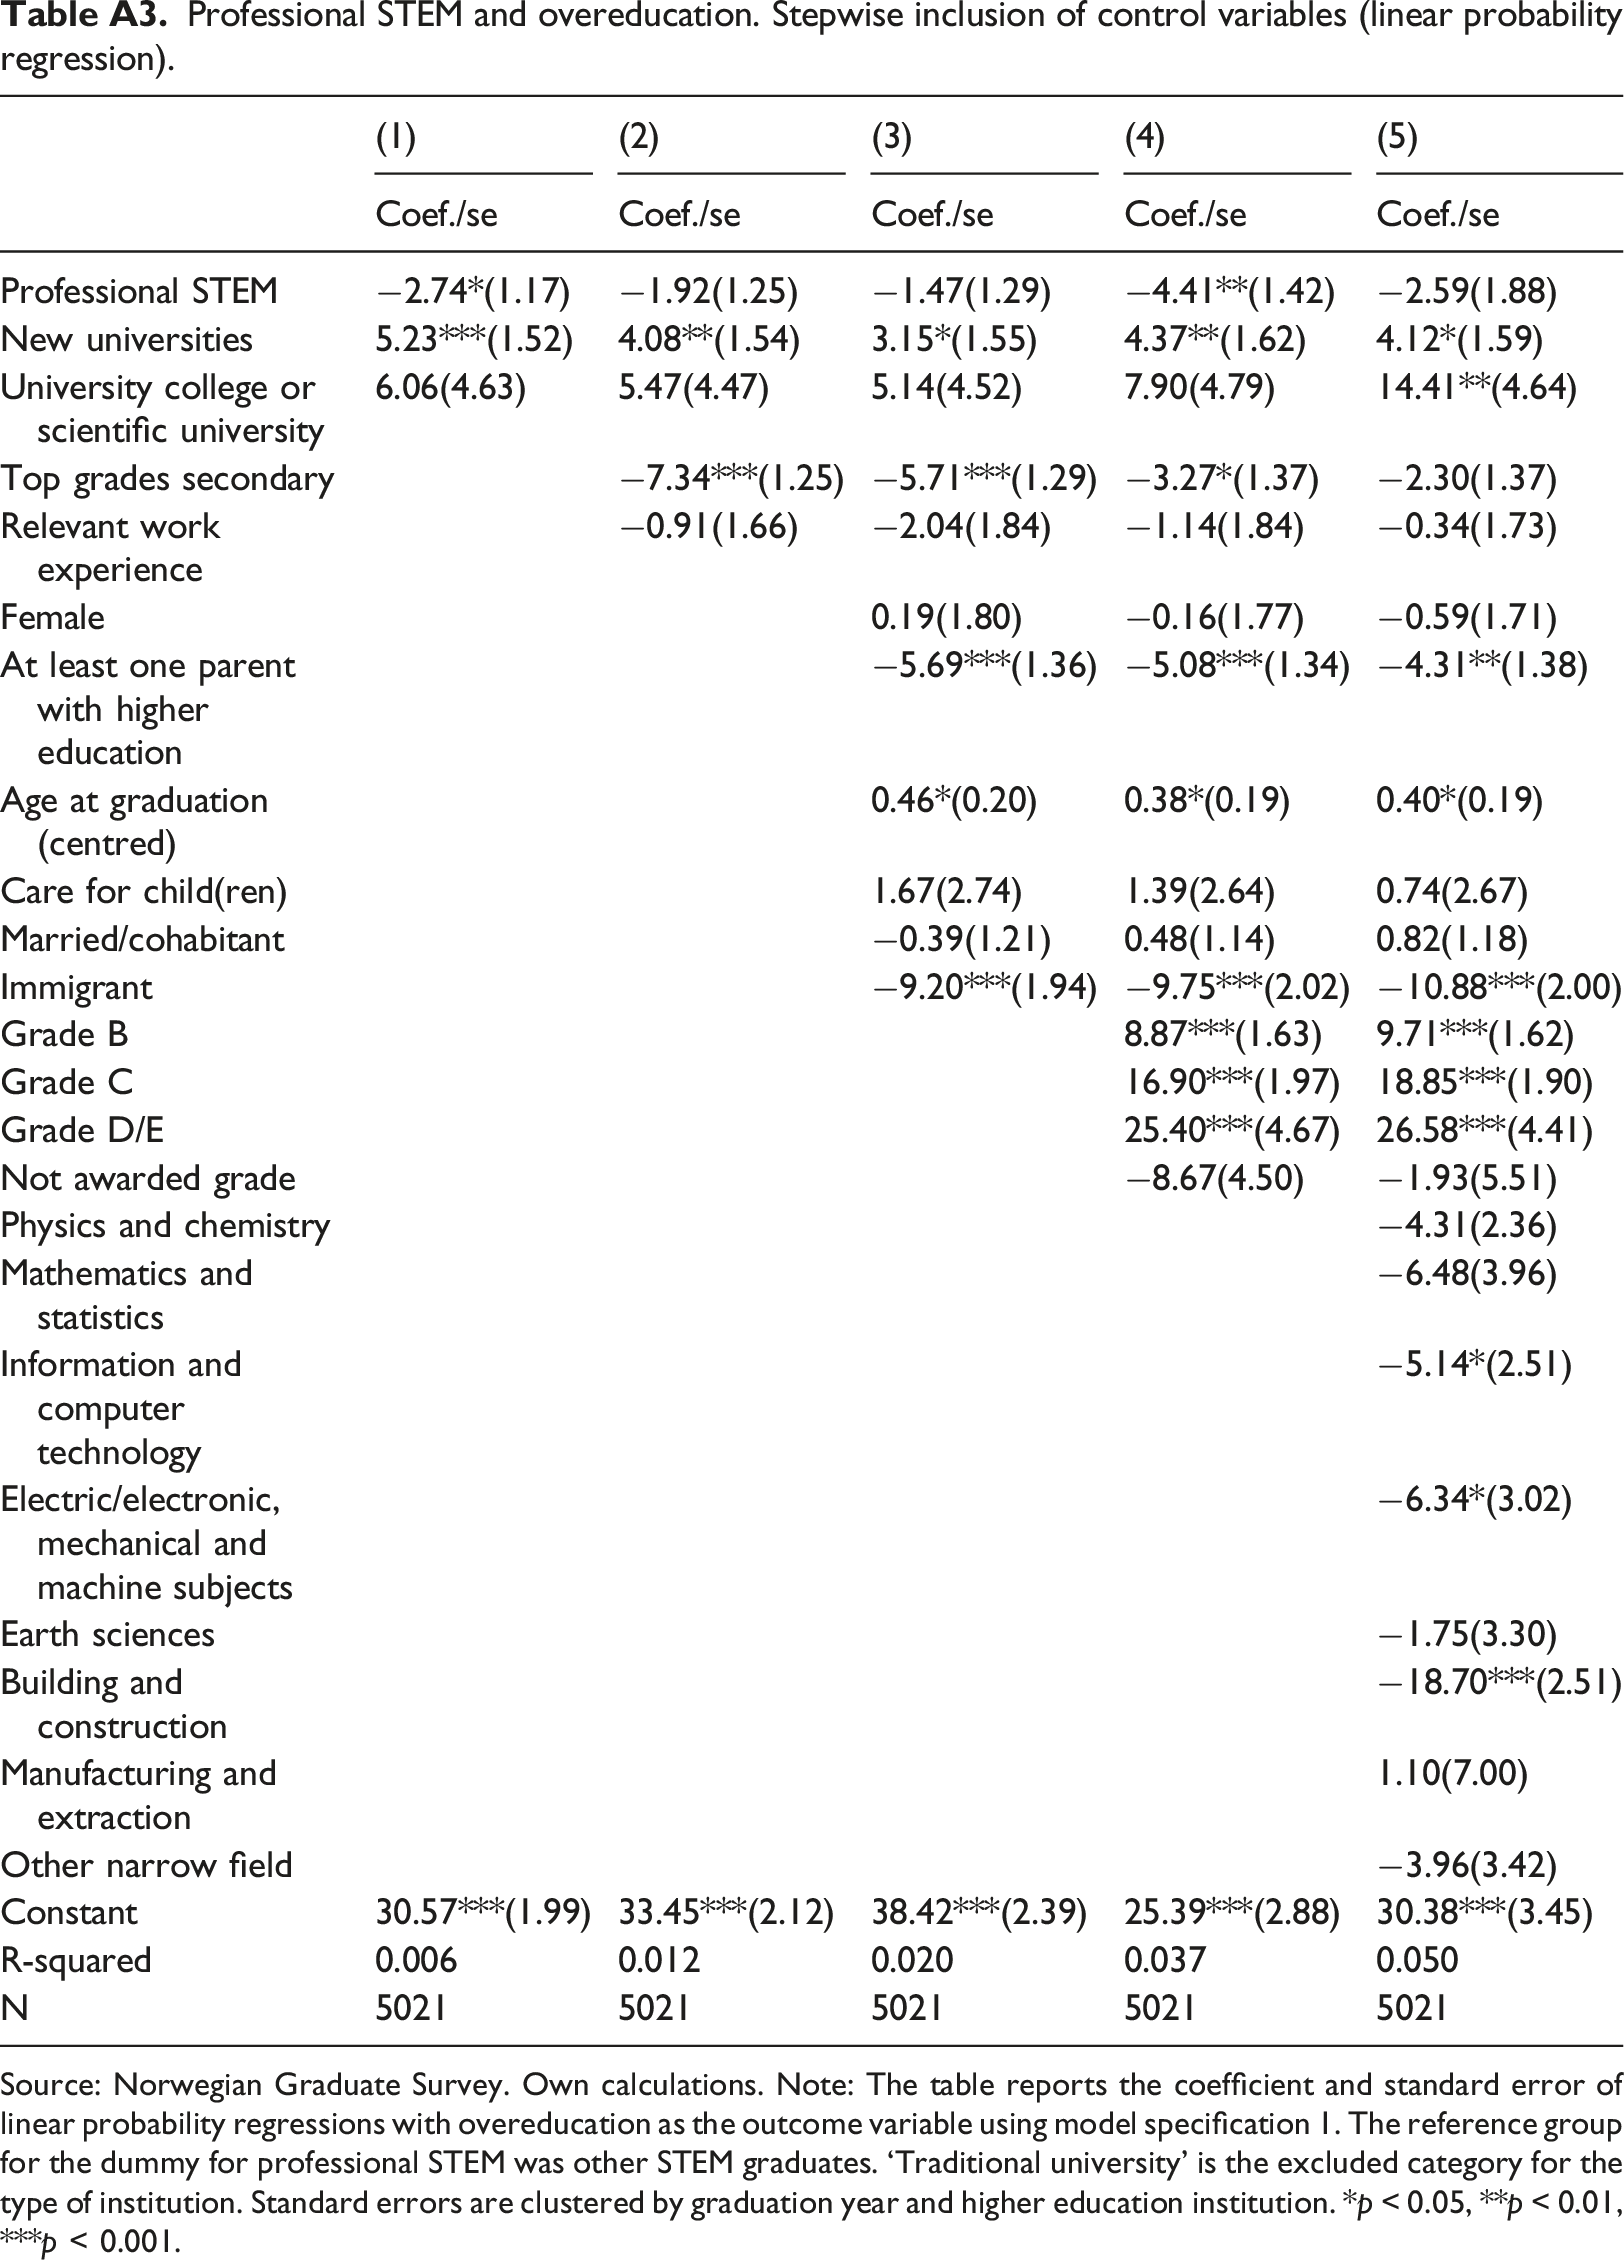
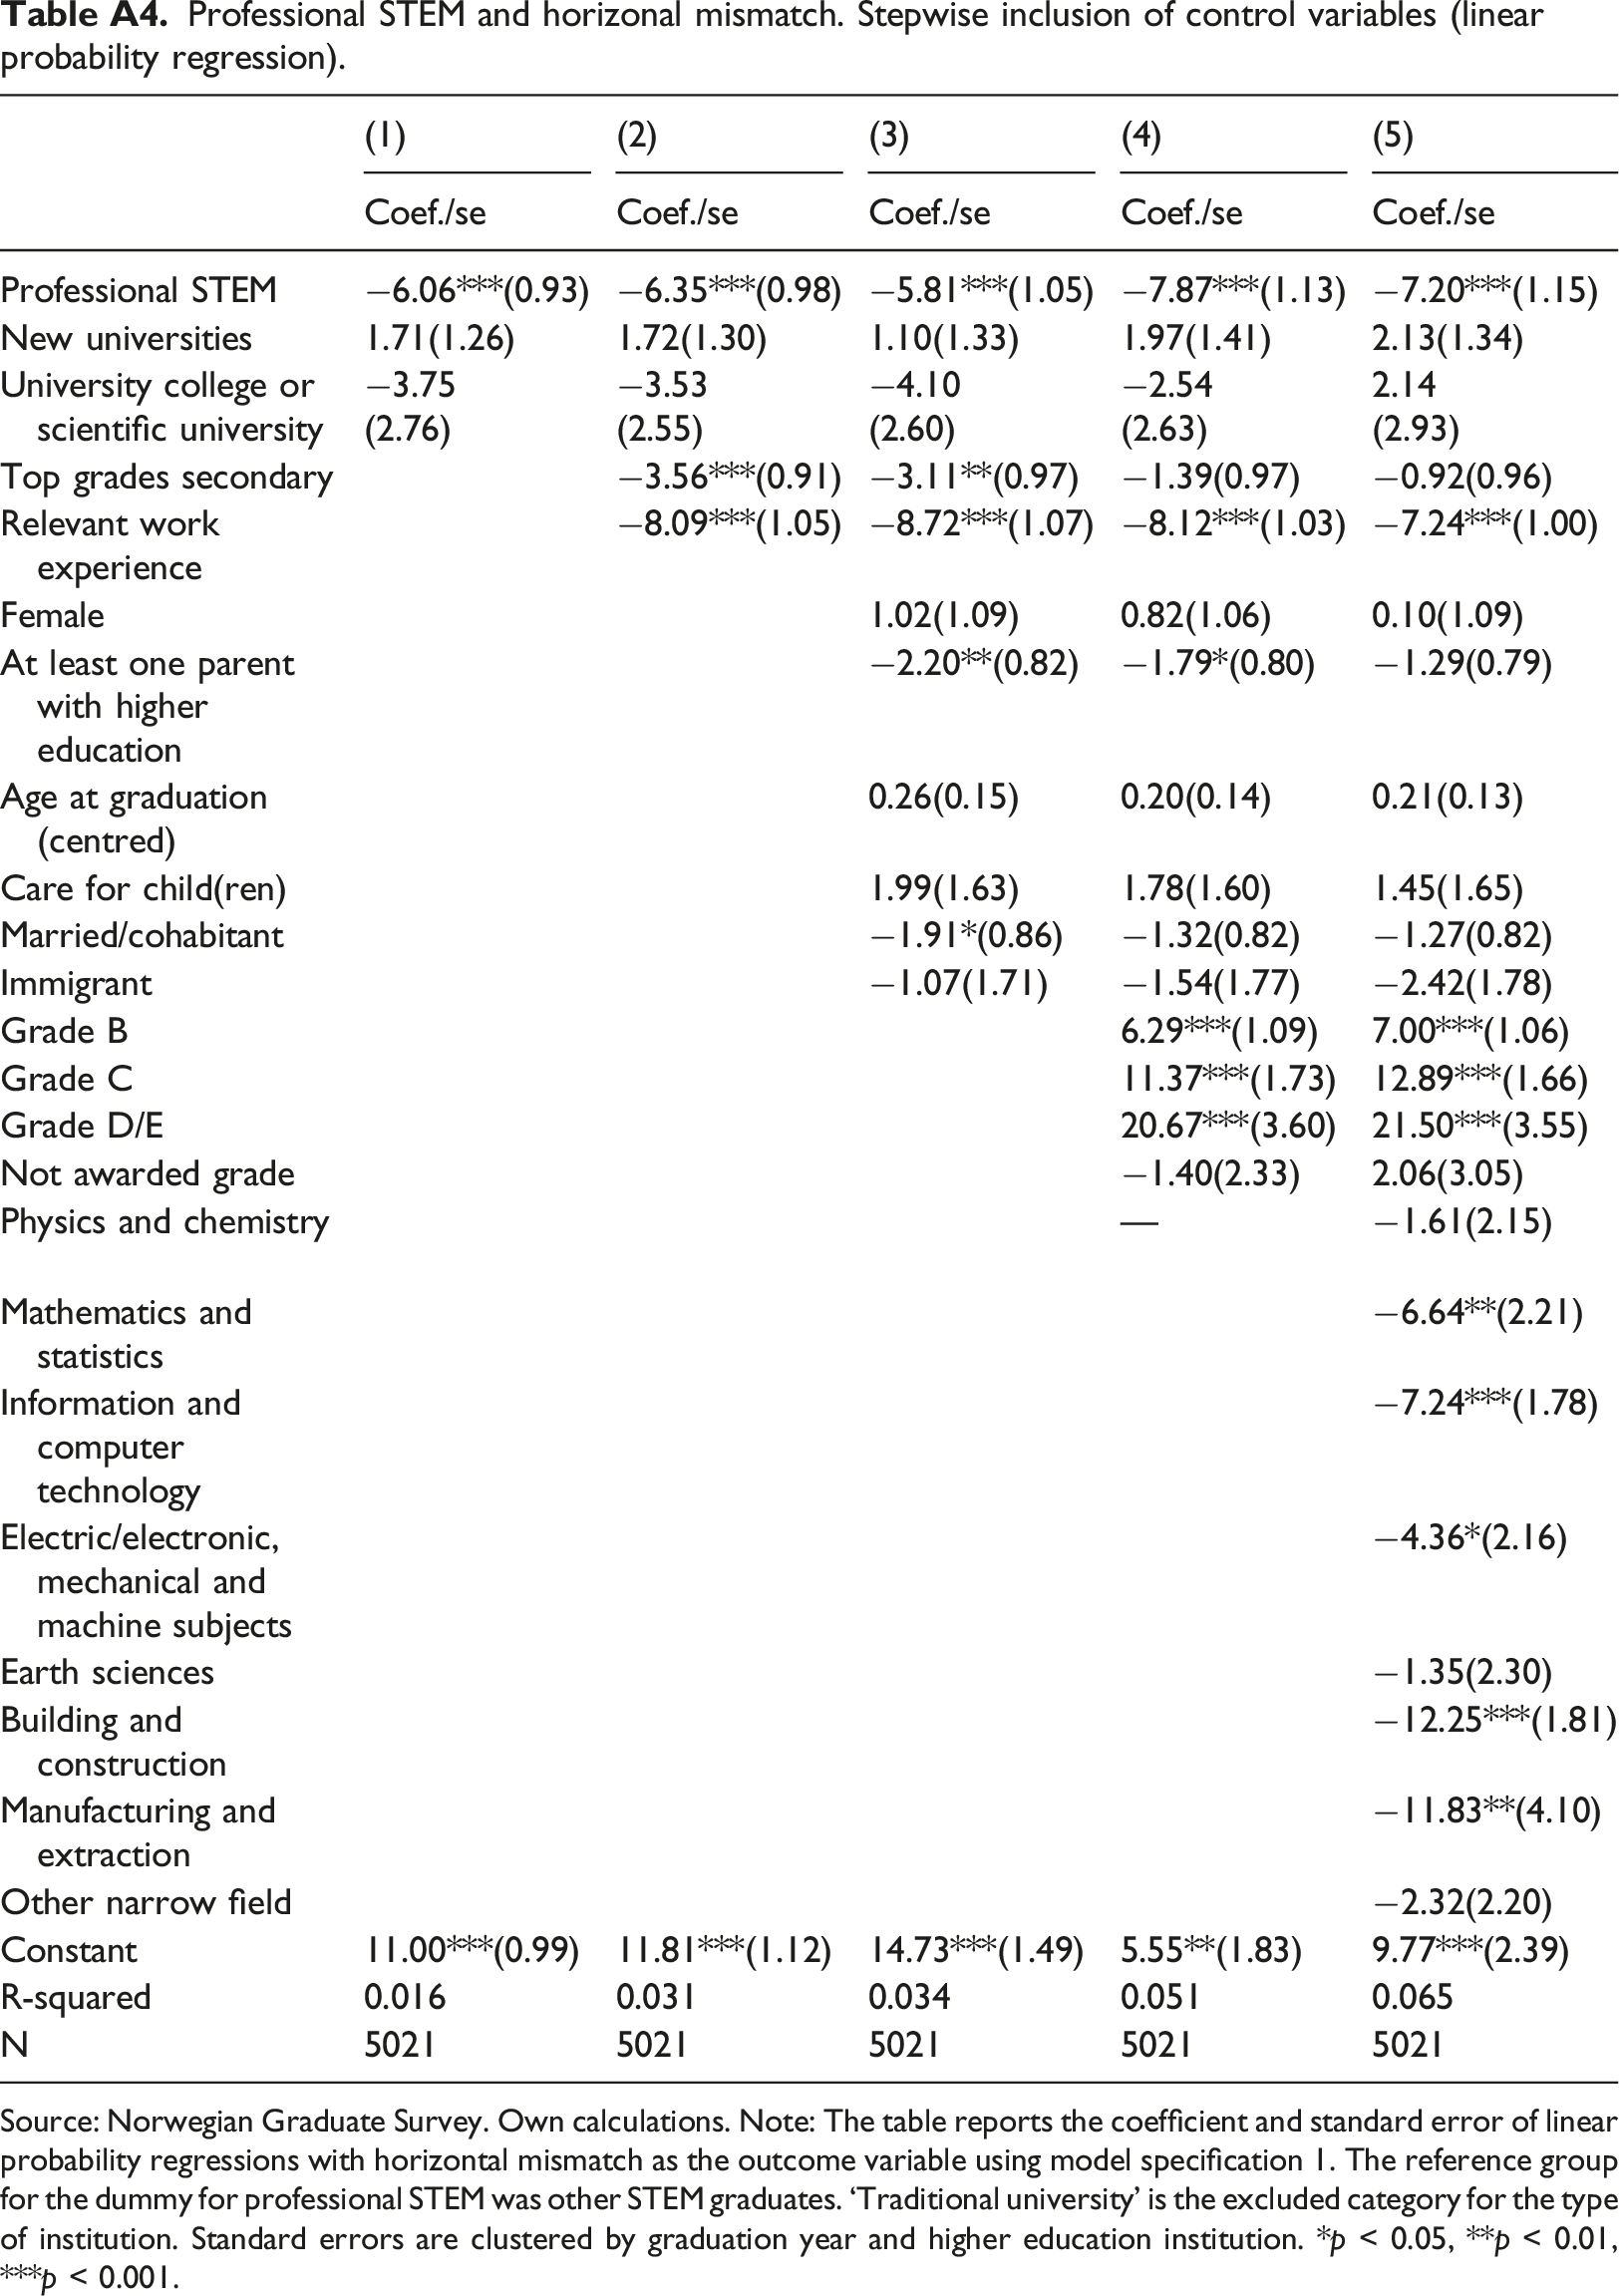
The figure further shows that even though the estimated advantage of a professional STEM degree was sensitive to adding control variables, as suggested in Section 2.2, controlling for these characteristics increases, rather than decreases, the estimate. In Tables A2, A3, and A4 in the appendix, we report the results from a stepwise addition of control variables. Adding control for grades from higher education, even when controlling for grades from upper secondary, vastly affected the size of the estimated coefficient. In the absence of controlling for grades from higher education, the estimated difference in overeducation between professional STEM degrees and other STEM degrees was not statistically significant.
The outcome ‘unemployed’ equals 100 if the graduate was unemployed in the reference week of the graduation year, the outcome ‘overeducation’ equals 100 if the graduate had a job that did not require a master’s degree, and the outcome ‘horizontal mismatch’ equals 100 if the graduate had a job in which the content of the work did not match the content of the education. The row ‘only year fixed effects’ shows the results from the regression that includes only year fixed effects. The row ‘preferred specification’ includes controls for grades from upper secondary, higher education, gender, immigration status, parental education, marital status, care for children, age, relevant work experience and type of university.
Result 1: Professional STEM graduates have lower unemployment, horizontal mismatch and overeducation than other STEM graduates.
The impact of business cycle fluctuations
Linear probability regressions of horizontal mismatch, overeducation, and unemployment of recent graduates, including general unemployment.
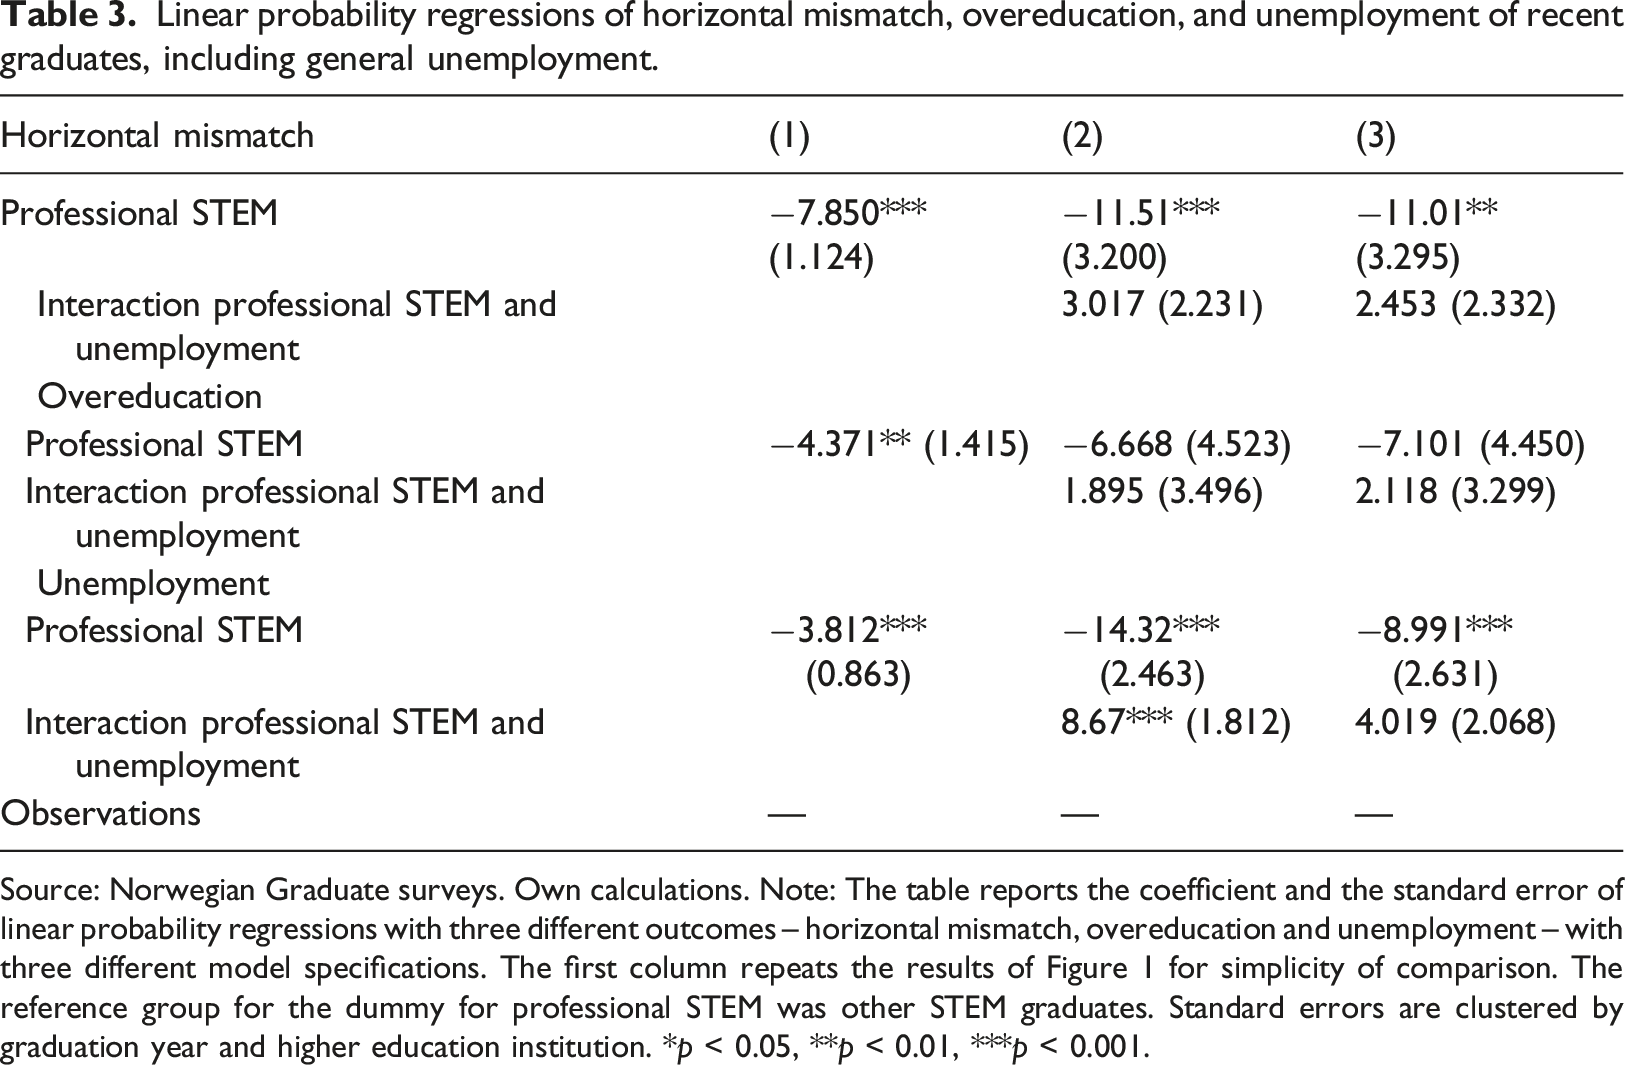
Source: Norwegian Graduate surveys. Own calculations. Note: The table reports the coefficient and the standard error of linear probability regressions with three different outcomes – horizontal mismatch, overeducation and unemployment – with three different model specifications. The first column repeats the results of Figure 1 for simplicity of comparison. The reference group for the dummy for professional STEM was other STEM graduates. Standard errors are clustered by graduation year and higher education institution. *p < 0.05, **p < 0.01, ***p < 0.001.
The results show that although all coefficients for the interaction effect between labour market unemployment and the dummy variable for professional STEM were positive, the coefficient was only statistically significant for the outcome variable unemployment and only for the specification where we used the unemployment rate in the same year as graduation. The findings suggest that if the general unemployment rate is above 1.65 percentage points, professional STEM graduates will have a higher unemployment rate than other STEM graduates. The unemployment rates displayed in Table 2 show that this only occurred during 2015 and 2016, in which the oil bust influenced the Norwegian economy in general, and the labour market for STEM workers in particular.
The results thus provide some support for the hypothesis that the relative advantage of professional STEM degrees decreases when the general unemployment rate increases but only for the unemployment rate of recent graduates. The results suggest that the transition from education to (any) employment is more affected by the general labour market for professional STEM graduates than for other STEM graduates. There is a general presumption that private companies are more sensitive to business cycle fluctuations than public companies. This may be a contributing factor to our results, as our data showed that professional STEM graduates cater more to the private sector than other STEM graduates (80 percent vs. 54 percent).
Result 2: The advantage of professional STEM degrees over other STEM degrees decreases in slacker labour markets but only for the ability to obtain a job.
The outcome ‘unemployed’ equals 100 if the graduate was unemployed in the reference week of the graduation year, the outcome ‘overeducation’ equals 100 if the graduate had a job that did not require a master’s degree, and the outcome ‘horizontal mismatch’ equals 100 if the graduate had a job in which the content of the work did not match the content of the education. The control variable for the unemployment rate is the unemployment rate for all master’s degree holders in the labour market. The regressions include year fixed effects and controls for grades from upper secondary, higher education, gender, immigration status, parental education, marital status, care for children, age, relevant work experience and type of university.
Robustness checks
As a robustness check, we ran a logistic regression for the unemployment outcome variable. The overall findings, direction of difference and statistical significance were similar across the two specifications.
The outcome ‘unemployed’ equals 100 if the graduate was unemployed in the reference week of the graduation year. The control variable for the unemployment rate was the unemployment rate for all master’s degree holders in the labour market.
Linear probability and logistic regression of unemployment.
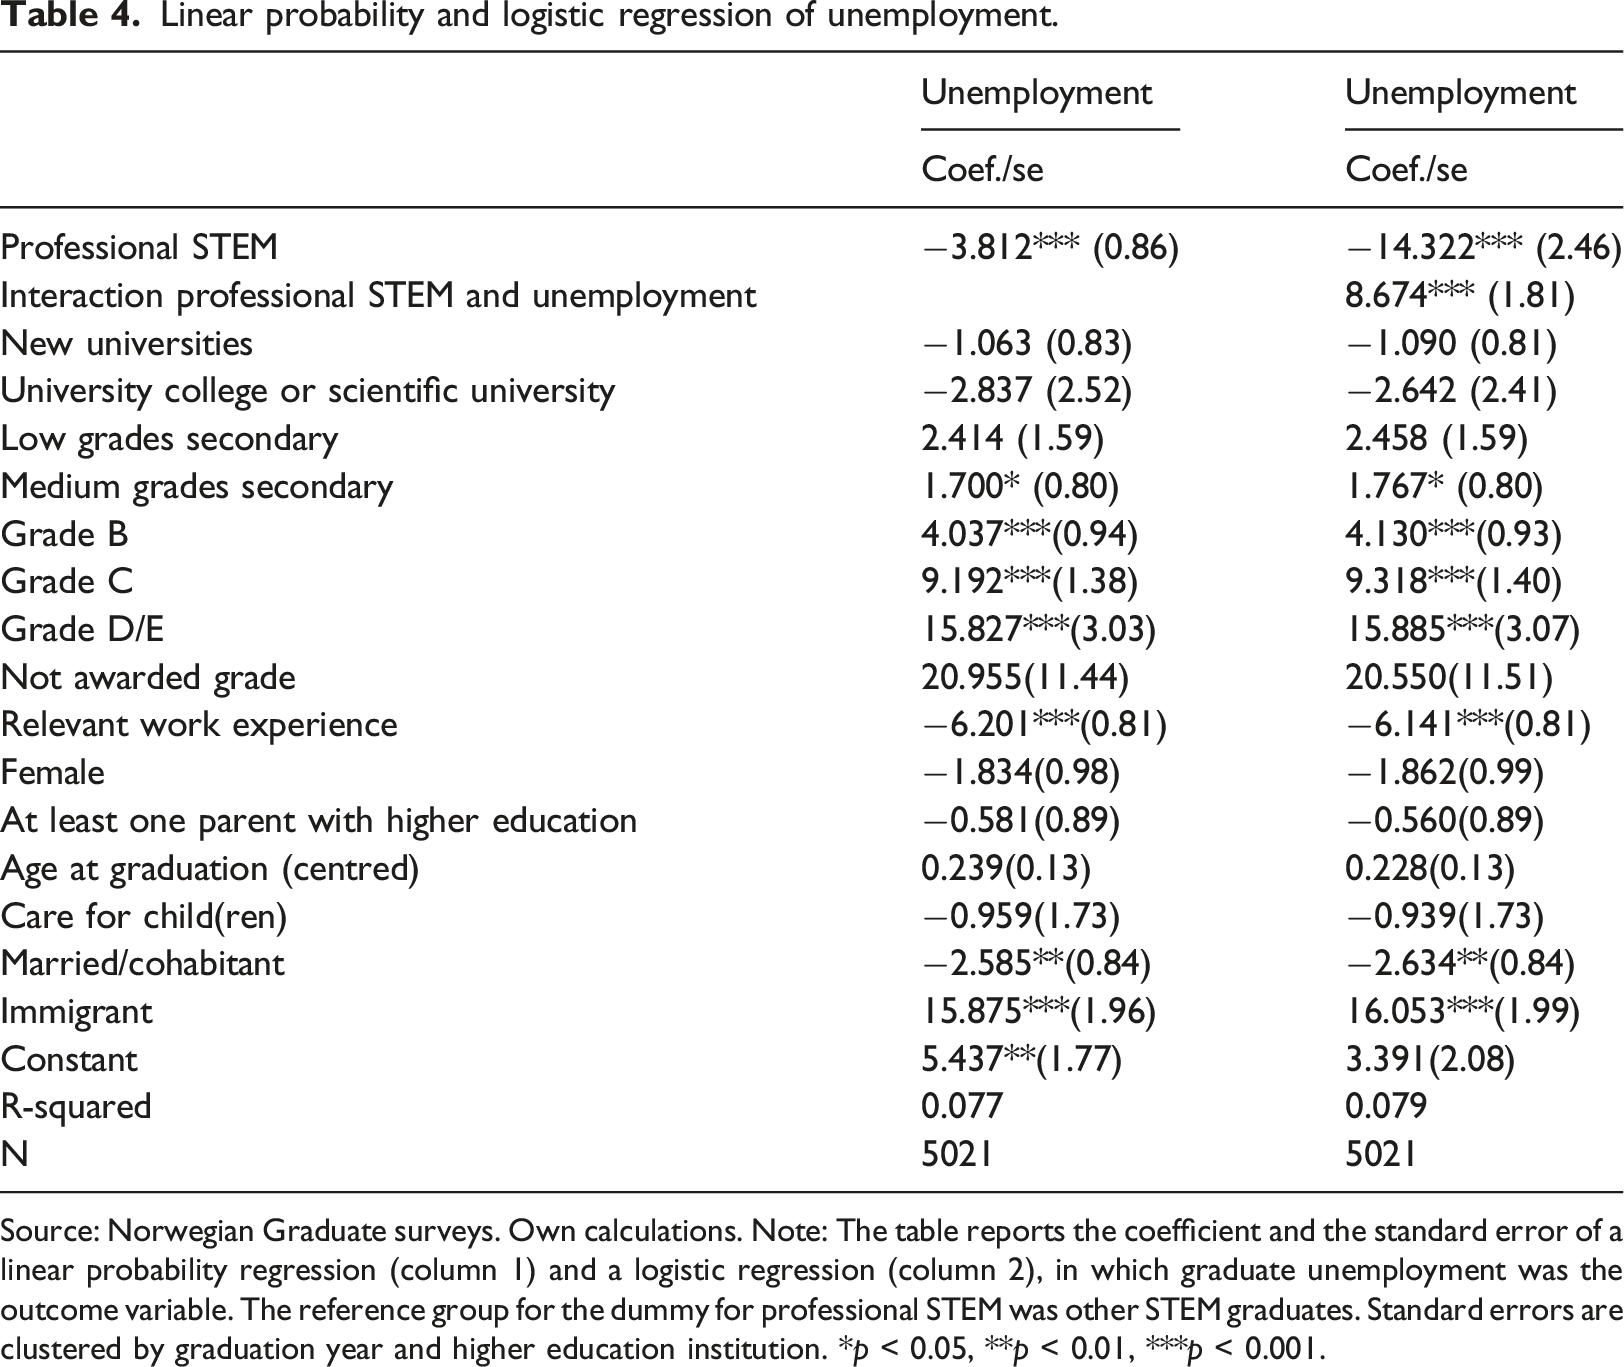
Source: Norwegian Graduate surveys. Own calculations. Note: The table reports the coefficient and the standard error of a linear probability regression (column 1) and a logistic regression (column 2), in which graduate unemployment was the outcome variable. The reference group for the dummy for professional STEM was other STEM graduates. Standard errors are clustered by graduation year and higher education institution. *p < 0.05, **p < 0.01, ***p < 0.001.
Linear probability regression where overeducation and horizontal mismatch are defined as the share of employed workers.
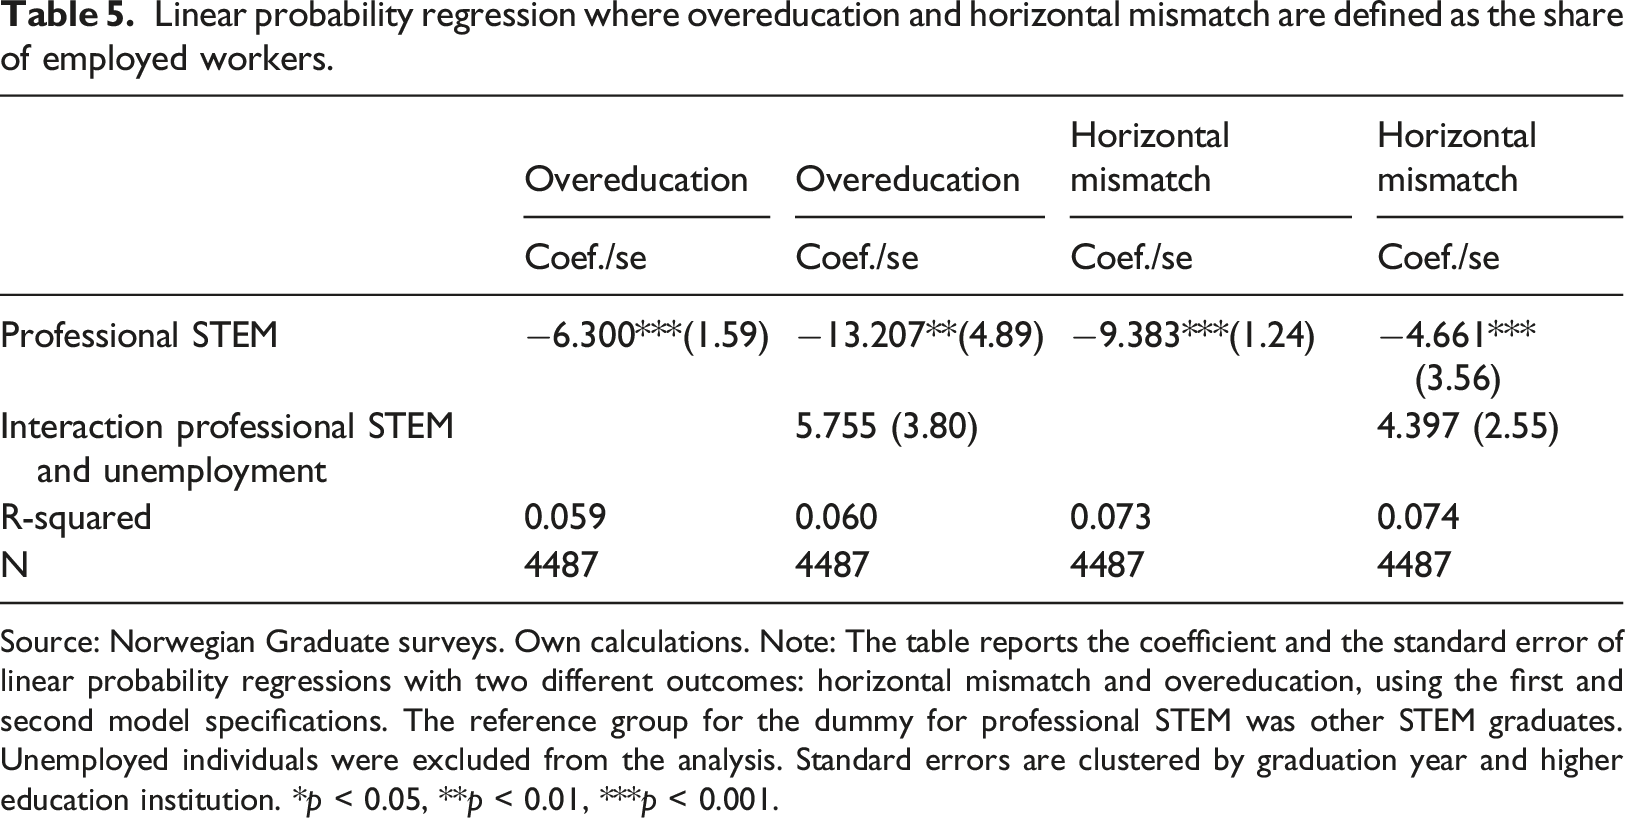
Source: Norwegian Graduate surveys. Own calculations. Note: The table reports the coefficient and the standard error of linear probability regressions with two different outcomes: horizontal mismatch and overeducation, using the first and second model specifications. The reference group for the dummy for professional STEM was other STEM graduates. Unemployed individuals were excluded from the analysis. Standard errors are clustered by graduation year and higher education institution. *p < 0.05, **p < 0.01, ***p < 0.001.
The outcome ‘overeducation’ equals 100 if the graduate had a job that did not require a master’s degree, and the outcome ‘horizontal mismatch’ equals 100 if the graduate had a job in which the content of the work did not match the content of the education. The control variable for the unemployment rate is the unemployment rate for all master’s degree holders in the labour market. The regressions include year fixed effects and controls for grades from upper secondary, higher education, gender, immigration status, parental education, marital status, care for children, age, relevant work experience and type of university.
Strong and mild overeducation.
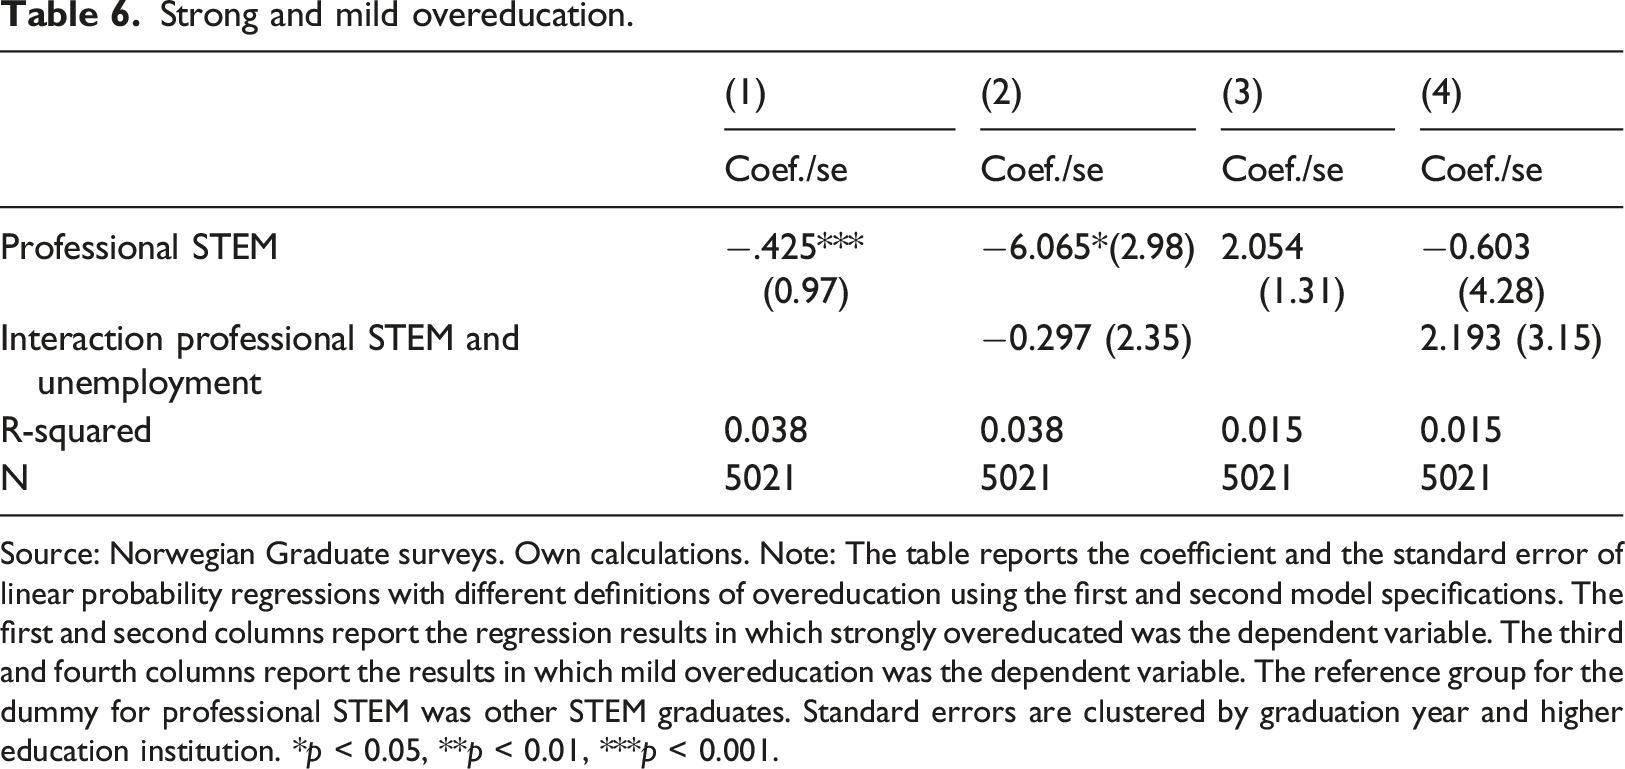
Source: Norwegian Graduate surveys. Own calculations. Note: The table reports the coefficient and the standard error of linear probability regressions with different definitions of overeducation using the first and second model specifications. The first and second columns report the regression results in which strongly overeducated was the dependent variable. The third and fourth columns report the results in which mild overeducation was the dependent variable. The reference group for the dummy for professional STEM was other STEM graduates. Standard errors are clustered by graduation year and higher education institution. *p < 0.05, **p < 0.01, ***p < 0.001.
The outcome ‘strong overeducation’ equals 100 if the graduate responded that higher education was irrelevant for the work or that higher education was not required for the work. The outcome ‘mild overeducation’ equals 100 if the graduate responded that the work required higher education, but at a lower level than the master’s level. The regressions include year fixed effects and controls for grades from upper secondary, higher education, gender, immigration status, parental education, marital status, care for children, age, relevant work experience and type of university.
Concluding Remarks
STEM education is considered especially important for fostering innovation and economic growth, and there has been a steady increase in the number of graduates in recent decades. On average, graduates in STEM fields benefit from high employment rates, reflecting the demands of an increasingly innovation-driven society.
In this paper, we contrasted the transition of graduates with professional degrees to graduates with other STEM degrees. Professional STEM graduates outperformed other STEM graduates on all three measures of labour market mismatch: unemployment, overeducation and horizontal mismatch. The result is consistent with other studies finding differences across subgroups within the STEM degrees (Smith and White, 2019; Støren et al., 2019; Xue and Larson, 2015) and consistent with occupation-specific skills providing an advantage in the labour market.
Our results further suggest that the advantage of a professional STEM degree weakened when the general unemployment rate increased. This result corresponds to previous research that did not find the same protective effect for unemployment for professional STEM degrees as for other professions (Drange, 2016). This result is consistent with a comparative advantage held by generic skills during economic downturns (Heijke and Meng, 2006; Muhamad, 2012).
Although our point of departure is the Norwegian context, where some STEM degrees are considered professional degrees, a similar distinction between different types of STEM degrees could apply to a larger range of countries. The distinction between professional STEM degrees and other STEM degrees overlaps with other possible distinctions capturing the relative emphasis on occupation-specific and generic skills, such as applied and pure subjects (Biglan, 1973) or ‘soft’ and ‘hard’ STEM fields.
Our results are also relevant beyond the STEM fields, as the distinction between occupation-specific and generic skills extends beyond the STEM degrees. Moreover, the finding that the relative advantages of different degrees were sensitive to the associated economic conditions contributes to the general research field of transition from higher education to the labour market. Our results suggest that researchers should be careful about generalising findings from pure cross-sectional comparisons to different economic conditions.
Higher education institutions are sometimes blamed for emphasising skills that are not demanded by employers (Garcia-Aracil et al., 2004). The present study investigated this claim from the perspective of graduates. In contrast to existing studies, we focused on the differences in propensity of occupation-specific skills driven by different study programmes rather than self-reports about the relative strength of occupation-specific and generic skills. Our results suggest that there is no straightforward answer to the question of the relative importance of occupation-specific and generic competencies. Our findings suggest that professional degrees had an advantage within their own field but not necessarily in the general labour market. As the graduates of tomorrow will fill jobs not known today, we cannot conclude that professional STEM graduates will fare better than other STEM graduates.
Limitations
This study investigated labour market outcomes six months after graduation and thus the immediate transition from education to the labour market. In such a short time after graduation, graduates have had relatively limited opportunities to acquire their preferred job, especially in periods when the labour market was slack. The comparison of professional and non-professional STEM degrees may be sensitive to the time since graduation if, for instance, the advantage of generic skills takes more time to manifest in the labour market than that of occupation-specific skills. Existing research suggests that graduates from generic degrees have a higher likelihood of being overeducated in their first job than graduates from applied degrees. However, this gap decreases over time, indicating that graduates with general degrees adapt to and develop their careers over time (Verhaest and Van der Velden, 2013).
Footnotes
Declaration of conflicting interests
The author(s) declared no potential conflicts of interest with respect to the research, authorship, and/or publication of this article.
Funding
The author(s) disclosed receipt of the following financial support for the research, authorship, and/or publication of this article: The project is based on data collected and analysed by NIFU as part of the Norwegian Graduate Survey financed by the Norwegian Ministry of Education. NIFU is an independent research institution, and the Ministry of Education has no influence on the publication based on the survey data.
Data availability
Data from each cohort included in the Norwegian graduate survey are archived and made available for research purposes through the Norwegian Centre for Research Data (NSD).
Notes
Appendix
The outcome ‘unemployed’ equals 100 if the graduate was unemployed in the reference week of the graduation year. The control variable for the unemployment rate is the unemployment rate for all master’s degree holders in the labour market. The regressions include year fixed effects and controls for grades from upper secondary, higher education, gender, immigration status, parental education, marital status, care for children, age, relevant work experience and type of university.
The outcome ‘overeducation’ equals 100 if the graduate had a job that did not require a master’s degree in the reference week of the graduation year. The control variable for the unemployment rate is the unemployment rate for all master’s degree holders in the labour market. The regressions include year fixed effects and controls for grades from upper secondary, higher education, gender, immigration status, parental education, marital status, care for children, age, relevant work experience and type of university.
The outcome ‘horizontal mismatch’ equals 100 if the graduate had a job in which the content of the work did not match the content of the education in the reference week of the graduation year. The control variable for the unemployment rate is the unemployment rate for all master’s degree holders in the labour market. The regressions include year fixed effects and controls for grades from upper secondary, higher education, gender, immigration status, parental education, marital status, care for children, age, relevant work experience and type of university. Response distribution to question defining horizontal mismatch and overeducation (vertical mismatch). Source: Norwegian graduate survey. Own calculations. Note: The table shows the distribution of responses to the horizontal match question: ‘To what extent do you think the content of the education you completed in the spring of (graduation year) corresponds with the work you did in the job you had in (dates for week 46 in graduation year)?’ Graduates are considered horizontally mismatched if they answered, ‘not at all’. The table also shows the distribution of responses to the vertical match question: ‘How would you characterise the level of your work tasks compared to the level of the education you completed in the spring of (graduation year)?’ Graduates are considered overeducated if they answered one of the three last alternatives. Graduates who respond that the work requires education at a higher level are considered undereducation, but no such distinction is made in this paper. Unemployed graduates did not receive these questions. Professional STEM and unemployment. Stepwise inclusion of control variables (linear probability regression). Source: Norwegian Graduate Survey. Own calculations. Note: The table reports the coefficient and standard error of linear probability regressions with graduate unemployment as the outcome variable using model specification 1. The reference group for the dummy for professional STEM was other STEM graduates. ‘Traditional university’ is the excluded category for the type of institution. Standard errors are clustered by graduation year and higher education institution. *p < 0.05, **p < 0.01, ***p < 0.001. Professional STEM and overeducation. Stepwise inclusion of control variables (linear probability regression). Source: Norwegian Graduate Survey. Own calculations. Note: The table reports the coefficient and standard error of linear probability regressions with overeducation as the outcome variable using model specification 1. The reference group for the dummy for professional STEM was other STEM graduates. ‘Traditional university’ is the excluded category for the type of institution. Standard errors are clustered by graduation year and higher education institution. *p < 0.05, **p < 0.01, ***p < 0.001. Professional STEM and horizonal mismatch. Stepwise inclusion of control variables (linear probability regression). Source: Norwegian Graduate Survey. Own calculations. Note: The table reports the coefficient and standard error of linear probability regressions with horizontal mismatch as the outcome variable using model specification 1. The reference group for the dummy for professional STEM was other STEM graduates. ‘Traditional university’ is the excluded category for the type of institution. Standard errors are clustered by graduation year and higher education institution. *p < 0.05, **p < 0.01, ***p < 0.001.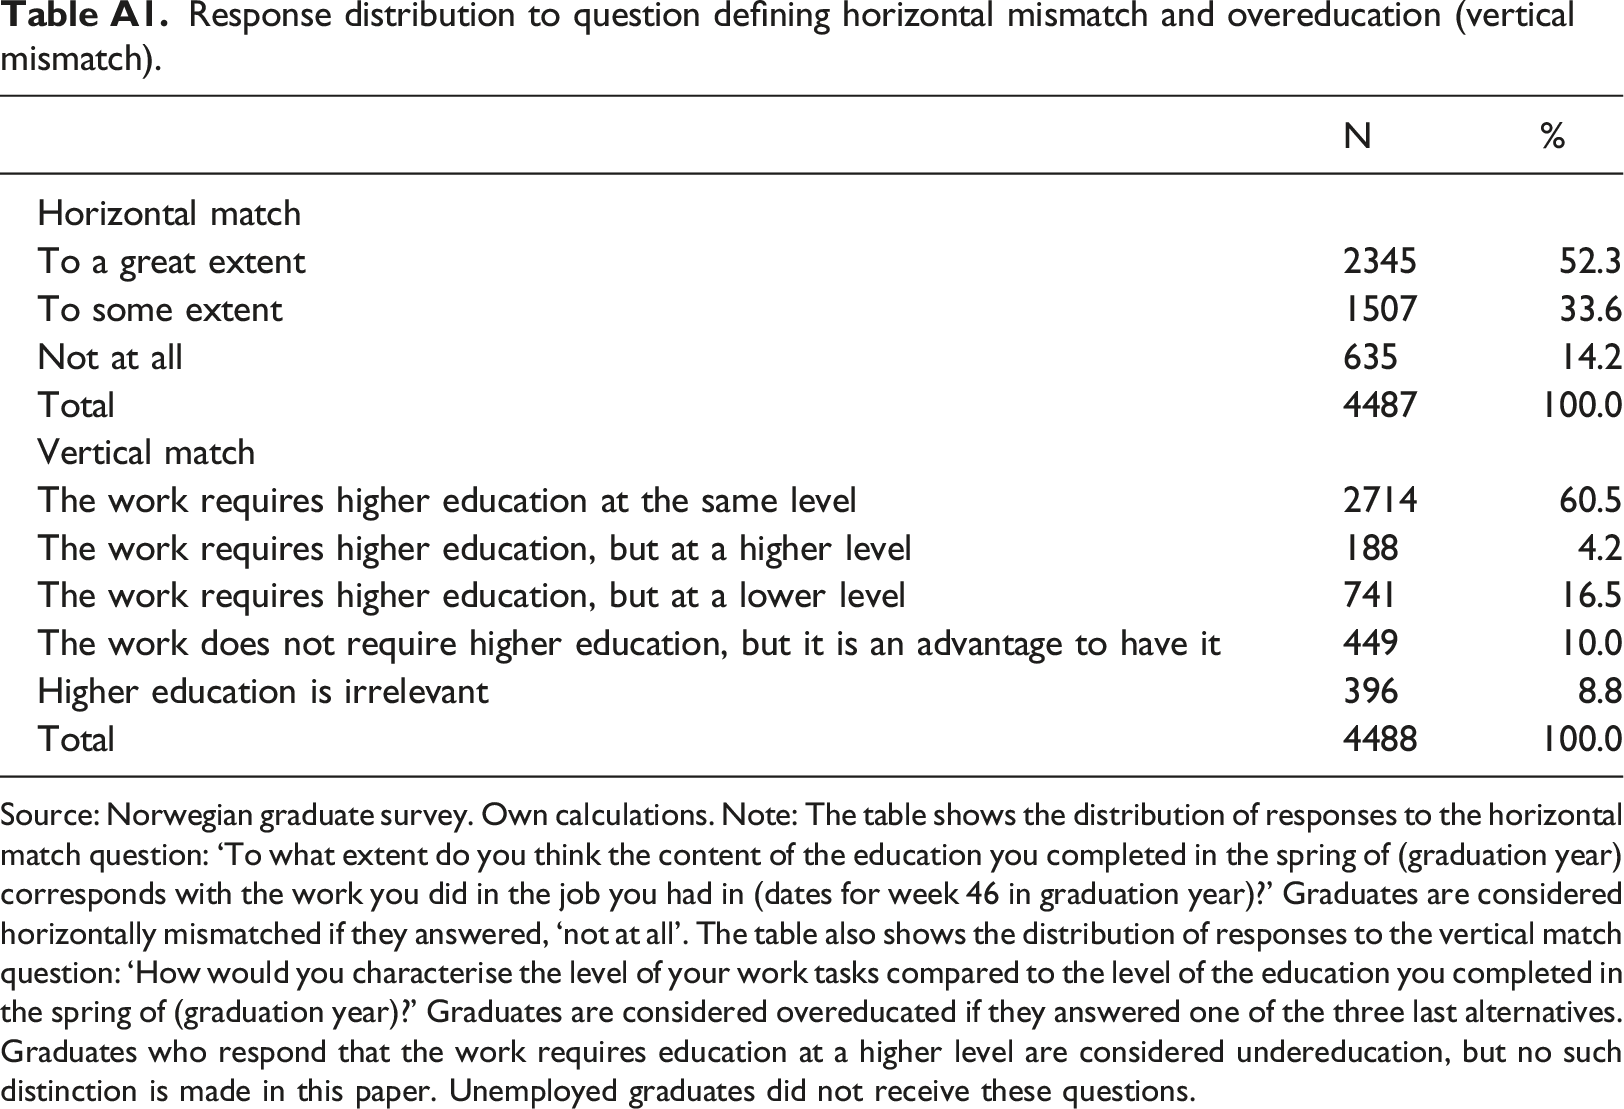
N
%
Horizontal match
To a great extent
2345
52.3
To some extent
1507
33.6
Not at all
635
14.2
Total
4487
100.0
Vertical match
The work requires higher education at the same level
2714
60.5
The work requires higher education, but at a higher level
188
4.2
The work requires higher education, but at a lower level
741
16.5
The work does not require higher education, but it is an advantage to have it
449
10.0
Higher education is irrelevant
396
8.8
Total
4488
100.0
(1)
(2)
(3)
(4)
(5)
Coef./se
Coef./se
Coef./se
Coef./se
Coef./se
Professional STEM
−2.46**(0.89)
−2.67**(0.91)
−2.13*(0.87)
−3.82***(0.86)
−3.26**(1.06)
New universities
−1.44(0.83)
−1.42(0.86)
−1.79*(0.80)
−1.03(0.83)
−1.70(0.94)
University college or scientific university
−0.40(2.75)
−0.25(2.85)
−2.35(2.33)
−2.79(2.53)
−0.55(2.44)
Top grades secondary
−2.51**(0.79)
−3.13***(0.74)
−1.79*(0.76)
−1.68*(0.75)
Relevant work experience
−5.71***(0.87)
−6.70***(0.86)
−6.20***(0.81)
−5.62***(0.83)
Female
−1.73(1.05)
−1.87(0.99)
−2.50*(1.02)
At least one parent with higher education
−0.87(0.87)
−0.59(0.89)
−0.24(0.92)
Age at graduation (centred)
0.29*(0.12)
0.24(0.13)
0.25(0.13)
Care for child(ren)
−0.87(1.75)
−0.95(1.73)
−1.12(1.67)
Married/cohabitant
−3.04***(0.86)
−2.59**(0.84)
−2.58**(0.83)
Immigrant
16.53***(1.95)
15.88***(1.96)
15.42***(1.91)
Grade B
4.04***(0.94)
4.60***(0.93)
Grade C
9.20***(1.38)
10.48***(1.37)
Grade D/E
15.85***(3.02)
16.80***(3.09)
Not awarded grade
20.88(11.49)
23.32*(11.04)
Physics and chemistry
−0.41(2.04)
Mathematics and statistics
−5.35*(2.08)
Information and computer technology
−4.97** (1.85)
Electric/electronic, mechanical and machine subjects
−4.91* (2.14)
Earth sciences
−5.93* (2.28)
Building and construction
−7.94*** (1.59)
Manufacturing and extraction
−6.35 (4.11)
Other narrow field
0.53(2.61)
Constant
9.67***(1.26)
10.24***(1.33)
14.14***(1.59)
7.28***(1.70)
11.09***(2.39)
R-squared
0.018
0.027
0.062
0.076
0.085
N
5021
5021
5021
5021
5021
(1)
(2)
(3)
(4)
(5)
Coef./se
Coef./se
Coef./se
Coef./se
Coef./se
Professional STEM
−2.74*(1.17)
−1.92(1.25)
−1.47(1.29)
−4.41**(1.42)
−2.59(1.88)
New universities
5.23***(1.52)
4.08**(1.54)
3.15*(1.55)
4.37**(1.62)
4.12*(1.59)
University college or scientific university
6.06(4.63)
5.47(4.47)
5.14(4.52)
7.90(4.79)
14.41**(4.64)
Top grades secondary
−7.34***(1.25)
−5.71***(1.29)
−3.27*(1.37)
−2.30(1.37)
Relevant work experience
−0.91(1.66)
−2.04(1.84)
−1.14(1.84)
−0.34(1.73)
Female
0.19(1.80)
−0.16(1.77)
−0.59(1.71)
At least one parent with higher education
−5.69***(1.36)
−5.08***(1.34)
−4.31**(1.38)
Age at graduation (centred)
0.46*(0.20)
0.38*(0.19)
0.40*(0.19)
Care for child(ren)
1.67(2.74)
1.39(2.64)
0.74(2.67)
Married/cohabitant
−0.39(1.21)
0.48(1.14)
0.82(1.18)
Immigrant
−9.20***(1.94)
−9.75***(2.02)
−10.88***(2.00)
Grade B
8.87***(1.63)
9.71***(1.62)
Grade C
16.90***(1.97)
18.85***(1.90)
Grade D/E
25.40***(4.67)
26.58***(4.41)
Not awarded grade
−8.67(4.50)
−1.93(5.51)
Physics and chemistry
−4.31(2.36)
Mathematics and statistics
−6.48(3.96)
Information and computer technology
−5.14*(2.51)
Electric/electronic, mechanical and machine subjects
−6.34*(3.02)
Earth sciences
−1.75(3.30)
Building and construction
−18.70***(2.51)
Manufacturing and extraction
1.10(7.00)
Other narrow field
−3.96(3.42)
Constant
30.57***(1.99)
33.45***(2.12)
38.42***(2.39)
25.39***(2.88)
30.38***(3.45)
R-squared
0.006
0.012
0.020
0.037
0.050
N
5021
5021
5021
5021
5021
(1)
(2)
(3)
(4)
(5)
Coef./se
Coef./se
Coef./se
Coef./se
Coef./se
Professional STEM
−6.06***(0.93)
−6.35***(0.98)
−5.81***(1.05)
−7.87***(1.13)
−7.20***(1.15)
New universities
1.71(1.26)
1.72(1.30)
1.10(1.33)
1.97(1.41)
2.13(1.34)
University college or scientific university
−3.75
−3.53
−4.10
−2.54
2.14
(2.76)
(2.55)
(2.60)
(2.63)
(2.93)
Top grades secondary
−3.56***(0.91)
−3.11**(0.97)
−1.39(0.97)
−0.92(0.96)
Relevant work experience
−8.09***(1.05)
−8.72***(1.07)
−8.12***(1.03)
−7.24***(1.00)
Female
1.02(1.09)
0.82(1.06)
0.10(1.09)
At least one parent with higher education
−2.20**(0.82)
−1.79*(0.80)
−1.29(0.79)
Age at graduation (centred)
0.26(0.15)
0.20(0.14)
0.21(0.13)
Care for child(ren)
1.99(1.63)
1.78(1.60)
1.45(1.65)
Married/cohabitant
−1.91*(0.86)
−1.32(0.82)
−1.27(0.82)
Immigrant
−1.07(1.71)
−1.54(1.77)
−2.42(1.78)
Grade B
6.29***(1.09)
7.00***(1.06)
Grade C
11.37***(1.73)
12.89***(1.66)
Grade D/E
20.67***(3.60)
21.50***(3.55)
Not awarded grade
−1.40(2.33)
2.06(3.05)
Physics and chemistry
—
−1.61(2.15)
Mathematics and statistics
−6.64**(2.21)
Information and computer technology
−7.24***(1.78)
Electric/electronic, mechanical and machine subjects
−4.36*(2.16)
Earth sciences
−1.35(2.30)
Building and construction
−12.25***(1.81)
Manufacturing and extraction
−11.83**(4.10)
Other narrow field
−2.32(2.20)
Constant
11.00***(0.99)
11.81***(1.12)
14.73***(1.49)
5.55**(1.83)
9.77***(2.39)
R-squared
0.016
0.031
0.034
0.051
0.065
N
5021
5021
5021
5021
5021