
Abstract
We examine how race, sex and poverty contribute to the likelihood of attending two- and four-year colleges in Chicago and Toronto. In each city, we use longitudinal data on high school students and their postsecondary trajectories in order to explore how race and sex may impact differentially upon their educational pathways. Our analyses are informed by an intersectionality perspective, wherein we understand that life chances are shaped by the various traits and identities that individuals possess. In Toronto, Black males are less likely than all other groups to attend four-year colleges. We also find that two-year colleges appear to fulfill a different role in Toronto than they do in Chicago; that is, serving populations who may have been tracked into non-academic course selections in high school. We contextualize our findings within the very different political, cultural, and historical contexts of Ontario and Illinois.
Postsecondary education is increasingly seen as the clearest path to the middle class; however, postsecondary enrollment remains uneven across sex, race and class (US Department of Education, National Center for Education Statistics, 2016). In this paper, we examine the determinants of transitioning to postsecondary education (PSE) in both Toronto and Chicago, with a particular focus on student risk characteristics. We ask “How do the determinants of going on to PSE differ for students in Toronto and Chicago?” More specifically, we examine how the different combinations of sex, race, and class contribute to PSE transitions in both urban centers, focusing on the similarities and differences in these factors between cities. Our approach aligns with an “intersectionality” perspective, which understands life chances to be strongly tied to the intersections of sex, race, and class (Collins, 2015). We also use contextual factors of each city to unpack why certain differences exist and to formulate suggestions around improving the PSE prospects of marginalized youth.
While comparative research on student achievement is plentiful, the vast majority of such research focuses on between-country differences. Inclusion of Canada in such comparisons is difficult due to the lack of a federal educational regulating body. Matters of education in Canada have historically been delegated to jurisdictions – and therefore there are 13 different provincial/territorial governing bodies for education. In cross-national comparisons, it is complicated to compare other countries with Canada for this specific reason. Given that Toronto and Chicago are the fourth and fifth largest cities in North America, respectively, city-to-city comparisons here are not only reasonable, but quite possibly ideal.
Toronto and Chicago contexts
Chicago and Toronto are both large urban centers in North America, situated approximately 500 miles from each other, with each hugging a coast line of a Great Lake and sharing international reputations of being diverse, vibrant urban areas. The cities are separated by an international border, which brings with it considerable difference in history and political context. It is the close physical proximity and similar sizes of these two cities, as well as their existence under very different socio-political conditions, that makes a comparison of youth PSE outcomes particularly compelling.
How comparable are the two cities? Both cities have been major economic centers since the mid-1800s, with French explorers settling the areas in the 1700s, and both areas experiencing similar English/French conflicts and colonization of lands traditionally occupied by Indigenous peoples. The first European settlers arriving in the 1700s were mostly from Britain and later Ireland, with some immigration later from Germany, the Netherlands, and Sweden. However, culturally, the development of both cities saw significantly different trends. In the 18th and 19th centuries, Toronto was the center of what was known as Upper Canada/Canada West, the political flagship of English interests in Canada, while Chicago was located at the periphery of the American Civil War. Canada remained (and continues to remain) a British colony while the War of 1812 effectively removed British control from contested territories in what are now called Michigan and Illinois. Culturally, the countries developed differently as a result of British interests, with Canada experiencing larger British cultural colonial influences (see Robson, 2013 for detailed accounts of the history of education in Canada).
The forced migration of Afro-Caribbean slaves to the shores of Virginia also explains the starkly different demographic profile in the US and Canada in general, whose descendants constitute the considerable African American population observed in Chicago and beyond. The 2010 US census indicated that around 33% of the population of Chicago was Black. Whites were around 45%, while the third largest group was Latino/Hispanic at just under 29% (United States Census Bureau, nd). Just under 21% of Chicago residents were foreign-born (United States Census Bureau, nd). In comparison, the immigration history in Canada is rather different, resulting in just over half of Toronto residents being born in a different country (City of Toronto, 2013). Also, around half of Toronto residents report being a “visible minority” – a term used by Canada’s statistical agency to denote those who are not White (Statistics Canada, 2014a). 1 By default, Whites are around half of the population. The largest visible minority group in Toronto is South Asian (12%), followed by Chinese (11%) and Black (9%). Also of cultural significance is that although slavery did exist to some extent in Canada (slavery was abolished in 1833 by the British Parliament for the whole British Empire), Black Canadians (or their descendants) are much more likely to be voluntary migrants from the Caribbean rather than the descendants of slaves.
Although demographically distinct in terms of race and immigration status, the latest census estimates from both cities indicate the populations of both cities is around 2.7 million, when the focus is on the immediate urban Toronto and Chicago areas. Similarly, each city has sizeable school district boards – around 112,000 students in high school in Chicago compared to 87,000 in Toronto’s public high schools. 2 Public school boards in both cities have considerable racial diversity. For example, public school populations in Chicago constitute 40% African American, 45% Hispanic, and 9% White (Chicago Public Schools, 2015). In Toronto, Whites make up the largest group (29%), followed by South Asians (24%), East Asians (15%), and Blacks (12%) (Yau and O’Reilly, 2007). In both cities, race and income are also strongly linked (Employment and Social Development Canada, 2013; Jargowsky, 2015). Even more telling is the proportion of children living in poverty in both cities in 2015, with the rate reported for Chicago being 34% (Annie E Casey Foundation, 2015) and the latest available rate (2012) for Toronto being 29% (Campaign 2000, 2015). Reflecting the residential segregation by race and income, Chicago schools are also notable for being highly segregated. For example, 60 of Chicago’s 141 high schools have student populations that include over 75% African American students. However, both cities have distinctly different histories, political landscapes, and education policies.
Differing PSE landscapes of the USA and Canada
In terms of PSE in Canada and the United States, there are important differences that must be explicated. In Canada, PSE is divided into universities, which grant degrees, and colleges, which grant diplomas, although more colleges are becoming degree-granting over time. There are 98 universities in Canada, and the vast majority of them are publicly funded through a combination of federal and provincial monies. A handful of private universities operate in Canada, but have only come into existence recently (Birchard, 2008). Most importantly, private universities in Canada do not have the significant status attached to them that they do in the US context – and are mostly characterized by religious affiliation. Postsecondary tuitions in Canada vary across the country, but the most recent estimates from Statistics Canada indicate the average is approximately CN$6000 per year (Statistics Canada, 2014b). And while the “reputation” of universities is certainly measured by international league tables (see, for example, Times Higher Education’s World Reputation Rankings), Canadian research has shown that reputation factors little into undergraduate choice (Drewes and Michael, 2006), with proximity to familial home and scholarships being the strongest predictors of where students end up going to study. However, Davies et al. (2014) found that in Toronto, Asian females from affluent backgrounds were more likely to go to better-resourced and higher-ranked universities, while Black males were unlikely to attend such institutions.
Similarly to Canada, the USA has the two-year community college track and the four-year undergraduate degree track, with the latter being offered at universities. For ease of comparison, we adopt American naming conventions, calling Canadian universities “four-year colleges” and Canadian community colleges “two-year colleges”. Public postsecondary institutions, subsidized by the state, are the less expensive option for most students. Private institutions are more plentiful in the US (over 1800 private 4-year universities) and it is these private universities that are often associated with small enrollments, elite status, and high tuitions. There are over 600 public 4-year universities and their tuitions vary according to residency status, with 2014 averages being around USD$9,800 for in-state students and almost US$23,000 for out-of-state students (College Board, 2015). Private non-profit universities had an annual price tag of over US$31,000. These costs for both Canada and the US do not include room and board.
Discursive differences in “race” between Canada and the USA
Our analyses which follow focus on how race, sex, and class interplay in determining the PSE pathways of students in Toronto and Chicago. We give disproportionate attention to the topic of race because of the scant Canadian work on this topic as it pertains to PSE (notable exceptions include Robson et al., 2014; Robson et al., 2018). Culturally, discussions of race have been an integral part of the political and social landscape of the United States. This, however, is not the case in Canada. Within sociology, Ramos (2013) has noted slow but steady increase in the discussion of “race” emerging in the literature over the last four decades, noting that traditionally, Canadian sociology has preferred to discuss “ethnicity” – a term that is more tied to culture. The emphasis on “ethnicity” can also be traced back to federal government legislation, which included the Federal Multicultural Policy of 1971 and the inclusion of race and ethnicity as protected from discrimination in the Canadian Charter of Rights and Freedoms (Ramos, 2013). According to Multiculturalism Policy, Canadian multiculturalism is fundamental to our belief that all citizens are equal. Multiculturalism ensures that all citizens can keep their identities, can take pride in their ancestry and have a sense of belonging. Acceptance gives Canadians a feeling of security and self-confidence, making them more open to, and accepting of, diverse cultures. The Canadian experience has shown that multiculturalism encourages racial and ethnic harmony and cross-cultural understanding. (Citizenship and Immigration Canada, nd)
Canadian research has never been a hotbed of discussion on “race” – and indicators of race are absent in most national datasets, instead relying on the “visible minority” definition created for the 1981 census, which ostensibly has three categories: visible minority (i.e. not White), nonvisible minority (White), and Aboriginal. The severe limitation of such a conceptualization has been written in detail by Bauder (2001), who correctly notes that creating a White/non-White dichotomy creates a White benchmark that does not make sense in urban areas where Whites are not a majority (like Toronto). Canadian race scholar Carl James (2011a, 2011b) has argued that the lack of race-based data in Canada serves to cloud the race-based patterns that exist in all areas of social stratification and that the “ethnic harmony” referred to in the above quote from multiculturalism policy is far from a reality. The limited Canadian research that does exist on race and PSE in Canada has illustrated stark disparities in enrollment, particularly around the limited social mobility of Black males (Robson et al., 2014; Robson et al., 2018).
Schick and St Denis (2005) argue that the “celebration” of multiculturalism in Canada has given way to rhetoric that Canada is “raceless” and without prejudice. Roman and Stanley (1997) coined the term “Canada the Redeemer” which describes the type of discourse that presupposes Canada as a safe haven from the perceived racism in the United States. This discourse assumes Canada has always been a fair country, particularly because of the belief that slavery of Blacks did not occur in Canada (although it did, but was made illegal in the British Empire in 1834). Discussions about race are often seen as impolite or taboo, and reference to racism is often regarded as being “something that happened in the past” (Roman and Stanley, 1997), or happens primarily in the United States. Backhouse (1999: 14) asserts that Canada has an “ideology of racelessness” which is at the very core of its identity as being a nonracist country. While a thorough analysis of the reasons behind the reluctance of the Canadian government to measure race, and the population to talk about race, is well beyond the scope of this text, it is important to note that these important national differences exist between the US and Canada.
The overt attention that race has in American discourse and the subdued nature by which it has been given attention in Canada make it difficult to hypothesize how we expect city differences to appear. If the policy of multiculturalism has been successful, it is expected that racial minority youth would have the same opportunities for upward social mobility opportunities as their White counterparts. If the overt discussion of race and racism in the US is indeed indicative of its increased prevalence, then it would be expected that racial minorities are not entering PSE at the same rates as majority students. However, these theses are based upon the assumption that the discourses around racism and multiculturalism are accurate representations of their actualized reality in society, which is not necessarily the case. Thus it is our objective to explore these possible hypotheses as they correspond to national characters described above.
Determinants of PSE in Canada and the USA
There is a considerable body of literature that examines the correlates of going on to PSE. In Canada, a detailed overview of the predictors of PSE have been detailed by DeBrouker (2005) and Cheung (2007). One of the most important determinants of going on to two-year college or four-year college is the financial status of a child’s family, with children from high-income families having double or triple likelihoods of attending compared to those from low-income families. However, other factors have proven to be as important, if not more important, than income. Parental education and parental influence have been found to be strong markers of whether children will go on to PSE (De Brouker, 2005). Finnie et al. (2008) found that parental education was strongly associated with other correlates of PSE transition, such as educational aspirations and grades. This also ties into the idea of the importance of parental expectations, which have been found to be strongly associated with PSE attendance (Barr-Telford et al., 2003).
In the Canadian landscape, having been identified with a special education need has been found to be negatively associated with going on to PSE, particularly if from a low-income household (Robson et al., 2014). Similarly, “streaming” or “tracking” – where it exists either formally or informally – is also inextricably linked to the pathways of young people (Krahn and Taylor, 2005), limiting the post-high school pathways of students placed in nonacademic streams early on. Children placed in nonacademic streams in middle school are far less likely to go on to PSE.
While federal data sources provided limited ability to study racialized students in any meaningful way (due to the concept of “visible minority” as described above), Krahn and Taylor (2005) have noted that first- and second-generation immigrant students have higher rates of transition to PSE, likely due to their parents’ higher expectations, often referred to as the “immigrant drive” (Anisef et al., 2000). In a related note, a study of economically deprived children in Chicago (Ou and Reynolds, 2014) found that parental expectations and academic achievement were predictors of postsecondary attainment of minority children. In analyses of Toronto data, Robson et al. (2014) found that while South Asian and East Asian students have higher likelihoods of going on to PSE, Black students – Black males in particular – were very unlikely to go on to two- or four-year colleges compared to those in other ethno-racial categories.
While Canadian studies are limited by the absence of easily accessible longitudinal data sets on youth (results reported are largely drawn from Statistics Canada Youth in Transition data, which have recently been discontinued and only represent specific cohorts), US researchers enjoy a range of publically accessible, nationally representative longitudinal data sources. Marginalized groups that are focused upon in US studies are often African American and Latino/a/x-origin populations. Bachmeier and Bean (2011) have argued that the low PSE attainment rate for Latino/a/x-origin immigrants is due to a cultural tradition favoring work over schooling. Using the Chicago Public Schools data, Roderick et al. (2006, 2008) found a sizable gap between those who had aspired to graduate from a four-year college and those who had actually done so. This was largely due to their relatively low grades and test scores and was particularly pronounced among Latinos. Enrollments into four-year college programs have been found to be negatively associated with being Black, low-income, and/or having witnessed extreme violence (Balfanz et al., 2016; Fry, 2011; Milesi et al. 2010; Reardon et al., 2012; Roderick et al., 2011). However, given their academic qualifications, Black students in Chicago were more likely to enroll in four-year colleges than expected; this may be due to their likelihood of enrolling in Historically Black Colleges and Universities (HCBU) which often base admissions on a broader set of criteria than qualifications (Roderick et al., 2006). A large difference between enrollment at two- and four-year colleges has been observed, with the former having open-admissions policies. The disadvantages preventing acceptance (low grades) to a four-year college do not apply here, although many two-year college students are less successful at adapting to the demands of PSE and have a higher risk of dropping out. For example, findings from Roderick et al. (2008) showed that the nature of poverty is indeed different in the Latino and Black communities, with Latino students living in less extreme poverty, but also having less access to the types of social capital that are associated with college enrollment such as having college-educated parents and supportive guidance counselors and teachers.
Theoretical orientation
We employ an intersectionality approach to compare and contrast PSE transitions of youth in Chicago and Toronto. This perspective is based on the premise that individuals’ combinations of characteristics (e.g. including but not limited to race, sex, and social class) place them at the “intersection” of various “social groupings”). These combinations of characteristics, we argue, must be considered in analyzing the social mobility of students, particularly their transition to PSE. By recognizing the complexity and nuances and that various forms of oppression (e.g. racism, sexism) overlap, we are less likely to oversimplify the factors involved in accounting for PSE transitions in both cities and form unrealistic generalizations (Robson et al., 2014). While Collins (2015) acknowledges the definitional dilemmas experienced by those that employ intersectionality, she argues that there is a general consensus regarding the contours of the concept. Those employing intersectionality reference the “critical insight that race, class, gender, sexuality, ethnicity, nation, ability, and age operate not as unitary, mutually exclusive entities, but as reciprocally constructing phenomena that in turn shape complex social inequalities” (Collins, 2015: 2). Research studies that define groups in single-axis terms tend to generate artificial distinctions and limit our capacity to generate positive change for underrepresented groups in higher education.
Previous research studies in Toronto reveal that income, race, and gender are intimately linked when it comes to explaining the PSE pathways of students. For example, Black males were significantly less likely to attend university compared to other groups. Furthermore, students with special education needs were found to have limited postsecondary horizons and only those with sufficient economic resources stood a chance of attending a community college; very few went on to university. While each of the characteristics employed can be additive (that is, the more “risk” factors an individual possesses, the more likely s/he will confirm PSE), individuals were likely to be located at the various intersections of these identities (Robson et al., 2014). In Chicago, the dimensions of race and class play out differently among Black and Latino students. Black students are more likely to be living in census blocks with high concentrations of poverty than Latino students, while Latino students are more likely to live in neighborhoods that have lower levels of education and fewer professionals (Roderick et al., 2006).
Data and method
The data employed for Toronto are derived from a survey (often called the “Student Census”) administered from 6 to 10 November 2006, in all Toronto District School Board (TDSB) secondary schools and all Grades 7 and 8 in elementary schools. These data were the most recently available for analysis at the time of writing. A total of 289 Toronto schools were involved. After all the data were processed and verified, a student census database was created consisting of 34,219 students in Grades 7 and 8 and 71,222 students in Grades 9 to 12.
A specific subset of Student Census data was employed for the purpose of analyses in this paper and is based on 14,048 students who were surveyed in the census conducted in Fall 2006. These students were 17 years old – age-appropriate for Grade 12, the age at which most Ontario students start their transition to PSE. Added to these data were other pieces of information: data from the Fall 2006 Student Census completed by Grades 9-to-12 students in the TDSB on a range of socioeconomic, demographic, and attitudinal variables (see Brown, 2009); data from the 2001 Canadian Federal Census on household income (matched by postal code to the Census Dissemination Area of around 300 households); and data on postsecondary applications and confirmations as supplied to the TDSB by the Ontario University Applications Centre (OUAC) and Ontario College Applications Centre (OCAS).
The data employed regarding Chicago are derived from the data archive of the University of Chicago Consortium on School Research (Consortium). The Consortium has a long-standing data-sharing agreement with Chicago Public Schools (CPS) that contains complete administrative records for all students since 1992, including high school course transcripts; school enrollment history, transfer, and dropout data; and elementary and high school achievement test scores. The CPS data has been linked to the National Student Clearinghouse data that allows for tracking students to their postsecondary enrollment and graduation. The data archive also includes teacher surveys, student surveys for Grades 6 to 12, and a questionnaire on seniors’ post-high school plans. Students’ residential addresses and school addresses are used to link them to other sources, including the US Census and Chicago crime data. All CPS data are linked by student- and school-specific identification numbers. In both the Toronto and Chicago data, the analyses focus on 17-year-olds who are in Grade 12, regardless or not of whether they graduate high school.
Our analytic process had three stages: descriptive statistics, multinomial logistic regression 3 using race and sex as predictors, and a third stage which adds the interaction terms between race, class, and sex as well as the additional controls of grade point average (GPA) and special education needs. This last stage of exploratory interactions allows us to examine our intersectionality theory by allowing for analyses of different combinations of identity traits. The presence of a significant interaction indicates that the effect of one predictor variable on the response variable (e.g. attending four-year college) is different at different values of the other predictor variable. This is tested by adding a term to the model in which the two predictor variables are multiplied. We add the additional controls of special education needs and GPA in this final stage so as to not overstate the importance of the main variables of interest or their interactions. The estimation sample includes students who graduated high school and those who did not.
Operationalizing the concepts
We focus on the concepts of race, class, sex, and college (two- and four-year) attendance in these analyses. Because the data sources were derived independently of each other and for different purposes/populations, the operationalization of concepts is often different. We have attempted to “harmonize” the variables – that is, code them as similarly as possible – in order to make our results comparable. The necessarily requires compromise, as detail must be sacrificed in order to make variable coding identical.
Race
In the analyses below, the Toronto variable measuring race was recoded to more closely resemble the Chicago variable. The coding of the Chicago variable (as is typical in many US data sets) was: White, Black, Asian, Hispanic, and Other. The Toronto data set originally had much more detail, particularly around sub-categories of “Asian” (including South Asian, Southeast Asian, and East Asian), but these were recoded to be grouped together.
Sex
Males were dummy-coded in the analyses (1 = yes).
Class
We operationalize class by measuring if students were low-income. A dichotomous variable named “Poor” was created to indicate that the student lived in poverty (1 = yes). In Chicago, poverty was indicated by the student being in receipt of free or reduced-price lunches. Eligibility for free school meals in Chicago (and the United States in general under the National School Lunches Program; see Mirtcheva and Powell, 2009) during the study year was based on a household income of less than 185% of the poverty rate, which accounted for 85% of CPS students. In Toronto, this measure was derived from whether the student lived in a neighborhood where the average household income for a family of two parents with two children was less than CND $51,000, which was 185% of the CND $27,500 “low-income cut-off” for Toronto in 2006 (Campaign 2000, 2006). While there are no official poverty rates in Canada, the low-income cut-offs used by Statistics Canada (Campaign 2000, 2006) measure regional experiences of socioeconomic deprivation and accounted for approximately half of the Toronto sample. Both measures operationalize the general experience of economic deprivation relative to the general population and, in the case of free or reduced-price school meals, researchers have found a significant association between low income and eligibility (Hobbs and Vignoles, 2009).
Two- and four-year college attendance
In the Toronto data, college attendance was measured by information that was merged on from the Ontario postsecondary application centers, indicating if the student had “confirmed” an offer of two- or four-year college. Confirmation indicates the student was given an offer and had accepted it. In the Chicago data, enrollment at two- and four-year colleges was also available in the data. The reference category for this variable was “neither two nor four-year college”.
In Chicago, direct entry transition to colleges was measured. However, important educational historical and structural differences between Toronto and Chicago mean that most students finish high school four years after beginning 9th Grade but over a third return for a fifth year of secondary (often referred to as the “victory lap”; see Brady and Allingham, 2010), and around 5% return for a sixth school year. Most students who go to an Ontario two-year college will apply in Years 5 and 6, while most who apply for four-year colleges will do so in Year 4. We therefore operationalize three successive years of postsecondary applications, as the best measure of “direct” transition to an Ontario postsecondary institution (for 17-year-old students in 2006–2007, this uses the 2007, 2008, and 2009 application cycles). These three successive years will provide information for almost all students who go directly into postsecondary from secondary. 4
Control variables
While we are interested in the effect of race, class, and sex on PSE, we recognize a significant history of research in this area that has identified other important correlates. These include parental education, enjoyment of school, cultural capital, school achievement, and special education needs (Finnie et al., 2010; Robson et al., 2014; Sweet et al., 2010;). While the Toronto data contained information on parental education and enjoyment of school, the Chicago data did not (as the database is largely administrative), and thus we were limited in analyzing what was available in both data sets. Grade point average and special education needs, however, were available in both.
Grade point average
Grade point average in Grade 12 was measured in both data sets on a 4-point scale.
Special education needs
Whether or not the student had been identified as having an exceptionality (excluding gifted, a category of special education in Ontario) was contained in the administrative records of students in both data sets. Special education needs have been converted into a dichotomous variable where 1 is equal to having a special education need and 0 is equal to not having a special education need. The vast majority of these exceptionalities are students with an Individual Education Plan – otherwise known as “IEP without exceptionality.”
Results
Comparison of the general descriptive statistics across both cities starkly illustrates that we are presented with two very different demographics (Table 1). As suggested earlier in this paper, in both public school systems, racial compositions are quite different. For example, Blacks represented over half of the CPS and around 10% of the TDSB, while Asians were just under half (44%) of the TDSB but only around 5% of the CPS. Similarly, Latino/Latina students were around 33% of the CPS but only 2% of the TDSB. In terms of poverty, 78% of CPS students receive free school meals, while 45% of TDSB students were categorized as poor using a similar metric to CPS free school meal eligibility. The difference between the percentages of males in both cities is also noteworthy, with 42% in the CPS data and 51% of the TDSB data; this difference appears to reflect a greater number of male dropouts in CPS. We also observed that about 10% of students in the TDSB have been identified with a special education need compared to around 9% in the CPS and that the average GPA for TDSB students was around 2.5 while the corresponding figure for CPS is around 2.3.
Descriptive statistics.
Toronto (N = 13370), Chicago (N = 14194).
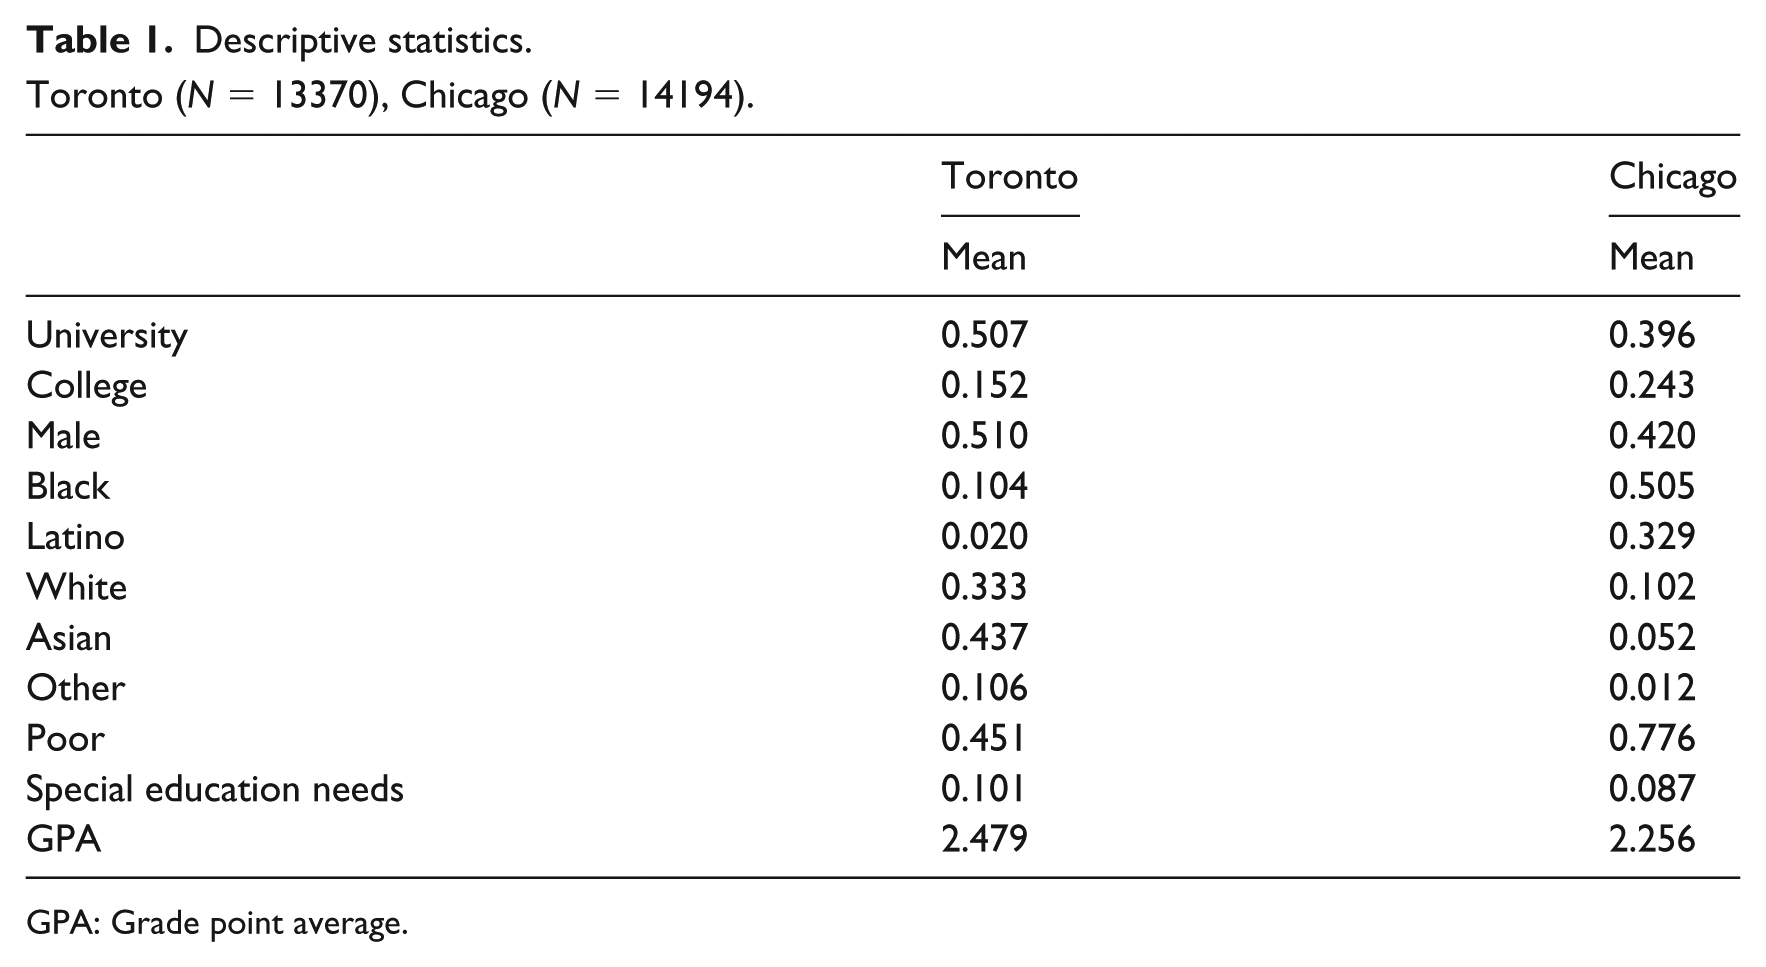
GPA: Grade point average.
The demographics of Chicago do not match the demographics of CPS. Around 45% of Chicago is White, but only 10% of CPS students are White, a finding that has been reported elsewhere (Moore, 2014). Only half of White students who are eligible to attend CPS actually do, while nearly 85% of Black students who are eligible to attend CPS do. The majority of White children get their education elsewhere – usually private school. And because income and race are so highly associated, it is not surprising that those who are “eligible” but do not attend CPS are disproportionately White, as private schools charge tuition fees. And while the demographics of Toronto described earlier in this paper do not exactly match the racial composition in the TDSB, there are no similarly stark distinctions between city and public school racial compositions.
Turning to multinomial logistic regressions, we present two models in Table 2. The first predicts college pathways on gender, race, and being poor. The second adds the interactions between race and sex, being poor and sex, as well as the controls of GPA and having a special education need.
Multinomial logistic regression of college pathways on predictors (Ref = no college). Odds ratios.
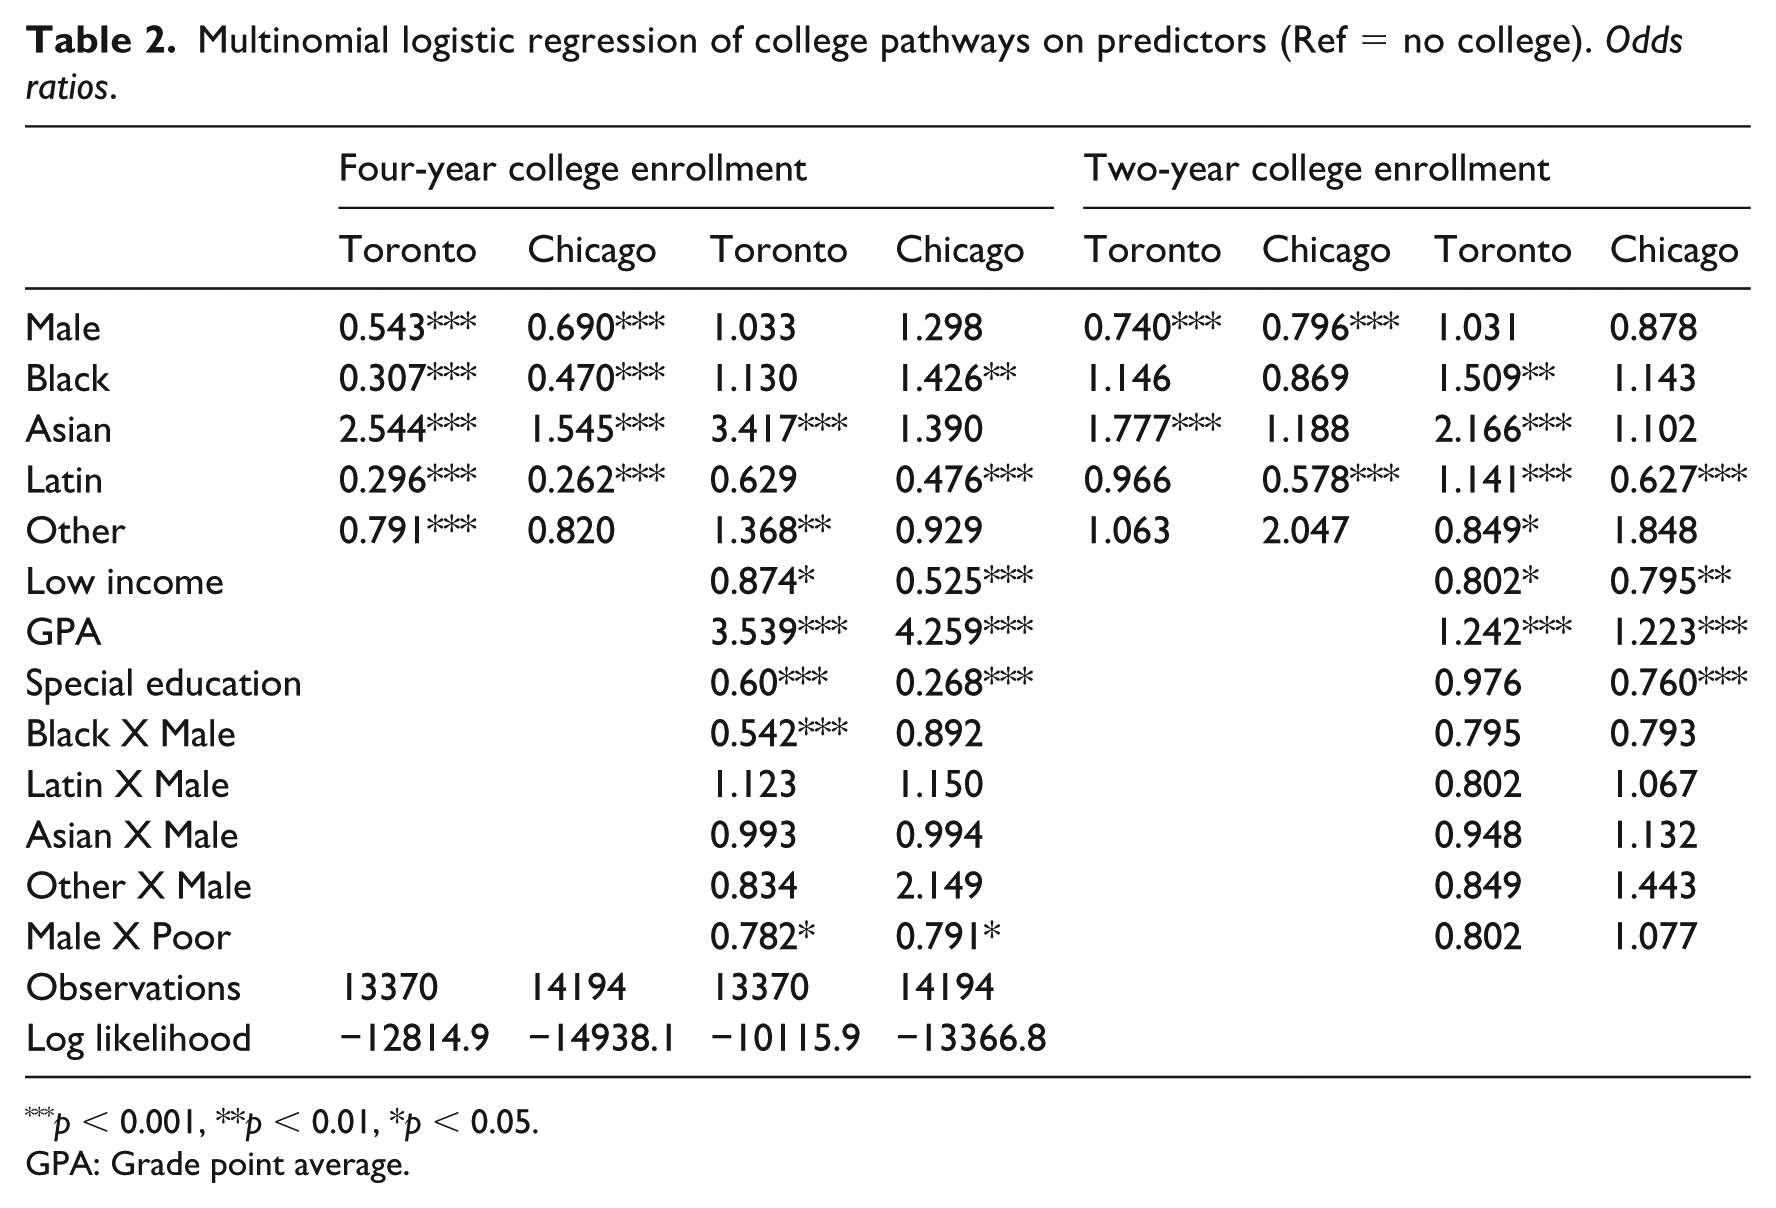
p < 0.001, **p < 0.01, *p < 0.05.
GPA: Grade point average.
Four-year college pathway
Comparing the odds ratios between cities in the first model, we can see males in both cities were less likely to go to four-year colleges than females, and that compared to Whites, Asians were much more likely to go in both cities – but more so in Toronto where they were 2.5 times more likely to go than Whites (the omitted reference category). In both cities, Latina/Latino students were significantly less likely to go to four-year colleges.
The second model added the controls and exploratory interactions. Both GPA and special education needs were strong predictors of four-year college attendance, in the expected directions. The interaction between Black X Male was significant in Toronto, controlling for GPA and special education needs. The interaction between male and low income was significant in both cities. However, because it is nearly impossible to “eyeball” the relationship expressed by the main effects and interactions in such models, it is more useful to create visualizations or refer to predicted probabilities of outcomes.
Figure 1 illustrates the probabilities of going to a four-year college based upon the estimations in the second model. In Figure 1, it is immediately obvious that the probability of going to a four-year college was higher in Toronto for all groups, except for Black males. In terms of discrepancies between the cities, there are marked differences in all groups, with the biggest differences seen in the Asian categories. The interactions that were significant signal that the slopes for Black males in Toronto were significantly different from the omitted category (White females). The predicted probabilities displayed in Figure 1 illustrate that White females were 10% more likely than Black males to go to four-year colleges. Looking at the corresponding bars for Black males and White females in Chicago, the gaps were not nearly as severe as in Toronto; in fact Black males are more likely to attend four-year colleges than White females.
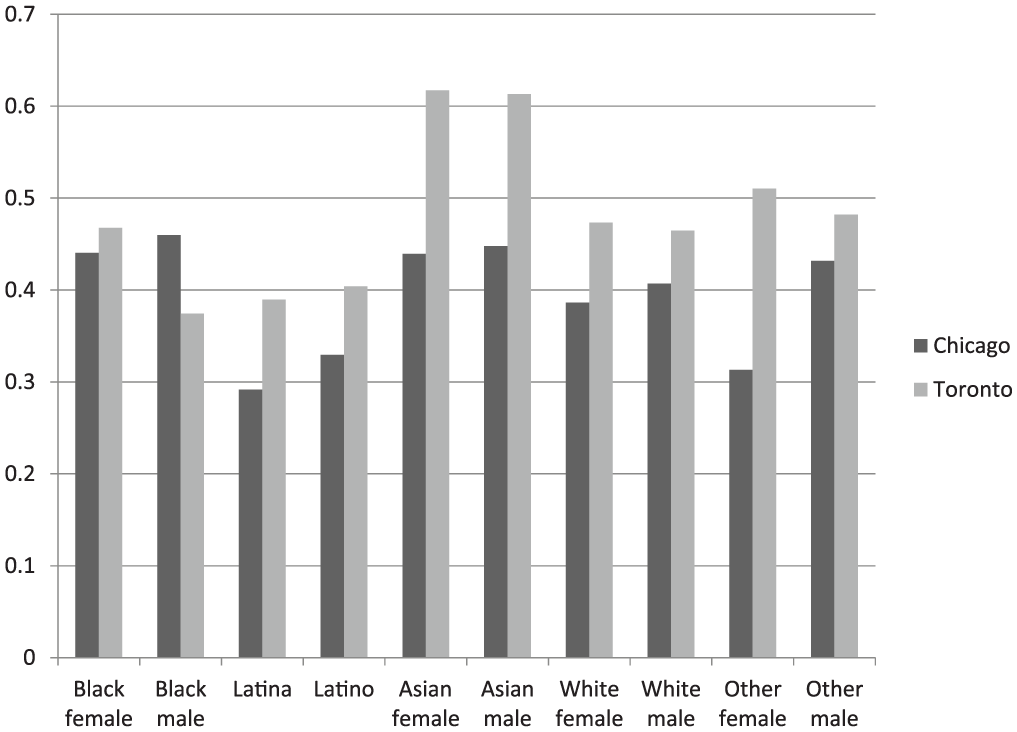
Predicted probabilities of enrolling in four-year college.
The significant interaction between being male and low-income in both cities demonstrates that the combination of sex and income created different probabilities of attending four-year colleges. In calculating predicted probabilities for these groups in both cities (not shown), Chicago males who were on free school meals had a 38% probability of attending a four-year college compared to a 53% probability among males who were not low-income. In contrast, there was a 46% probability for females who were not low-income compared to a 36% probability for females who were. Thus the gap in four-year college attendance between poor and not-poor males was wider than the gap between poor and not-poor females. In Toronto, the interaction between low income and sex was also significant. Males who were low-income had a 49% probability of attending a four-year college compared to a 55% probability for males who were not poor. In contrast, poor females had a 53% probability of attending a four-year college, compared to 55% among not-poor females, again demonstrating that poverty and sex interact in subtle ways to influence postsecondary pathways, with the effect being stronger for males.
Two-year college pathway
Turning to two-year colleges, in the first model we can see that males were less likely to attend compared to females in both cities (26% less likely than females in Toronto and around 20% less likely than females in Chicago). The results for race showed that in Toronto, Asians were around 78% more likely to go two-year colleges than Whites, while in Chicago, Latina/Latinos were around 42% less likely to attend than Whites. In both cities, being poor decreased the odds of going to two-year colleges. After adding exploratory interactions and controls, GPA was found to be positively associated with two-year college attendance in both cities, while having a special education was negatively associated with two-year college attendance in Chicago only. None of the exploratory interactions achieved statistical significance.
Figure 2 illustrates the predicted probabilities of attending a two-year college by race and sex. In all cases, the probabilities of attendance were higher in Chicago. The overall probabilities of attending two-year institutions were generally quite a bit smaller than for four-year institutions for all groups, apart from those in the “other” categories in Chicago. However, as “other” students constituted only 1% of the Chicago sample, drawing any kind of conclusions from such a finding would be a reach.
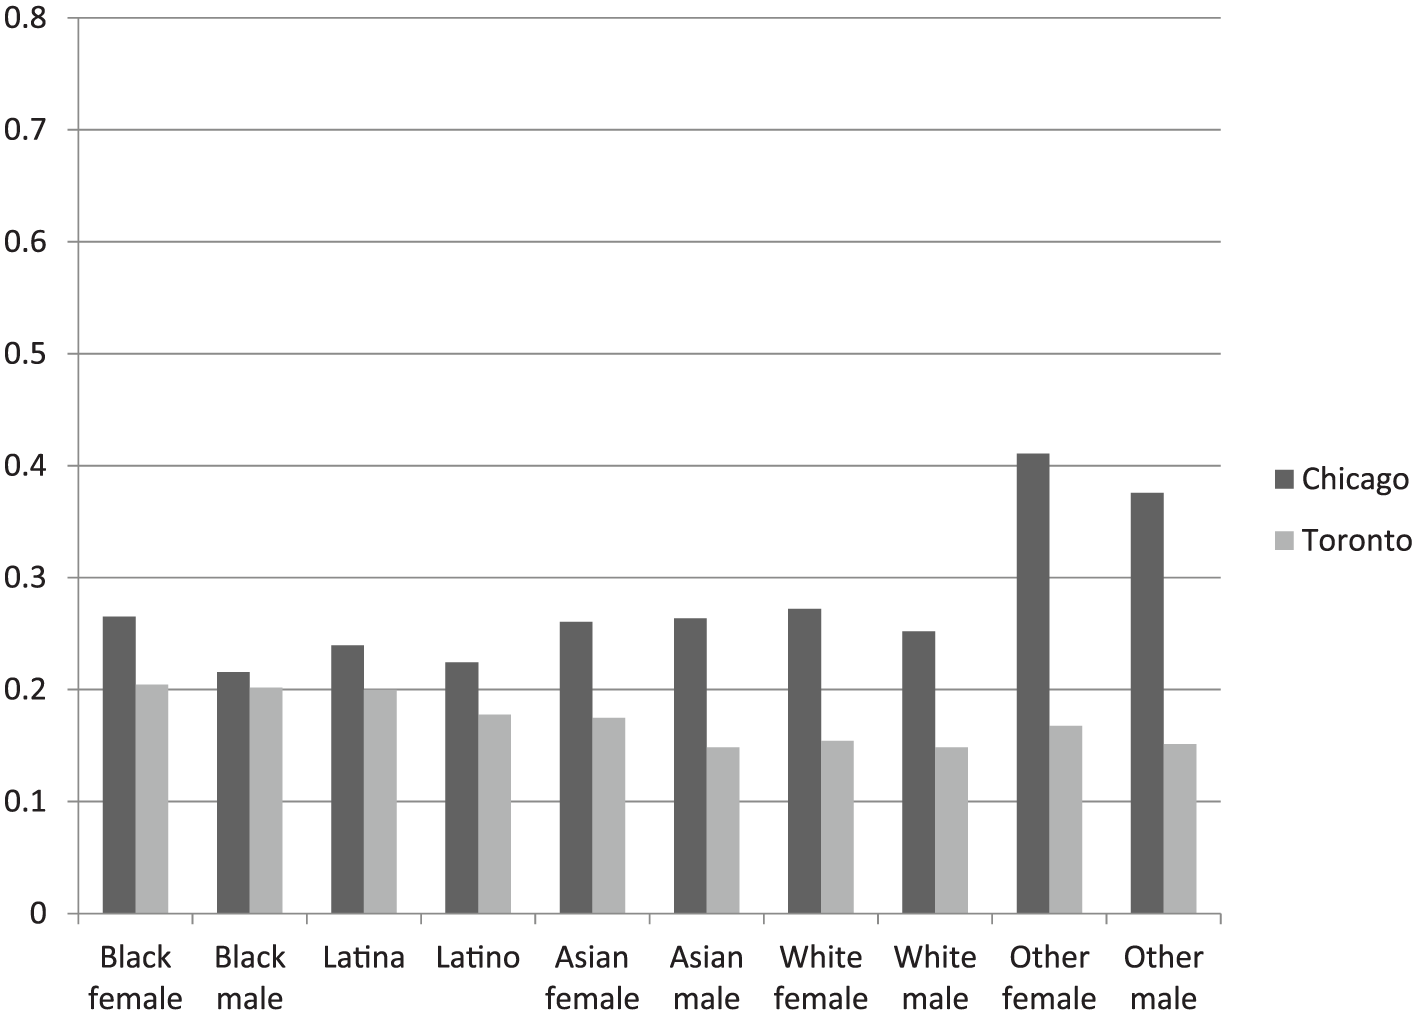
Predicted probabilities of enrolling in two-year college.
Discussion
Our major findings concern the markedly different odds of going to four-year colleges for Black males in both cities. Our analysis of four-year college enrollment found that Black males were less likely to attend than all other groups in Toronto. Looking at Figure 1, the probabilities of Black males going to four-year colleges were about 7% higher in Chicago compared to Toronto. The interaction between sex and poverty also demonstrated how being poor more negatively influenced postsecondary uptake for males than females. The findings speak to the importance of examining the combined traits of individuals (activating an intersectionality perspective), but also demonstrate the importance of location in determining life chances. In terms of two-year colleges, we found all groups more likely to attend in Chicago compared to Toronto, with the exception of Black males, where the predicted probabilities were nearly identical. We also found that special education needs were negatively associated with attending two-year colleges in Chicago, which was not the case in Toronto.
There are limits to our analyses, particularly given the small number of covariates for which we were able to find comparable measures in both data sets. The limitation of “harmonizing” variables across data sets must also be borne in mind, particularly with respect to measuring class status.
Also, being categorized as “Black” in the Chicago data set refers almost entirely to third- or higher-generation African Americans. In contrast, slightly over half of Black students in Toronto identify as Caribbean, a lesser proportion identifies as African, and a small minority identifies as “Black-Other” (Yau et al., 2011). Also, while around three-quarters of Black youth were born in Canada, most of their parents were not (Yau et al., 2011). Thus being Black in Toronto and Chicago can be seen as fundamentally different: in Toronto, this population is largely second-generation immigrants from the Caribbean or Africa, while in Chicago, the category “Blacks” refers largely to African American youth who have been in the country for generations. Thus it is necessary to take into consideration different cultural practices and immigrant experiences as the history of Caribbeans in Toronto is characterized by relatively recent arrival through domestic-class immigration (i.e. caregivers) and not the centuries-long habitation by slave descendants as in the case of the US.
It is challenging to explain the different findings with respect to four-year colleges in Chicago and Toronto given that there are many location-related variations to consider. In terms of four-year college attendance, the results for Toronto suggest that Black males in Toronto are less likely to attend. This finding seems contrary to what might be expected at first glance, given the negative media discourse around Chicago and issues of racial segregation. While there are far more Black males in Chicago than Toronto, our results suggest that in terms of odds of going to four-year colleges, those located in Chicago stood a better chance of going in 2006 than those in Toronto. However, the demographics of cities (when compared to school board demographics) are so much more different in Chicago than in Toronto. The large proportion of Blacks and Latinos that attend CPS may well have triggered additional efforts to facilitate or enable their postsecondary transitions. One example is a previously piloted college coach program, which emphasized helping Black and Latino students to develop their social capital and more effective access to information regarding postsecondary education options; this program was found to be far more helpful to Latino students than Black students (Stephan, 2013). Similar programs for disadvantaged youth were not part of school board initiatives in Toronto at the same time (2006).
It is also a counterintuitive finding for Toronto that Black males are less likely to go to four-year colleges – even though the cost of public education in Canada is significantly less than in the USA (as discussed earlier). However, Belley et al. (2014) found that, in fact, the financial aid packages in the US (for public universities) tend to be more generous to low-income families, often making it more affordable for low-income youth to attend PSE in the US than it is for their counterparts in Canada.
Some of the differences observed between the two schools boards may also relate to school choice. A large proportion of White students eligible for CPS do not attend CPS, but rather choose to enroll in private schools. This is not the case in Toronto, where White students are still the largest population. According to Smoler (2015), the population of Chicago charter schools (funded entirely by CPS) is 60% African American, 35% Latino, and almost entirely low-income. Many Chicago charter schools place a heavy emphasis on college-going and tout their 100% college acceptance rates (Evans, 2015; Finley, 2016). In sharp contrast, Toronto has only one Africentric primary school – and the creation of this primary school has continued to be hotly debated in the media since 2009 (Gulson and Web, 2013). A second Africentric school (high school) was opened in 2012, but has had continued low enrollments. Overall, the attendees of the Africentric schools in Toronto represent a very small number of Blacks in Toronto.
The resistance to Africentric schools in Toronto (and Canada in general) is arguably related to the absence of “race” from the national discourse. Even the measurement of race in surveys and the collection of race data in schools are considered politically problematic. Our Toronto data set is one of the only longitudinal data sources in Canada that contains self-reported race. Other major urban centers simply do not collect data on race, sometimes using “home language” as a proxy, as is the practice with the British Columbia Ministry of Education. The resistance to measure race can be seen at the highest level of government data collection: Statistics Canada and their sustained and committed use of “visible minority status” (discussed above). The use of visible minority status may well constitute a “denial of race”, and “race blindness” in the Canadian policy landscape may help explain the low transitions rates of Black males to PSE in Toronto.
Streaming or tracking practices are also another major difference between the Toronto and Chicago contexts. Streaming, although not officially recognized in TDSB policy, is practiced extensively in the Toronto system as signified by the availability of “academic” and “applied” course offerings. The former are required for admittance to four-year colleges, while the latter are not accepted by four-year colleges. Black males and students with special education needs are disproportionately enrolled in applied courses (James, 2012). In contrast, streaming is not practiced (officially or unofficially) in the CPS, with the “de-tracking” reforms initiated in 1997 (Nomi and Allensworth, 2014). However, the differences between students identified with special education needs in Toronto and Chicago transitioning to two-year colleges can likely be explained by the use of streaming practices in Ontario. Two-year colleges in Ontario accept “applied” courses and generally have outreach programs targeted at students with special education needs. This difference in structure and practice is an important explanation of why previous research has found Blacks and students with special education needs having greater odds of attending two-year colleges in Ontario (Robson et al, 2014). In the present study, the difference between Chicago and Toronto with regard to the association between having a special education and two-year college can likely be explained by the different tracking practices described above where Toronto students identified with special education needs are more likely to be placed in “applied” courses in high school, thereby limiting their postsecondary choices. In contrast, most students with special education needs are “mainstreamed” in Chicago and may receive extra assistance in the classroom or resource room for fixed hours per week (Cohen, 2007).
Finally, the important role of HBCU in the United States cannot be overlooked. Such institutions have been serving Black students since segregation prevented their admission to White-majority institutions and perhaps provide greater opportunities or fewer obstacles for black students wishing to pursue postsecondary. No such similar postsecondary institutions exist in Canada, which may explain the differences we observed between postsecondary uptake of Blacks in Chicago versus Toronto. While none of the original 107 HBCU exist in Illinois, Chicago State University has served a majority Black student population for decades. Because the majority of postsecondary institutions in Canada do not collect race data – a situation that is slowly changing due to pressures being placed on administrators from researchers and policymakers – it is not possible to know the proportions of Black students attending any specific Ontario institution, but, suffice it to say, there are no Black majority institutions.
Conclusions and recommendations
Differences found in our analyses are clearly attributable to contextual specificities unique to Toronto and Chicago. This finding raises an important question: what sorts of interventions can be introduced that will help mitigate the impact of circumstances that limit the life chances of young people living in different cities? We argue that a one-size-fits-all policy approach is unlikely to be of use in addressing the intersectional inequities we observed in PSE confirmations. Rather, we require policies (and strategies) that recognize the intersection of gender, sex, and class. In particular, it appears as though targeted policies aimed at Black males in Toronto should be a core concern for policymakers within the TDSB and the Ministry of Education. Our findings highlight that the investigation of postsecondary transitions in Canada need to be undertaken with an intersectional lens that permits the examination of race and socioeconomic status, which requires a commitment by policymakers to collect these types of data outside of Toronto. The fact that such findings are only available in Toronto does not mean the problem does not exist outside of Toronto; it simply means only the TDSB has collected the data, unlike myriad other educational jurisdictions.
In particular, “de-streaming” the curriculum that disproportionately disadvantages racialized students is a first place to start. Calls to action have been demanded by parents and education advocacy groups in Toronto (People for Education, 2015) who have observed that the course choices students make in the 8th Grade can sharply restrict their educational choices in later life. Some pilot initiatives in Toronto undertaken by a handful of school principals to eliminate streamed courses from their offerings, and ostensibly directing students to take academic courses, have been deemed successful (Rushowy, 2015). Such changes were made once principals became aware of the racialized nature of streaming and the curtailed opportunities available to those students who largely selected applied courses. The de-tracking movement occurred decades ago in Chicago and beyond – there is considerable evidence that curtailing these practices in Toronto can reduce the limited life chances such streams permit upon graduation.
In closing, by employing single-city or school board studies of student achievement, it is possible to determine how student characteristics increase or decrease the likelihood of pursuing PSE. It is also the case that cross-city analyses demonstrate that the situation is not the same for everyone, everywhere. It has been the case for some time that the lower achievement of Blacks has been observed in public school data from many cities, including Toronto. It is not until comparative analyses allow researchers to place the findings alongside those from a similar-sized city that we can argue that this does not have to be the status quo.
Footnotes
Declaration of conflicting interests
The author(s) declared no potential conflicts of interest with respect to the research, authorship, and/or publication of this article.
Funding
The author(s) disclosed receipt of the following financial support for the research, authorship, and/or publication of this article: This research was funded by the Social Sciences and Humanities Research Council of Canada grant number 435 2014 1274.